
Forex analysis review |
- USD/CHF approaching resistance, potential drop!
- AUD/USD testing support, potential break out!
- USD/JPY approaching resistance, possible drop!
- #USDX vs EUR / USD h4 vs GBP / USD h4. A comprehensive analysis of movement options from July 9, 2019. Analysis of APLs &
- Stability in the global oil market despite tensions in the Middle East
- The dollar has maintained momentum, the Fed is likely to postpone the rate cut
- EUR/USD: Fed will run the show this week
- GBP/USD. July 8. Results of the day. Pound sterling is waiting for July 23 and October 31
- EUR/USD. July 8. Results of the day. Does the Fed need to lower the rate?
- USD/CAD. Canadian dollar worthily resists US dollar hegemony
- Gold 07.08.2019 - Rejection of the critical resistance
- GBP/USD 07.08.2019 - Bullish divergence at the critical support
- Bitcoin analysis for July 8, 2019: nearing $12,000 for breakout or rejection?
- July 8, 2019 : EUR/USD Intraday technical analysis and trade recommendations.
- BTC 07.08.2019 - Sell zone at the price of $12.000
- July 8, 2019 : GBP/USD Intraday technical analysis and trade recommendations.
- Technical analysis of AUD/USD for July 08, 2019
- EURUSD: Minimum industrial production growth in Germany is not a reason for joy
- GBP/USD: plan for the American session on July 8. Buyers of the pound are trying to form new support for the trend reversal
- EUR/USD: plan for the American session on July 8. Bears are trying to continue the fall of the euro
- Technical analysis of EURUSD for July 8
- Gold continues to trade inside trading range, we remain neutral
- Technical analysis of NZD/USD for July 08, 2019
- And now, it's back (weekly review of EUR / USD and GBP / USD on 07/08/2019)
- Yen traps opponents
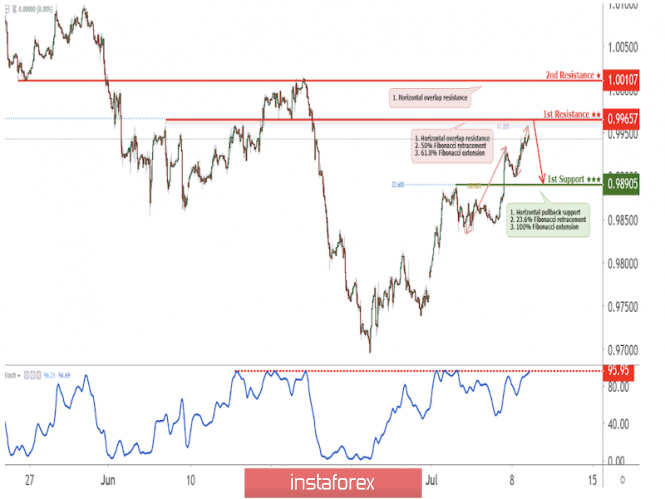
| USD/CHF approaching resistance, potential drop! Posted: 08 Jul 2019 07:52 PM PDT
USDCHF is approaching our first resistance where we might be seeing a drop below this level to our first support level. Entry: 0.9965 Why it's good : horizontal overlap resistance, 50% Fibonacci retracement, 61.8% Fibonacci extension Stop Loss : 1.0010 Why it's good : horizontal overlap resistance Take Profit : 0.9890 Why it's good: Horizontal pullback support, 100% Fibonacci extension, 23.6% Fibonacci retracement
 |
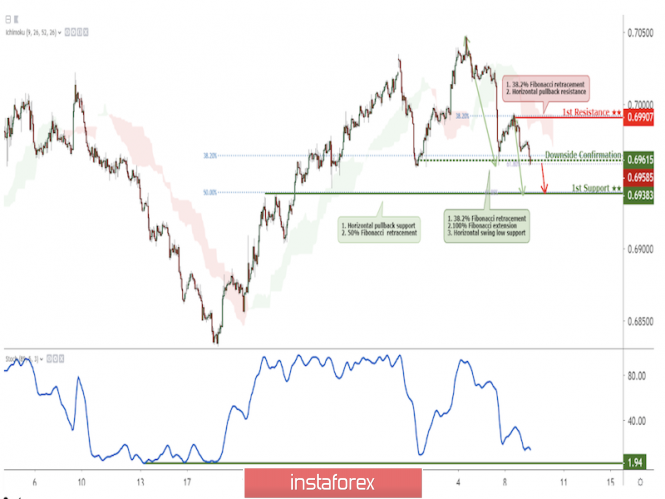
| AUD/USD testing support, potential break out! Posted: 08 Jul 2019 07:49 PM PDT
AUDUSD is testing its support at 0.6961 where if broken, will give us a confirmation of a further move down. . Entry: 0.6961 Why it's good : 38.2% Fibonacci retracement, 61.8% Fibonacci extension, horizontal swing low support Stop Loss : 0.6990 Why it's good : 38.2% Fibonacci retracement, horizontal swing high resistance Take Profit : 0.6938 Why it's good: 61.8% Fibonacci extension, 50% Fibonacci retracement, horizontal pullback resistance
 |
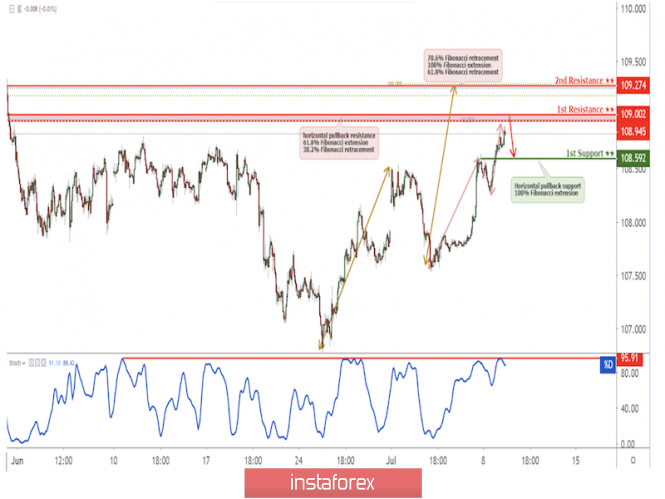
| USD/JPY approaching resistance, possible drop! Posted: 08 Jul 2019 07:47 PM PDT
Price is reaching resistance at 109.002, a drop could occur! Entry :109.002 Why it's good : horizontal pullback resistance 61.8% Fibonacci extension 38.2% Fibonacci retracement Take Profit : 108.592 Why it's good : Horizontal pullback support
 |
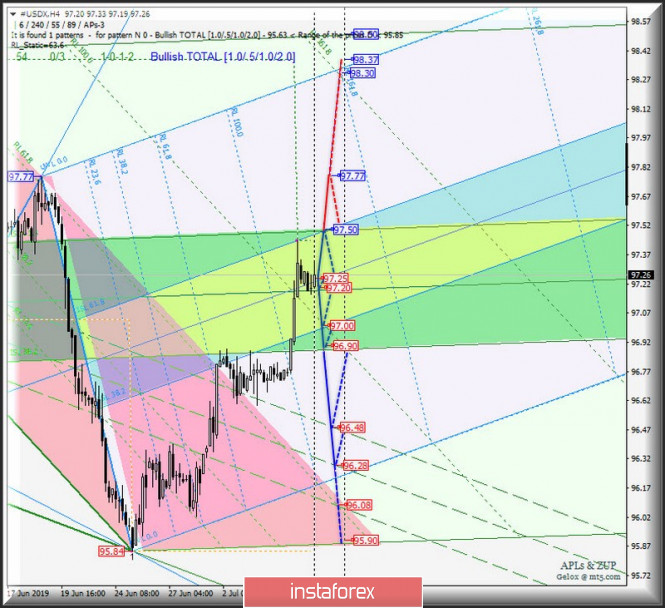
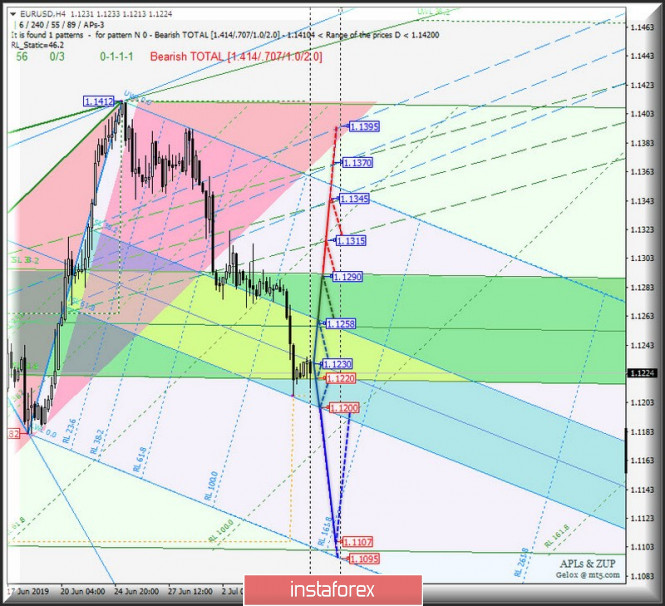
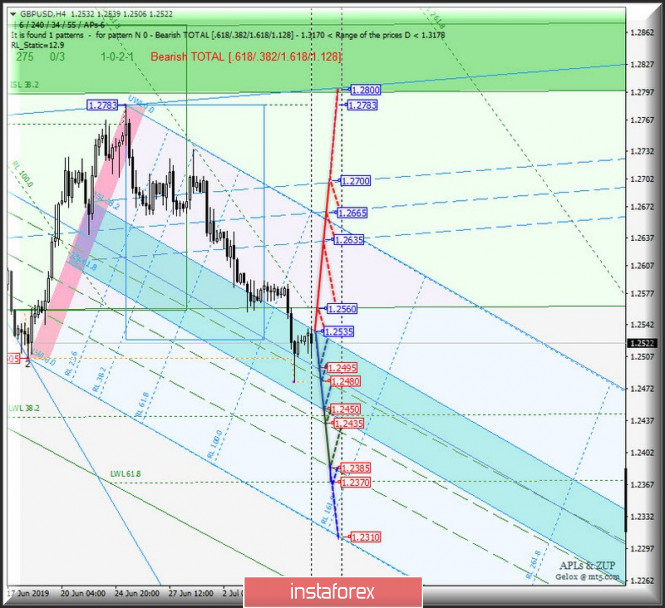
| Posted: 08 Jul 2019 06:44 PM PDT #USDX vs EUR / USD h4 vs GBP / USD H4 are in uncertainty, i.e. are within their equilibrium zones, respectively, the further development of the movement of the mentioned instruments from July 9, 2019 will be determined by the direction of the breakdown of these zones. A comprehensive analysis is made below. Minuette operating scale (H4) ____________________ The US dollar Index From July 09, 2019, the dollar index #USDX will continue to develop its movement depending on the development and direction of the breakdown of the boundaries of the equilibrium zone (97.50 - 97.25 - 97.00) of the Minuette operational scale. The options for this movement are shown in the animation graph. The breakdown of the support level of 97.00 (lower boundary of the ISL38.2 equilibrium zone of the Minuette operational scale fork) — a variant of the development of the downward movement of the dollar index to the targets — lower boundary ISL38.2 (96.90) Minuette operational scale fork — 1/2 Median Line channel Minuette (96.48 - 96.28 - 96.08). In the case of the breakdown of the upper boundary of ISL61.8 (resistance level of 97.50) of the Minuette operating scale, it will be possible to continue the upward movement of #USDX to the local maximum of 97.77 with the prospect of reaching the final FSL Minuette line (98.30).
____________________ Euro vs US Dollar From July 9, 2019, the movement of the single European currency EUR / USD will also be due to the development and direction of the breakdown of the equilibrium zone (1.1258 - 1.1230 - 1.1200) of the Minuette operational scale. Look at the animation chart for the details of this movement. The breakdown of the upper boundary of the ISL38.2 (resistance level of 1.1258) of the equilibrium zone of the Minuette operational scale fork will make current development of the movement of the single European currency to the upper boundary of the ISL38.2 (1.1290) equilibrium zone of the Minuette operational scale fork, and during the breakdown, it can be continued to the boundaries of the 1/2 Median Line channel Minuette (1.1315 - 1.1345 - 1.1370). In the case of the breakdown of the lower boundary of ISL61.8 (support level of 1.1200) of the equilibrium zone of the Minuette operational scale fork, the downward movement of EUR / USD will continue to the final FSL Minuette line (1.1107). The details of the EUR / USD movement options are shown in the animated graphic.
____________________ Great Britain Pound vs US Dollar Her Majesty's currency GBP / USD continues to remain in the equilibrium zone (1.2535 - 1.2495 - 1.2450) of the Minuette operating scale, and accordingly, as further, from July 9, 2019, the movement of this currency instrument will develop and will be determined by the direction of the breakdown of the levels above. Options are shown in the animated graphic. The breakdown of the upper boundary of ISL38.2 (resistance level of 1.2535) of the equilibrium zone of the Minuette operational scale fork will determine that further upward movement of Her Majesty's currency which will continue to the initial SSL line (1.2560) of the Minuette operational scale, and during the breakdown thereof, it will move further to the boundaries of the 1 / 2 Median Line channel Minuette (1.2635 - 1.2665 - 1.2700). The breakdown of the lower boundary of ISL61.8 (support level of 1.2450) of the equilibrium zone of the Minuette operational scale fork will make it relevant to continue the development of the downward movement of GBP / USD to the targets - 1/2 Median Line Minuette (1.2435) - the lower boundary of the 1/2 Median Line channel Minuette (1.2385) - warning line LWL61.8 (1.2370) of the Minuette operating scale fork. The details of the GBP / USD movement are presented in the animated graphic.
____________________ The review was compiled without taking into account of the news background. The opening of trading sessions of the main financial centers does not serve as a guide to action (placing orders "sell" or "buy"). The formula for calculating the dollar index is USDX = 50.14348112 * USDEUR0.576 * USDJPY0.136 * USDGBP0.119 * USDCAD0.091 * USDSEK0.042 * USDCHF0.036. where power ratios correspond to the weights of currencies in the basket: Euro - 57.6% ; Yen - 13.6%; Pound sterling - 11.9% ; Canadian dollar - 9.1%; Swedish krona - 4.2%; Swiss franc - 3.6%. The first coefficient in the formula gives the index value to 100 on the starting date - March 1973, when the main currencies began to be freely quoted relative to each other. The material has been provided by InstaForex Company - www.instaforex.com |
| Stability in the global oil market despite tensions in the Middle East Posted: 08 Jul 2019 05:35 PM PDT Oil prices have stabilized as Iran's hysteria around the nuclear program has been restrained by the more serious problems of global economic growth and, therefore, the demand for oil. Futures for the supply of Brent crude oil traded at 64.22 dollars per barrel. American WTI - 57.49 dollars per barrel. Iran threatened to resume uranium enrichment on Monday, undermining the 2015 nuclear agreement, which Washington refused. Trump imposed sanctions on Iran, which then agreed to limit its nuclear program under an agreement with leading world powers. On Sunday, Trump made another warning to Iran. "They better be careful," said the US leader. Nevertheless, the escalation of the conflict could not give impetus to the growth of the value of "black gold". Oil prices are still under pressure from concerns about demand. "The fact that the market responds so poorly to the tense situation in the Middle East is a reflection of a very well-secured market as a whole," noted SEB. The trade war between the United States and China overshadowed the prospects for global economic growth and, accordingly, the demand for oil. The growth rate of the global economy remains the focus of the entire market. The material has been provided by InstaForex Company - www.instaforex.com |
| The dollar has maintained momentum, the Fed is likely to postpone the rate cut Posted: 08 Jul 2019 05:22 PM PDT The dollar has confidently started a new week and keeps proximity near three-week highs, maintaining the momentum received after the release of strong data on employment in the US last week. A positive report may delay a sharp decline in the interest rate of the Fed. But the Turkish lira collapsed after Turkish President Recep Erdogan dismissed the head of the central bank, which caused yet another concern about the independence of the regulator. High US job growth is likely to deprive the Fed of a rate cut in late July, although weak wage growth and other data showing that the world's largest economy is losing momentum means that the Fed can still do so before the end of the year . That is why the dollar will continue to be traded on a more sustainable basis in the short term, given that the likelihood of a rate cut has decreased. The current recovery of the dollar follows a period of weakness, and the greenback has every chance to win. The euro, which fell to $1,1208 on Friday, was trading at $1,1227, unchanged during the day. The single currency is under pressure from the strengthening of the dollar and data on the weakness of the German industrial sector. Currently, traders are focused on the speech of Fed Chairman Jerome Powell before Congress, which will be held on Wednesday, as well as on data on inflation in the United States. The British pound reached a six-month low and is trading below $1.25 after weak economic data and rising expectations that the Bank of England will lower interest rates in 2020. The Turkish lira dropped to 5.8245 dollars, the lowest rate in two weeks. "Some naive market participants may still hope that the new governor of the central bank of Turkey will be independent and, at least, will not immediately lower interest rates. This may be the case, but it does not change the fact that a medium-term reasonable monetary policy in Turkey is not possible," analysts at Commerzbank say. The material has been provided by InstaForex Company - www.instaforex.com |
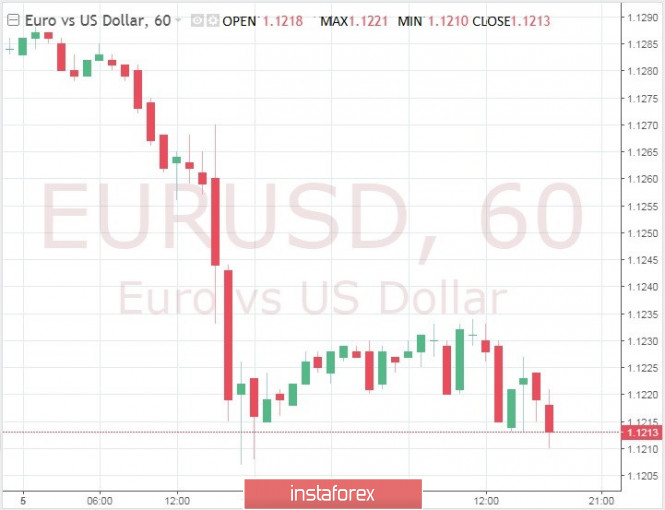
| EUR/USD: Fed will run the show this week Posted: 08 Jul 2019 05:07 PM PDT At the end of last week, the greenback rose sharply in price against the background of the release of a strong report on the US labor market in June. The USD index rose above the level of 97 points, reaching its highest levels in the last three weeks. At the same time, the EUR/USD pair slipped to the area of 1.1220. This week, traders will focus on the speech of US Federal Reserve Chairman Jerome Powell in Congress, as well as the publication of the minutes from the June meetings of the Fed and the ECB. The main idea in the market is still the question of the further monetary course of the two leading central banks. At the end of the last FOMC meeting, J. Powell said that interest rates would remain unchanged for the time being. At the same time, he hinted that if foreign trade conflicts continue to restrain economic growth in the country, the regulator will have to soften its monetary policy. Prior to the publication last Friday of a strong report on the US labor market, which exceeded forecasts for the number of new jobs (NFP), many economists believed that at the July meeting the Fed would reduce rates by at least 25 basis points. However, NFP grew more than 3 times. It turns out that the US economy is not so bad. The question is, why then should the US central bank pursue a policy of easing and giving away cheap money? Investors will try to hear the answer to this question from the Fed Chairman in the coming days, as well as see the minutes of the June FOMC meeting, which will be published this Wednesday. The June reports on producer and consumer prices in the US, which will be released this week, can also help clarify the situation for investors. If the price pressure continues to decline, then expectations about the rate cuts by the Fed will increase. It is possible that the regulator may implement a one-time reduction in rates without plans to further mitigate the policy. However, we will not know what decision the FOMC members will take until the next meeting, which will be held in late July. "Convincing labor market data may not be enough to force the Fed to change its mind about cutting rates after the meeting in July. However, recent employment data may allow the regulator to take a short pause. Some members of the FOMC may vote at the next meeting for keeping rates unchanged," said Wells Fargo currency strategist Brandon McKenna. On Thursday, the ECB will release its report from the June monetary policy meeting. From the European regulator, the market is waiting for additional measures to stimulate the EU economy. It is assumed that the easing of the monetary policy of the Fed may weaken the dollar, similar actions by the ECB - pull down the euro. It is unclear as to which direction the scales will swing to. Now the greenback continues to strengthen, including in relation to the euro, even despite a possible softening of the Fed's position, since the US economy still looks better than the competition. In addition, there are no threats to the US economy in the short term, and the White House's trade policy, despite criticism, has made investments in the country more attractive than investment abroad. The material has been provided by InstaForex Company - www.instaforex.com |
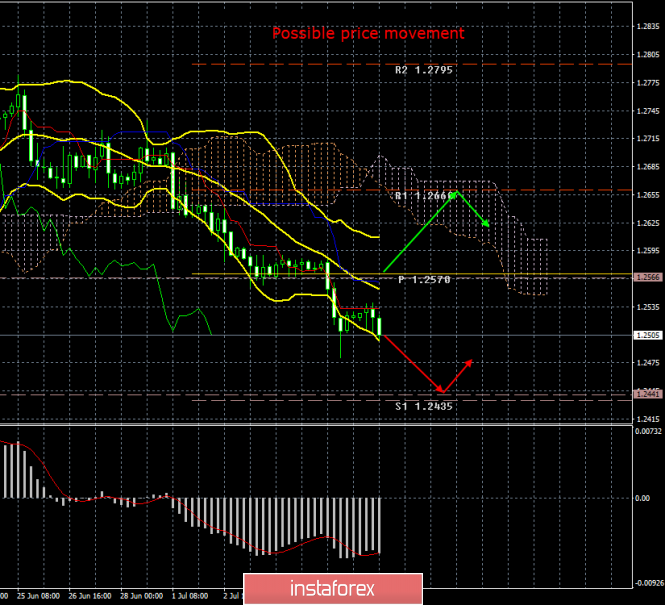
| GBP/USD. July 8. Results of the day. Pound sterling is waiting for July 23 and October 31 Posted: 08 Jul 2019 04:49 PM PDT 4-hour timeframe The amplitude of the last 5 days (high-low): 74p - 64p - 43p - 25p - 107p. Average amplitude for the last 5 days: 63p (56p). The British pound sterling collapsed on Friday, July 5, down, just like the euro, after the publication of US NonFarm Payrolls. However, it spent Monday in a fairly calm way, since no important news and reports on this day came from either the UK or the United States. Thus, it is possible to state a fact: a correction has begun, which so far has lateral status. Meanwhile, Boris Johnson intensely announced the hard scenario of Brexit, even though he has not yet become the country's prime minister. It is quite possible that this is a strategy of pressure on the European Union, which does not wish to conduct new negotiations on the terms of Brexit. It is unknown whether this card will play Johnson, but the pound in any case is not particularly responsive to all these campaign promises and events around Brexit, which is tightly put on pause. The nearest important date for the pound is in July 23. Not even for the pound, but for the UK, because on this day, in theory, the new leader of both the Conservatives and the country should be named. The date of the UK's exit from the European Union is on October 31st. A new release date. At this time, the impact of Brexit on the pound sterling is minimal. Trading recommendations: The pound/dollar currency pair has begun a side correction. Thus, traders are advised to wait until it is completed and re-sell the pound sterling with a target at the first support level of 1.2435. It will be possible to buy the British currency no earlier than when the pair consolidates above the critical line. In this case, the bulls will get a small chance to form an upward trend. In addition to the technical picture should also take into account the fundamental data and the time of their release. Explanation of the illustration: Ichimoku indicator: Tenkan-sen - the red line. Kijun-sen - the blue line. Senkou Span A - light brown dotted line. Senkou Span B - light purple dotted line. Chikou Span - green line. Bollinger Bands indicator: 3 yellow lines. MACD Indicator: Red line and histogram with white bars in the indicator window. The material has been provided by InstaForex Company - www.instaforex.com |
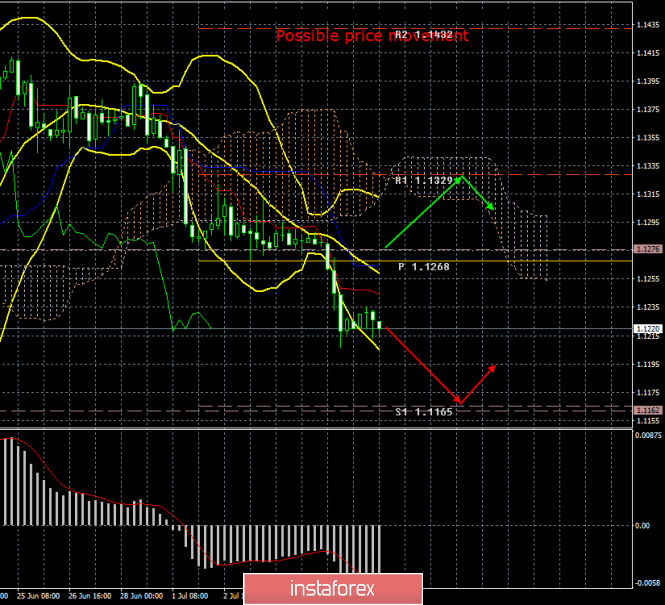
| EUR/USD. July 8. Results of the day. Does the Fed need to lower the rate? Posted: 08 Jul 2019 04:26 PM PDT 4-hour timeframe The amplitude of the last 5 days (high-low): 90p - 47p - 44p - 22p - 81p. Average amplitude for the last 5 days: 57p (49p). The first trading day of the current week, as expected, ends without sudden movements and with minimal volatility. No important macroeconomic reports were published today. Thus, traders had nothing to react to in a fundamental way. Tomorrow, Jerome Powell will give a speech in Congress, and in the meantime the markets are discussing possible actions by the Fed in the light of the strong Nonfarm Payrolls report in the United States. However, now the situation is turning against the US dollar. Just a week ago, we wrote that we should not rush to conclusions and expect the Fed to reduce the key rate in the coming months only on the basis of 3-4 weeks of weak macroeconomic statistics from overseas. Now we can say that we should not rush to conclusions because of one positive report from the United States. The best solution in this situation is to trade according to incoming information. Jerome Powell, of course, may shed light this week on the dark spot of the Fed's future actions. However, he is unlikely to do it. Like traders, the Fed responds to economic reports, to news about the external economy and US policy. Precisely, a decision will be made on easing monetary policy depending on the nature of this news. Thus, the euro remains in a downstream direction for the time being and there are no reasons for traders to buy the single currency. Perhaps they will appear tomorrow, but for this Powell should by all means hint at the willingness of the regulator to soften the monetary policy in July or September. We believe that his speech in Congress will be more neutral. Trading recommendations: The EUR/USD pair continues to move down. Thus, it is again recommended to buy the dollar with a target of 1.1165. Prerequisites for the purchase of the euro is not available now. It is recommended to buy the euro/dollar pair no earlier than when the price consolidates above the Kijun-sen line with the first target resistance level at 1.1329. However, bulls will need fundamental reasons for this. In addition to the technical picture should also take into account the fundamental data and the time of their release. Explanation of the illustration: Ichimoku indicator: Tenkan-sen - the red line. Kijun-sen - the blue line. Senkou Span A - light brown dotted line. Senkou Span B - light purple dotted line. Chikou Span - green line. Bollinger Bands indicator: 3 yellow lines. MACD Indicator: Red line and histogram with white bars in the indicator window. The material has been provided by InstaForex Company - www.instaforex.com |
| USD/CAD. Canadian dollar worthily resists US dollar hegemony Posted: 08 Jul 2019 03:43 PM PDT The Canadian dollar paired with the US currency is held within the 30th figure, despite the strengthening of the greenback throughout the market. Perhaps the USD/CAD pair is the only one among the main dollar pairs where the US dollar could not demonstrate clear dominance after the release of Friday's data. Although in the information space, American Nonfarms obscured Canadian labor market data, the loonie did not ignore them at all. Despite certain contradictory nuances, "Canadian Nonfarms" made it possible for USD/CAD traders to hope that the Bank of Canada will remain in a wait-and-see position, whose July meeting will take place on Wednesday. However, first things first. At first glance, data on the labor market in Canada are disappointing. Indeed, some components of the indicator were worse than expected, not reaching the predicted values. For example, analysts expected an increase in the number of people employed by 10 thousand, while real numbers showed negative dynamics: in the first month of summer, the number of jobs decreased by 2 thousand. The unemployment rate also increased, however, in this case, the result coincided with the expectations of analysts. Yes, and the increase was low - up to 5.5% from the previous value of 5.4%. But on the other hand, there are positive moments. Firstly, the number of full-time employees has significantly increased, while the part-time employment rate has decreased for the first time since April of this year. Established posts suggest higher salaries and social security, having a beneficial effect on Canadians' consumer activity and ultimately on inflation in the country. In addition, according to the June data, wage growth has accelerated. This fact can also positively affect inflationary dynamics. Here it is worth recalling that the growth rate of Canadian inflation increased significantly in May. Indicators came out in the "green zone", exceeding the forecast values. In particular, the consumer price index excluding energy and food prices rose to 2.1% - this is the strongest growth rate in the last 7 years. Positive dynamics was demonstrated by all structural components of the most important indicator for the Canadian regulator. It is worth noting that the real figures have exceeded even the wildest forecasts of the central bank - at the beginning of the year, the Bank of Canada raised its forecast for the growth of consumer inflation from 1.7% to 1.9%, which is below the above-mentioned mark of 2.1%. However, not all indicators go in such a positive way - there are also quite alarming signals. In particular, the indicator of retail sales in Canada shows rather sluggish growth (after a significant jump in the previous month), and GDP growth in Canada, according to analysts of TD Securities, is likely to slow down to 0.3% in monthly terms after a previous growth to 0.5% . Such contradictory dynamics does not allow USD/CAD bears to break through the psychologically-important mark of 1.30 and go into the region of 29-28 figures. In this context, the key event of the week will be the Bank of Canada meeting, which will be held on July 10. According to most experts, the Canadian regulator will maintain the status quo at this meeting and is unlikely to announce easing of monetary policy. Strong data on inflation growth, as well as relatively good labor market indicators allow the central bank to pause and not take hasty actions. At the last meeting, the Bank of Canada announced an optimistic assessment of current events, and the slowdown in the economy of Poloz called it a "temporary phenomenon." If at the July meeting he repeats a similar position, and Jerome Powell, in turn, does not strengthen the position of the American currency with his rhetoric, the USD/CAD pair will be able to enter the 29th figure - right up to the resistance level of 1.2950 (the lower border of the Kumo cloud on weekly chart). But if Stephen Poloz softens the tone of his rhetoric and focuses attention on the weaknesses of the Canadian economy, the loonie will return to the boundaries of the 32nd figure, that is, the Bollinger Bands midline on the daily chart. But in my opinion, the Bank of Canada would rather prefer the first scenario. The Canadian economy is in good shape, despite certain nuances of a negative nature, so members of the central bank do not need to brace traders if it softens monetary policy - especially before the July meeting of the US regulator, which, in turn, will decide the fate of the Fed interest rate. Thus, with high probability we can assume that the Canadian central bank will take a wait-and-see position, allowing the loonie to test the 29th figure. But here it should be noted that this scenario will be relevant only if the head of the Fed does not provoke another rally of the US currency. After the release of sufficiently strong US Nonfarms, the market began to doubt that the Fed would lower the rate at the July meeting. If Powell confirms these doubts in Congress, the US dollar will rise in price across the entire market, and the USD/CAD bears will have to postpone the assault on the 29th figure until better times. The material has been provided by InstaForex Company - www.instaforex.com |
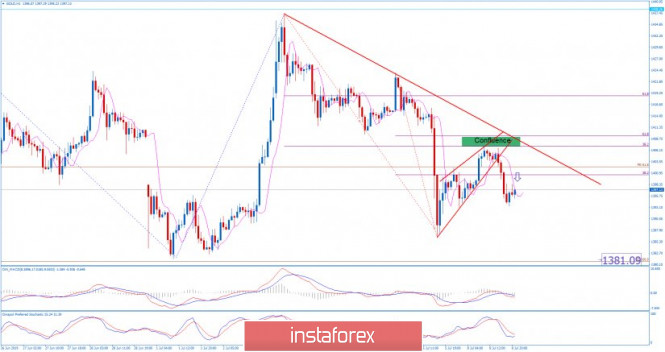
| Gold 07.08.2019 - Rejection of the critical resistance Posted: 08 Jul 2019 12:03 PM PDT Industry news: Prices remain well supported by fundamentals: the central bank of Poland said on Friday it had switched some $5 billion of its foreign reserves out of currency and into gold in June, adding to the list of active central bank buyers. However, short-term speculative buying appears to have eased off in the wake of the U.S. employment report. In a session bereft of major economic reports in the U.S., Japan's core machinery orders fell by the most in eight months - another a worrying sign that global trade tensions are hitting corporate investment. Trading recommendation:
Gold has been trading sideways in past 24 hours. Light volume today and down break of the rising wedge on the 1H time-frame is clues that we got today. Important resistance is set at the price of $1.407. Watch for selling opportunities. Green rectangle – Resistance 1 ($1.407) – Fibonacci confluence Red lines- Broken rising wedge Yellow rectangle – Support ($1.381) Both MACD and Stochastic did flip down, which is confirmation that sellers are present. As long as the Gold is trading below the $1.407, I would like to watch for selling opportunities on the rallies. Downward target is set at the price of $1.381. The potential break of the resistance at $1.407 may lead us to $1.422. The material has been provided by InstaForex Company - www.instaforex.com |
| GBP/USD 07.08.2019 - Bullish divergence at the critical support Posted: 08 Jul 2019 09:15 AM PDT Industry news: US YIELD CURVE INVERSION TALKING POINTS:
Trading recommendation:
GBP is testing the key support level at the price of 1.2500 (round number), which will be critical for further development for the GBP/USD. Watch closely the level of 1.2500 cause buyers may load their position from this point. Buying is preferable Green rectangle – Resistance 1 (1.2557) Green rectangle- Resistance 2 1.2590) Yellow rectangle – Important support (1.2500) Red lines – Bullish divergence All three oscillators are showing the bullish divertgence.RSI oscillator, Stochastic and MACD. As long as the GBP is trading below 1.2475, I would watch for buying opportunities with the targets at 1.2557 and 1.2590. I do expect reversion to the mean type of acrivity. I do expect that price back into 20 EMA (Median line of the Keltner Channel.)Only if there is clear breakout of the 1.2475, I would watch for potential selling opportunities but not now at the critical support 1.2500. The material has been provided by InstaForex Company - www.instaforex.com |
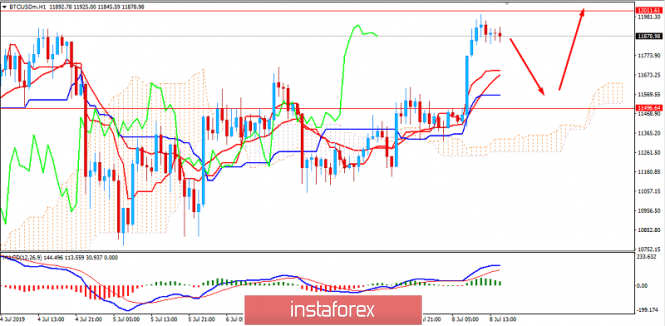
| Bitcoin analysis for July 8, 2019: nearing $12,000 for breakout or rejection? Posted: 08 Jul 2019 09:03 AM PDT Bitcoin has been quite impulsive with the recent bullish pressure after breaking above $11,500 area with a daily close. The price has been consolidating and correcting at the edge of $11,500 area for a while. This movement gained impulsive momentum after a strong break above had been observed. Bitcoin was able to gain almost 3% within a few minutes' time and held steady at $11,900, which is the highest level the cryptocurency has traded at for the past days. As per the current market formation, bitcoin has yet to break above $12,000, so the trend isn't 100% bullish. This is a good reason: $12,000 has acted as a minor resistance level over the past few weeks. One of the fastest rallies for Bitcoin was breaking $11,500 area. The the price held in this area for a particular amount of time and breaking above it washed away the bears residing at the edge. There are certain speculations that bitcoin could hit $14,000 by the mid of July but it is still quite indecisive as the price resides below $12,000 area with a daily close. As of the current scenario, the price has been quite indecisive with the past 3 hours of price action which is expected to lead to certain retrace towards $11,500 again before the price attempts to break above $12,000 area. As per current momentum, a break above $12,000 can turn out to be false whereas certain pullback lower would enhance the upcoming bullish move for the further upward thrust in the process to target $14,000 and later towards $15,000 in the coming days. TRADING LEVELS: SUPPORT – 11,000, 11,500 RESISTANCE – 12,000, 12,500, 13,000 BIAS – BULLISH MOMENTUM – VOLATILE
 |
| July 8, 2019 : EUR/USD Intraday technical analysis and trade recommendations. Posted: 08 Jul 2019 08:30 AM PDT
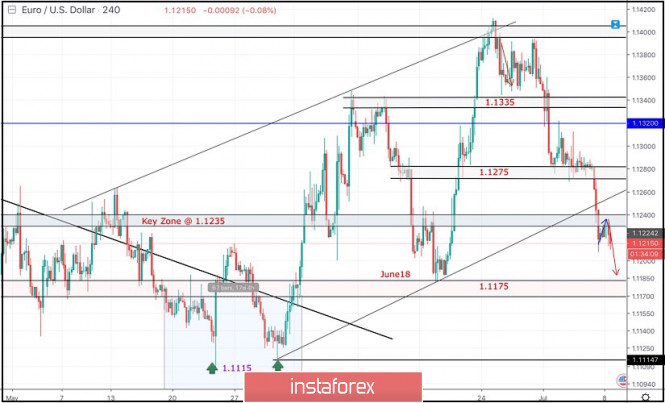
Since February 28, the EURUSD pair has been moving within the prvious downside channel with slight bearish tendency. Short-term outlook turned to become bearish towards 1.1175 (a previous weekly bottom which has been holding prices above for some time. On the highlighted period between (May 17th and June 5th), temporary bearish breakdown below 1.1175 was demonstrated on the chart. This allowed further bearish decline to occur towards 1.1115 where significant bullish recovery brought the EUR/USD pair back above 1.1175 which stands as a prominent DEMAND level until now. Initially, Temporary Bullish breakout above 1.1335 was demonstrated (suggesting a high probability bullish continuation pattern). However, the EURUSD pair has failed to maintain that bullish persistence above 1.1320 and 1.1275 (the depicted price levels/zones). This was followed by a deeper bearish pullback towards 1.1175 where significant bullish price action was demonstrated on June 18. The EURUSD looked overbought around 1.1400 facing a confluence of supply levels. Thus, a bearish pullback was initiated towards 1.1275 as expected in a previous article. Further Bearish decline below 1.1275 enhanced a deeper bearish decline towards 1.1235 (the lower limit of the newly-established bullish channel) which is failing to provide enough bullish support for the EURUSD. The current bearish breakdown below 1.1235 invites further bearish momentum to push towards 1.1175 where recent price action should be considered. Trade recommendations : For Intraday traders, a valid SELL entry was previously suggested at retesting of the broken key-zone around 1.1235. Initial Target levels to be located around 1.1200 and 1.1175. Bullish breakout above 1.1260 invalidates the mentioned SELL position. The material has been provided by InstaForex Company - www.instaforex.com |
| BTC 07.08.2019 - Sell zone at the price of $12.000 Posted: 08 Jul 2019 08:27 AM PDT Industry news: India's national police academy has launched a cryptocurrency course for high-ranking officers of the Indian Police Service. Among the objectives of the course are the functioning and legal aspects of cryptocurrencies, as well as investigations of cases involving digital coins. The Indian police continue to regularly uncover crypto-related schemes as the government deliberates on the regulatory framework for cryptocurrency. Trading recommendation:
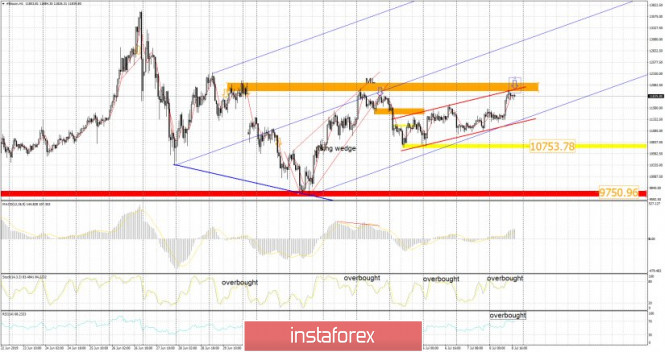
BTC did rally in past 24 hours and is now testing the key resistance at the price of $12.000 and also round number. Pay attention to the resistance at the price of $12.000 cause it is good sell zone up there. Orange rectangle – Resistance ($12.000) Yellow rectangle- Support 1 ($10.753) Red rectangle – Support 2 ($9.750) Red lines – Upward channel (upper line on test ) RSI oscillator and Stochastic are showing the potential overbought condition right on the critical resistance and I expect new selling wave. As long as the BTC is trading below $12.000, I would watch for selling opportunities on the rallies, level of $12.000 looks like a solid sell zone. Downward targets are set at the price of $10.753 and $9750.The material has been provided by InstaForex Company - www.instaforex.com |
| July 8, 2019 : GBP/USD Intraday technical analysis and trade recommendations. Posted: 08 Jul 2019 06:58 AM PDT
Since May 17, the previous downside movement within the depicted bearish channel came to a pause allowing the recent sideway consolidation range to be established between 1.2750 - 1.2550 with a prominent key-level around 1.2650. On June 4, temporary bullish consolidations above 1.2650 were demonstrated for a few trading sessions. However, the price level of 1.2750 (consolidation range upper limit) has prevented further bullish advancement. Moreover, early signs of bearish rejection have been manifested (Head & Shoulders reversal pattern with neckline located around 1.2650). A quick bearish pullback towards 1.2650 was expected shortly. Bearish breakdown below 1.2650 (reversal pattern neckline) confirmed the reversal pattern with bearish projection target located at 1.2550 and 1.2510. Short-term outlook remains under bearish pressure as long as the market keeps moving below 1.2650 (mid-range key-level and neckline of the reversal pattern). In general, the recent Bearish breakdown below 1.2570 - 1.2550 (the lower limit of the depicted consolidation range) confirms a trend reversal into bearish on the intermediate term. Immediate bearish decline was expected towards 1.2505 - 1.2490. Further bearish decline is expected to pursue towards 1.2444 (the lower limit of the current movement channel). On the other hand, any bullish pullback towards 1.2550-1.2570 should be considered as a valid SELL signal for Intraday traders. A bullish position can ONLY be considered if Bullish persistence above 1.2570 is re-achieved on the current H4 chart. Trade Recommendations: Intraday traders can have a valid SELL Entry anywhere around the lower limit of the broken consolidation range near (1.2550-1.2570). T/P levels to be located around 1.2490 and 1.2440. S/L should be placed above 1.2620. The material has been provided by InstaForex Company - www.instaforex.com |
| Technical analysis of AUD/USD for July 08, 2019 Posted: 08 Jul 2019 06:47 AM PDT The AUD/USD pair is set above strong support at the levels of 0.6876 and 0.6810. This support has been rejected four times confirming the uptrend. The major support is seen at the level of 0.6810, because the trend is still showing strength above it. Accordingly, the pair is still in the uptrend in the area of 0.6810 and 0.6876. The AUD/USD pair is trading in the bullish trend from the last support line of 0.6876 towards thae first resistance level of 0.6937 in order to test it. This is confirmed by the RSI indicator signaling that we are still in the bullish trending market. Now, the pair is likely to begin an ascending movement to the point of 0.6937 and further to the level of 0.7005. The level of 0.7005 will act as the major resistance and the double top is already set at the point of 0.7005. At the same time, if there is a breakout at the support level 0.6810, this scenario may be invalidated. The material has been provided by InstaForex Company - www.instaforex.com |
| EURUSD: Minimum industrial production growth in Germany is not a reason for joy Posted: 08 Jul 2019 06:18 AM PDT The European currency stopped its decline at the lows of last week, and it is possible that the pause will be delayed. However, the market is still on the side of the sellers of the euro, as after Friday's data on the US labor market, the probability of the Federal Reserve lowering interest rates has significantly weakened, which gives traders hope for the continued strengthening of the US dollar against a number of world currencies. Data on industrial production in Germany today attracted special attention of traders in the morning for a number of reasons. First, the problems in the industrial sector are growing stronger and stronger every day, and the further situation largely depends on trade conflicts, and secondly – these data were the most significant for today and could change the situation in the market in the short term, which, incidentally, did not happen. According to the report of the Federal Bureau of Statistics of Germany, industrial production in Germany in May this year increased, but only slightly due to a serious decline in the construction sector. Thus, the total volume of industrial production, which includes production in the construction sector, in the manufacturing and energy industries, in May this year increased by only 0.3% compared to April, which fully coincided with the forecasts of economists. It is worth noting that after a serious fall in April, in May, production stabilized slightly, which leaves a chance of resuming growth in the near future. However, as stated in the Ministry of Economy of Germany, the problems in the industrial economy will continue in the coming months, which is directly related to the sharp weakening of orders and deteriorating business conditions. As noted above, production in the construction sector decreased by 2.4% in May 2019 compared to the previous month, while the maximum growth was observed in the manufacturing sector by 0.9%. Compared to May 2018, industrial production decreased by 3.7%. As for the technical picture of the EURUSD pair, it remained unchanged compared to the morning forecast. At the moment, the large support is located in the area of 1.1205, the breakthrough of which will provide a further bearish trend by new sellers, whose goal will be the lows in the area of 1.1160 and 1.1110. If the bulls try to correct the situation, the upward correction will be limited by a large resistance in the area of 1.1260, where the upper limit of the downward channel passes. The material has been provided by InstaForex Company - www.instaforex.com |
| Posted: 08 Jul 2019 06:17 AM PDT To open long positions on GBP/USD, you need: Pound buyers today are trying to form a new lower boundary of the upward channel and break the downward trend. While trading above the support level of 1.2501, we can expect to maintain the momentum for correction, the target of which will be the resistance of 1.2543. The only consolidation above this range will lead to an update of the highs of 1.2585 and 1.2639, where I recommend taking the profit. If the pressure on the pound continues, the breakout of the range of 1.2501 will lead to an update of the lows of last week with the support test of 1.2471 and 1.2439, where you can open long positions immediately on the rebound. To open short positions on GBP/USD, you need: Bears will count on a good report on the US economy, and the breakout of the support of 1.2501 will only increase the pressure on the pound and lead to new lows in the area of 1.2471 and 1.2439, where I recommend taking the profits. In the scenario of buyers returning to the market, the formation of a false breakout in the area of 1.2543 will be a signal to open short positions. Otherwise, you can sell the pound on a rebound from the maximum of 1.2585. Indicator signals: Moving Averages Trading is below 30 and 50 moving averages, indicating a further decline in the pound. Bollinger Bands Volatility has fallen, and the breakdown of the lower limit of the indicator in the area of 1.2501 can lead to a new wave of decline in the pound.
Description of indicators
 |
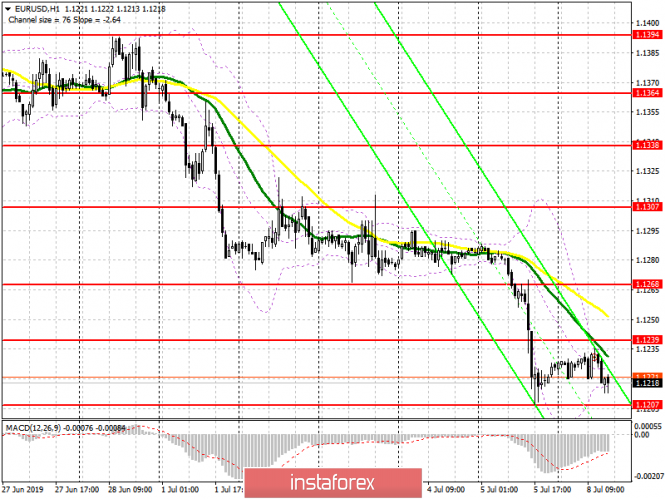
| EUR/USD: plan for the American session on July 8. Bears are trying to continue the fall of the euro Posted: 08 Jul 2019 06:17 AM PDT To open long positions on EURUSD, you need: Volatility in the pair is quite low after Friday's surge. In the second half of the day, buyers will still count on the formation of a false breakout near the low of 1.1207 with confirmation of the divergence on the MACD indicator. Only in this scenario, I recommend considering long positions in the euro with the main goal of breaking and securing above the resistance of 1.1239, where you can expect to update the maximum of 1.1268 and take profit on long positions. If the bears break below the support of 1.1207, after the data on the US economy, the output of which is scheduled for the second half of the day, then consider new purchases in EUR/USD is best to rebound from the lows of 1.1182 and 1.161. To open short positions on EURUSD, you need: Bears will try to break through today below the support of 1.1207, but it is necessary to take into account the probability of a divergence on the MACD indicator, which can limit the downward movement in the afternoon. Only good data on the US economy will allow us to gain a foothold below the low of 1.1207, which will lead the bears to the following goals in the area of 1.1182 and 1.161, where I recommend taking the profits. However, the best scenario for selling the euro will still be a false breakout in the resistance area of 1.1239. Indicator signals: Moving Averages Trading is below 30 and 50 moving averages, which indicates a possible continuation of the bearish market. Bollinger Bands Volatility has fallen, and the breakdown of the lower limit of the indicator in the area of 1.1215 could lead to a new wave of decline in the euro.
Description of indicators
 |
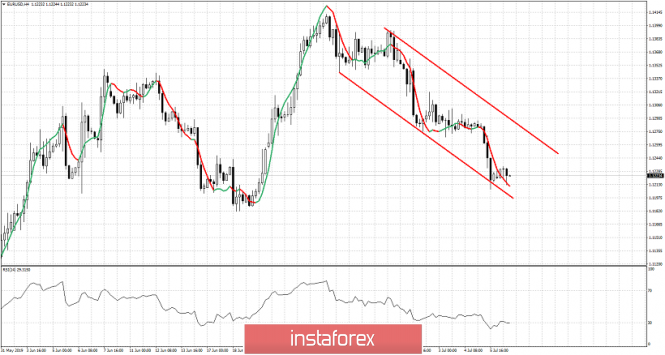
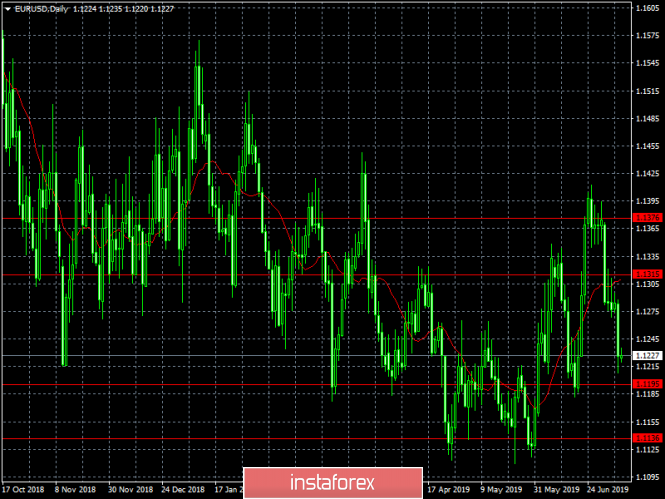
| Technical analysis of EURUSD for July 8 Posted: 08 Jul 2019 06:13 AM PDT EURUSD is trading inside bearish channel. Bulls need to break above 1.1285 to change short-term trend. Bears are in control of the short-term trend. Key support and previous low at 1.1180.
The RSI is at oversold levels in the 4 hour chart. Price is trading inside the red bearish channel and is making lower lows and lower highs. Only a break above 1.1280-1.1285 will change trend to bullish in the short-term. Next major support is at 1.1180. Bulls need to step in now in order to cancel any possibility of a move below 1.11. Bulls need to break above the red channel in order to remain in control of the trend. The material has been provided by InstaForex Company - www.instaforex.com |
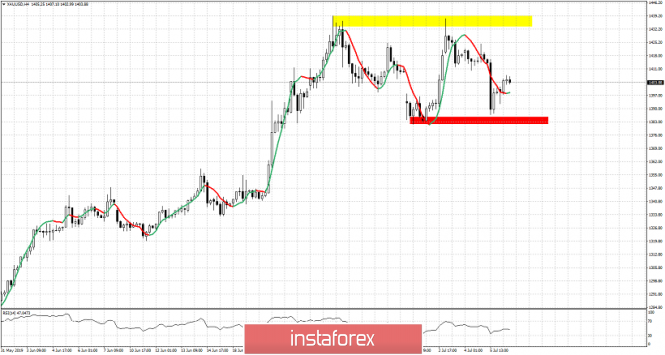
| Gold continues to trade inside trading range, we remain neutral Posted: 08 Jul 2019 06:07 AM PDT Gold price is trading just above $1,400 and the critical short-term support of $1,393. Price made a double top rejection and reversal last week at $1,439 and we are now faced with a sideways moving market.
Red rectangle - support area The two colored rectangles show the trading range Gold price is in. A break above $1,439 will open the way for a move towards $1,500-$1,525, while a break below support at $1,400-$1,393 will open the way for a move towards $1,335-$1,300. Until we see a break out of the trading range we remain neutral or position ourselves in favor of the closest level. So now that price is close to support, we prefer to be neutral or bullish with a stop reverse at $1,393. If price approaches $1,430-40 we will be neutral or bearish with stop reverse $1,440. The material has been provided by InstaForex Company - www.instaforex.com |
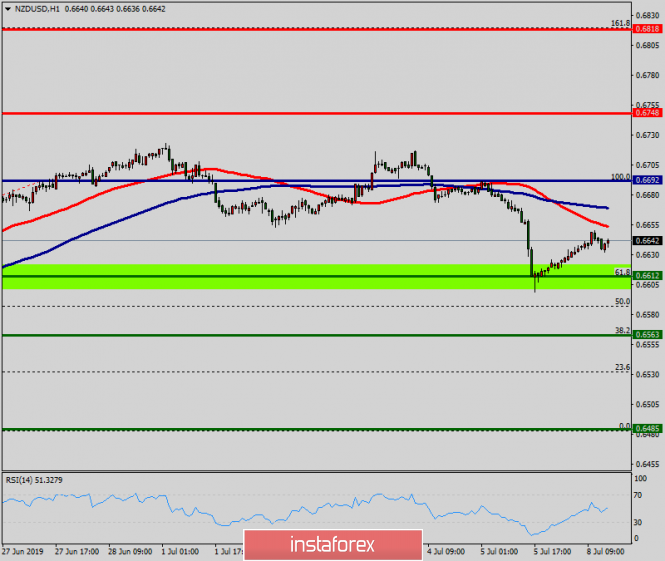
| Technical analysis of NZD/USD for July 08, 2019 Posted: 08 Jul 2019 05:58 AM PDT The NZD/USD pair broke the resistance that turned into strong support at the level of 0.6612 this week. The level of 0.9966 coincides with a golden ratio (61.8% of Fibonacci), which is expected to act as a major support on the H1 chart today. Consequently, the first support is set at the level of 0.6612. Moreover, the RSI starts signaling an upward trend, and the trend is still showing strength above the moving average (100). Hence, the market is indicating a bullish opportunity above the area of 0.6612. So, the market is likely to show signs of a bullish trend around 0.6612 - 0.6650. In other words, buy orders are recommended above the ratio of 61.8% Fibonacci (0.6612) with the first target at the level of 0.6748 in order to test last bullish wave in the same time frame. If the pair succeeds to pass through the level of 0.6748, the market will probably continue towards the next objective at 0.6818 . The daily strong support is seen at 0.6612. Thus, if a breakout happens at the support level of 0.6612/0.6600, then this scenario may be invalidated. The material has been provided by InstaForex Company - www.instaforex.com |
| And now, it's back (weekly review of EUR / USD and GBP / USD on 07/08/2019) Posted: 08 Jul 2019 03:53 AM PDT Over the previous week, the dollar has strengthened quite noticeably, but it only took Monday and Friday, and all the other days, the market tritely trampled on the spot. And if we talk about Friday, then everything is very simple, since it is connected with the publication of the report of the United States Department of Labor. Its content turned out to be somewhat different from what was expected, and rather even better than forecasts. On the one hand, the growth rate of the average hourly wage did not accelerate, but remained unchanged. But this is more likely due to the increase in the unemployment rate from 3.6% to 3.7%. After all, if the number of applicants for each job is growing, it makes no sense to raise wages. And in theory, this should have been enough for the dollar to begin actively taking positions. However, the unemployment rate itself has grown due to an increase in the share of the labor force with the total population of 62.8% to 62.9%, so the increase in unemployment is not caused by some problems in the economy, but by common demographic factors. For the most part, these include the students who have received their diplomas yesterday, and rushed in search of the work of their dreams. In other words, it is a seasonal factor. And the fact that nothing terrible happened, it indicates the number of new jobs outside of agriculture, of which as many as 224 thousand were created against 72 thousand in the previous month. While it was expected that only 160 thousand will be created, the recent graduates may quickly land on their first job.
On Monday, everything happened to be a bit complicated, as the growth of the dollar was due to a number of factors. Data from Europe, especially on the index of business activity in the manufacturing sector, which fell from 47.7 to 47.6, although they waited for growth to 47.8, has marked the beginning of a confident pace amongst the portrait of the late former presidents. In addition, the growth rate of consumer lending slowed from 3.4% to 3.3%, while waiting for the indicator to remain unchanged. Then the UK entered the business, whose index of business activity in the manufacturing sector fell from 49.4 not to 49.2, but to 48.0. But oil was added to the fire by data on the lending market, which showed that the volume of consumer lending amounted to 822 million pounds against 968 million pounds in the previous month. In addition, the number of approved mortgage applications was reduced from 66,045 to 65,409. At the end of the day, the final index of business activity in the manufacturing sector of the United States was published, which did not decrease from 50.5 to 50.1, but increased to 50.6.
However, do not think that this is all and limited, the market stood rooted to the spot. This was partly due to non-working Thursday in the United States on the celebration of Independence Day, as well as the expectations of the publication of the report of the Ministry of Labor. At the same time, there are a lot of interesting data published. Thus, the total sales of vehicles in the United States remained at the same level of 17.3 million, while they predicted a decline to 17.0 million. The business activity index in the service sector rose from 50.9 to 51.5, just as and composite index. And the total number of applications for unemployment benefits decreased by 16 thousand. Well, employment increased by 1.2 thousand against 41 thousand in the previous month. But it was not without negativity, as production orders decreased by 0.7%. But European data turned out to be much more modest, and although the business activity index in the service sector rose from 52.9 to 53.6, and the composite from 51.8 to 52.2, the growth rate of producer prices slowed down from 2.6% to 1 , 6%. Much worse, retail sales growth slowed from 1.8% to 1.3%. The last two indicators, or rather their dynamics, practically leave the European Central Bank with nothing more than an urgent search for ways to mitigate monetary policy. British statistics were also rather frustrating, because the business activity index in the construction sector dropped from 48.6 to 43.1, and in the service sector from 51.0 to 50.2. So, the dollar should have been clearly strengthening already, which he did, with a short break in the middle of the week. So Donald Trump, who in fact has already started his election campaign, can safely say that he is successfully "making America great again". The coming week will not be so rich in macroeconomic statistics, but the importance of the output data forces the hand to reach for popcorn. Perhaps the main event of the week will be the publication of data on inflation in the United States, which is expected to show its slowdown from 1.8% to 1.5%. And not only that, this alone will force investors to take heart drops, so literally right after that Jerome Powell will speak in Congress. And it is quite obvious that the fact that inflation is slowing down will not be left out of sight of congressmen, who, due to their inexperience and simplicity inherent in the natives of the common people, will begin to ask the head of the Federal Reserve System direct and not very convenient questions. Of course, it would be regarding the plans of the regulator in terms of the refinancing rate. Moreover, the day before this, the text of the minutes of the meeting of the Federal Commission on Open Market Operations will be published. And there is almost no doubt that it will reflect the gradual drift of sentiment of the members of the Board of the Federal Reserve System towards the reduction of the refinancing rate. So this alone should be enough for the dollar to start actively losing its positions. In addition, inventories at wholesale trade could rise by another 0.4%. But it won't do without good news, as the growth rates of producer prices can accelerate from 1.8% to 2.0%, and the number of open vacancies should increase by 30 thousand. However, inflation and the content of the minutes of the Federal commissions on open market operations will still be the main focus, and both of these factors are likely to have a negative impact on the dollar.
In Europe, almost no macroeconomic data are released, and it is only on Friday that there will be published data on industrial production. However, this does not promise anything good, since the industry, which is now decreasing by 0.4%, can increase its decline to 1.6%. But do not forget about the data on inflation in the United States, as well as the text of the minutes of the meeting of the Federal Commission on Open Market Operations, so that the single European currency, despite the growing decline in industrial production, can grow to 1.1300.
For the pound, the situation is somewhat brighter, since the decline in the industry, which now stands at 1.0%, can be similarly replaced by growth all with 1.0%. Therefore, the pound has every chance of growth to 1.2625.
 |
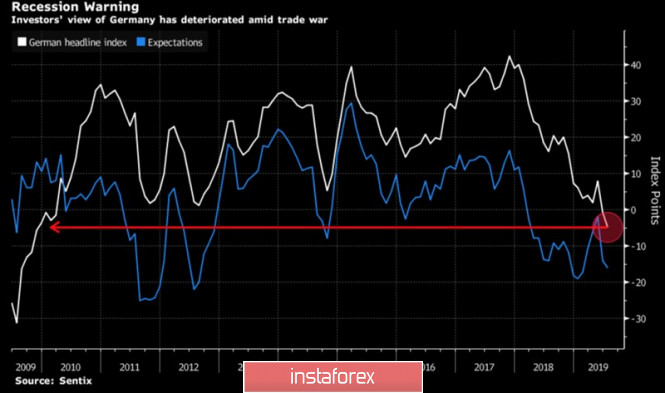
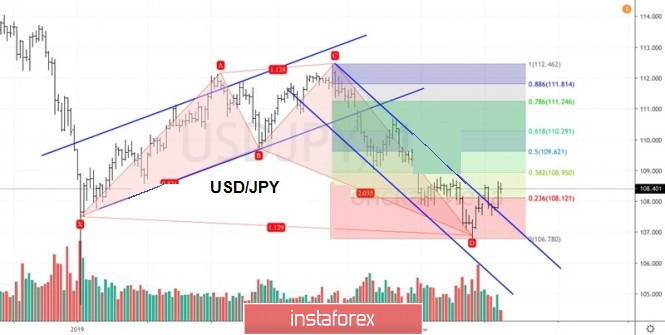
| Posted: 08 Jul 2019 03:53 AM PDT The Japanese yen was marked by one of the worst daily peaks in 2019 after a real blockbuster hit the US labor market. Even the most ardent optimist of 105 Reuters experts could not predict that employment outside the agricultural sector in June will grow by 224 thousand. Investors immediately began to buy dollars and sell treasury bonds, which returned the yield of 10-year securities above the psychologically important mark of 2% and hit the safe haven assets. However, the rise of USD / JPY at the end of the first week of July is unlikely to force the bears to throw out the white flag. According to a survey by Absolute Strategy Research, which was attended by over 200 financial managers which is managed by $ 4 trillion, the likelihood of a global recession in the next 12 months jumped to 45%. This is the highest figure since the beginning of the survey in 2014. The main problem is the policy of protection of Donald Trump, which has a negative impact on world trade and GDP. The German Sentix index of current economic conditions and expectations fell to its lowest level in nearly a decade, which indicates a high chance of a recession in Germany's economy-responsive trade wars. The main reason for increased sensitivity to a reduction in external demand is the high share of German exports in GDP. It is 47%, which is significantly higher than the US counterpart (12%). Dynamics of European and German Sentix According to the best forecaster for the EUR / JPY pair in the second quarter of Mizuho Bank, both the eurozone, led by Germany, and the euro are very weak and by the end of the year, the single European currency could drop by 4% to £ 117. Its fragile positions are masked against the background of a weaker US dollar, however, both the Fed and the ECB have much more opportunities to ease monetary policy than the Bank of Japan, which allows Mizuho Bank to be the bears in EUR / JPY and USD / JPY. The forecast for the latter by the end of 2019 is 103, and if the futures market turns out to be right, the Fed will resort to monetary expansion three times this year, then the dollar may even sink to £ 100. The publication of the minutes of the June meetings of the FOMC and the Governing Council of the ECB, along with the speech of Jerome Powell in front of both houses of Congress, make the yen the most interesting currency of the second week of July. From the chairman of the Fed, investors are waiting for an explanation. The question now is, what is more important - data or financial markets? The latter are still confident in the reduction of the federal funds rate at the next meeting of the regulator. If the central bank does not adhere to this, then it risks to step on the December rake. At the end of 2018, after Powell announced that the current level of interest was still far from neutral, the S & P 500 collapsed. Technically, on the daily USD / JPY chart, there is a transformation of the "Shark" pattern at 5-0. Breaking resistances to 108.95 (38.2% of the CD wave), 109.6 (50%) and 110.3 (61.8%) makes sense to use for the formation of short positions. USD / JPY daily graph  |















| You are subscribed to email updates from Forex analysis review. To stop receiving these emails, you may unsubscribe now. | Email delivery powered by Google |
| Google, 1600 Amphitheatre Parkway, Mountain View, CA 94043, United States | |

No comments:
Post a Comment