Forex analysis review |
- Fractal analysis of major currency pairs for August 2
- #USDX vs GBP / USD H4 vs EUR / USD H4. Comprehensive analysis of movement options from August 02, 2019. Analysis of APLs
- Which currency suffered the most from the Fed's decision?
- The dollar bet on the Fed and did not lose
- GBP/USD. Unexpected dollar weakness and hopeless pound prospects
- GBP/USD. August 1. Results of the day. The Bank of England left monetary policy unchanged
- EUR/USD. August 1. Results of the day. Contradictory reports on business activity provided minimal support for the euro
- What the Fed said on August 1 (Text)
- August 1, 2019 : GBP/USD Intraday technical analysis and trade recommendations.
- August 1, 2019 : EUR/USD Intraday technical analysis and trade recommendations.
- BTC 08.01.2019 - Potential downward continuation
- EUR/USD for August 01,2019 - Double bottom confirmed on the hourly chart
- Gold 08.01.2019 - Comletion of the downward correction ABC?
- GBP / USD plan for the American session on August 1. The Bank of England left rates unchanged and their approach to monetary
- EUR and GBP: The pound did not wait for the "lifeline" from the Bank of England. The reduction of the eurozone manufacturing
- EUR / USD plan for the US session on August 1. The data on the industrial area of the eurozone countries did not show anything
- Technical analysis of EUR/USD for August 01, 2019
- The Fed's rate cut is not the beginning of a long easing cycle, but a mid-cycle adjustment
- Forecast for Bitcoin and US dollar on August 1. The importance of bitcoin is highly overrated. Sooner or later, the "bubble"
- Forecast for EUR/USD and GBP/USD on August 1. Jerome Powell's rhetoric provoked another fall of the pound and eur
- Simplified wave analysis and forecast for GBP/USD and USD/JPY on August 1
- Trading plan for EURUSD on 08/01/2019
- Overview of GBP/USD on August 1. The forecast for the "Regression Channels". The UK starts to fall apart
- Overview of EUR/USD on August 1. The forecast for the "Regression Channels". Jerome Powell lowered the rate, Donald Trump
- Wave analysis of EUR / USD and GBP / USD for August 1. The US dollar continues to grow on the "joy" of Trump
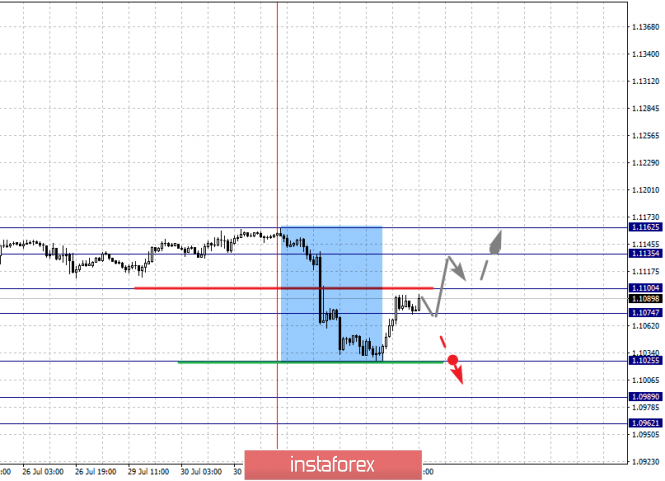
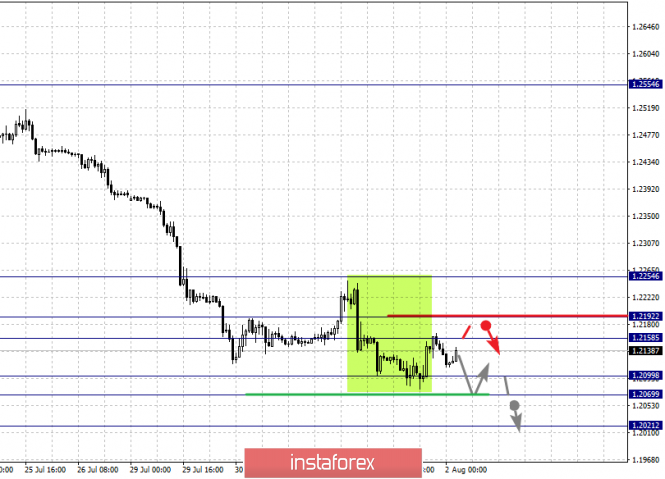
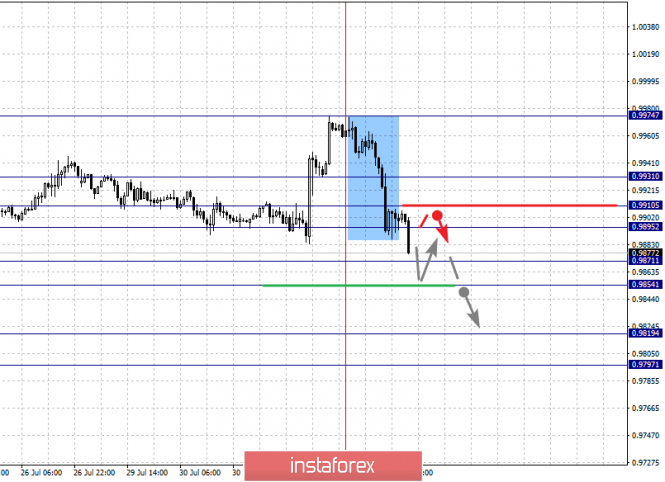
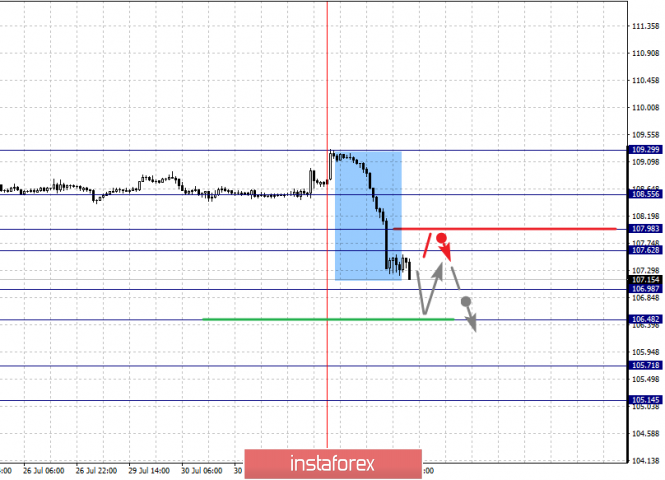
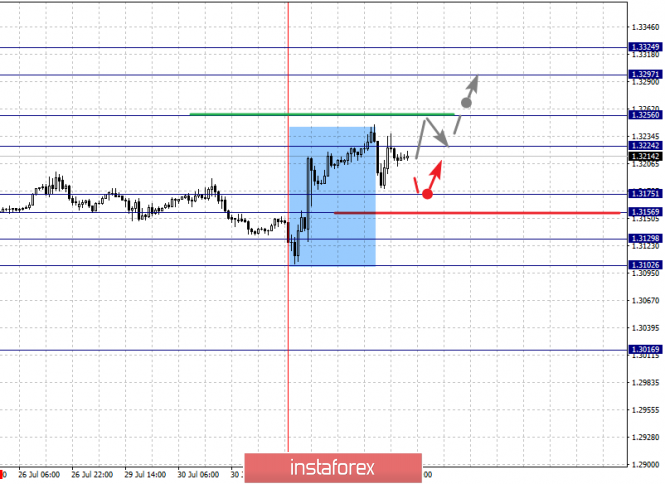
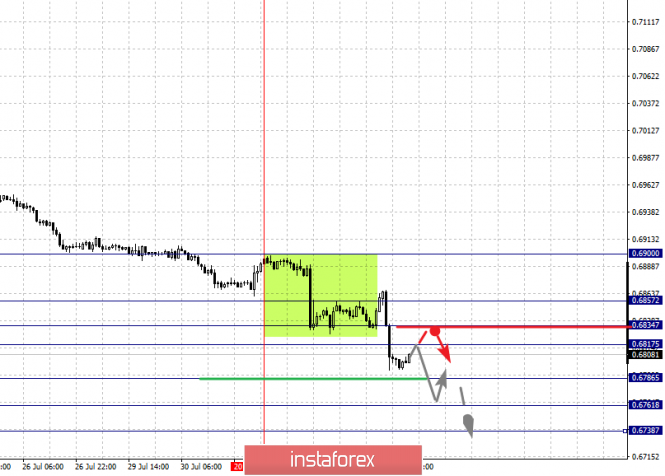
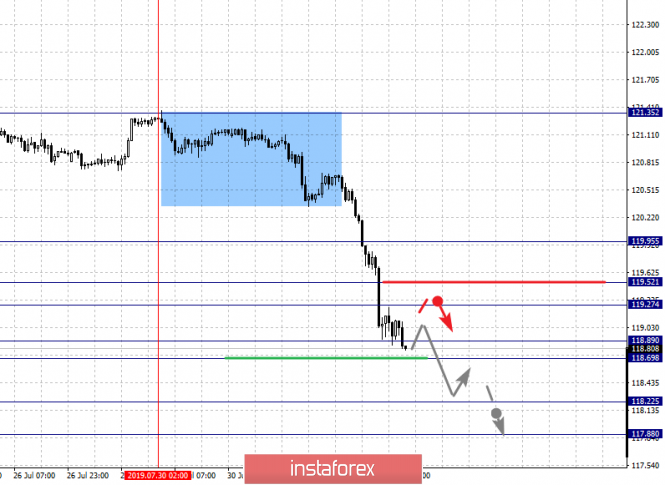
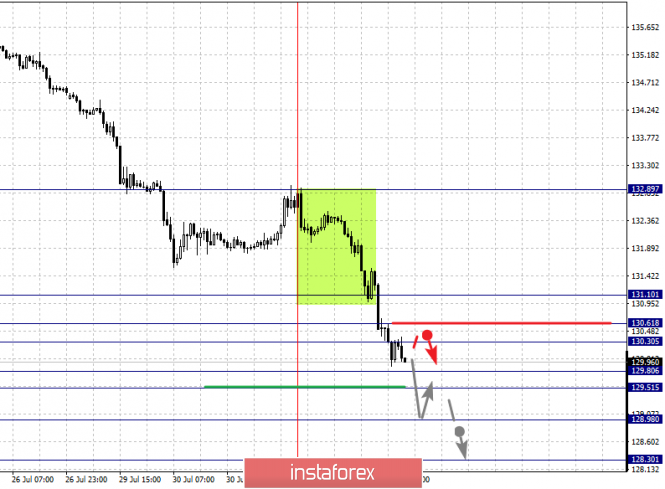
| Fractal analysis of major currency pairs for August 2 Posted: 01 Aug 2019 07:14 PM PDT Forecast for August 2 : Analytical review of H1-scale currency pairs: For the euro / dollar pair, the key levels on the H1 scale are: 1.1162, 1.1135, 1.1100, 1.1074, 1.1025, 1.0989 and 1.10962. Here, the price is in correction from the downward structure on July 31. The level of 1.1100 is a key support for the bottom. Its price passage will have to develop the ascending structure. Here, the first goal is 1.1135. As a potential value for the top, we consider the level 1.1162. Up to which, we expect registration of the expressed initial conditions. The continuation to the bottom is possibly after the breakdown of the level of 1.1025. Here, the first target is 1.0989. As a potential value, we consider the level of 1.0962, and near which, we expect consolidation. The main trend is the local downward structure of July 31, the stage of correction. Trading recommendations: Buy 1.1101 Take profit: 1.1135 Buy 1.1137 Take profit: 1.1160 Sell: 1.1025 Take profit: 1.0990 Sell: 1.0987 Take profit: 1.0962 For the pound / dollar pair, the key levels on the H1 scale are: 1.2254, 1.2192, 1.2158, 1.2099, 1.2069 and 1.2021. Here, we are following a downward cycle of July 19th. Short-term movement to the bottom is expected in the range of 1.2099 - 1.2069. The breakdown of the last value will allow us to expect movement to the potential target - 1.2021. From this level, we expect a departure to the correction. Short-term upward movement is possibly in the range of 1.2158 - 1.2192. The breakdown of the latter value will lead to the formation of the initial conditions for the top. Here, the potential target is 1.2254. The main trend is the downward cycle of July 19. Trading recommendations: Buy: 1.2158 Take profit: 1.2191 Buy: 1.2194 Take profit: 1.2254 Sell: 1.2099 Take profit: 1.2070 Sell: 1.2067 Take profit: 1.2025 For the dollar / franc pair, the key levels on the H1 scale are: 0.9931, 0.9910, 0.9895, 0.9871, 0.9854, 0.9819 and 0.9797. Here, the price forms the downward structure of August 1. Short-term downward movement is expected in the range of 0.9871 - 0.9854. The breakdown of the last value should be accompanied by a pronounced downward movement. Here, the goal is 0.9819. For the potential value for the bottom, we consider the level of 0.9797. After reaching which, we expect consolidation, as well as rollback to the top. Short-term upward movement is possibly in the range of 0.9895 - 0.9910. The breakdown of the latter value will lead to in-depth correction. Here, the target is 0.9931. This level is a key support for the downward structure of August 1. The main trend is the downward structure of August 1. Trading recommendations: Buy : 0.9895 Take profit: 0.9910 Buy : 0.9912 Take profit: 0.9930 Sell: 0.9870 Take profit: 0.9855 Sell: 0.9852 Take profit: 0.9820 For the dollar / yen pair, the key levels on the scale are : 108.55, 107.98, 107.62, 106.98, 106.48, 105.71 and 105.14. Here, the price canceled the development of an upward trend on the H1 scale and we are following the formation of a pronounced potential for the bottom of August 1. Short-term downward movement is expected in the range of 106.98 - 106.48. The breakdown of the last value should be accompanied by a pronounced downward movement. Here, the goal is 105.71. For the potential value for the bottom, we consider the level 105.14. Short-term upward movement is possibly in the range of 107.62 - 107.98. The breakdown of the latter value will lead to a prolonged correction. Here, the goal is 108.55. This level is a key support for the downward structure. The main trend: the formation of the downward structure of August 1. Trading recommendations: Buy: 107.62 Take profit: 107.96 Buy : 108.00 Take profit: 108.55 Sell: 106.96 Take profit: 106.50 Sell: 106.45 Take profit: 105.71 For the Canadian dollar / US dollar pair, the key levels on the H1 scale are: 1.3324, 1.3297, 1.3256, 1.3224, 1.3175, 1.3156, 1.3129 and 1.3102. Here, we continue to monitor the local ascending structure of July 31. The continuation of the movement to the top is expected after the breakdown of the level of 1.3224. Here, the goal is 1.3256. Consolidation is near this level. The breakdown of the level 1.3257 should be accompanied by a pronounced upward movement. Here, the target is 1.3297. We consider the level of 1.3324 to be a potential value for the top. Upon reaching this level, we expect consolidation as well as a rollback to the bottom. Short-term downward movement is possibly in the range of 1.3175 - 1.3156. The breakdown of the latter value will lead to a prolonged correction. Here, the goal is 1.3129. This level is a key support for the top. The main trend is the local ascending structure of July 31. Trading recommendations: Buy: 1.3225 Take profit: 1.3255 Buy : 1.3257 Take profit: 1.3295 Sell: 1.3175 Take profit: 1.3156 Sell: 1.3153 Take profit: 1.3130 For the pair of Australian dollar / US dollar, the key levels on the H1 scale are : 0.6857, 0.6834, 0.6817, 0.6786, 0.6761 and 0.6738. Here, the intraday price has issued a local downward structure for the subsequent movement to the bottom. The continuation of the downward trend is expected after the breakdown of the level of 0.6786. In this case, the target is 0.6761. For the potential value for the downward structure of July 31, we consider the level of 0.6738. Upon reaching which, we expect a rollback to the top. Short-term upward movement is possibly in the range of 0.6817 - 0.6834. The breakdown of the latter value will lead to in-depth correction. Here, the target is 0.6857. This level is a key support for the downward structure. The main trend is the downward structure of July 18, the local downward structure of July 31. Trading recommendations: Buy: 0.6817 Take profit: 0.6832 Buy: 0.6835 Take profit: 0.6855 Sell : 0.6788 Take profit : 0.6764 Sell: 0.6760 Take profit: 0.6738 For the euro / yen pair, the key levels on the H1 scale are: 119.95, 119.52, 119.27, 118.89, 118.69, 118.22 and 117.88. Here, we are following the development of the downward cycle of July 30th. The continuation of the movement to the bottom is expected after the passage of the price of the noise range 118.89 - 118.69. In this case, the first goal - 118.22. For the potential value for the downward structure, we consider the level of 117.88. After reaching which, we expect consolidation, as well as a rollback to the top. Short-term upward movement is possibly in the range of 119.27 - 119.52. The breakdown of the latter value will lead to a prolonged correction. Here, the goal is 119.95. This level is a key support for the downward structure. The main trend is the downward cycle of July 30th. Trading recommendations: Buy: 119.27 Take profit: 119.50 Buy: 119.55 Take profit: 119.90 Sell: 118.67 Take profit: 118.24 Sell: 118.20 Take profit: 117.90 For the pound / yen pair, the key levels on the H1 scale are : 131.10, 130.61, 130.30, 129.80, 129.51, 128.98 and 128.30. Here, the price has issued a local structure for the downward movement of July 31. The continuation of the movement to the bottom is expected after the price passes the noise range 129.80 - 129.51. In this case, the goal is 128.98. Consolidation is near this level. For the potential value for the downward trend, we consider the level of 128.30. Upon reaching this level, we expect a rollback to the top. Short-term upward movement is possibly in the range of 30.30 - 130.61. The breakdown of the last value will lead to a prolonged correction. Here, the goal is 131.10. This level is a key support for the bottom. The main trend is the local downward structure of July 31. Trading recommendations: Buy: 130.30 Take profit: 130.60 Buy: 130.63 Take profit: 131.10 Sell: 129.50 Take profit: 129.00 Sell: 128.95 Take profit: 128.30 The material has been provided by InstaForex Company - www.instaforex.com |
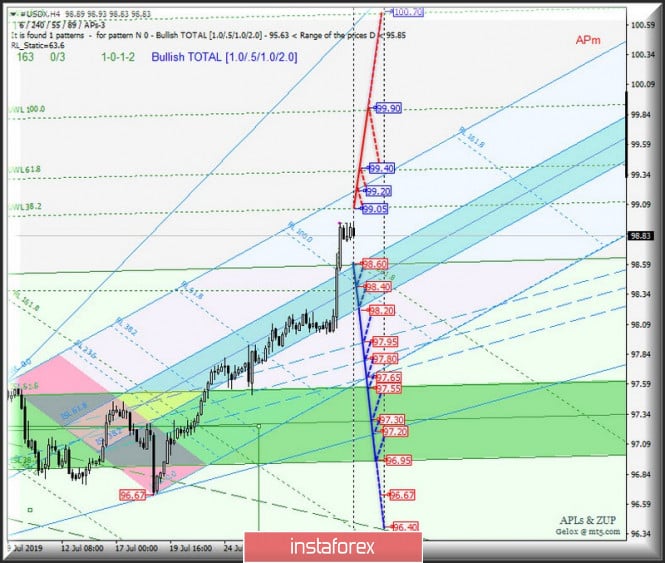
| Posted: 01 Aug 2019 06:04 PM PDT Let us consider the comprehensive analysis of options for the development of the movement of currency instruments #USDX vs EUR / USD vs GBP / USD from August 2, 2019 Minuette operating scale (H4) ____________________ US dollar Index The movement of the dollar index #USDX from August 2, 2019 will occur depending on the direction of the range breakdown :
The breakdown of ISL61.8 Minuette (support level of 98.60) will determine the development of the dollar index movement in the equilibrium zone ( 98.60 - 98.40 - 98.20 ) of the Minuette operational scale, and if there is a breakdown of the lower boundary of ISL38.2 (98.20) of this zone, then the downward movement #USDX can be continued to the boundaries of the 1/2 Median Line channel Minuette (97.95 - 97.80 - 97.65), and as an option - reaching the boundaries of the equilibrium zone (97.55 - 97.30 - 96.95) of the Minuette operational scale fork. In case of breakdown of the resistance level of 99.05 (warning line UWL38.2 of the Minuette operating scale fork), the upward movement of the dollar index can be continued towards the targets - the final FSL line (99.20) of the Minuette operational scale fork - warning UWL61.8 Minuette (99.40) - warning UWL100 .0 Minuette (99.90). The details of the #USDX movement are shown in the animated graphics. ____________________ Euro vs US dollar Similar to the case of the dollar index, the development of the movement of the single European currency EUR / USD from August 2, 2019 will also be due to the direction of the range breakdown:
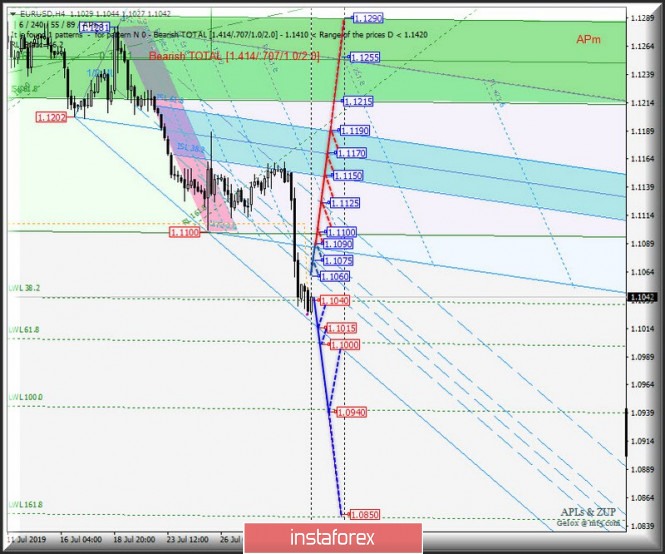
The breakdown of the resistance level of 1.1060 will make it possible to develop the movement of a single European currency within the 1/2 of the Median Line channel (1.1060 - 1.1075 - 1.1090) of the Minuette operational scale, and if there is a sequential breakdown of the upper boundary (1.1090) of this channel and the initial SSL line (resistance level of 1.1100) Minuette operating scale fork, then the upward movement of this instrument will continue to the final Schiff Line Minuette (1.1125) and the equilibrium zone (1.1150 - 1.1170 - 1.1190) of the Minuette operating scale fork. On the other hand, if the EUR / USD returns below the support level at 1.1040 on the warning line LWL38.2 of the Minuette operational scale fork, it will be possible to continue the downward movement of the single European currency to the targets - the control line LTL (1.1015) of the Minuette operational scale fork - warning line LWL61.8 Minuette (1.1000) - warning line LWL100.0 Minuette (1.0940). The details of the movement option for the EUR/USD pair are shown in the animated graphics. Great Britain pound vs US dollar The development of the movement of Her Majesty's currency GBP / USD from August 2, 2019 will also be determined by the direction of the range breakdown :
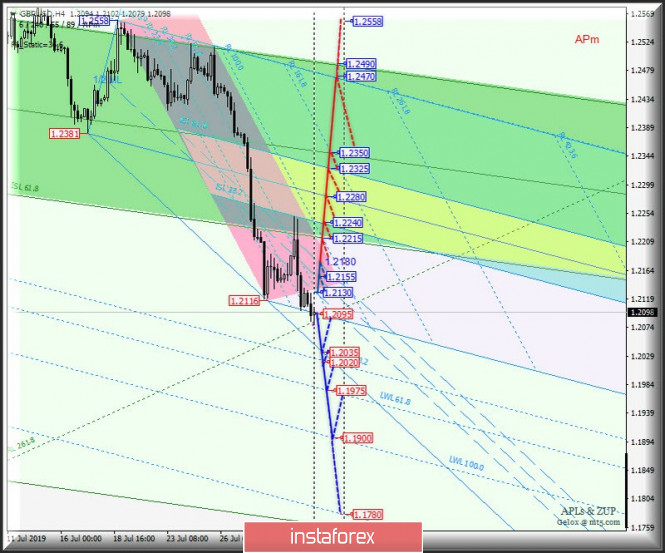
If the resistance level of 1.2130 is broken down, then the development of the GBP / USD movement will continue in the 1/2 Median Line Minuette channel (1.2130 - 1.2155 - 1.2180), well, and, accordingly, during the breakdown of the upper boundary (1.2180) of the mentioned channel, it is confirmed that the upward movement of this currency instrument can be extended to the boundaries of the equilibrium zones of the Minuette operational scales fork - Minuette (1.2215 - 1.2350 - 1.2490) and Minuette (1.2240 - 1.2280 - 1.2325). However, the breakdown of the SSL Minuette initial line (support level of 1.2095) will continue the development of Her Majesty's downward movement to the control LTL (1.2035) and precautionary LWL38.2 (1.2020) - LWL61.8 (1.1975) - LWL100.0 (1.1900) lines of the Minuette operational scale fork. The details of the GBP / USD movement options are presented in the animated chart. ____________________ The review was compiled without taking into account the news background. The opening of trading sessions of the main financial centers does not serve as a guide to action (placing orders "sell" or "buy"). The formula for calculating the dollar index is : USDX = 50.14348112 * USDEUR0.576 * USDJPY0.136 * USDGBP0.119 * USDCAD0.091 * USDSEK0.042 * USDCHF0.036. where power ratios correspond to the weights of currencies in the basket: Euro - 57.6% ; Yen - 13.6%; Pound sterling - 11.9% ; Canadian dollar - 9.1%; Swedish krona - 4.2%; Swiss franc - 3.6%. The first coefficient in the formula gives the index value to 100 on the starting date - March 1973, when the main currencies began to be freely quoted relative to each other. The material has been provided by InstaForex Company - www.instaforex.com |
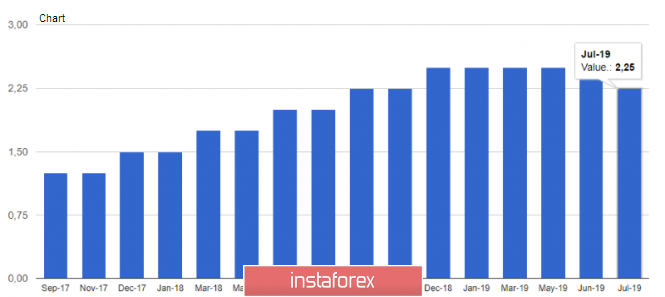
| Which currency suffered the most from the Fed's decision? Posted: 01 Aug 2019 04:54 PM PDT The Fed met the expectations of the markets by lowering the rate by a quarter percentage point, while also being disappointing as it said that this is just a "mid-cycle adjustment". Markets, on the other hand, counted on the beginning of a long series of easing policies. According to Donald Trump, who did not miss the opportunity to criticize Jerome Powell, the central bank made the mistake of not declaring "a long and aggressive cycle of rate cuts." By the way, these statements led market participants to the idea that in the coming months, Washington could initiate currency interventions. Despite the fact that the presidential administration has abandoned this idea, the majority of Bloomberg respondents do not exclude such a development of events. Although as a result, the July rate cut may not be the last in 2019, the markets lost their optimism. Due to their shaky plans for September, the US currency rate, however, like the dollar index, began to grow. Meanwhile, key stock indexes showed a fall of more than 1%. The recent meeting may well be a turning point for both the dollar and the markets as a whole. Recall that during the past two cycles, the federal funds rate decreased by more than 5 percentage points. Currently, the US central bank does not have such space for maneuver. This is due to the fact that now we have to carry out a decline from the starting point of 2.25% -2.50%. The situation is different from the previous two cycles, and Powell tried to convey this to market participants, but apparently did not succeed. If the nearest economic reports from the United States do not present unpleasant surprises, the dollar will develop growth. Long-suffering pound The most affected by the Fed's ambiguous rhetoric and dollar growth was the British pound. In tandem with the US currency, it collapsed to the marks on which it was during the Brexit referendum in 2016. Sterling has become even more vulnerable to political uncertainty in Britain. In Asian trading, GBP/USD came close to 1.21. Later, the pair slightly reduced losses, but the picture as a whole remained negative. Failure below he 1.21 mark can trigger a new wave of stop orders and subject the English currency to an uncontrolled fall. The next word was for the Bank of England, which, of course, did not make adjustments to the monetary policy. In addition, Mark Carney and his colleagues abandoned any hint of future policy easing. The only thing that could not be avoided was the decline in forecasts for the economy. The scandalous "divorce" process of Great Britain with the European Union does not bode well for the English economy, obviously. Despite the massive drop in the pound, many analysts have a positive view on this currency, considering it too oversold. Gloomy euro The euro was seriously injured from the greenback's rally. The main pair reached its lowest level since May 2017 on Thursday, marking at 1.1025. The support line is broken, and this could trigger a further decline in the euro. In the short term, a smooth entry of quotations to the territory of the ninth figure is not excluded. If euro bears break through another important mark –1.09 - pressure on the EUR/USD pair will increase. In this case, the euro will be able to fall to even more sad value - 1.04. Judging by recent events, the US dollar's domination is not under threat just yet. Jerome Powell's hawkish notes cast doubt on the widespread view that the US currency should depreciate in the near future. The material has been provided by InstaForex Company - www.instaforex.com |
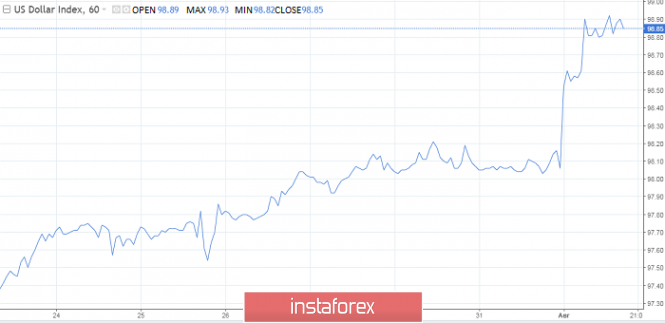
| The dollar bet on the Fed and did not lose Posted: 01 Aug 2019 04:40 PM PDT The USD index continues to update two-year highs, even despite the decision of the Federal Reserve to reduce the interest rate for the first time in 10 years and to stop the balance reduction process since August. According to JPMorgan analysts, one should not be surprised at this kind of behavior from the US currency. "The decision of the Fed on rates corresponded to the median forecast of economists, and now we are seeing a reaction in the spirit of "sell on rumors, buy on facts"," representatives of the financial institute noted. "The rhetoric of the central bank was rather restrained and gave participants in the foreign exchange market the opportunity to recall that, in general, the level of interest rates in the US remains attractively high, and the situation in the global economy is tense," they added. JPMorgan admits that the greenback may lose ground against currencies such as the yen and the franc in the future, but otherwise the potential for pulling down the US currency looks doubtful, especially in the case of the euro and the pound, therefore, bankers report that they refrain from any major "shorts" on the dollar. The rate cut at the FOMC meeting in July by a quarter of a point was already taken into account in the quotes, and the key event was the speech of Fed Chairman Jerome Powell. At a press conference, the Fed chief said that the regulator does not rule out further cuts in the federal funds rate, but does not consider its reduction from 2.5% to 2.25% as the beginning of a monetary policy easing cycle. In order for this to happen, the central bank must see the real weakness of the US economy. The comments of the Fed Chairman can be interpreted as follows: if the statistical data on the United States worsens, the regulator will lower the rate, if not, raise it or keep a pause. "Apparently, the Fed, considering its further actions, intends to track the incoming information. This is the same type of data dependency as it did when the Fed indicated in a statement that it would be "patient", "says Bipan Rai of the Canadian Imperial Bank of Commerce (CIBC). According to the analyst, the main idea of the FOMC's July message is that the market should not be 100% certain of a reduction in the federal funds rate at the September meeting. "It seems that the Fed has decided to insure itself in order not to give the market a false signal. If the tone of the regulator's statement was too bearish, then investors would get a signal to cut rates in September. In addition, it would be a reason to talk about the fact that the Fed already fears an economic slowdown at the moment," said B. Rai. It should be noted that the decision that the market expected from the US central bank with a probability of 100% turned out to be difficult for the regulator and was not unanimous. Two members of the FOMC - Boston head of the Federal Reserve Bank Eric Rosengren and his colleague from Kansas City Esther George - voted to keep the interest rate unchanged. "The split in the Fed is understandable. From a formal point of view, the US central bank has no reason to ease monetary policy. In the second quarter, GDP grew by 2.1%, and in the first half of the year - by 2.5%. At the same time, unemployment in the country has been at a low for more than half a century, core inflation (excluding energy and food prices) exceeds the target by 2% (2.1% in June), consumer confidence has reached its highest since November 2018" - said economist Moody's John Lonski. Meanwhile, the market seriously counted, if not on the Fed's aggressive monetary expansion (rate cut by 50 basis points), then on the door opened by the regulator for further easing of monetary policy. However, the US central bank returned bidders from heaven to earth. In response to the FOMC statement and comments by Jerome Powell, the single European currency exchange rate against the US dollar fell to its lowest level since May 2017. However, from a fundamental point of view, the weakening of the euro against the greenback looks quite logical. The differential yield of US and German government bonds now plays in favor of the dollar, and the fact that economic growth in the eurozone slowed down by half in the second quarter puts pressure on the euro bulls. The US economy is clearly growing faster than the currency bloc's GDP. If we assume that the Fed makes monetary policy decisions dependent on incoming data, then one of the catalysts for the change in the dollar exchange rate could be the US labor market report for July, which will be released tomorrow. It is assumed that the strong figures will allow EUR/USD bears to push the quotes to 1.09, and a weak result will bring the bulls to life. The material has been provided by InstaForex Company - www.instaforex.com |
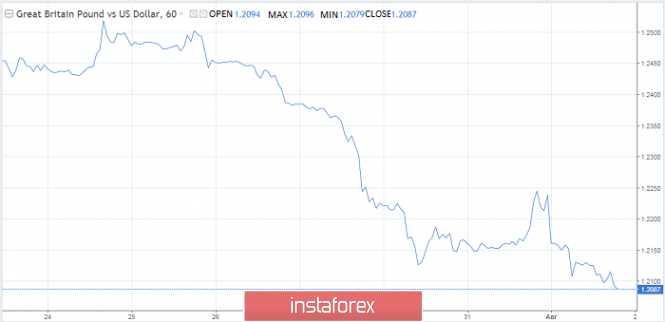
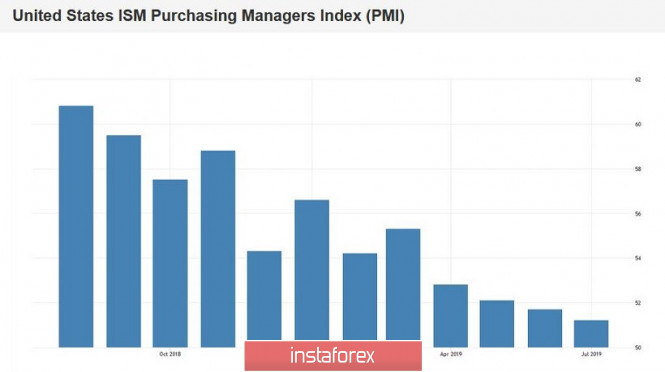
| GBP/USD. Unexpected dollar weakness and hopeless pound prospects Posted: 01 Aug 2019 04:27 PM PDT The US dollar unexpectedly stopped growing in almost all pairs in the afternoon. The EUR/USD pair pulled back from the bottom of the 10th figure to the level of 1.1085, the USD/JPY pair dropped to the bottom of the 108th figure, and the aussie again went to conquer the 69th price level. In varying degrees, the greenback surrendered its positions in the remaining pairs. The pound-dollar pair was no exception: after the price again updated its annual low of 1.2078, a rather sharp reversal and growth followed in the middle of the 21st figure. By and large, a corrective pullback was expected, as the pair was gradually approaching its record high, that is, to a record low of 1.1986, which was reached in January 2017. As the pair's downward impulse exhaled, the probability of a corrective growth increased - from the bottom of the 20th figure. But the dollar was ahead of the event, weakening throughout the market. As a result, the GBP/USD pair retreated by almost 100 points only due to the devaluation of the greenback. This price dynamics was due to several reasons. First, the ISM Manufacturing Index was published today, which, despite positive forecasts, dropped to 51.2 points, updating its multi-month lows. The structure of the indicator suggests that the employment component fell to 51.7 points (for comparison, it was at 54.7 in the previous month), and the price component of the index (inflation component) fell to 45.1 points, while the growth forecast to 50 -ty points. In general, the indicator has been falling for the fourth month in a row, disrupting the optimistic picture of the US statistical reporting. After a strong Nonfarms and relatively good data on US GDP growth, today's release has become a kind of "cold shower" for dollar bulls. After all, the words of Jerome Powell are still fresh in their memory, as they allowed a further reduction in the interest rate, if key macroeconomic indicators show a steady decline. Yesterday, this rhetoric supported the dollar, as the key economic indicators that preceded the July Fed meeting came out (mostly) in the green zone or at the level of forecasts. But the ISM index "sobered up" many market participants, especially on the eve of tomorrow's Nonfarms, which traders could also be disappointed in, given the relatively weak report from ADP (according to their data, the increase in the number of employees amounted to 156,000 in July). Amid doubts that have resurfaced regarding the Fed's future actions, the yield on 10-year Treasuries fell sharply. In just a few hours, this figure fell from 2,053% to 1,952%. The fact of such a rapid decline put additional pressure on the dollar, allowing bulls of the GBP/USD pair to return to the 21st figure. In general, the current situation shows how dollar bulls are uncertain in their abilities. Only one macroeconomic report was able to shake the position of the greenback, which has been building up its muscles throughout the day. If subsequent releases will also be released in the "red zone" (especially inflation indicators), the dollar will return the points gained in the medium term, as concerns about the next steps from the Fed will return to the market. This situation will allow GBP/USD traders to open short positions at the peak of corrective pullbacks. After all, the fundamental picture remains negative for the pound, regardless of the US events. Johnson is still preparing Britain for the hard Brexit, and his aggressive rhetoric addressed to Brussels reduces the likelihood of any compromise. The market hopes for the help of the British Parliament, which can block the implementation of the chaotic scenario. But these hopes are justified only with the current composition of the House of Commons. In the meantime, the British press is increasingly suggesting that Johnson will decide to hold extraordinary Parliamentary elections. Here it is worth noting that with the arrival of the new prime minister, the Conservative Party rating rose by six points at once - that is, to 31%. The Labor Party ranking is now 21%. The gap in the ratings of Conservatives and Laborers was a record in the last five months. Such sociology also has background pressure on the pound, although the question of early elections is not yet on the agenda. Nevertheless, uncertainty over Brexit prospects, as well as Johnson's aggressive attacks on the EU leadership suggest that the downward dynamics of GBP/USD is still justified. From a technical point of view, the pair is within the framework of the downward movement, as evidenced by the trend indicators on all "higher" timeframes (from H4 and higher). The nearest support level is at 1,2005 (the bottom line of the Bollinger Bands indicator on the monthly chart). The purpose of a possible corrective pullback is the mark of 1.2290 (Tenkan-sen line on the daily chart): if the bulls overcome it, then they will consolidate again in the 23rd figure. However, given the fundamental picture, it will be difficult for the bulls to find a reason for such a significant upward spurt. The material has been provided by InstaForex Company - www.instaforex.com |
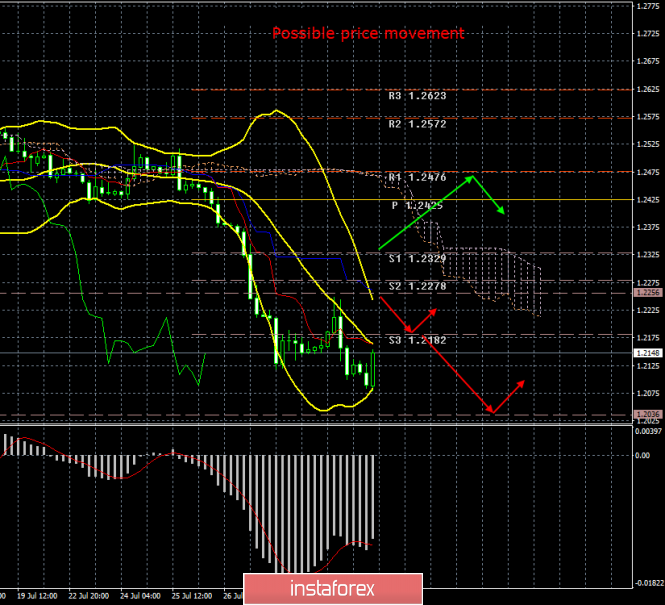
| GBP/USD. August 1. Results of the day. The Bank of England left monetary policy unchanged Posted: 01 Aug 2019 04:16 PM PDT 4-hour timeframe The amplitude of the last 5 days (high-low): 81p - 84p - 170p - 106p - 116p. Average amplitude for the last 5 days: 111p (107p). The forex market did not expect anything new and interesting from the meeting of the British regulator. In principle, it ended as expected by most experts and traders. The key rate remained unchanged, at the level of 0.75%, as well as the monthly volume of redemption of government bonds. The balance of votes among the members of the monetary committee was also unambiguous at 9-0 in favor of the absence of changes. At the press conference, Mark Carney said that the UK banking system is ready for any outcome of Brexit, and its preparation for the country's withdrawal from the European Union began immediately after the referendum in 2016. However, traders are more interested in whether the British economy will survive the "hard" Brexit? It will withstand and survive, but what will the consequences be? The forecasts are completely disappointing, the fall of the main macroeconomic indicators, the pound sterling rate, the outflow of labor, the outflow of investments, the growth of unemployment and other problems inherent in the crisis. In addition, if the composition of the United Kingdom also leaves Northern Ireland and Scotland, who opposed the "divorce" from the EU? In general, Mark Carney did not reassure the markets with his statements about the stability and readiness of the banking system. The index of business activity in the UK manufacturing sector slightly exceeded analysts forecasts, but still remained below the level of 50.0. Thus, the decline is observed in Great Britain's industry. At the US trading session, the lowest pullback of the GBP/USD pair began, however, as in the case of the euro, it is not known how long it will last. Tomorrow macroeconomic statistics will come from the UK and from the United States, so a quiet Friday with profit taking before the weekend will not work. Trading recommendations: The pound/dollar currency pair may begin a round of corrective movement. Thus, it is now recommended to wait for the completion of this turn and resume selling the pound sterling with a target level of 1.2036. It will be possible to buy the British currency no earlier than consolidating the pair above the critical line, but with extreme caution and in small lots. The first goal is the resistance level of 1.2476. In addition to the technical picture should also take into account the fundamental data and the time of their release. Explanation of the illustration: Ichimoku indicator: Tenkan-sen - the red line. Kijun-sen - the blue line. Senkou Span A - light brown dotted line. Senkou Span B - light purple dotted line. Chikou Span - green line. Bollinger Bands indicator: 3 yellow lines. MACD Indicator: Red line and histogram with white bars in the indicator window. The material has been provided by InstaForex Company - www.instaforex.com |
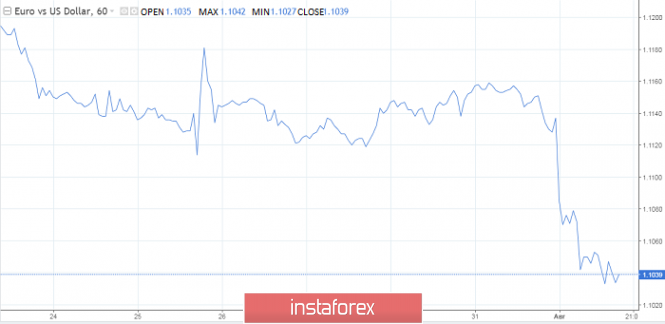
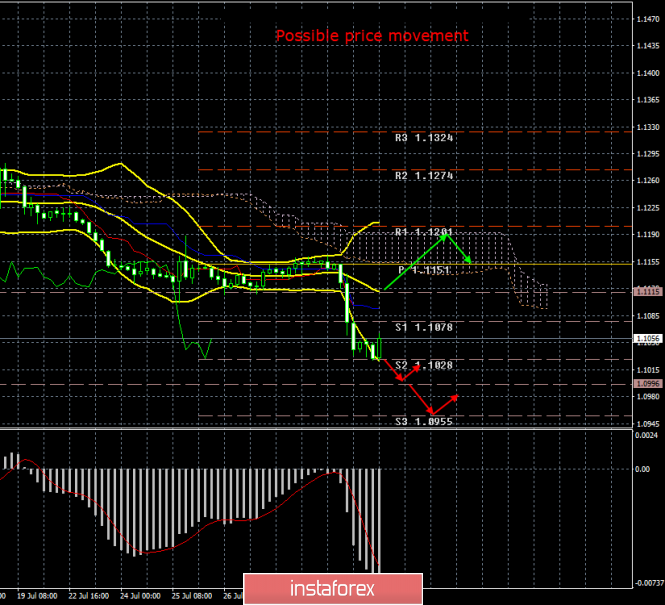
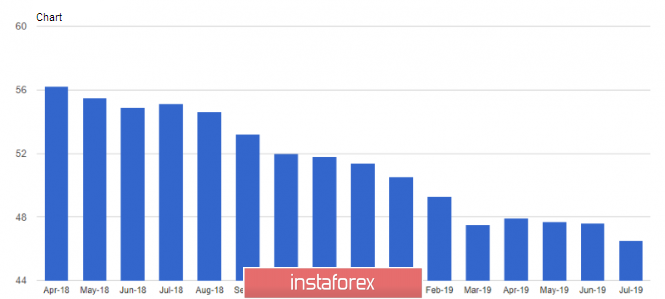
| Posted: 01 Aug 2019 04:01 PM PDT 4-hour timeframe The amplitude of the last 5 days (high-low): 86p - 39p - 38p - 29p - 102p. Average amplitude for the last 5 days: 59p (44p). After the collapse on Wednesday, the EUR/USD pair behaved more calmly on Thursday. Traders calmed down after Jerome Powell's statements and focused on the publication of reports on business activity in the manufacturing areas of the European Union and the United States. However, these reports could be interpreted in different ways. In the eurozone, the business activity index rose by a "whole" 0.1 points, from 46.4 to 46.5. On the one hand, improvement, on the other, any value below 50.0 is regarded as negative. In the US, the Markit index exceeded the forecast and amounted to 50.4, while the ISM index turned out to be worse than the expectations of the foreign exchange market and fell to 51.2 in July, but the value of both indices was above 50.0. Thus, it can still be concluded that US business activity in industry remains in the "green zone", while it is in the "red" zone in the eurozone. However, it was the weakened business activity index of ISM that caused minimal cuts in "dollar" positions during the US trading session on Thursday, August 1. Well, now we need to find out whether this will be the beginning of the correction and how strong this correction will be. It is possible that there will be no pullback at all, since we do not even have one closed bullish bar at the moment. However, the euro/dollar pair's rebound from the support level of 1.1028 still allows us to expect a slight pullback. The Fed meeting is in the past and now traders can "live" without any tension until the next ECB and Fed meetings, analyzing only regular macroeconomic reports and regular speeches and publications of Donald Trump, who is constantly dissatisfied with something. Trading recommendations: EUR/USD has moved to a weak upward correction. Thus, it is now recommended to wait for its completion and re-sell the euro currency with targets of 1.1028 and 1.0996. It will be possible to buy the euro/dollar pair with the aim of the upper limit of the Ichimoku cloud, but with small lots, if traders manage to overcome the critical Kijun-sen line. However, bulls remain extremely weak at this time. In addition to the technical picture should also take into account the fundamental data and the time of their release. Explanation of the illustration: Ichimoku indicator: Tenkan-sen - the red line. Kijun-sen - the blue line. Senkou Span A - light brown dotted line. Senkou Span B - light purple dotted line. Chikou Span - green line. Bollinger Bands indicator: 3 yellow lines. MACD Indicator: Red line and histogram with white bars in the indicator window. The material has been provided by InstaForex Company - www.instaforex.com |
| What the Fed said on August 1 (Text) Posted: 01 Aug 2019 03:51 PM PDT As it reduced the base interest rate by 25 basis points to a target range of 2.00-2.25%, the Federal Open Market Committee of the US Federal Reserve commented on its decision and the current situation in the country: The Fed has noted an increase in economic activity at a moderate pace and the strong position of the labor market due to the moderate growth of jobs in recent months and the remaining low unemployment rate. The Fed states that although family expenses have increased in comparison with the beginning of the year, the growth dynamics of investments by business structures is weak. The Fed continues to assess long-term inflation expectations as stable. At the same time, total inflation and core inflation calculated on the basis of a 12-month period, which does not take into account energy and food prices, are below 2%. The compensatory effect on inflation on the part of markets continues to be implemented to a small extent. The Fed is committed, in accordance with its authority, to promote maximum employment and price stability. In light of the impact of global events on economic prospects, as well as taking into account moderate inflationary pressure, the Fed decided to lower the target interest rate range for federal funds to 2.00 -2.25%. This action confirms the Fed's view that sustainable expansion of economic activity, strengthening the labor market and inflation, close to the symmetrical 2% target level indicated by the Fed, are the most likely trends. However, uncertainty regarding the realization of these prospects remains. As the Fed considers the further trajectory of the target interest rate range for federal funds, it will continue to closely monitor incoming information and its economic consequences and will act accordingly to support development in the presence of a strong labor market and inflation close to a symmetrical target level of 2%. In determining the timing and scope of future regulation of the target interest rate range for federal funds, the Fed will be guided by both achieved and expected economic progress in comparison with its goals of strong employment and symmetrical inflation at 2%. This approach will be based on a wide range of information, including parameters of labor market conditions, indicators of inflationary pressure and inflation expectations, financial and international events. The Fed will complete a reduction in its aggregate balance of ownership of securities in the System Open Market Account in August, two months earlier than the previously designated period. The current monetary policy framework was adopted by a majority of votes (8 vs 2). The final decision was not supported by the President of the Federal Reserve Bank of Kansas City, Esther George, and the President of the Federal Reserve Bank of Boston, Eric S. Rosengren, who proposed at this meeting to keep the target interest rate range for federal funds 2.25 -2.50%. The material has been provided by InstaForex Company - www.instaforex.com |
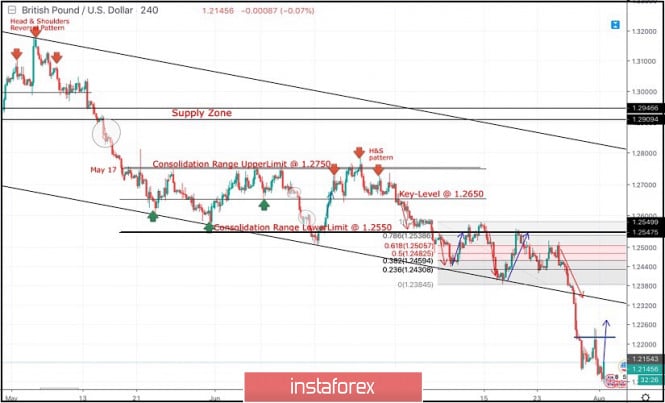
| August 1, 2019 : GBP/USD Intraday technical analysis and trade recommendations. Posted: 01 Aug 2019 09:40 AM PDT
Since May 17, the previous downside movement within the depicted bearish channel came to a pause allowing the recent sideway consolidation range to be established between 1.2750 - 1.2550 with a prominent key-level around 1.2650. On July 5, a bearish range breakout was demonstrated below 1.2550 (the lower limit of the depicted consolidation range). Hence, quick bearish decline was demonstrated towards the price zone of 1.2430-1.2385 (where the lower limit of the movement channel came to meet the GBPUSD pair). In July 18, a recent bullish movement was initiated towards the backside of the broken consolidation range (1.2550) where another valid SELL entry was offered two weeks ago. Moreover, Bearish breakdown below 1.2350 facilitated further bearish decline towards 1.2320, 1.2270 and 1.2125 which correspond to significant key-levels on the Weekly chart. The current price levels are quite risky/low for having new SELL entries. That's why, Previous SELLERS were advised to have their profits gathered. Recently, weak signs of bullish recovery are being demonstrated around 1.2100. This may push the GBPUSD to retrace towards 1.2260 then 1.2320 if sufficient bullish momentum is maintained. On the other hand, The price zone of 1.2320 - 1.2350 now stands as a prominent SUPPLY zone to be watched for new SELL positions if the current bullish pullback pursues towards it. Trade Recommendations: Intraday traders are advised to look for early bullish breakout above 1.2230 for a counter-trend BUY entry. Conservative traders should wait for the current bullish pullback to pursue towards 1.2320 - 1.2350 for new SELL entries. S/L should be placed above 1.2430. Initial T/P level to be placed around 1.2279 and 1.2130. The material has been provided by InstaForex Company - www.instaforex.com |
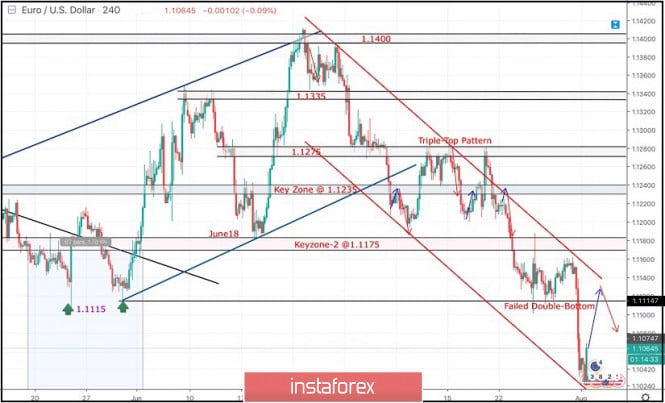
| August 1, 2019 : EUR/USD Intraday technical analysis and trade recommendations. Posted: 01 Aug 2019 09:04 AM PDT
Back in June 24, the EURUSD looked overbought around 1.1400 facing a confluence of supply levels. Thus, a bearish movement was initiated towards 1.1275 followed by a deeper bearish decline towards 1.1235 (the lower limit of the previous bullish channel) which failed to provide enough bullish support for the EUR/USD pair. In the period between 8 - 22 July, sideway consolidation range was established between 1.1200 - 1.1275 until a triple-top reversal pattern was demonstrated around the upper limit. Shortly after, evident bearish momentum (bearish engulfing H4 candlestick) could bring the EURUSD back below 1.1235. Early bearish breakdown below 1.1175 facilitated further bearish decline towards 1.1115 (Previous Weekly Low) where temporary bullish rejection was recently demonstrated on July 25. That's why, Intraday bullish pullback was demonstrated towards 1.1175-1.1200 where a valid SELL entry was suggested in a previous article. It's already running in profits. This week, bearish persistence below 1.1115 was mandatory to allow further bearish decline initially towards 1.1025 where early signs of bullish recovery are being demonstrated. A bullish pullback should be expected towards 1.1115-1.1140 where a confluence of recent SUPPLY levels are located. Risky traders can watch for bullish persistence above 1.1050 as a bullish signal for Intraday counter-trend BUY entry with bullish target projected towards 1.1115-1.1140. Trade recommendations : Conservative traders should wait for a bullish pullback towards 1.1115-1.1140 for a valid SELL entry. S/L should be placed above 1.1175 while initial T/P level should be located around 1.1025. The material has been provided by InstaForex Company - www.instaforex.com |
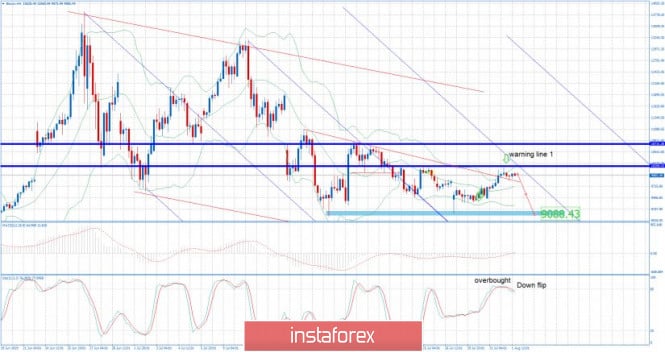
| BTC 08.01.2019 - Potential downward continuation Posted: 01 Aug 2019 08:11 AM PDT Crypto Industry News: The latest policy by the FCA provides multiple key clarifications and definitions. As an example, cryptocurrencies like Bitcoin and Ethereum which the FCA considers being "exchange tokens," that are not regulated but will adhere to anti-money laundering regulations. Furthermore, security tokens fall under the FCA's 'specifcied investment' category according to the statement, although it will also be under the firm's remit. On the other hand, utility tokens will fall outside the FCA's control, except for when they can be defined as electronic money and fall with a new category of e-money tokens. Technical Market Overview:
The BTCU/USD is still trading in the downward trend and there is no indication of any reversal yet. As long as the BTC is trading below the level of $11.000 and the level of $12.000, I would watch for selling opportunities. Stochastic oscillator is showing overbought condition and the down flip, which is good sign for the further downside move. Pitchfork warning line 1 is suggesting that very soon there should be turn, which adds more potential weakness on BTC. Important resistance levels to watch: $10,206 $10,731 $11,000 Important support levels to watch: $9,738 $9.346 $9.088 Trading Recommendations: The best strategy in the current market conditions is to trade with the larger timeframe trend, which is still down. Stochastic is showing overbought condition and the fresh new down flip and the BTC is trading near the resistance $10,200. The material has been provided by InstaForex Company - www.instaforex.com |
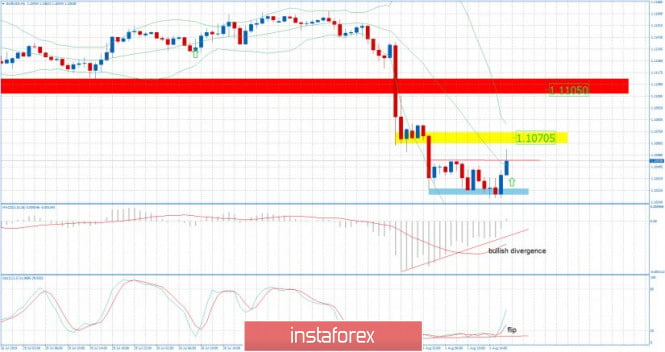
| EUR/USD for August 01,2019 - Double bottom confirmed on the hourly chart Posted: 01 Aug 2019 07:52 AM PDT EUR/USD traded lower after the FOMC statement yesterday but it found a good support at the price of 1.1028 and there is potential for the upside movement in the next period. Technical picture:
On the 1H time-frame I found that there is completed double bottom pattern, which is sign that buyers reacted on the EUR priced "too low". Botch Stochastic and MACD oscillators are showing the oversold condition and the bullish divergence, which is clear sign that there is decreasing in the bearish momentum. Important upward references: 1.1070 yellow rectangle– Balance range resistance 1.1105 red rectangle– Swing low acting like resistance Important downward references: 1.1028 blue rectangle –Defined support cluster 1.1100 – Round number support My advice is to watch for buying opportunities with the first target at the price of 1.1070. The material has been provided by InstaForex Company - www.instaforex.com |
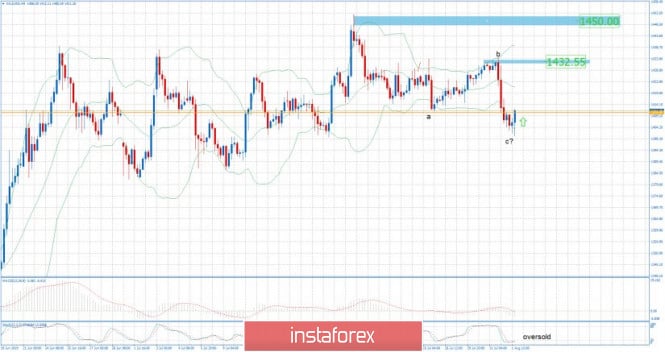
| Gold 08.01.2019 - Comletion of the downward correction ABC? Posted: 01 Aug 2019 07:38 AM PDT Gold did trade lower after the FOMC statement yesterday but it found support at the price of $1.400 also round number, which is for me sign that there is potential for the upside. Technical picture:
On the 4H time-frame I found that Gold might complete that downward correction (ABC down), which is strong sign that further upside is very likely to happen. The important swing low (resistance) at the price of $1.410 got penetrated, which added even more strength on the Gold. Stochastic oscillator is showing oversold condition and the fresh up flip and can help the Gold to rally. Important upward references: $1.432 – Swing high prior to FOMC $1.450 – Major swing high Important downward references: $1.400 – Round number and important support $1.384 – Support cluster My advice is to watch for buying opportunities with the first target at the price of $1.432. The material has been provided by InstaForex Company - www.instaforex.com |
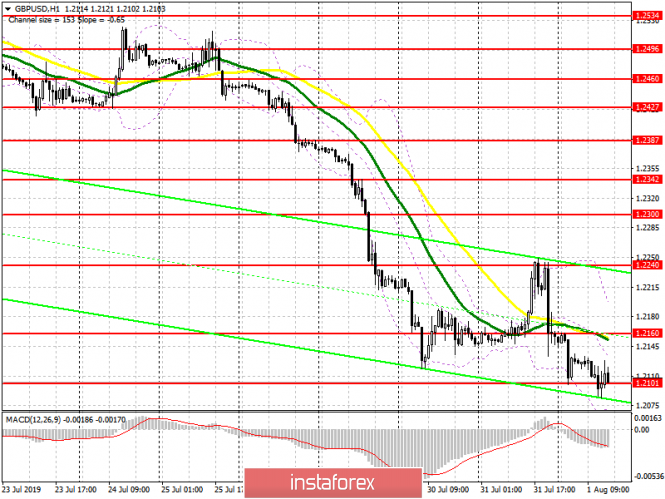
| Posted: 01 Aug 2019 07:37 AM PDT To open long positions on GBP / USD pair, you need: Buyers are fighting for the level of 1.2100 but there is very little hope of an upward correction. If the data on the US manufacturing index turns out to be better than economists' forecasts, we can expect pressure to return in the GBP/USD pair. In this scenario, it is best to open new long positions after updating the next annual lows around 1.2040 and 1.1985. If buyers still manage to make a false breakdown at 1.2100 and gain a foothold above this range in the second half of the day, the task will be to return to the resistance of 1.2160. Here, a larger upward correction can start in the pair to the maximum of 1.2240, where I recommend fixing the profit. To open short positions on GBP / USD pair, you need: Keeping the interest rates unchanged, as well as the general approach to monetary policy by the Bank of England, was quite expected. In such a scenario, the pressure on the pound should continue. The breakthrough of the level of 1.2101 will lead to the continuation of the bearish trend that is aimed at the lows in the area of 1.2040 and 1.1985, where I recommend taking profits. If data on the American economy disappoints traders, GBP/USD growth in the resistance area of 1.2160 is not excluded, where bears will again begin to actively return to the market. However, it is better to open larger short positions to rebound from the resistance of 1.2240. Indicator signals: Moving averages Trading is below 30 and 50 moving averages, which indicates a further decrease in the pound. Bollinger bands In the case of an upward correction, the upper limit of the indicator in the area of 1.2170 will act as a resistance, from where you can open short positions immediately to the rebound. Description of indicators MA (moving average) 50 days - yellow MA (moving average) 30 days - green MACD: fast EMA 12, slow EMA 26, SMA 9 Bollinger Bands 20 The material has been provided by InstaForex Company - www.instaforex.com |
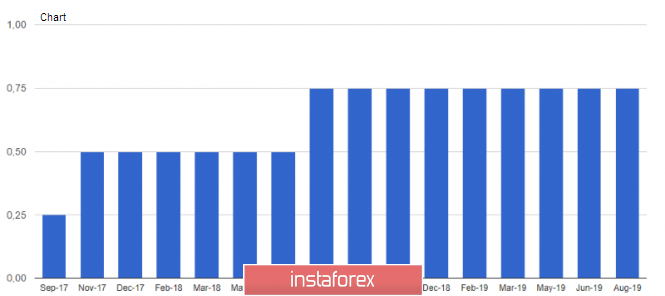
| Posted: 01 Aug 2019 07:34 AM PDT GBPUSD In the first half of the day, traders' attention was also focused on the Bank of England's decision on interest rates. So, the Bank of England left the key interest rate at 0.75%, and the decision to maintain the key rate at 0.75% was made with a ratio of 9-0 votes. But more attention was focused on statements about whether the Central Bank will raise interest rates in the future, as planned at the last meeting, or in the new conditions Brexit will abandon such measures. The Bank of England noted that they predict a gradual, limited growth of the key rate in the next few years if Brexit goes smoothly. The next increase in the key rate will also depend on the recovery of global economic growth, which, as we may remember, is slowing. Also, the Central Bank noted that against the background of the increased probability of Brexit without an agreement, interest rates can be lowered if necessary. It can be concluded that the monetary policy has been partially revised and changed. We can expect an increase in interest rates in the UK, or even talk about it, only after 100% clarity in the situation with Brexit. In the meantime, the pound will continue to remain under pressure, as the "lifeline", which could be thrown today by the Bank of England, is not necessary to wait. Data on activity in the UK manufacturing sector also put pressure on the pound. According to the report, the index of supply managers for the manufacturing sector in the UK in July this year remained below 50 points and amounted to 48.0 points, indicating a decline in the activity. EURUSD Activity in the manufacturing sector of the eurozone weighed on the euro in the first half of the day. Weak external demand, which continues to decline due to the protectionist policy of the White House and the US trade conflicts with a number of countries, including China - all this affects the production sector, which continues to decline, gradually slowing the overall rate of economic growth. According to the Markit report, the purchasing managers' index (PMI) for the manufacturing sector in Italy in July remained below 50 points and amounted to 48.5 points, while it was expected to decline to 48.0 points. Back in June, Italy's production PMI was 48.4 points. In France, the same indicator for the manufacturing sector in July fell below 50.0 points to 49.7 points, indicating a decline in activity, although in June it was 51.9 points. Economists had expected the index to rise to 50.0 points. Well, the leader among a number of countries is Germany, where the purchasing managers' index (PMI) for the manufacturing sector fell to 43.2 points in July against 45.0 points in June this year. Economists had forecast the figure at 43.1 points. Given that the German economy is well "sharpened" for the export of goods, a sharp drop in external demand especially affects the production sector. The overall indicator for the eurozone also did not please traders and economists. According to the statistics agency Markit, the purchasing managers' index (PMI) for the production sector of the eurozone in July 2019 fell to 46.5 points against 47.6 points in June this year, which almost coincided with the forecasts of economists. The slowdown in the manufacturing sector is yet another confirmation that the eurozone economy needs additional stimulus in such difficult times. Almost no one doubts that the European Central Bank will lower interest rates during its meeting in September this year. Until then, the pressure on the European currency will only increase. As for the current technical picture of the EURUSD pair, the bears have reached a large support level of 1.1030, but the "stop" is a temporary phenomenon. Today's reports on the state of the US manufacturing sector may have a positive impact on the US dollar. The support breakout of 1.1030 will provide the bears with a new "window", which will lead to a decrease in the trading instrument in the area of the lows of 1.0990 and 1.0950. In the case of an upward correction, the growth will be limited by the intermediate resistance of 1.1070, and it is better to open larger short positions after updating the maximum of 1.1100. The material has been provided by InstaForex Company - www.instaforex.com |
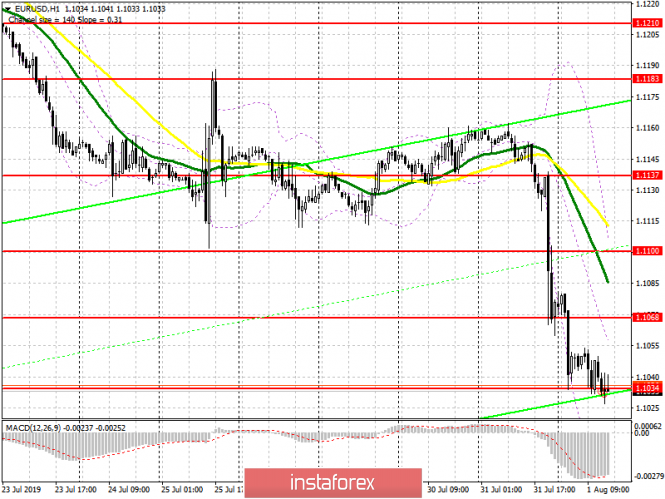
| Posted: 01 Aug 2019 07:31 AM PDT To open long positions on EUR / USD pair, you need: It is quite expected that the PMI indices for the production sector of the eurozone countries continued to show a reduction, which indicates the poor state of the sector. Against this background, it would not be entirely correct to expect any serious activity from the euro buyers. Therefore, the absence of bulls at the level of 1.1034 is quite predictable. In the second half of the day, it is best to return to long positions only after a false breakout at the level of 1.1034 but it is best to look for purchases after updating the next monthly lows around 1.0990 and 1.0954. Majority of it will depend on the ISM US manufacturing index. A bad report may bring back buyers of the euro, which will lead to an update of resistance at 1.1068, where I recommend fixing profits. However, it is hardly possible to expect a larger increase above this level today. To open short positions on EUR / USD pair, you need: In the afternoon, sellers will wait for a good report on the US manufacturing index, which will increase the pressure on the European currency and lead to a break from consolidating below the support of 1.1034, which will push the pair further to the lows of 1.0990 and 1.0954, where I recommend taking profits. If the EUR / USD buyers attempt to return to the resistance of 1.1068, the formation of a false breakdown will be a direct signal for the further opening of short positions. Otherwise, you can sell on the rebound from the resistance of 1.1100. In any case, the pair will maintain a short-term bearish trend and so far, there are no signals for its completion. Indicator signals: Moving averages Trading is below 30 and 50 moving averages, which indicates the bearish nature of the market. Bollinger bands In the case of an upward correction, the upper limit of the indicator in the area of 1.1078 will act as a resistance, from where you can open short positions immediately to the rebound. Description of indicators MA (moving average) 50 days - yellow MA (moving average) 30 days - green MACD: fast EMA 12, slow EMA 26, SMA 9 Bollinger Bands 20 The material has been provided by InstaForex Company - www.instaforex.com |
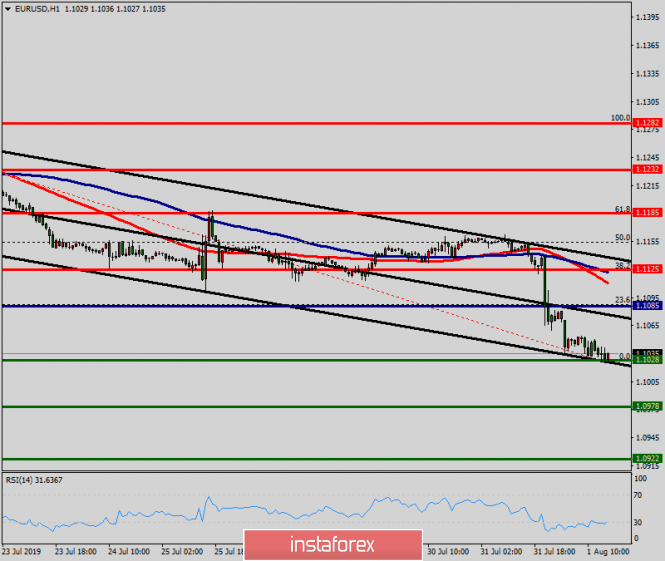
| Technical analysis of EUR/USD for August 01, 2019 Posted: 01 Aug 2019 06:38 AM PDT Overview: Pivot point: 1.1085 The EUR/USD pair fell from the level of 1.1085 which represents the daily pivot point towards 1.1028 yesterday. Now, the current price is set at 1.1035. On the H1 chart, the resistance is seen at the levels of 1.1085 and 1.1125. Besides, the weekly support 1 is seen at the level of 1.1028. Today, the EUR/USD pair is continuing to move in a bearish trend from the new resistance level of 1.1085, to form a bearish channel. Amid the previous events, we expect the pair to move between 1.1085 and 1.0978. Therefore, sell below the level of 1.1085 with the first target at 1.1028 in order to test the daily support 1 and further to 1.0978 (S2). On the other hand, if the pair fails to pass through the level of 1.1028, the market will indicate a bullish opportunity above the level of 1.1028. The market will rise further to 1.1125 so as to to return to the weekly pivot point and resistance onerespectively. Additionally, a breakout of that target will move the pair further upwards to 1.1185.
Trading recommandations: The market is likely to show signs of a bearish trend around the spot of 1.1085. In other words, sell orders are recommended below the pivot point (1.1085) with the targets at the level of 1.1028 and 1.0978. Key levels
Comment:
|
| The Fed's rate cut is not the beginning of a long easing cycle, but a mid-cycle adjustment Posted: 01 Aug 2019 06:28 AM PDT Yesterday's decision of the Federal Reserve System on interest rates did not surprise anyone. Another question is how the committee is going to proceed, given the pressure from the White House and the current situation in the world economy and trade. According to the data, yesterday, the Central Bank set the range of interest rates on federal funds between 2.00% and 2.25%, lowering it from the level of 2.50%. For this decision, the committee on open market operations of the Fed voted by a vote of 8 to 2. The Fed also lowered the discount rate by 0.25 percentage points to 2.75%. In statements that were immediately made after that, it was noted that the Fed lowered the rate by a quarter of a percentage point, but left the "door open" for further reductions this year. Expected sustainable growth of the economy, but uncertainty remains, therefore, it is necessary to monitor the economic data as you ponder the future course of interest rates. One of the reasons for the lowering of interest rates was the weak inflation on which the Federal Reserve relied when making such a decision. It also became known that the portfolio reduction program was completed earlier by two months before the schedule. During his speech, Fed Chairman Jerome Powell tried to reveal in more detail the further course of monetary policy but mainly focused on the stability of the economy and the importance of analyzing the incoming data. Powell said that prospects remain favorable as the economy grew at a healthy pace in the first half of 2019. The current rate cut is intended to protect against downside risks from trade and the tense situation in the world. The Fed Chairman also noted that weak global growth, weak inflation, and uncertainty around trade speak in favor of lowering the rate, but the economic indicators are close to our goals. Yesterday's actions of the Fed were aimed at maintaining favorable prospects for the economy. Powell also stressed that the current rate cut "definitely has a safety aspect" rather than a systemic one, as trade tensions have a significant impact on the economy. The head of the Fed also made it clear that the rate cut is not the beginning of a long cycle of easing, but an adjustment in the middle of the cycle. Therefore, the committee's further action on monetary policy will depend on the data received. Given all this, traders continued to buy the US dollar, as they did not hear anything in the statements that could significantly affect the current monetary policy in the medium term. Expectations of lower interest rates in the eurozone are a more "slippery" topic, given the fact that they are already at zero. Therefore, the course of further strengthening of the US dollar will be a better solution. Yesterday's reports on the US economy were ignored by the market, despite the growth of jobs. According to ADP, the number of jobs in the US private sector increased by 156,000 in July 2019, thanks to good employment growth in both small and large companies. Economists had forecast an increase of 150,000. The leader of growth was the service sector, where the number of jobs increased by 146,000. But the business barometer of Chicago in July fell again below the mark of 50 points. According to the report, the purchasing managers' index (PMI) of Chicago in July fell by 5.3 points to 44.4 points. Economists had expected the index to be 50.5 points. Let me remind you that the index value above 50 indicates an increase in the activity. As for the current technical picture of the EURUSD pair, the bears have reached a large support level of 1.1030, but the "stop" is a temporary phenomenon. Today's reports on the state of the manufacturing sector of the eurozone countries may have a negative impact on the exchange rate of risky assets, which will continue to decline against the US dollar. The support breakout of 1.1030 will provide the bears with a new "window", which will lead to a decrease in the trading instrument in the area of the lows of 1.0990 and 1.0950. In the case of an upward correction, the growth will be limited by the intermediate resistance of 1.1070, and it is better to open larger short positions after updating the maximum of 1.1100. The material has been provided by InstaForex Company - www.instaforex.com |
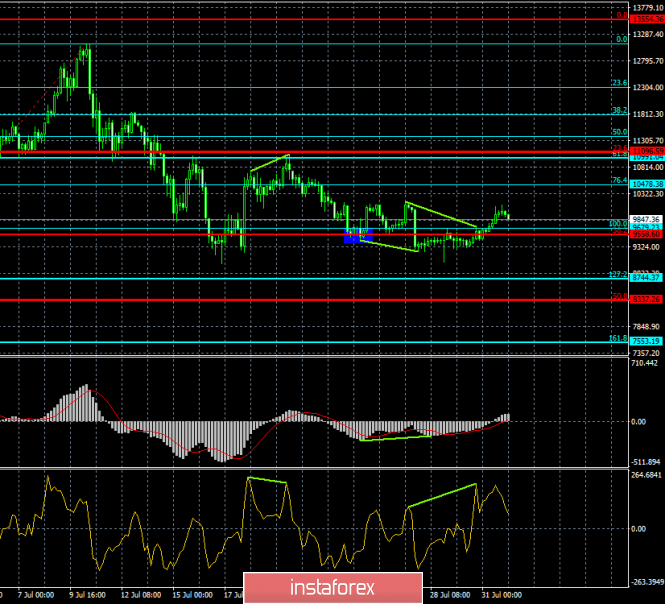
| Posted: 01 Aug 2019 06:28 AM PDT Bitcoin – 4H.
As seen on the 4-hour chart, Bitcoin has completed the consolidation above the correction level of 100.0% ($9679). However, BTC's growth potential is currently limited. The first reason is another growth of the US dollar in the world currency markets. Yesterday's speech by Jerome Powell was regarded as positive for the dollar, despite the Fed's key rate cut. As a result, the US dollar has risen in price, and today, this wave can cover bitcoin with other cryptocurrencies, the price of which is measured in dollars. Secondly, many experts and analysts of the cryptocurrency segment begin to give their forecasts about the cost of the "cue ball" in six months or a year. According to many experts, the price may rise to $55,000. From my point of view, such scenarios cannot be excluded, but now they look absurd. The last time bitcoin grew to $20,000, predictions were made with numbers and $200,000 and even more for a single BTC coin. After that, Bitcoin fell to $ 3,000 per coin. This is what makes bitcoin the most unattractive tool for preserving the value of money from all existing ones. An asset that can rise in price by 5-10 times in a short period of time and in the same way fall in price, can only attract investors to "wait a few years" and with the hope that bitcoin will grow to just $ 50,000. But no sane investor will store his savings in cryptocurrencies if his goal is to save money. Therefore, I believe that bitcoin is very much overrated. At the current time, this is an HYIP technology, on which many want and try to earn. The advantage of bitcoin over fiat money is only one – anonymity. But anonymity is not necessary for those who do not suppress the laws. Therefore, many ordinary citizens do not need bitcoin as a means of payment. Especially – given its fluctuations in value. The Fibo grid is based on the extremes of July 2, 2019, and July 10, 2019. Forecast for Bitcoin and trading recommendations: Bitcoin has completed the consolidation above the correction level of 100.0% ($9679). Thus, I recommend buying cryptocurrency with the target of $10478, with the stop-loss order below the level of 100.0%. I recommend selling bitcoin with the target of $8744, and with the stop-loss order above the level of $9558, if the closure is performed under the correction level of 38.2%. The material has been provided by InstaForex Company - www.instaforex.com |
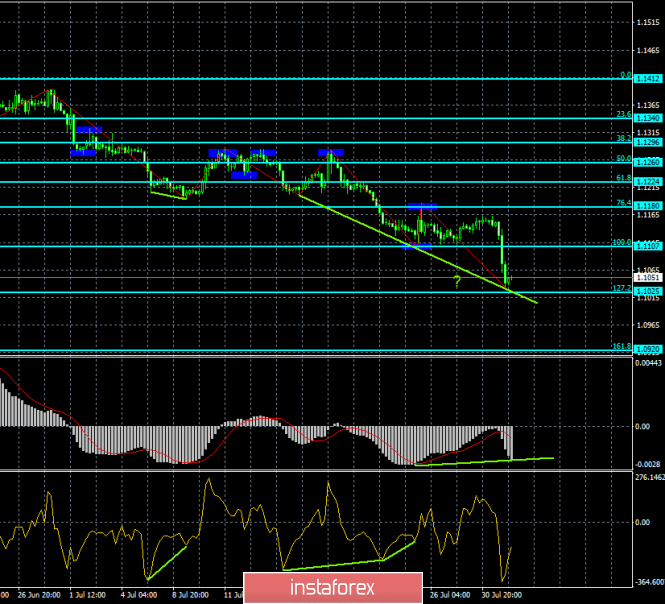
| Posted: 01 Aug 2019 06:28 AM PDT EUR/USD – 4H.
As seen on the 4-hour chart, the EUR/USD pair performed a reversal in favor of the US dollar and strengthened under the correction level of 100.0% (1.1107). Thus, on August 1, the process of falling quotes of the euro/dollar pair continues in the direction of the correction level of 127.2% (1.1025). A new fall of the euro began after yesterday's evening summing up the Fed meeting. If there were no questions with the rate, it was lowered by 25 points, then there were many surprises with the speech of the Fed Chairman Jerome Powell. It's hard to say that traders were expecting a particular kind of rhetoric. Rather, they were ready to react to what Powell would say. And Powell, contrary to expectations of statements on the increased risks, the regulator's willingness to reduce rates in the future, reported that the current easing of monetary policy can be an isolated case that no course on systematic lowering of a rate is present, and at future meetings of Fed the question of reduction of a rate won't be put automatically. That is, the Fed will consider the current situation, economic indicators, analyze everything and make a decision on the rate based on the findings. It is obvious that if the economic situation in the country worsens, inflation and GDP fall, and Trump continues to fight with China, it can lead to a new weakening of monetary policy, but so far this is out of the question. The rebound of quotations from the Fibo level of 127.2% (1.1025) may work in favor of the euro and some growth in the direction of the correction level of 100.0% (1.1107). The Fibo grid is built on the extremes of May 23, 2019, and June 25, 2019. Forecast for EUR/USD and trading recommendations: The EUR/USD pair performed a fall towards the correction level of 127.2% (1.1025). I recommend selling the pair today with the target of 1.0920, with the stop-loss order above the level of 1.1025, if the closing is performed under the level of 127.2%. I recommend buying the pair with the target of 1.1107, and with the stop-loss order at the level of 1.1025, if the rebound from the correction level of 127.2% is performed, especially in conjunction with the bullish divergence. GBP/USD – 4H.
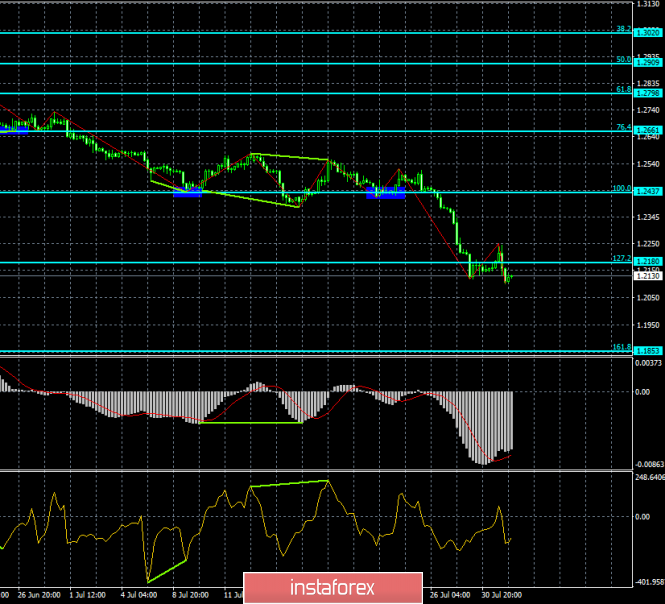
The GBP/USD pair performed the second consolidation under the correction level of 127.2% (1.2180) and reacted very indirectly to the results of the Fed meeting held on July 30-31. The word Brexit does not leave the front pages of news feeds, and Forex traders continue to be most concerned about this process. But unfortunately for the UK, the country is moving at full speed into a "black hole". Now, it is even difficult to imagine what will be the loss of the economy, if the plan with a tough Brexit will be implemented by Boris Johnson? Expert agencies say about the loss of about 10% of GDP in the coming years. However, it is impossible to calculate all the losses (not only financial). Just in the last two days, it was reported that Northern Ireland and Scotland could organize their independence referendums and leave the United Kingdom. This will be another blow to the British economy. Thus, now Brexit seems to be not the only problem of the British. For itself, it can entail a range of problems that will load the work of the government for many years. A pound sterling, in the long run, maybe cheaper than the US dollar. Today, by the way, the Bank of England will hold a meeting. Traders do not expect any changes in monetary policy, but Mark Carney's speech can affect the mood of the currency market. The Fibo grid is built on the extremes of January 3, 2019, and March 13, 2019. GBP/USD – 1H.
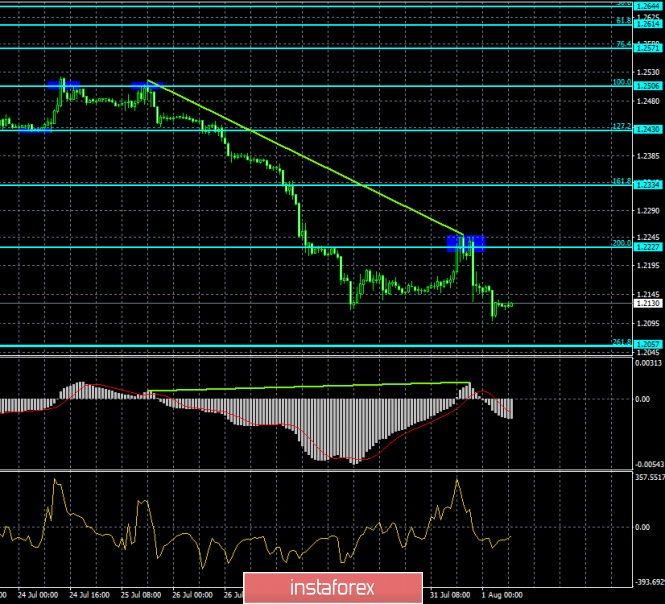
As seen on the hourly chart, the pound/dollar pair rebounded from the Fibo level of 200.0% (1.2227) with the formation of a bearish divergence at the MACD indicator, a turn in favor of the US currency and the beginning of a fall in the direction of the correction level of 261.8% (1.2057). The rebound of the pound/dollar pair from the correction level of 261.8% will allow traders to count on a turn in favor of the pound sterling and some growth in the direction of the Fibo level of 200.0%. The Fibo grid is based on the extremes of June 18, 2019, and June 25, 2019. Forecast for GBP/USD and trading recommendations: The GBP/USD pair continues the process of falling. Thus, I recommend selling the pair with a target of 1.2057, with the stop-loss order above the level of 1.2227. I recommend buying the pair with the target of 1.2227 and stop-loss order under the level of 261.8% (hourly chart) if it will be rebounded from the level of 1.2057. The material has been provided by InstaForex Company - www.instaforex.com |
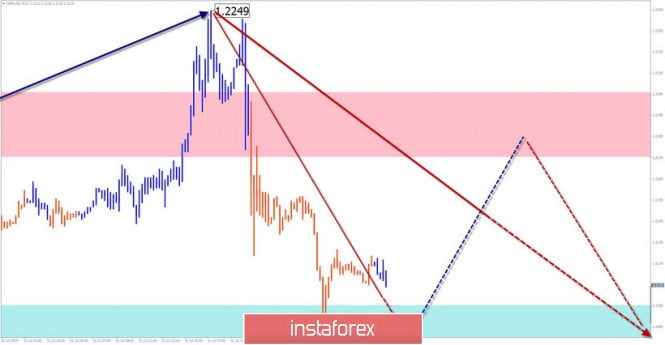
| Simplified wave analysis and forecast for GBP/USD and USD/JPY on August 1 Posted: 01 Aug 2019 06:28 AM PDT GBP/USD On the chart of the British pound, the main trend wave has reached a powerful support zone, in which there are several levels of a large scale. The structure of the downward wave that began in March looks complete, but there are no reversal signals on the chart yet. The flat area of the last 2 days began to form an intermediate correction in the form of an expanding triangle. Forecast: Today, the most likely scenario for the price movement of the pair will be a flat in the side corridor, between the opposite zones. After an attempt to put pressure on the support, a general upward vector of price fluctuations is expected. Recommendations: The pound market is dominated by bearish sentiment and trading against the trend is possible only in the intra-session style. The lot should be reduced as much as possible. It is safer to refrain from trading during the rollback period and look for the sell signals of the instrument at its end. Resistance zone: - 1.2180/1.2210 Support zone: - 1.2110/1.2080
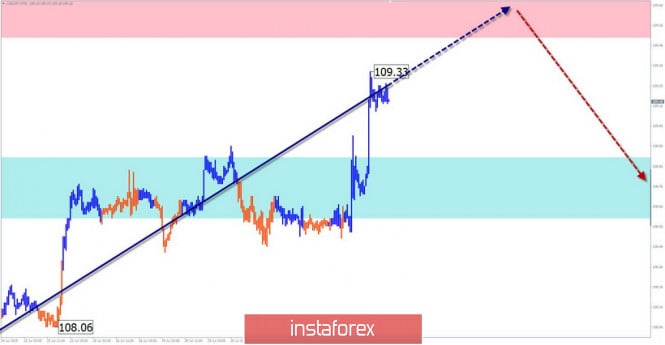
USD/JPY The direction of the price movement of the yen in recent months is linked to the algorithm of the bullish wave from June 21. Since July 18, its final section has started. The price is approaching the lower limit of the preliminary target zone. Forecast: In the first half of the day, an upward vector of movement is expected today, until the completion of the entire current rise. Towards the end of the day, you can wait for the formation of a turn and the beginning of the depreciation. Recommendations: Before the appearance of clear signals of a reversal, the pair is premature. When buying yen, one should be careful because of the small range of the expected rise. Resistance zone: - 109.50/109.80 Support zone: - 108.90/108.60
Explanations to the figures: Waves in the simplified wave analysis consist of 3 parts (A-B-C). The last unfinished wave is analyzed. Zones show areas with the highest probability of reversal. The arrows indicate the wave marking according to the method used by the author, the solid background is the formed structure, the dotted ones are the expected movements. Note: The wave algorithm does not take into account the duration of tool movements over time. The material has been provided by InstaForex Company - www.instaforex.com |
| Trading plan for EURUSD on 08/01/2019 Posted: 01 Aug 2019 06:27 AM PDT
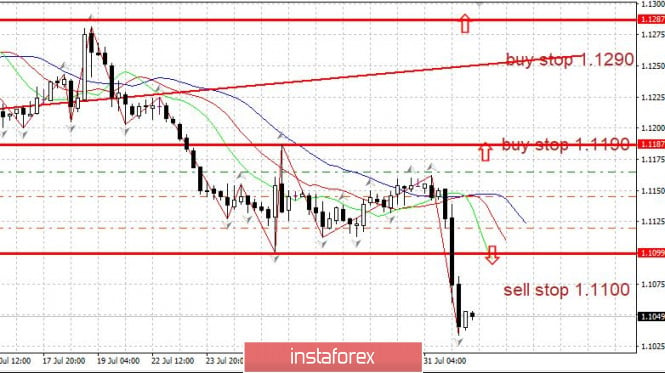
The EURUSD pair fell sharply against the background of the US Federal Reserve decision to lower the rate by 0.25% This is quite paradoxical from the point of view of the classical "foundation" because the reduction of the Central Bank's rate should lead to a weakening of the currency in which the rate is reduced (in this case, the dollar should have weakened). The only thing that can be said, perhaps, the market was waiting for a clear statement about the new rate cuts. However, the US economy is still in good shape, economic growth, and employment. And there is no reason for a cycle of rate cuts. The economy is the apparent weakening of the eurozone and the ECB is also said to lower rates. At the same time, the EURUSD rate is already quite low, so that the fall is too big. EURUSD: Technically, a break below 1.1100 and the close of the day below this level is a strong signal for a downward trend. Sell euros from 1.1075 and above. In the case of a bullish reversal, we buy from 1.1165. The material has been provided by InstaForex Company - www.instaforex.com |
| Posted: 01 Aug 2019 06:27 AM PDT 4-hour timeframe
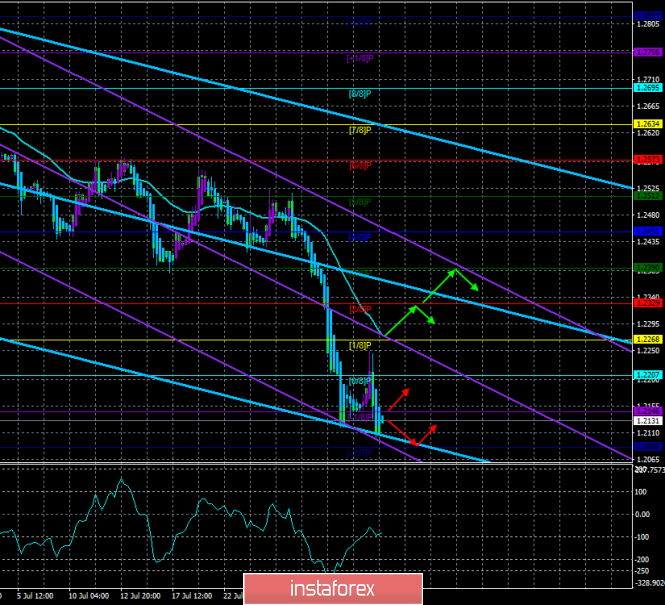
Technical data: The upper linear regression channel: direction – down. The lower linear regression channel: direction – down. The moving average (20; smoothed) – down. CCI: -80.7595 If the euro fell down immediately after the announcement of the results of the Fed meeting and Powell's speech, then the pound unexpectedly slightly adjusted upwards and only after that began to fall. Because of this small breakthrough, the British currency did not even lose too many positions against the dollar on July 31, but the downward trend for the GBP/USD pair, of course, is preserved. We already said yesterday that, in principle, the Fed meeting for the pound is not an important event. Now, traders are interested only in data on Brexit, which remains about 90 days. What can the new UK government do in 90 days? From our point of view, only the most soundly prepare for the exit from the EU. And the preparation is already in full swing. The head of the Treasury Sajid Javid announced the allocation of an additional 2.1 billion pounds for various needs in preparation for Brexit. Meanwhile, immediately after the speech of Scottish Minister Nicola Sturgeon on the need and preparation for the referendum on independence, a similar statement was made by the leader of the Irish Republican party, Mary Lou McDonald. She said that she did not know how the British government would be able to maintain the unity of the peoples of Northern Ireland and Ireland and prevent the emergence of a rigid border between these States. McDonald also said that Northern Ireland is seeking back to the European Union. Thus, the UK may lose both Scotland and Northern Ireland, which in the referendum of 2016 voted in the majority against leaving the European Union. Well, the pound/dollar pair continues to be in a downward movement, as evidenced by the blue bars of Heiken Ashi. Nearest support levels: S1 – 1.2085 Nearest resistance levels: R1 – 1.2146 R2 – 1.2207 R3 – 1.2268 Trading recommendations: The GBP/USD pair resumed its downward movement, so now it is still recommended to sell the pound sterling with the target of 1.2085, before the new turn of the Heiken Ashi indicator upwards. The initiative in the market continues to remain in the hands of bears. It will be possible to buy the pound/dollar pair with the goals of 1.2329 and 1.2390 not earlier than the price consolidation above the moving average line. However, in the coming days, such a development is not expected. In addition to the technical picture should also take into account the fundamental data and the time of their release. Explanation of illustrations: The upper linear regression channel – the blue line of the unidirectional movement. The lower linear regression channel – the purple line of the unidirectional movement. CCI – the blue line in the indicator regression window. The moving average (20; smoothed) is the blue line on the price chart. Murray levels – multi-colored horizontal stripes. Heiken Ashi is an indicator that colors bars in blue or purple. The material has been provided by InstaForex Company - www.instaforex.com |
| Posted: 01 Aug 2019 06:27 AM PDT 4-hour timeframe
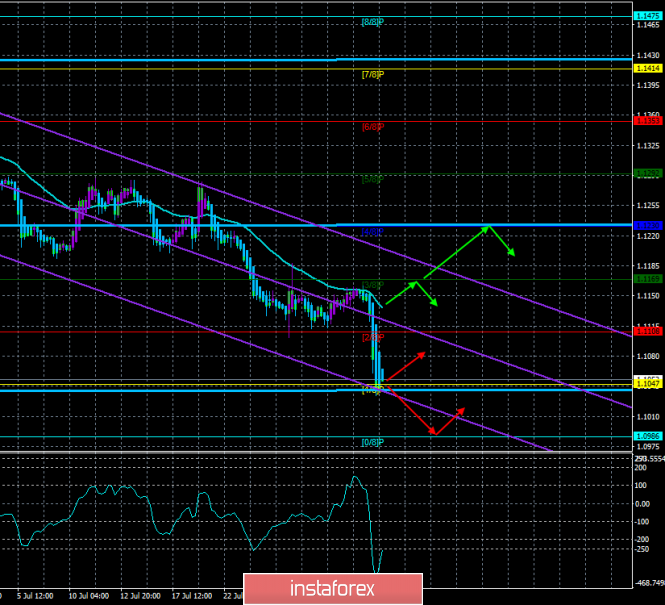
Technical data: The upper linear regression channel: direction – sideways. The lower linear regression channel: direction – down. The moving average (20; smoothed) – down. CCI: -258.0041 Yesterday morning, we wrote that the performance of Jerome Powell will be more important than the Fed's decision on rates, which traders have long taken into account in the quotes of the EUR/USD pair. Powell's speech was short and he told the foreign exchange market that there was no question of a long course of lowering rates. That is, the current easing of monetary policy by 0.25% – on the one hand, a forced measure because of the growing global risks, the trade war with China, as well as insufficient inflation, and on the other – a preventive and stimulating measure. However, the Fed is not going to use this method on a regular basis in 2019. Another rate cut this year is possible, but it will depend on the fundamental factors that the Fed fears. In the case of improvement of macroeconomic indicators, de-escalation of the trade conflict with China, reduction of geopolitical tension and global risks, there will be no reason for another reduction of the key rate. In general, Powell made it clear that he was not talking about Donald Trump, who immediately commented on his decision on the Fed's decision to lower the rate, which led to a further increase in the dollar. He said that Powell disappointed him again, but at least completed the period of tightening monetary policy, which did not need to start. Also, Trump complained that the support from the Fed "he apparently did not get." Well, the euro/dollar pair reacted with a drop of 1 cent on the last day of July. Nearest support levels: S1 – 1.1047 S2 – 1.0986 S3 – 1.0925 Nearest resistance levels: R1 – 1.1108 R2 – 1.1169 R3 – 1.1230 Trading recommendations: The EUR/USD currency pair resumed its downward trend after the performance of Jerome Powell. On August 1, therefore, it is recommended to continue selling the euro/dollar pair with the targets of 1.1047 and 1.0986, until the reversal of the Heiken Ashi indicator to the top. It is recommended to buy the euro/dollar in small lots when the bulls manage to gain a foothold above the moving average line, with the first target Murray level of "4/8" - 1.1230. In addition to the technical picture should also take into account the fundamental data and the time of their release. Explanation of illustrations: The upper linear regression channel – the blue line of the unidirectional movement. The lower linear regression channel – the purple line of the unidirectional movement. CCI – the blue line in the indicator window. The moving average (20; smoothed) is the blue line on the price chart. Murray levels – multi-colored horizontal stripes. Heiken Ashi is an indicator that colors bars in blue or purple. The material has been provided by InstaForex Company - www.instaforex.com |
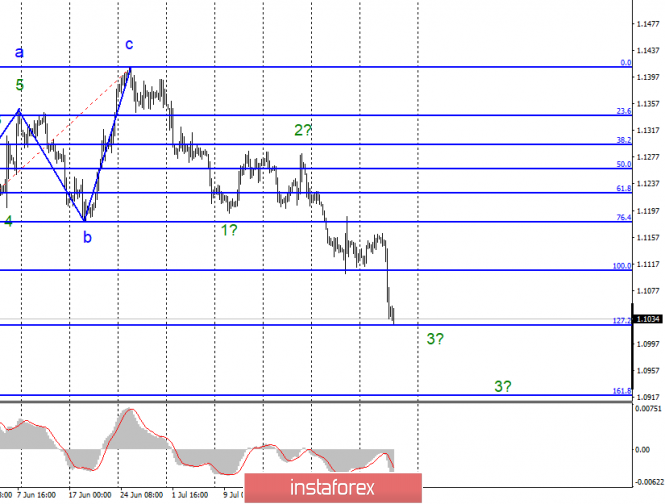
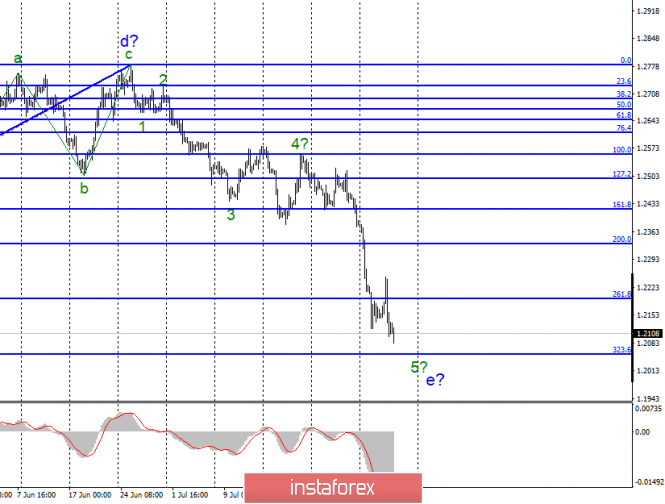
| Posted: 01 Aug 2019 05:52 AM PDT EUR / USD pair On Wednesday, July 31, the EUR/USD pair ended by a decrease of 80 basis points. Such reaction of the foreign exchange market was due to the Fed's decision to lower the key rate by 0.25%, as well as the speech of Fed Chairman Jerome Powell, who hinted that in the future there might be no new rate cuts. Everything will depend on the political and economic situation in the world, as well as on US economic indicators. Thus, the markets "heard" the Fed's unwillingness to immediately and systematically reduce the rate Donald Trump wants. The Federal Reserve has once again demonstrated its independence from the American president. Trump can somehow criticize the Fed but will not do in the wake of Trump. Today, the eurozone business activity index in the industrial sector has already been released. Although its value has exceeded market expectations (46.5 vs. 46.4), it still remains far below the level of 50.0, which is a determining trend in a particular area. Thus, the value of 46.5 allows concluding about the decline in the manufacturing sector of the European Union. An unsuccessful attempt to break through the level of 127.2% Fibonacci may lead to a departure of quotes from the lows reached. Purchase targets: 1.1412 - 0.0% Fibonacci Sales targets: 1.1025 - 127.2% Fibonacci 1.0920 - 161.8% Fibonacci General conclusions and trading recommendations: The euro/dollar pair continues to build the downward trend, which lowers the sentiment in the Forex market remains. Thus, I recommend selling the pair with targets located near 1.1025 and 1.0920, equating to 127.2% and 161.8% Fibonacci. An unsuccessful attempt to break the 1.1025 mark could lead to the construction of a correction wave. GBP / USD pair On July 31, the GBP/USD pair "managed" to add a few base points, while, for example, the euro/dollar dropped by 80. However, the wave pattern of the pound's unexpected behavior is not broken as the instrument still resumed building a downward wave, which may be the fifth part of the fifth wave of the downward trend. If this is true, then an unsuccessful attempt to break through the 323.6% Fibonacci level can lead to a departure of quotes from the reached minimums and the beginning of building at least three waves upward. At the same time, the news for the pound sterling is not in his favor. Just half an hour ago, the results of the meeting of the Bank of England became known, wherein the monetary policy did not change and the rate remained the same. Furthermore, we can only expect disappointment in the speech of the head of the Bank of England. The hopes of the pound are now associated only with those. Purchase targets: 1.2783 - 0.0% Fibonacci Sales targets: 1.2056 - 323.6% Fibonacci 1.1830 - 423.6% Fibonacci General conclusions and trading recommendations: The wave pattern of the pound/dollar tool now implies a complication of the downward trend. Thus, I recommend selling the pair for each downward signal on MACD with targets located near the estimated level of 1.2056. In the case of a successful attempt to break through, targets will likely be around 1.1830, which corresponds to 423.6% Fibonacci. The material has been provided by InstaForex Company - www.instaforex.com |
| You are subscribed to email updates from Forex analysis review. To stop receiving these emails, you may unsubscribe now. | Email delivery powered by Google |
| Google, 1600 Amphitheatre Parkway, Mountain View, CA 94043, United States | |




No comments:
Post a Comment