
Forex analysis review |
- Fractal analysis of the main currency pairs on August 13
- AUD / USD vs USD / CAD vs NZD / USD vs #USDX. Comprehensive analysis of movement options from August 13, 2019 APLs &
- Will the dollar manage to protect itself?
- Leading US investment banks forecast gold rally up to $2000 per ounce
- Analysts: a sharp rise in the price of Bitcoin is alarming
- Pound sales may resume
- Italy pulls down the euro again, while the pound tries to grab hold of a straw
- Sale of AUD/USD continues: the pair is testing the level of 0.6750
- USD/JPY. Trade War, Brexit and Italy: The yen could strengthen to 104.65
- Brent cannot find a foothold
- Pound throws a towel into the ring
- August 12, 2019 : EUR/USD technical analysis; Another episode of bearish rejection is being demonstrated around 1.1235.
- AUDUSD pulls back to important short-term Fibonacci retracement
- EURUSD still trapped inside trading range
- Gold follows our expected path but still no break out
- BTC 08.12.2019 - Potential completion of ABC downwrad correction
- Gold 08.12.2019 - Completed ABC downward correction, re-load long positions
- August 12, 2019 : GBP/USD Intraday technical analysis and trade recommendations.
- GBP/USD 08.012.2019 -Strong resistance at the price of 1.2100 on the test
- Technical analysis of EUR/USD for August 12, 2019
- Difficult times await the pound/franc – UBS
- Strong yen demand continues, USD/JPY to test 105.00
- Positive returns: AUD and NZD get respite and go to the side range
- Simplified wave analysis and forecast for EUR/USD and AUD/USD on August 12
- EUR/USD: a preview of the week
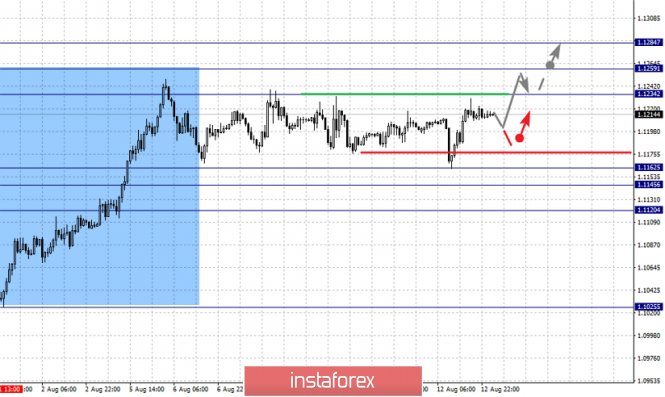
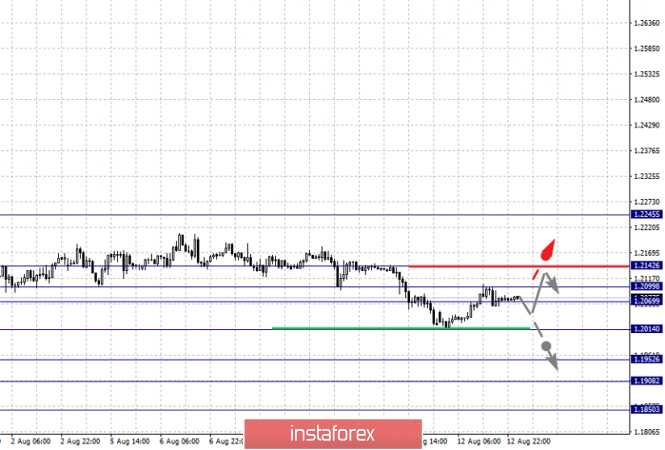
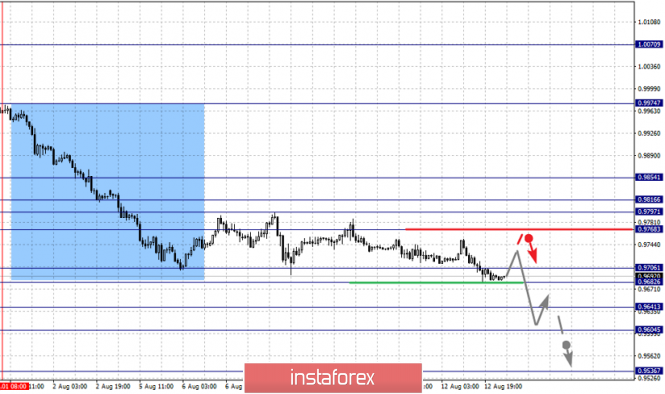
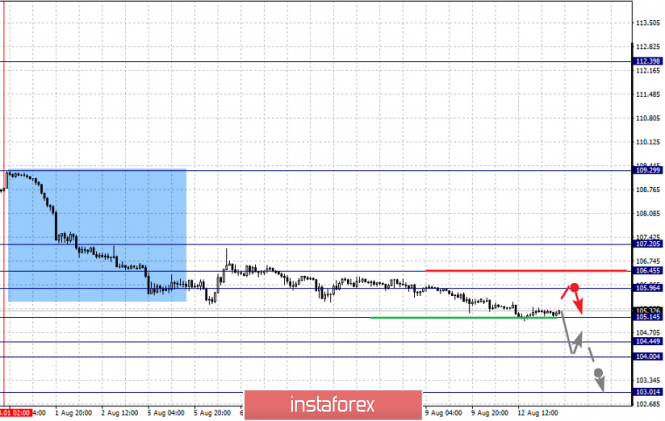
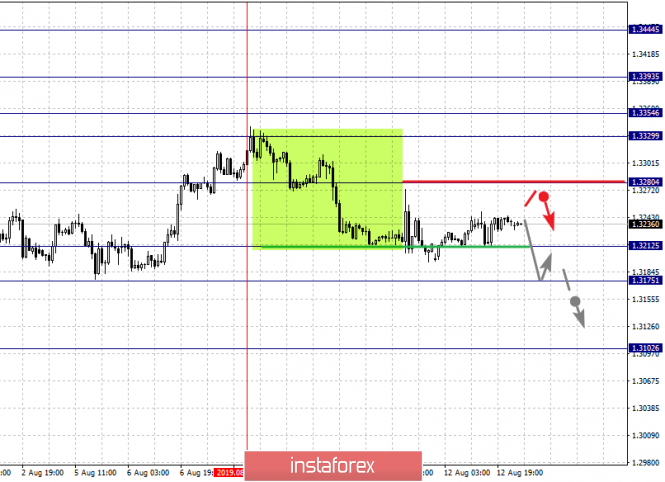
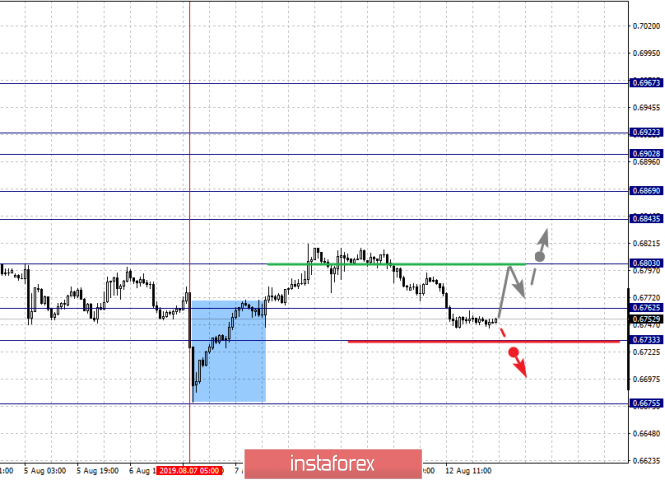
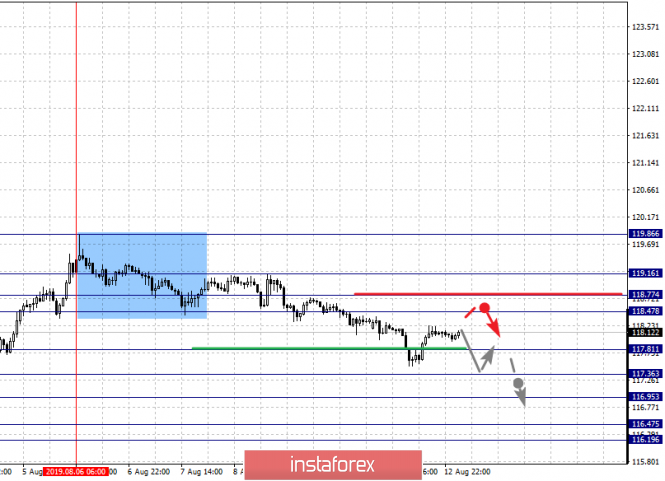
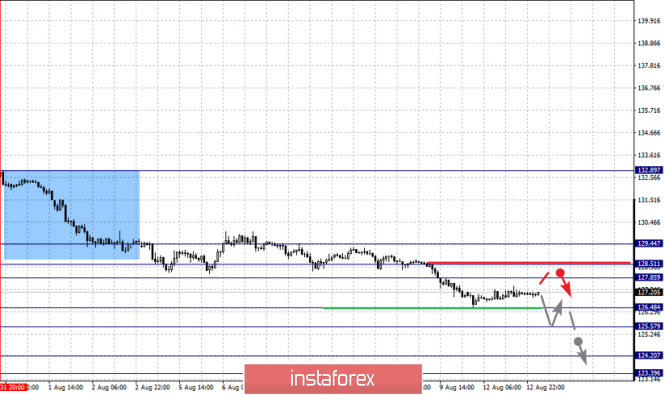
| Fractal analysis of the main currency pairs on August 13 Posted: 12 Aug 2019 05:19 PM PDT Forecast for August 13: Analytical review of currency pairs on the scale of H1: For the euro / dollar pair, the key levels on the H1 scale are: 1.1284, 1.1259, 1.1234, 1.1162, 1.1145 and 1.1120. Here, the price is in the correction zone from the medium-term ascending structure on August 1. The continuation of the upward trend is possible after the breakdown of the level of 1.1234. In this case, the target is 1.1259. For the potential value for the top, we consider the level of 1.1284. Upon reaching which, we expect consolidation, as well as a pullback to the bottom. Short-term downward movement is possibly in the range of 1.1162 - 1.1145. The breakdown of the last value will lead to a long correction. Here, the goal is 1.1120. This level is a key support for the top. The main trend is the medium-term upward structure from August 1, the correction stage. Trading recommendations: Buy 1.1234 Take profit: 1.1258 Buy 1.1261 Take profit: 1.1284 Sell: 1.1162 Take profit: 1.1146 Sell: 1.1144 Take profit: 1.1122 For the pound / dollar pair, the key levels on the H1 scale are: 1.2142, 1.2099, 1.2069, 1.2014, 1.1952, 1.1908 and 1.1850. Here, we follow the downward cycle of July 31. The continuation of the movement to the bottom is expected after the breakdown of the level of 1.2014. In this case, the target is 1.1952. Short-term downward movement, as well as consolidation is in the range of 1.1952 - 1.1908. For the potential value for the bottom, we consider the level of 1.1850. Upon reaching this level, we expect a pullback to the top. Short-term upward movement is possibly in the range of 1.2069 - 1.2099. The breakdown of the last value will lead to a long correction. Here, the target is 1.2142. This level is a key support for the downward structure. The main trend is the downward cycle of July 31. Trading recommendations: Buy: 1.2069 Take profit: 1.2097 Buy: 1.2100 Take profit: 1.2140 Sell: 1.2012 Take profit: 1.1954 Sell: 1.1950 Take profit: 1.1910 For the dollar / franc pair, the key levels on the H1 scale are: 0.9854, 0.9816, 0.9797, 0.9768, 0.9706, 0.9682, 0.9641, 0.9604 and 0.9536. Here, we follow the medium-term descending structure of August 1. The continuation of the movement to the bottom is expected after the price passes the noise range 0.9706 - 0.9682. In this case, the target is 0.9641. Short-term downward movement, as well as consolidation is in the range of 0.9641 - 0.9604. The breakdown of the level of 0.9604 should be accompanied by a pronounced downward movement. Here, the potential target is 0.9536. The departure for correction is expected after the breakdown of the level of 0.9768. Here, the first goal is 0.9797. Short-term upward movement is possibly in the range of 0.9797 - 0.9816. The breakdown of the latter value will lead to the formation of initial conditions for the upward cycle. Here, the target is 0.9854. The main trend is the descending structure of August 1. Trading recommendations: Buy : 0.9768 Take profit: 0.9797 Buy : 0.9818 Take profit: 0.9852 Sell: 0.9680 Take profit: 0.9641 Sell: 0.9638 Take profit: 0.9605 For the dollar / yen pair, the key levels on the scale are : 107.20, 106.45, 105.96, 105.14, 104.44, 104.00 and 103.01. Here, we follow the descending structure of August 1. The continuation of the movement to the bottom is expected after the breakdown of the level of 105.14. In this case, the target is 104.44. Price consolidation is in the range of 104.44 - 104.00. For the potential value for the bottom, we consider the level of 103.01. The movement to which is expected after the breakdown of the level of 104.00. Short-term downward movement is possibly in the range of 105.96 - 106.45. The breakdown of the last value will lead to an in-depth correction. Here, the goal is 107.20. This level is a key support for the downward structure. Main trend: descending structure of August 1. Trading recommendations: Buy: 105.96 Take profit: 106.43 Buy : 106.46 Take profit: 107.20 Sell: 105.13 Take profit: 104.46 Sell: 104.00 Take profit: 103.05 For the Canadian dollar / US dollar pair, the key levels on the H1 scale are: 1.3444, 1.3393, 1.3354, 1.3329, 1.3280, 1.3212, 1.3175 and 1.3102. Here, the price is in deep correction from the upward structure on July 31 and forms the potential for the downward movement from August 7. The breakdown of the level of 1.3212 will lead to the formation of expressed initial conditions for the downward cycle. In this case, the potential target is 1.3175. Price consolidation is near this level. The continuation of movement to the top is possible after the breakdown of the level of 1.3280. In this case, the first target is 1.3329. Consolidation is in the range of 1.3329 - 1.3354. The breakdown of the level of 1.3355 should be accompanied by a pronounced upward movement. Here, the target is 1.3393. The main trend is the local ascending structure of July 31, the stage of deep correction. Trading recommendations: Buy: 1.3280 Take profit: 1.3329 Buy : 1.3355 Take profit: 1.3392 Sell: 1.3212 Take profit: 1.3178 Sell: 1.3173 Take profit: 1.3105 For the Australian dollar / US dollar pair, the key levels on the H1 scale are : 0.6967, 0.6922, 0.6902, 0.6869, 0.6843, 0.6803, 0.6762, 0.6733 and 0.6675.Here, we are following the development of the ascending structure from August 7. At the moment, the price is in deep correction. The development of this structure is is expected to be cancelled after the breakdown of the level of 0.6733. In this case, the potential target is 0.6675. The continuation of the upward movement is possible after the breakdown of the level of 0.6803. In this case the first target is 0.6843. Short-term upward movement, as well as consolidation is in the range of 0.6843 - 0.6869. The breakdown of the level of 0.6870 should be accompanied by a pronounced upward movement. Here, the target is 0.6902. Consolidation is in the range of 0.6902 - 0.6922. For the potential value for the top, we consider the level of 0.6967. Upon reaching which, we expect a pullback to the bottom. The main trend is the formation of initial conditions for the ascending cycle of August 7, the stage of deep correction. Trading recommendations: Buy: 0.6805 Take profit: 0.6840 Buy: 0.6844 Take profit: 0.6867 Sell : 0.6730 Take profit : 0.6680 For the euro / yen pair, the key levels on the H1 scale are: 119.16, 118.77, 118.47, 117.81, 117.36, 116.95, 116.47 and 116.19. Here, we follow the descending structure of August 6th. The continuation of the movement to the bottom is expected after the breakdown of the level of 117.81. Here, the goal is 117.36. Short-term downward movement, as well as consolidation is in the range of 117.36 - 116.95. The breakdown of the level of 116.95 should be accompanied by a pronounced movement towards a potential target - 116.19. Consolidation is in the range of 116.47 - 116.19. Short-term upward movement is possibly in the range of 118.47 - 118.77. The breakdown of the last value will lead to an in-depth correction. Here, the goal is 119.16. This level is the key support for the descending structure of August 6. The main trend is the descending structure of August 6th. Trading recommendations: Buy: 118.48 Take profit: 118.75 Buy: 118.78 Take profit: 119.14 Sell: 117.80 Take profit: 117.38 Sell: 117.34 Take profit: 116.97 For the pound / yen pair, the key levels on the H1 scale are : 129.44, 128.51, 127.85, 126.48, 125.57, 124.20 and 123.39. Here, we follow the local descending structure of July 31. Short-term downward movement is expected in the range of 126.48 - 125.57. The breakdown of the last value should be accompanied by a pronounced downward movement, Here, the target is 124.20. For the potential value for the bottom, we consider the level of 123.39. Upon reaching which, we expect consolidation, as well as a rollback to the top. Short-term upward movement is possibly in the range of 127.85 - 128.51. The breakdown of the last value will lead to a long correction. Here, the goal is 129.44. This level is a key support for the downward structure. The main trend is the local descending structure of July 31. Trading recommendations: Buy: 127.85 Take profit: 128.50 Buy: 128.53 Take profit: 129.42 Sell: 126.45 Take profit: 125.58 Sell: 125.53 Take profit: 124.25 The material has been provided by InstaForex Company - www.instaforex.com |
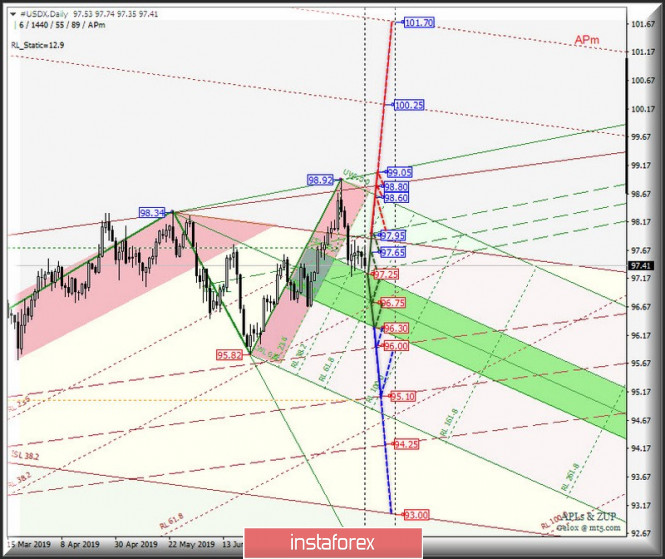
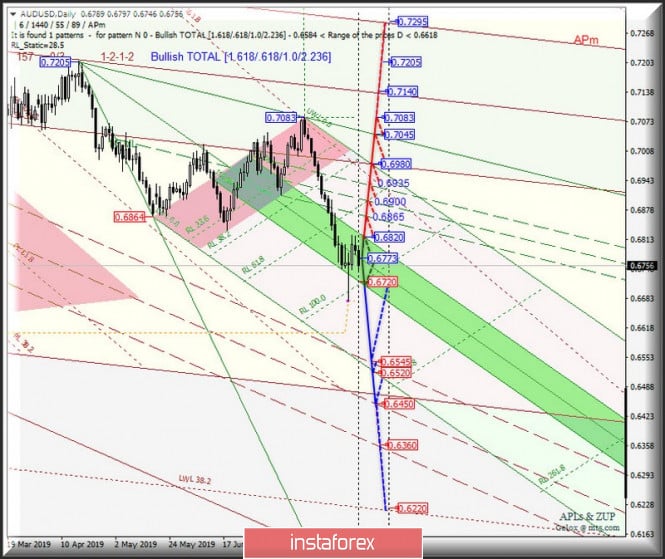
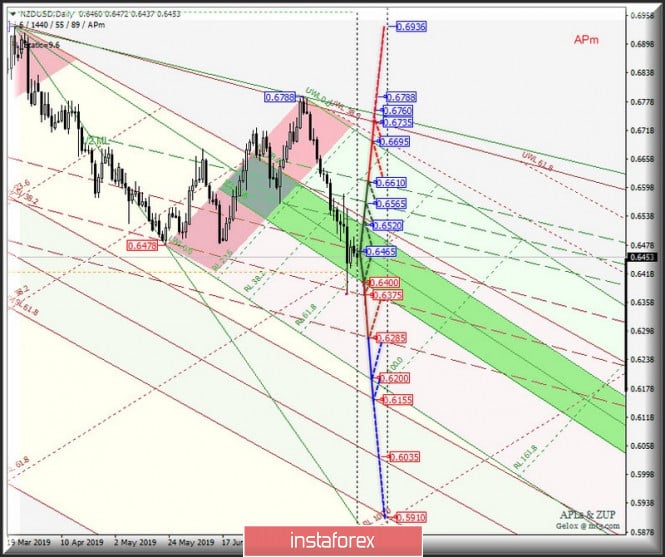
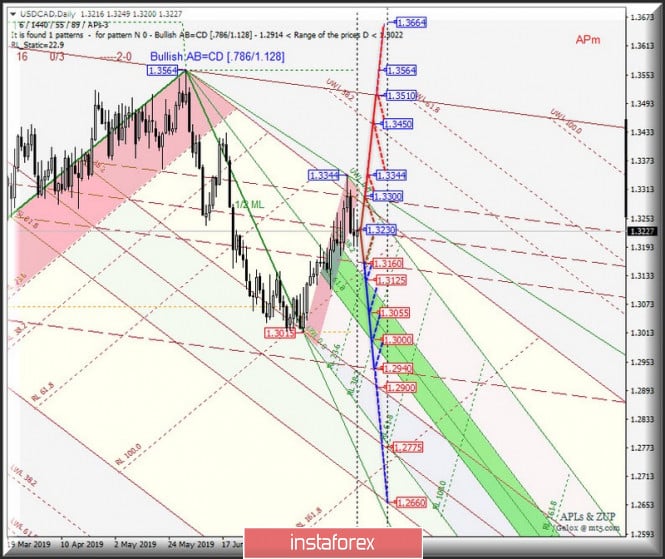
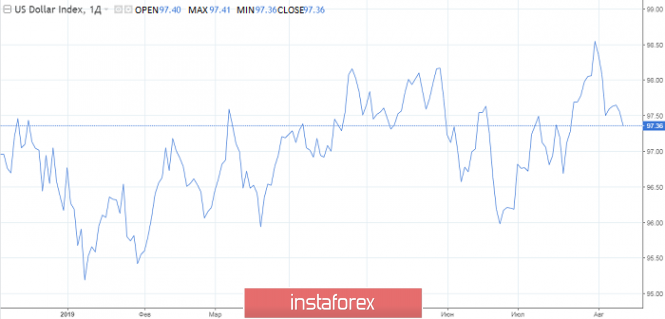
| Posted: 12 Aug 2019 05:19 PM PDT Minor operational scale (H4) Let's consider the comprehensive analysis of the development options for the movement of currency instruments AUD / USD vs USD / CAD vs NZD / USD vs #USDX (based on the results of the first half of August) from August 13, 2019 on the Minor operational scale (daily timeframe). ____________________ US dollar Index From August 13, 2019, the development of the movement of the dollar index #USDX will be determined by the development and the direction of the breakdown of the boundaries of the 1/2 Median Line channel (97.95 - 97.65 - 97.25) of the Minuette operational scale fork. We look at the movement graphics within this channel on the animation chart. The breakdown of the support level of 97.25 on the lower boundary of the 1/2 channel of the Median Line Minuette will determine the development of the movement of the dollar index in the equilibrium zone (97.25 - 96.75 - 96.30) of the Minuette operational scale fork with the prospect of reaching the upper limit (96.00) of the 1/2 Median Line channel of the Minor operational scale (95.10). On the other hand, if the upper boundary (resistance level of 97.95) is broken through the 1/2 Median Line channel of the Minuette operational scale fork, the upward movement of #USDX can be continued to the targets - the initial line SSL Minuette (98.60) - the control line UTL (98.80) of the Minor operational scale fork - the control line UTL Minuette (99.05). The markup of #USDX movement options from August 13, 2019 is shown in the animated chart. ____________________ Australian dollar vs US dollar The development of the movement of the Australian dollar/ US dollar (AUD / USD) from August 13, 2019 will be due to the development and direction of the breakdown of the boundaries of the equilibrium zone (0.6820 - 0.6773 - 0.6720) of the Minuette operational scale fork. The details of the movement inside the equilibrium zone are shown in the animation chart. The breakdown of the upper boundary of ISL38.2 (resistance level of 0.6820) of the equilibrium zone of the Minuette operational scale fork will determine the development of the movement of the Australian dollar to the boundaries of the 1/2 Median Line Minuette channel (0.6865 - 0.6900 - 0.6935), and if breakdown of the upper boundary (0.6935) of this channel will happen, the continuation of the upward movement towards the targets is possible - the lower boundary of the ISL61.8 (0.6980) equilibrium zone of the Minor operational scale fork - the control line UTL Minuette (0.7045) - local maximum 0.7083. In the event of a breakdown of the lower boundary of ISL61.8 (support level of 0.6720) of the equilibrium zone of the Minuette operational scale fork, there will be a continuation of the downward movement of AUD / USD to the boundaries of the 1/2 Median Line channel (0.6545 - 0.6450 - 0.6360) of the Minor operational scale fork. From August 13, 2019, we look at the layout of the AUD / USD movement options in the animated chart. ____________________ New Zealand dollar vs US dollar The development and direction of the breakdown of the boundaries of the equilibrium zone (0.6520 - 0.6465 - 0.6400) of the Minuette operational scale will determine the development of the movement of the New Zealand dollar/US dollar (NZD / USD) in August 2019. The movement markings in the 1 / 2 Median Line Minuette channel are indicated in the animation chart. The breakdown of the resistance level of 0.6520 at the upper boundary of the ISL38.2 equilibrium zone of the Minuette operational scale fork will make the development of the NZD / USD movement in the 1/2 Median Line Minuette channel (0.6520 - 0.6565 - 0.6610) relevant with the prospect of reaching the SSL Minuette start line (0.6695) and the control line UTL (0.6735) Minor operating scale fork. Meanwhile, if the breakdown of the lower boundary of ISL61.8 (support level of 0.6585) of the equilibrium zone of the Minuette operational scale fork takes place, then the downward movement of the New Zealand dollar/US dollar will be directed to the targets - 1/2 Median Line Minor (0.6375) - the lower boundary of the 1/2 Median Line Minor channel (0.6285) - the end line of SSL Minuette (0.6200). We look at the layout of the NZD / USD movement options from August 13, 2019 in the animated chart. ____________________ US dollar vs Canadian dollar The development and direction of the breakdown of the boundaries of the 1/2 Median Line channel (1.3300 - 1.3230 - 1.3160) of the Minor operational scale will determine the development of the movement of the USD / CAD from August 13, 2019. The details of the movement inside this channel are shown in the animation chart. The breakdown of the lower boundary of the 1/2 Median Line channel (support level of 1.3160) of the Minor operational scale fork will allow the downward movement of the Canadian dollar to continue towards the boundaries of the equilibrium zone (1.3125 - 1.3055 - 1.3000) of the Minuette operational scale fors with the prospect of reaching the final Schiff Line Minor (1.2940). As a result of the breakdown of the resistance level of 1.3300 (the upper boundary of the 1/2 Median Line channel of the Minor operational scale fork), it will become possible to continue the upward movement of USD / CAD to the targets - local maximum 1.3344 - warning line UWL38.2 Minor (1.3450) - control line UTL Minor (1.3510). From August 13, 2019, we are looking at the markup of the USD / CAD movement options in the animated chart. ____________________ The review is made without taking into account the news background. The opening of trading sessions of the main financial centers does not serve as a guide to action (placing orders "sell" or "buy"). The formula for calculating the dollar index: USDX = 50.14348112 * USDEUR0.576 * USDJPY0.136 * USDGBP0.119 * USDCAD0.091 * USDSEK0.042 * USDCHF0.036. where the power coefficients correspond to the weights of the currencies in the basket: Euro - 57.6%; Yen - 13.6%; Pound Sterling - 11.9%; Canadian dollar - 9.1%; Swedish Krona - 4.2%; Swiss franc - 3.6%. The first coefficient in the formula leads the index to 100 at the start date of the countdown - March 1973, when the main currencies began to be freely quoted relative to each other. The material has been provided by InstaForex Company - www.instaforex.com |
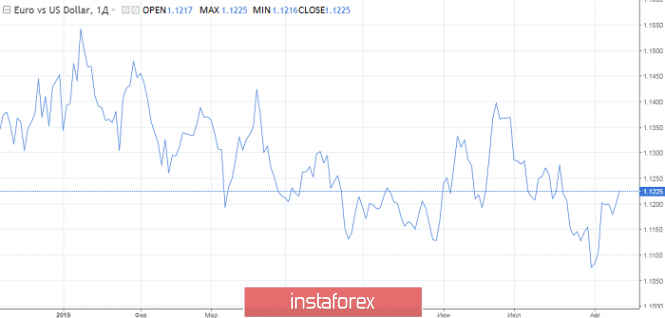
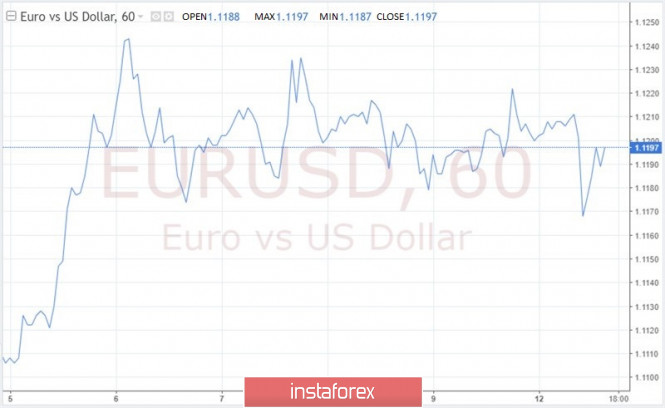
| Will the dollar manage to protect itself? Posted: 12 Aug 2019 05:04 PM PDT The trade war between the United States and China has moved into the next phase, and markets are aware of the new realities. The owner of the White House aggravates relations with China and forces the Federal Reserve to lower rates, while Beijing patiently awaits US elections in 2020, periodically showing off its weapons. Economists at Morgan Stanley published fresh forecasts stating that the Fed will soften monetary policy twice this year in September and October. In 2020, in their opinion, the market will expect another 3 or 4 rounds of rate cuts. In addition, the bank reduced the 10-year forecast for US Treasury yield at the end of the year to 1.60% from the previous 1.68%. The victory in the trade war that the United States "drew" for itself is unlikely to happen. There are a number of reasons for this. First of all, it is worth saying that no improvement in the foreign trade of the United States is happening. The potential for monetary expansion of the US central bank is much deeper than that of other world regulators. The US currency is overvalued, and the evidence is redundant: everything is visible with the naked eye. Over the past decade, the dollar index has grown by a quarter. This is the best result not only for the specified time period, but for the whole history. The Bloomberg Dollar Index has risen 32% since the US credit rating worsened in 2011. Washington, trying to run ahead of the whole planet, including in front of China, may imperceptibly lag behind as a result. This is already becoming apparent. The Americans still have not received the expected benefits from the grand tariffs introduced in July last year. The opposite is true: US exports to China fell by 21%, while China's exports to America grew by 1%. The balance of foreign trade between the two countries also benefited. The Chinese economy slowed down to 6.2%, no one denies this, but the US is growing even more slowly (2.1%). Beijing is patient in a trade dispute, as it understands that the disaster did not happen. If anyone is in pain, it is America. The yield curve fell to a 12-year low, which signals a recession is approaching. Not only D. Trump, but his team is also calling on the Fed to lower the rate. According to the president's trade adviser Peter Navarro, in order to bring borrowing costs to the same level as other states, the US central bank needs to reduce the rate by 75-100 bp. By the way, Goldman Sachs lowered its forecast for US economic growth over the weekend, warning that a trade deal was unlikely before the 2020 presidential election, and predicted a recession was approaching. According to market participants, the only thing that can change D. Trump's position regarding China is a large-scale correction of stock indices. The Dow Jones revaluation is excessive for the second time in history, according to research materials from AG Bisset Associates. The index deviated from its long-term average of 130%. Patterns from 1929, 1999 and 2018 indicate that a major pullback is near. The Federal Reserve, led by Jerome Powell, may well save the stock market from a huge sell-off. Improving relations between the US and China is unlikely to succeed. It seems that D. Trump himself is aware of this. The US leader purposefully prepares markets for the potential negative. Therefore, he said that the negotiations between Washington and Beijing in September may not take place, which does not exclude the correction of stock indices. He also said that the country does not need the devaluation of the dollar: moreover, he is against this step. It is in words, but in reality everything is different. The Fed's calls to lower the rate are verbal interventions. Here the question is brewing: will opponents of the trade conflict be able to withdraw EUR/USD quotes outside the range of 1.1175–1.1245? |
| Leading US investment banks forecast gold rally up to $2000 per ounce Posted: 12 Aug 2019 04:51 PM PDT For the first time since April 2013, the price of gold managed to gain a foothold above 1,500 per ounce. According to analysts, many factors currently indicate the preservation of an upward trend, even if quotes consolidate in the near future. "The main driver of price growth will be the escalation of the trade conflict between the US and China," Goldman Sachs said. "We doubt that the parties will be able to conclude a trade before the presidential election in the United States, which will be held in 2020," they added. The bank believes that a possible slowdown in the global economy will also provide support to gold. "Demand for gold will remain high until stable economic growth in industrialized countries is restored," representatives of the financial institute said. Goldman Sachs lowered its estimate for the growth rate of US GDP in the fourth quarter from 2% to 1.8%. According to the bank's forecasts, in the next three months the cost of precious metal will reach $1,575 per ounce, and on the horizon of 6-12 months - $1,600 per ounce. At the same time, analysts admit that if concerns remain regarding the prospects for the global economy, the price of gold could well exceed projected levels. Bank of America expects quotes to rise to around $2,000 an ounce. "Gold will continue to grow thanks to the policy of quantitative stimulation, which will be carried out by central banks and is unlikely to revive business activity. Against this background, investors will be even more concerned about the prospects for the global economy, which means that the price of gold will confidently demonstrate new record values," economists at Bank of America believe. The material has been provided by InstaForex Company - www.instaforex.com |
| Analysts: a sharp rise in the price of Bitcoin is alarming Posted: 12 Aug 2019 04:43 PM PDT The rapid rise in the price of bitcoin in a relatively short period of time is alarming for some participants in the cryptocurrency market and a number of analysts. Many analysts see this as a catch, believing that such a phenomenon is the result of active speculation by large players. According to some crypto enthusiasts, the rally of the number one cryptocurrency with a predominance of a bullish trend seems to be misleading. However, analysts are certain that this is not so. From the outside, it seems that Bitcoin is set to conquer record highs, but now it is hardly possible, analysts say. They do not exclude that the crypto asset will be able to get out of the "bear pit", and recommend to stop trading, observing the dynamics of the market. Analysts also advise to be patient and accumulate cryptocurrency. Many market participants pay attention to a significant reduction in the number of requests for the keywords "buy bitcoin" compared to 2017. This fact also alarms crypto enthusiasts and analysts. They find it difficult to answer why, with a decrease in interest in Bitcoin, the price of an asset is growing rapidly. Analysts consider the number one cryptocurrency's current take-off as speculative. They believe that the reason for this is the geopolitical situation complicated by the trade war between the US and China, which is used by speculators to push the BTC up. "Bitcoin has risen from $3,000 to $14,000 in a matter of months, emerging from the bear market. This is an alarming signal," analysts emphasize. Confirmation of cryptocurrency speculation is the observation of market participants on the dynamics of bitcoin on Sunday, August 11. First, MTC sellers provoked a false breakthrough of the support level of $11250, and buyers instantly returned the price to the upper limit of the range. In the evening, the asset managed to overcome resistance and gain a foothold just above the 50% Fibonacci level ($ 11,394.14). Analysts are certain that on Monday, August 12, recovery will continue. If the bears can break through the strong support level of $11,250, then by the middle of this week the price of Bitcoin will pull back to the psychological mark of $10,000. At the moment, Bitcoin could not gain a foothold at the $12,000 key mark, analysts summarize. Moreover, on Sunday, the MTC slid sharply to the lower boundary of $11,000, and by Monday morning it stabilized at around $ 11,400. Bitcoin price fluctuations maintain their intensity, but occur in a narrow range with a slight decrease in trading volumes. The material has been provided by InstaForex Company - www.instaforex.com |
| Posted: 12 Aug 2019 04:43 PM PDT All UK macroeconomic reports have been a failure. The country's GDP was negative, industry declined both in monthly and annual terms. Meanwhile, the government does not want to see problems in the economy and is successfully shifting market attention to political factors. The British prime minister's calls to revise the conditions for leaving the EU remain unanswered. Traders' fears regarding Brexit without a deal contributed to the pound's collapse, which ended last week at its lowest mark of over three decades against the dollar. Against the euro, it fell to its lowest level since 2009. The falling pound feeds negative forecasts. Big investors and analysts scare the markets by reducing the currency to 1.10 against the dollar and 1.0 - paired with the euro. The pound began the new week with recovery, but, given the very vague economic and political picture of England, it could not hold out in the black for a long time. Credit Agricole believes that the lack of clarity on Brexit makes any recovery of the pound attractive for the resumption of its sales. The rally may be due to profit taking in a market that is excessively short in pounds. It is unlikely that investors will take a more constructive view of the pound now. This week it is worth paying attention to reports on the labor market, inflation and retail sales. However, the impact of statistics is likely to be short-term. There is little official information about contacts with officials from Brussels, nevertheless even the most insignificant negative increases the likelihood of a "hard" exit from the EU, which means that the market will regard it as a new reason for selling the pound. Johnson spends a lot, the risk of early elections is growing. Instead of saving money to support the economy ahead of Brexit, British Prime Minister Boris Johnson is increasing spending. The newly made prime minister is accused of unreasonable expenses. On Sunday, he announced that he would spend 2.5 billion euros on prisons as part of his promise to reduce crime. Before this, funding for the National Health Service was significantly expanded. Even larger amounts can be allocated after the Treasury completes the annual calculation of ministry expenditures. Most likely, this will happen in September, since the date of exit from the EU - October 31 - is approaching. Bloomberg notes that Johnson, demanding additional funding for a particular direction, is guided solely by political considerations. This is fundamentally wrong, given the uncertainty surrounding Brexit and the shrinking economy for the first time in seven years. At the moment, the only way to stop the prime minister is through a vote of no confidence. So consider his opponents. The risk of holding early general elections is increasing. However, it may disappear if B. Johnson fails to realize his plans for an aggressive "divorce" from the EU. The material has been provided by InstaForex Company - www.instaforex.com |
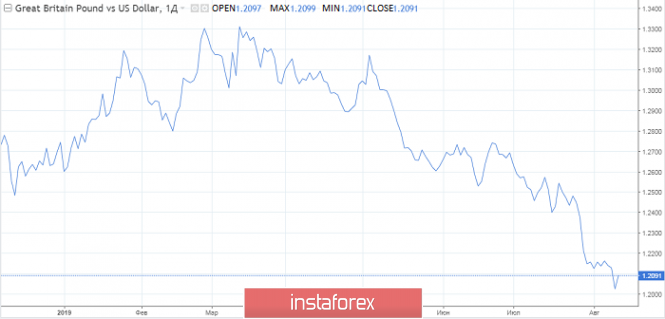
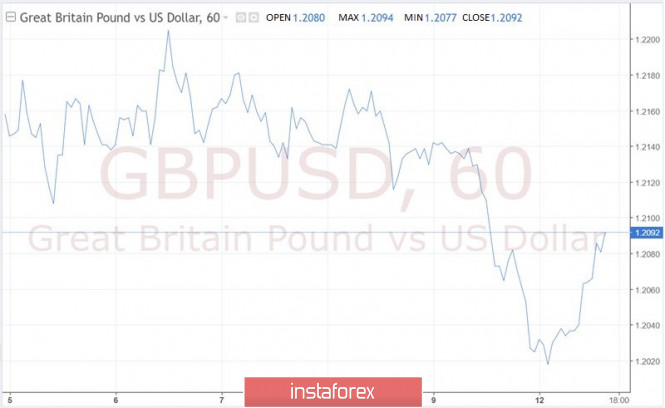
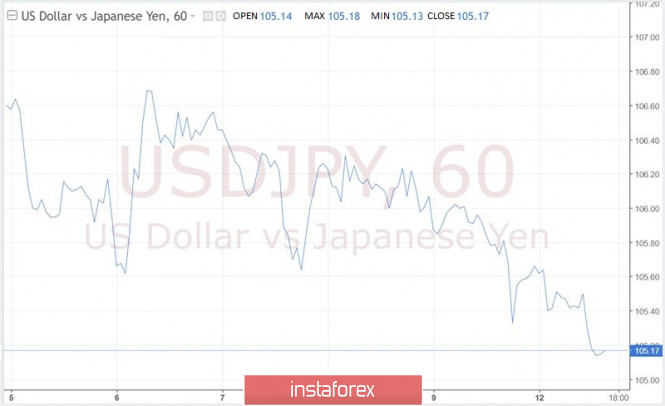
| Italy pulls down the euro again, while the pound tries to grab hold of a straw Posted: 12 Aug 2019 04:43 PM PDT The EUR/USD pair unexpectedly fell below 1.1200 today and slumped to four-day lows in the area of 1.1170. Since Monday's economic calendar is empty, the focus is on the escalation of tensions in US and China trade relations, as well as the political situation in Italy, where the likelihood of holding early elections is increasing. In the near future, the leaders of the Italian Parliament should meet to decide when to put to the vote the question of no confidence in the country's Prime Minister Giuseppe Conte. The Five Stars movement and the center-left Democratic Party intend to create an alliance aimed at curbing the efforts of Deputy Prime Minister Matteo Salvini to take control of the government. It is not yet clear how citizens of the eurozone's third-largest economy are ready to go to new elections. However, if they do take place, then M. Salvini, who, apparently, is aiming for the prime minister position, could once again promise to violate the EU budget rules. Recall that at the end of last year, the conflict between Rome and Brussels has greatly damaged the single European currency. "Reports of the United States' introduction of new tariffs on Chinese imports made it possible for EUR/USD to grow to 1.12, but this dynamics is unlikely to be sustainable, because the consequences of the Washington and Beijing trade war will have a painful effect on the European economy," Westpac representatives said. "Even if the Fed cuts its interest rate three times this year (to 1.375%), the Treasury will remain a highly profitable safe asset, which will continue to support the greenback," they added. According to Westpac's forecast, by the end of this year, the EUR/USD pair will drop to 1.08 and will trade near this mark at least until mid-2020. Meanwhile, GBP/USD is attempting to recover after updating multi-year lows. The pair was able to attract buyers near the 1.20 mark. The pound sterling was supported by the news that British MPs are developing an action plan under which they will require the government of Boris Johnson to transfer the Brexit deadline from October 31 to a later date. According to The Times, at this stage this seems to be the only way to avoid Great Britain's withdrawal from the European Union without a deal. "Our basic scenario is that there will be some kind of extension, which is perhaps the most likely result, although we are now much less confident about this than at the beginning of the year. At the end of March, the probability of a "hard" Brexit was only at 5-10%, while now it is close to 50%," Allianz Global Investors said. According to their estimates, the pound could be cheaper by 10% if there is no deal by October 31. "The political turmoil that may follow will raise the chances of opposition Labour Party leader Jeremy Corbyn to become the next prime minister of the United Kingdom, which could bring the British currency down to par with the US dollar," analysts say. The USD/JPY pair has been declining for the fourth consecutive day, since US President Donald Trump said trade negotiations with China may not take place next month, as previously planned. "We have an open dialogue. Let's see if we manage to keep the meeting in force in September. If it succeeds, it's fine, if not, it's also good," said the head of the White House. According to analysts, this is only a matter of time before the USD/JPY pair breaks the 105 mark. This could happen already this week if data on retail sales and consumer inflation in the US do not meet expectations. |
| Sale of AUD/USD continues: the pair is testing the level of 0.6750 Posted: 12 Aug 2019 04:32 PM PDT The Australian dollar is getting cheaper amid a wide rebound in the US dollar, a weakening renminbi and a declining risk appetite. The fact that Chinese iron ore futures are becoming cheaper significantly contributes to the Australian dollar's decline. Selling the AUD/USD pair is gaining momentum after the dollar regained its positions in all directions. The escalation of the trade conflict between the United States and China, combined with the latest events surrounding the Hong Kong protests, has led to risk aversion in all directions, and US stocks in tandem with Treasury yields have changed course. In addition, sentiment around the Australian dollar was undermined by falling iron ore prices in China. Ferrous metal reached new two-month lows of 609.50 yuan ($ 86.31) per tonne amid concerns about weak demand. Recall that iron ore is Australia's main export product. The situation was also aggravated by the devaluation of the yuan in an attempt to counter the influence of new US tariffs, which strengthened the "bearish" sentiment. Highly profitable currencies will continue to be affected by trends in risky sentiment. In addition, the attention of the head of the Reserve Bank of Australia (RBA) on the short-term trading impulse ahead of data on the US consumer price index and employment in Australia remains in the spotlight. The material has been provided by InstaForex Company - www.instaforex.com |
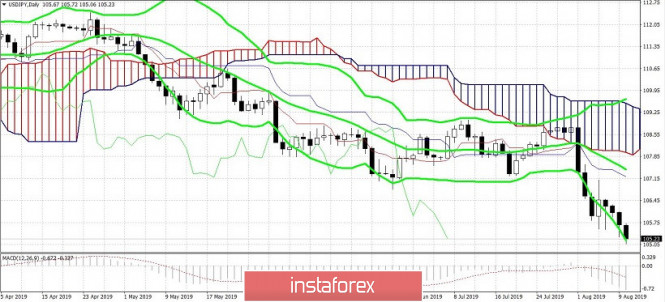
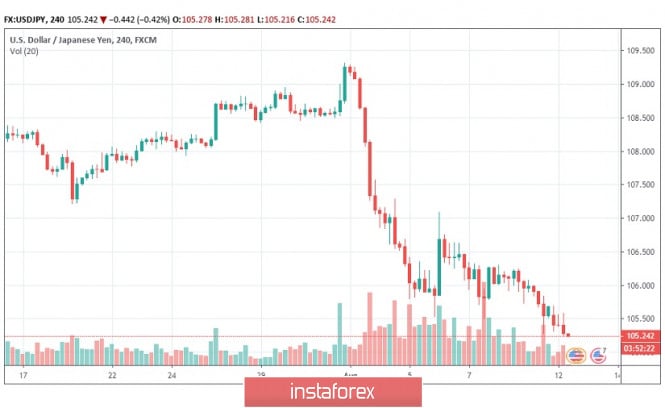
| USD/JPY. Trade War, Brexit and Italy: The yen could strengthen to 104.65 Posted: 12 Aug 2019 04:10 PM PDT The Japanese currency is already approaching the 104th figure against the dollar, as it continues to update the price lows of the year. The last time the pair was on such troughs was in March 2018, when Donald Trump signed a memorandum on fighting China's economic aggression, which turned into a form of act of declaring a trade war. After a year and a half, the situation returned to its "zero point": the trade conflict between the superpowers flared up with renewed vigor, and the yen strengthened again, being in demand amid rising anti-risk sentiment. A direct reason for the Japanese currency's growth was Trump's statement, who said that the September meeting of the negotiating group may not take place. In addition, he virtually ruled out the signing of the deal in the foreseeable future. All the agreements that were reached at the G20 summit collapsed like a house of cards. In particular, the White House decided not to issue licenses to American companies to resume cooperation with the Chinese company Huawei in the purchase of technological equipment in response to China's actions, which refused to purchase agricultural products from the United States. Trump's statement last Friday came amid further weakening of the renminbi: the People's Bank of China weakened it to 7.069 today. During the US session, the USD/CNY rate slightly pulled back, but is still at record high levels. Let me remind you that at the beginning of last week, officials of the Chinese regulator tried to reassure foreign exporters at a special meeting - they assured representatives of big business that Beijing would not be used as a weapon in the trade war, and that companies could continue to acquire and sell the US currency freely. The second paragraph, of course, is carried out without any reservations, but at the same time, China's national currency remains the de facto weapon of the country in the trade war - even if it is of a "defensive" nature. In addition, the market again began to talk about the fact that China, which is the world's largest foreign creditor of the US economy, will resort to selling Treasuries or significantly reduce investments in it. It is worth noting that the "horror story" that China is prepared to sell US public debt emerges in the foreign exchange market with enviable regularity, mainly during periods of political tension between Beijing and the United States. Regular conversations on this subject can be treated differently: on the one hand, over the past years, these rumors have not been confirmed and have been refuted by Chinese officials. On the other hand, China did not "let" the USD/CNY rate beyond the line of the 7th level for a long time, while this time the yuan crossed the designated Rubicon. This suggests that the trade war is acquiring new features, which means this time Beijing may apply other available methods of pressure. Be that as it may, the foreign exchange market reacted to these rumors seriously enough, supporting the Japanese currency. However, anti-risk sentiment in the foreign exchange market increased not only due to the escalation of the US-Chinese trade war. Brexit's likelihood is increasing every day, and any reminders about this make traders nervous - in particular, the pound-dollar pair updated its annual lows again today, dropping to the bottom of the 20th figure. Now the pair is adjusting due to the dollar's weakness, but the prospects of a "chaotic" Brexit continue to set the tone for trading - and not only in the GBP/USD pair. Just today, British Prime Minister Boris Johnson in his video message confirmed that his country would "absolutely definitely" leave the European Union on October 31. After that, the demand for defensive assets increased, including the yen. But the political crisis in Italy is fraught with new re-elections, the results of which could aggravate relations between Rome and Brussels. The idea of holding new elections is being lobbied by the country's deputy prime minister Matteo Salvini - he needs them in order to become the new prime minister. But this idea has not yet found support among Italian MPs. For example, the ex-leader of the Democratic Party, Matteo Renzi, called them "crazy" to hold them at a time when the budget for 2020 is on the agenda. At present, Italy is considering the formation of a government without Salvini. By the way, among the possible candidates for the post of head of the technical government, they call the current head of the ECB Mario Draghi. Political battles in Italy only increase the general nervousness in the market, increasing the demand for defensive instruments - first of all, for the Japanese currency. From a technical point of view, the situation is as follows. On all timeframes, without exception, the USD/JPY pair is located on the lower line of the Bollinger Bands indicator below all lines of the Ichimoku indicator, which generated a strong bearish "Parade of Lines" signal. This indicates a clear advantage of the downward movement. The bearish momentum is so strong that it is too early to speak about a price correction: only if the data on the growth of US inflation comes out much better than expected tomorrow, bulls of the pair can count on a price pullback. Otherwise, a downward course will remain in priority. The main goal of the downward movement is located at the lows of last year, that is, at around 104.65. The material has been provided by InstaForex Company - www.instaforex.com |
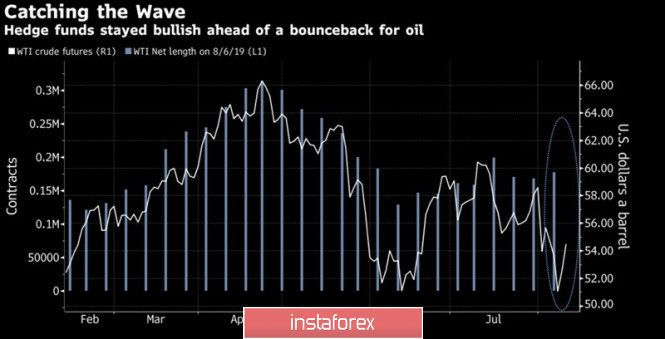
| Posted: 12 Aug 2019 03:55 PM PDT Investors in the oil market are fixated on the problem of slowing global demand. The Brent's fall to the lowest mark since the beginning of the year was made possible due to a reduction in forecasts by the IEA and the US Energy Information Administration, a slow increase in interest in black gold in January-May and Donald Trump's announcement that negotiations between Washington and Beijing in September could be strained. Despite the fact that the end of summer is traditionally a strong period for oil due to the height of the automobile season in the United States, Brent and WTI continue their downward course due to growing concerns about a slowdown in the global economy. The US Energy Information Administration reduced their forecast for the growth in global demand for black gold in 2019from +1.07 million bpd to +1.01 million bpd, the International Energy Agency - from +1.18 million bpd to 1.08 million bpd If the Paris organization's estimates are down for three of the four previous reports, the United States are cutting forecasts for the seventh time in a row. The main culprit is Donald Trump, whose protectionist policy leads to a reduction in the growth rate of international trade and global GDP. After introducing a 10% tariff on $300 billion worth of goods, Chinese imports and marking China as a currency manipulator, the US president said that the failure of the next round of negotiations between Washington and Beijing is normal. In this situation, one should not exclude a correction of US stock indices. It is interesting that, unlike Brent speculators, who reduced net longitudes by 4.7% at the end of the week to August 6, WTI speculators, on the contrary, increased them to 177,189 futures and options contracts. They are likely betting on the automotive season in the United States, lower US stocks and Saudi Arabia's intention to reduce exports by 7%. Riyadh almost single-handedly fights with "bears" over black gold, while the confrontation between the Saudis and Donald Trump is again becoming the main topic of discussion on the oil market. Dynamics of WTI and oil speculative positions Thus, the global demand factor dominates in market pricing, and we must admit that those who are not tired of reducing forecasts for the IEA and the US Energy Information Administration are right. Global demand for black gold grew by a modest 520 thousand bpd from January to May. Weak evidence is a good reason to lower estimates, especially since Chinese imports will earn a 10% tariff on $300 billion worth of goods starting in September. According to Goldman Sachs, Washington and Beijing will not be able to agree until the presidential election in 2020, which will preserve the uncertainty and control of bears over Brent and WTI in the market. Technically, the activation of the AB=CD pattern on the daily chart of the North Sea variety increases the risks of its target implementation by 161.8%. It corresponds to the mark of $54.1 per barrel. Indeed, for starters, "bears" need to take control of the level of $58.7 (23.6% of the wave of the CD "Shark" pattern). The material has been provided by InstaForex Company - www.instaforex.com |
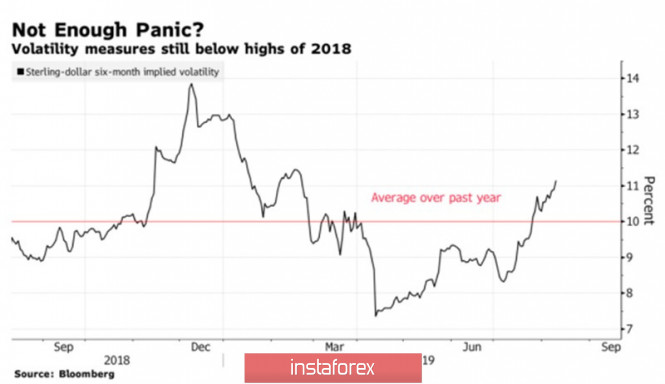
| Pound throws a towel into the ring Posted: 12 Aug 2019 03:42 PM PDT Perhaps there is no more distressed currency on the forex market than the British pound. Strong statistics and the "hawkish" rhetoric of the Bank of England somehow kept it afloat, however, as soon as the indicators began to deteriorate, the unfavorable political landscape did its job - the sterling went down. The first slowdown in Great Britain's GDP over the past 7 years has sent GBP / USD quotes to the lowest level since the flash accident that took place in October 2016. If we exclude it, the pair went to the very bottom since the 80s. Since the beginning of the year, the pound has lost about 5.5% against the US dollar (the worst result among the G10 currencies excluding the Swedish krona) and it fell by more than 7% over the past three months. Markets until recently relied on an orderly Brexit, but the coming to power of Boris Johnson made it clear that the chances of Britain's exit from the EU without signing the agreement is clearly understated. Sterling's volatility jumped sharply, and it collapsed into the abyss. Pound Volatility Dynamics It's one thing when investors just talk about the $1.17 mark (Reuters analyst consensus forecast), $1.1 mark (Bloomberg analyst consensus estimate) or parity (Morgan Stanley and BlackRock forecast), while it's another thing when the economy begins to respond to uncertainty and high political risks. The slowdown in Britain's GDP from +0.5% to -0.2% q/q no longer allows the Bank of England to talk about raising the repo rate. One of the pessimistic scenarios is beginning to come true, which does not exclude the sterling's fall to parity against the US dollar. The first contraction in Great Britain's economy since 2012 leads to sad arguments. Not only does it feel pain from Brexit, but Donald Trump's protectionism policy and the associated slowdown in international trade and foreign demand also make the British tighten their belts. The pound cannot help but respond to a combination of an unfavorable political background and worsening macroeconomic statistics. In this regard, the release of data on the labor market, inflation and retail sales can be a serious test for bulls on GBP/USD. As unemployment grows, consumer prices and retail sales will slow down, as the next wave of sales will cover sterling. A strong US dollar can add fuel to the fire. Yes, Donald Trump calls on the Fed to lower the federal funds rate, but he does not consider the devaluation of the US currency necessary. The US economy remains stable even against the backdrop of an escalation of trade frictions, and if it continues to do so, competitors will have a hard dollar. It is another matter if the Fed nevertheless follows the White House's lead and by the end of 2019 loosens the monetary policy at all the remaining FOMC meetings. Technically, on the monthly GBP/USD chart, it is clearly visible that in case of updating the lowest marks from October 2016, the lower and higher AB = CD patterns will be activated. Their targets are 200% and 161.8% consistent with marks 1,135 and 1,037. The material has been provided by InstaForex Company - www.instaforex.com |
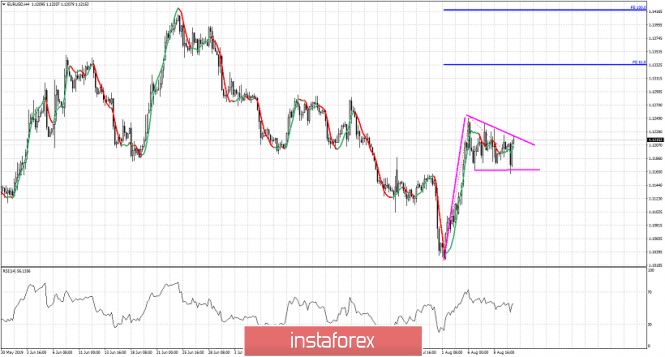
| Posted: 12 Aug 2019 09:44 AM PDT
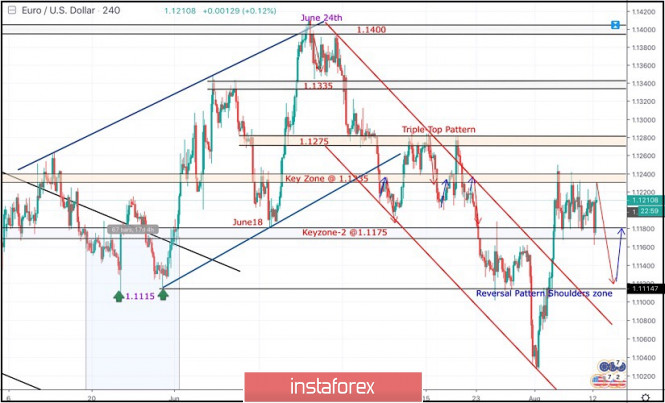
Back in June 24, the EURUSD looked overbought around 1.1400 facing a confluence of supply levels. Thus, a bearish movement was initiated towards 1.1275 followed by a deeper bearish decline towards 1.1235 (the lower limit of the previous bullish channel) which failed to provide enough bullish support for the EUR/USD pair. In the period between 8 - 22 July, sideway consolidation-range was established between 1.1200 - 1.1275 until a triple-top reversal pattern was demonstrated around the upper limit. Shortly after, evident bearish momentum (bearish engulfing H4 candlestick) could bring the EURUSD back below 1.1235. Early bearish breakdown below 1.1175 facilitated further bearish decline towards 1.1115 (Previous Weekly Low) where temporary bullish rejection was demonstrated before bearish breakdown could take place on July 31. On July 31, Temporary Bearish breakdown below 1.1115 allowed further bearish decline towards 1.1025 (lower limit of the depicted recent bearish channel) where significant signs of bullish recovery were demonstrated. Risky traders were advised to look for bullish persistence above 1.1050 as a bullish signal for Intraday BUY entry with bullish target projected towards 1.1115, 1.1175 and 1.1235. It's already running in profits. S/L should be advanced to 1.1160 to secure more profits. During the past week, the depicted Key-Zone around 1.1235 has been standing as a prominent Supply Area where TWO Bearish Engulfing H4 candlesticks were demonstrated. Earlier Today, another bullish visit was demonstrated towards 1.1235 where another episode of bearish rejection was anticipated. Thus, the EUR/USD remains trapped between 1.1235-1.1175 until breakout occurs in either directions (probably to the downside). Bearish breakdown below 1.1175 is mandatory to allow further bearish decline towards 1.1125-1.1115 where another intermediate-term bullish position can be offered (The right shoulder of the expected reversal pattern). Trade recommendations : Conservative traders should wait for a deeper bearish pullback towards 1.1125-1.1115 for a valid BUY entry (where the right shoulder of the reversal pattern is expected to be located). S/L should be placed just below 1.1080 while initial T/P levels should be located around 1.1160 and 1.1200. The material has been provided by InstaForex Company - www.instaforex.com |
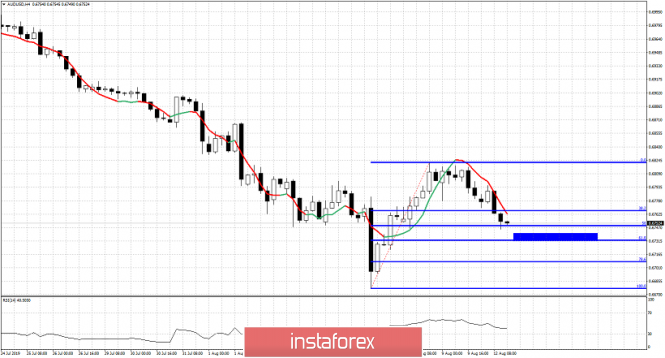
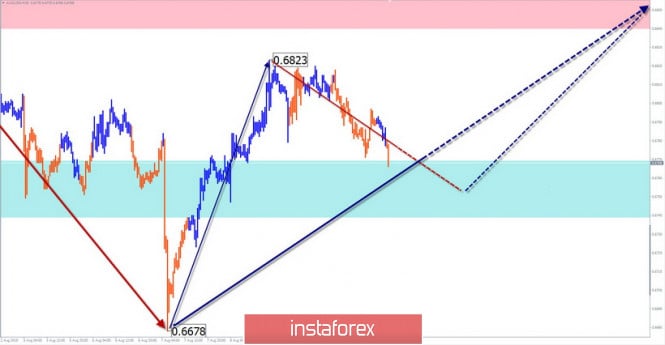
| AUDUSD pulls back to important short-term Fibonacci retracement Posted: 12 Aug 2019 07:42 AM PDT After a strong upward move from 0.6677 to 0.6822, price is pulling back and so far it has retraced 50% of the rise. The 61.8% Fibonacci level is the last line of defense for bulls according to Fibonacci levels. It would be ideal for bulls to see price touch that level and reverse to the upside.
Blue rectangle - key Fibonacci support area AUDUSD is pulling back. The blue area is a good short-term target for a reversal of this downward move and the resumption of the upward momentum from 0.6677. So support is at 0.6730 and bulls do not want to see a daily close below that level. Bulls want to see price reverse to the upside and break above recent highs at 0.6822. This would be a bullish signal and would give us 0.69 as the first target and 0.70 as the second. Traders need to be very cautious as there are many chances of trend reversing here. As long as price is below 0.6822 bears are in control. Bears will strengthen their control of the trend with a break below 0.6705. Bears will start losing control of the trend if price breaks above 0.6795. The material has been provided by InstaForex Company - www.instaforex.com |
| EURUSD still trapped inside trading range Posted: 12 Aug 2019 07:35 AM PDT EURUSD pulled back towards recent lows at 1.1165 where we also find short-term support and bounced. Price remains below resistance levels but the trading range its been in is tightening. Soon we will have a trading signal. The direction of the breakout will show us the direction of the new trend.
EURUSD is trading sideways in a tightening trading range. Resistance at 1.1230-1.1250 remains important for the short-term trend. Support at 1.1165 has been validated earlier as price tested that level and it did not break. This increases the importance of a break if it occurs. A break below 1.1165 will most probably push price below 1.11 again. A break above resistance will give us 1.1330 as the first bullish target. The material has been provided by InstaForex Company - www.instaforex.com |
| Gold follows our expected path but still no break out Posted: 12 Aug 2019 07:30 AM PDT Gold price continues to trade sideways inside the flag pattern. Price is challenging recent highs but caution is advised to traders as there are several warning signs. We should not ignore the possibility of a fake break out.
Blue rectangle - major support area Magenta lines - expected path Gold price continues to trade inside the range of the flag pattern. Support is at $1,485-90 and resistance at $1,510. Usually a break above $1,510 could give us a target of around $1,600 but with current oscillator conditions, I expect a move to $1,535 to be enough. Bulls need to be very cautious as there are bearish divergence warning signs. Failure to stay above $1,485 would lead to a decline towards the blue rectangle area which bulls must defend. Otherwise the medium-term bullish trend will be in danger and we might see a deeper pull back towards $1,350. The material has been provided by InstaForex Company - www.instaforex.com |
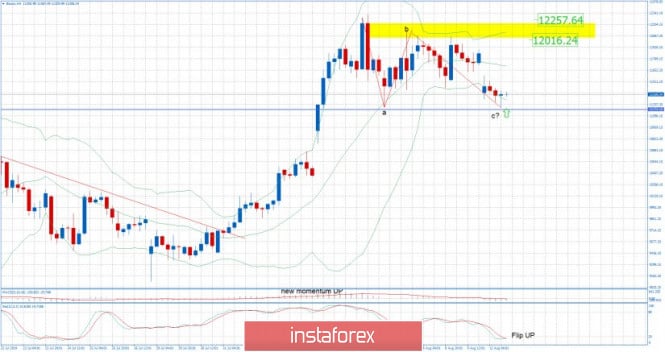
| BTC 08.12.2019 - Potential completion of ABC downwrad correction Posted: 12 Aug 2019 07:25 AM PDT Industry news: While Binance US, the American branch of major cryptocurrency exchange Binance, included four stablecoins among its 30 potential candidates to be listed on this upcoming platform, no Binance IEOs (initial exchange offerings) are on the list. Hyped projects such as BitTorrent (47th by market capitalization), Fetch.AI (207), Celer (180) and Matic Network (127), that raised capital on the Binance Launchpad platform, have been left outside of the list alongside with many other coins, including Tron (13th by market capitalization). (Meanwhile, competing major American exchange Coinbase is considering the addition of new assets, including Harmony and Matic, both of which offered tokens to the public via the Binance Launchpad.)
BTC has been trading lower in past 24 hours but it found support at the price of $11.200. There is potential for the completion of the ABC downward correction and my advice is to watch for buying opportunities. Blue horizontal line: Support ($11.200) Red lines – ABC legs Yellow rectangle – Key resistance zone ($12.000-$12.250) Stochastic oscillator is showing the oversold condition and the fresh flip up, which is sign that sellers got "too short" and that rally is possible. BTC did stop at the lower Bollinger band, which is another sign of the oversold condition. Trading recommendation: According to current market conditions, my advice is to watch for buying opportunities and go with the direction of the overall trend. Targets are seen at the price of $12.015 and $12.250. The material has been provided by InstaForex Company - www.instaforex.com |
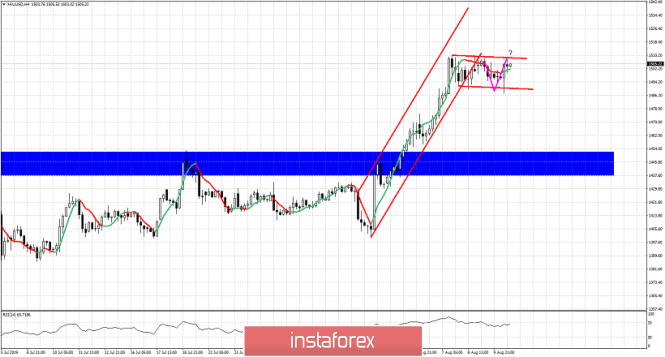
| Gold 08.12.2019 - Completed ABC downward correction, re-load long positions Posted: 12 Aug 2019 07:10 AM PDT Gold has been trading upwards in past 5 hours and in my opinion there is a completion of the abc downward correction. Support at the price of $1.487 held successfully, which is good sign for higher price.
Orange horizontal lines: Resistance levels ($1.510-$1.520) Red lines – Broken bullish flag Green rectangle – Key support zone ($1.489) Gold is in strong bullish trend relative to previous 20 days and In my opinion the best thing to do is to watch for buying opportunities on the dips. Level around $1.5000 seems like a good level to re-load buying orders. Upward targets are seen at $1.510 and $1.520. MACD oscillator is picking up momentum and it is in positive territory, which is good sign for further rally. Trading recommendation: According to current market conditions, my advice is to watch for buying opportunities and go with the direction of the overall trend. Targets are seen at the price of $1.510 and $1.520.. The material has been provided by InstaForex Company - www.instaforex.com |
| August 12, 2019 : GBP/USD Intraday technical analysis and trade recommendations. Posted: 12 Aug 2019 06:58 AM PDT
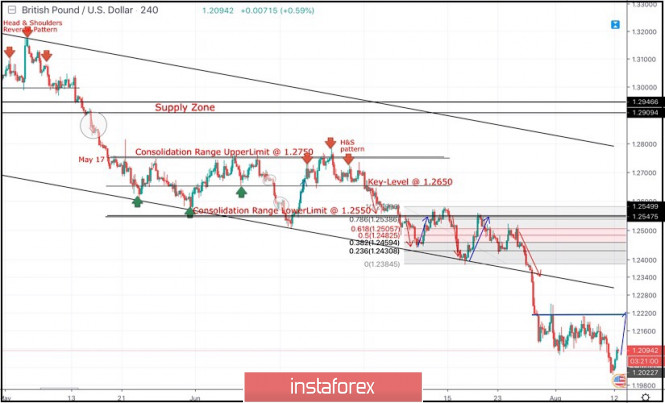
Since May 17, the previous downside movement within the depicted bearish channel came to a pause allowing the recent sideway consolidation range to be established between 1.2750 - 1.2550. On July 5, a bearish range breakout was demonstrated below 1.2550 (the lower limit of the depicted consolidation range). Hence, quick bearish decline was demonstrated towards the price zone of 1.2430-1.2385 (the lower limit of the movement channel) which failed to provide consistent bullish demand for the GBP/USD. Moreover, Bearish breakdown below 1.2350 facilitated further bearish decline towards 1.2320, 1.2270 and 1.2100 which correspond to significant key-levels on the Weekly chart. The current price levels are quite risky/low for having new SELL entries. That's why, Previous SELLERS were advised to have their profits gathered. Last week, temporary signs of bullish recovery were being demonstrated around 1.2100 before Friday when another bearish movement could be demonstrated towards 1.2025. Recent bullish recovery was demonstrated off the recent bottom (1.2025) bringing the GBP/USD pair back towards 1.2100 (recently-established SUPPLY Level). This is supposed to enhance further bullish advancement towards 1.2230 then 1.2320 if sufficient bullish momentum is demonstrated above 1.2100. Trade Recommendations: Intraday traders are advised to look for early bullish breakout above 1.2100 then above 1.2230 for counter-trend BUY entries. Conservative traders should wait for bullish pullback to pursue towards 1.2320 - 1.2350 for new valid SELL entries. S/L should be placed above 1.2430. Initial T/P level to be placed around 1.2279 and 1.2130. The material has been provided by InstaForex Company - www.instaforex.com |
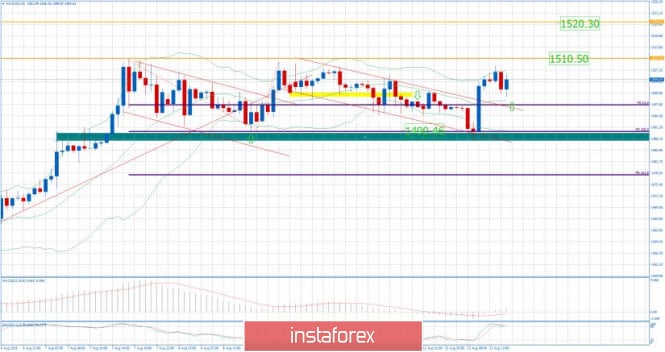
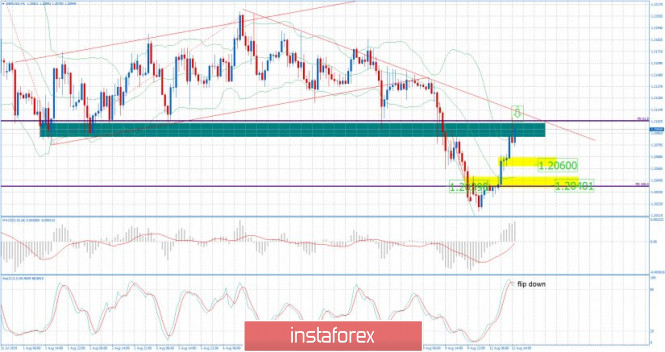
| GBP/USD 08.012.2019 -Strong resistance at the price of 1.2100 on the test Posted: 12 Aug 2019 06:46 AM PDT GBPUSD has been trading upwards in past 10 hours but it is testing resistance at 1.2100. The short-term trend is still down so the zone around 1.2100 seems like good sell opportunity.
Green rectangle: Key resistance (1.2100) Yellow rectangles – Support levels (1.2060-1.2040) Red line – Resistance trend line GBPUSD made the strong breakout of the bearish flag last week and it was normal to see rally today due to wide range bar from Friday. GBPUSD is in downward trend and selling is a good option. Stochastic oscillator is showing us the overbought condition and the flip down, which is sign good confirmation for further downward movements. Support levels are seen at the price of 1.2060 and 1.2040. Key resistance is seen at the price of 1.2100. Trading recommendation: According to current market conditions, my advice is to watch for selling opportunities and go with the direction of the overall trend. Targets are seen at the price of 1.2060 and 1.2040. The material has been provided by InstaForex Company - www.instaforex.com |
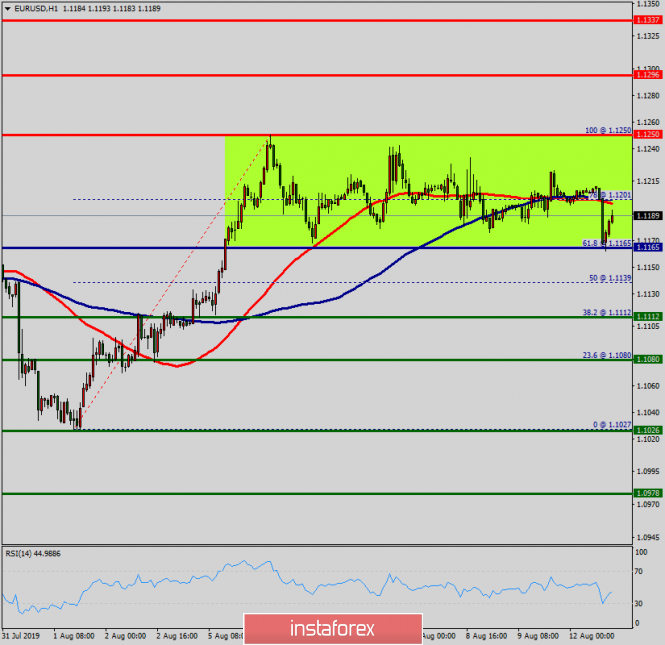
| Technical analysis of EUR/USD for August 12, 2019 Posted: 12 Aug 2019 03:41 AM PDT Overview: The EUR/USD pair hit the daily pivot point (1.1112) and resistance 1, because of the series of relatively equal highs and equal lows. Yesterday, the EUR/USD pair continued to move upwards from the level of 1.1112. The pair rose from the level of 1.1112 to the top around 1.1250. But the pair has rebounded from the top of 1.1250 to close at 1.1190. The EUR/USD pair faced resistance at the level of 1.1296, while minor resistance is seen at 1.1250. Support is found at the levels of 1.1165 and 1.1112. The RSI is still calling for a strong bullish market as well as the current price is also above the moving average 100. Therefore, it will be advantageous to buy above the support area of 1.1165 which represents the daily pivot point. The market is still in an uptrend. We still prefer the bullish scenario as long as the priceis still set above the area of 1.1112. Trading recommandations:
|
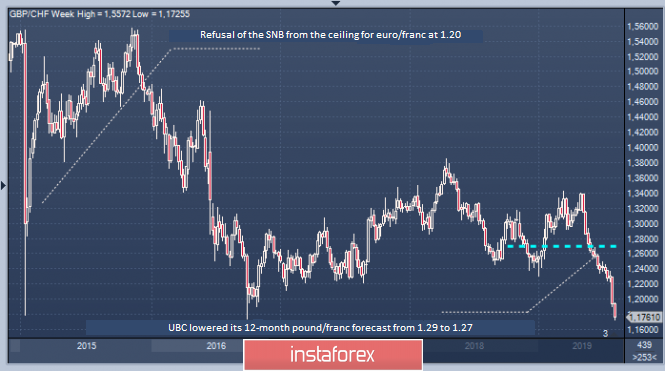
| Difficult times await the pound/franc – UBS Posted: 12 Aug 2019 02:11 AM PDT According to the estimates of the largest bank UBS Global Wealth Management, the previous 12-month forecasts for the pound/franc (GBP/CHF) were revised down significantly. Experts believe that the reason for this is the growing tensions in trade between the US and China. They believe that the current situation will support the demand for the Swiss currency. According to preliminary forecasts of UBS Wealth analysts, the decline in the GBP/CHF pair will be within the 1.27 indicator. The previous indicator of the bank was 1.29. At the end of last week, the GBP/CHF rate fell to the level of 1.1728, which is the weakest indicator since October 2016. According to UBS Wealth experts, in the future, we should expect the recovery of the pound. Experts attribute this to the high probability of extending the Brexit period. They recall that the UK's exit from the EU, which expires on October 31, 2019, may be extended after the general election in the country. Concerning the Swiss franc, UBS Wealth analysts are confident that it will be supported by global uncertainties, such as the trade conflict between Washington and Beijing. The fall of the GBP/CHF pair will be limited to levels up to 1.15, if there is no "hard" Brexit without a deal, experts emphasize. In the case of the worst-case scenario, namely the UK's exit from the EU without a deal, the collapse of the GBP/CHF pair will reach 1.05–1.10, according to UBS Wealth. Another reason for the sharp depreciation of the pound/franc pair may be the monetary policy of the Swiss National Bank. Negative developments are possible if the regulator refuses to follow the global trend aimed at weakening monetary policy by central banks around the world. In the case of the gradual recovery of the European economy and positive results of Brexit, the situation for the GBP/CHF pair will be the best. In this situation, the pair can reach the record of 2019 at the level of 1.34, summarize in UBS Wealth. |
| Strong yen demand continues, USD/JPY to test 105.00 Posted: 12 Aug 2019 02:10 AM PDT The yen gained strong momentum amid a risk-averse tone. USD/JPY dipped to its 8-month lows at 105.25 on Friday, and the yen has maintained a robust tone as a Tokyo market holiday limited activity. USD/JPY has now re-tested the 105.25 level. EUR/JPY has broken below 118.00 for lows around 117.60, the weakest level since April 2017. Confidence in the global growth outlook has continued to weaken amid an increase in trade tensions following President Trump's move to put tariffs on all remaining Chinese exports from September 1st. The yen will continue its uptrend in the short term as risk appetite remains extremely fragile. US Treasuries gained ground on Monday with the 10-year yield declining almost by 1.70%. Market expectations of the further Fed Funds rate cuts this year are increasing. Futures markets are indicating an 87% chance of at least two further rate cuts by the end of 2019. The Bank of Japan will maintain a very expansionary monetary policy, but there are major limits to further easing. In relative terms, Japanese yields increased, especially given the German yields at record lows. CFTC data recorded a significant net increase in long, non-commercial yen positions for the latest week to over 10,000 contracts. This was the first long position for over 13 months and highest since November 2016. Therefore, short positions on the yen will be less likely to be reduced. Political factors will remain important. Short-term fears will increase, especially as the weaker Chinese yuan will undermine Japan's competitiveness. Intervention is an important weapon, but there will certainly be a cautious stance in the short term given the on-going issue of relations with the US. Aggressive intervention by the Japanese Finance Ministry (MOF) to weaken the yen would risk a hostile reaction from President Trump and the US Administration. Japan might also be accused of currency manipulation, and the MOF is likely to be tentative and choose their battles carefully. The USD/JPY pair's break below 105.00 would risk stop-loss dollar selling, but there will be strong support around March 2018 lows just above 104.60.
|
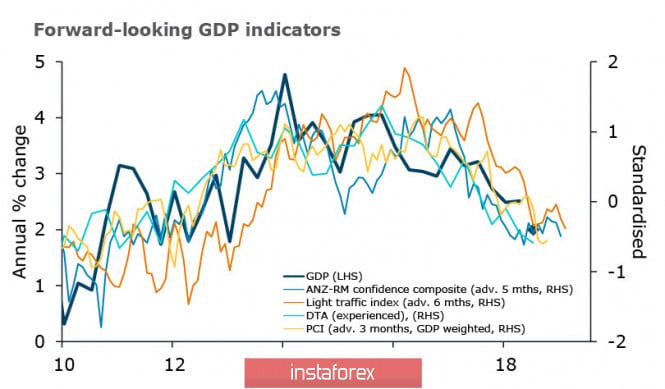
| Positive returns: AUD and NZD get respite and go to the side range Posted: 12 Aug 2019 01:44 AM PDT Asian exchanges are growing on Monday morning, the immediate reason was the IMF's refusal to consider China a currency manipulator. The IMF does not see a significant overvaluation or undervaluation of the yuan last year, and the next analysis will be carried out in 2020 within the framework of standard procedures. Thus, the US has not yet received international support in the trade war with China. Nikkei, Shanghai Composite grow within 1%, the S&P 500 futures are traded with the excess of Friday, the panic subsides. NZDUSD The RBNZ presented a surprise, but some reduction in the rate from 0.50% took both markets and analysts by surprise. The unexpected move led to a sharp drop in markets, and index bonds for the first time in history began to trade with negative returns, and rates on others reached record low values. The RBNZ did not wait for the New Zealand economy to begin a clear slide into recession but delivered a preemptive strike. The reason for such a sharp decline in the rate, as explained by RBNZ, was the deterioration of the global situation in recent weeks. Probably one of the immediate reasons was the weakening of China's yuan exchange rate below the mark of 7.00, which affected the results of the GlobalDairyTrade auction, the weaker yuan influenced the demand from Chinese importers, and the expected drift of the yuan to the mark of 7.50 demanded that the monetary authorities of New Zealand protect their exporters by reducing the TWI. Another factor is the very weak GDP growth forecasts, which indicate that there are virtually no internal reserves for growth.
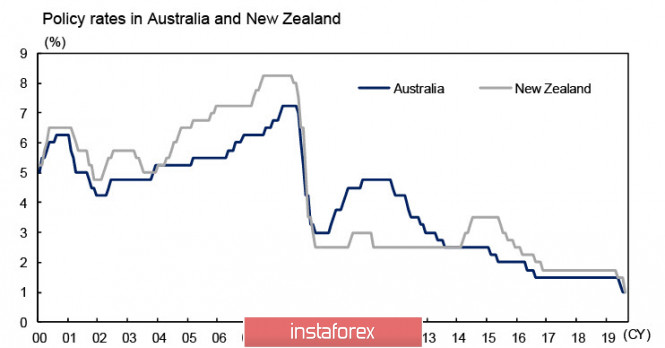
Now, the markets are inclined to think that at the September meeting, the RBNZ will take a break to assess the consequences of its radical actions, but closer to the end of the year, it will make another reduction in the rate, bringing it to 0.75%. Such prospects for the kiwi are negative because they suggest a more aggressive plan of action than the Fed, and the only way for the New Zealander to stay at current levels is stable macroeconomic indicators that exclude a slide into recession so that it does not happen faster than in the rest of the world. This week, we need to pay attention to the publication of the price index for food and rent in July, a good result is predicted for both indicators, which will support the kiwi. NZD won back half of the fall of August 7, and the current level should be recognized as stable, trading will continue in the range of 0.6435 - 0.6500. The downside may occur if the markets receive a clear negative signal that worsens the prospects of world trade. If the week is calm, then drift to the upper limit of the range and then to 0.6530/40 is likely. AUDUSD Last week, the RBA left the rate at 1.0% after two consecutive cuts in June and July, and although the RBA notes a high demand for labor and hopes for a gradual recovery in the coming years, another reduction before the end of the year is growing in the markets. At the moment, after the unexpected decision of the RBNZ, rates in New Zealand and Australia are equal at 1.0%, and it is expected that they will remain equal at 0.75% at the end of the year.
The RBA also revised the forecast for GDP in 2019, reflecting weak consumption growth and a significant decline in housing construction. This week, quite a few important data on Australia will be published, in particular on Tuesday – indicators of the business climate from the NBA, on Wednesday – the consumer confidence index from Westpac, on Thursday – the employment report in July and inflation expectations from the University of Melbourne. Given the positive opening of the week, some recovery in oil prices and a pause in the actions of the RBA, we can expect the stabilization of the Aussie rate at current levels. Support of 0.6750/55, the decline to which can be used for purchases with a target of 0.6815/20, with the growth of positive Aussie can rise to 0.6870/80. The material has been provided by InstaForex Company - www.instaforex.com |
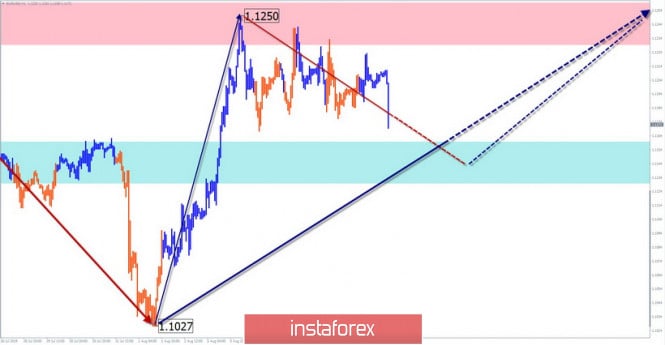
| Simplified wave analysis and forecast for EUR/USD and AUD/USD on August 12 Posted: 12 Aug 2019 01:44 AM PDT EUR/USD Starting from August 1, the direction of the short-term trend of the euro was set by the upward wave structure. Within its framework, a flat correction has developed over the past week. Forecast: In the coming days, there is a high probability of completion of the current downward movement in the last days. A short puncture of the lower boundary of the zone is not excluded. By the end of the day, the formation of a reversal and the beginning of a price rise is expected. Recommendations: There are no conditions for selling the euro today. It is recommended to track the reversal signals in the area of the calculated support, with the search for the entry point in the long positions for this pair. Resistance zone: - 1.1230/1.1260 Support zone: - 1.1160/1.1130
AUD/USD On the hourly chart of "Aussie", the rising wave from August 7 has a high wave level, claiming to start a larger wave model. At least a full correction of the previous trend wave from July 19 is expected. Within the framework of the structure that has begun, a rollback is developing in recent days. Forecast: Today, the completion of the downward phase of the movement, lasting from last Thursday, is expected. The breakthrough of the lower boundary of the zone is not excluded, but unlikely. The price reversal and the beginning of the price rise are more likely in the second half of the day. Recommendations: The pair's sales are risky today, due to the expected low price move down. In the support area, it is recommended to pay attention to the emerging signals of buying the instrument. Resistance zone: - 0.6840/0.6870 Support zone: - 0.6770/0.6740
Explanations to the figures: Waves in the simplified wave analysis consist of 3 parts (A-B-C). The last unfinished wave is analyzed. Zones show areas with the highest probability of reversal. The arrows indicate the wave marking according to the method used by the author, the solid background is the formed structure, the dotted ones are the expected movements. Attention: The wave algorithm does not take into account the length of time the instrument moves. The material has been provided by InstaForex Company - www.instaforex.com |
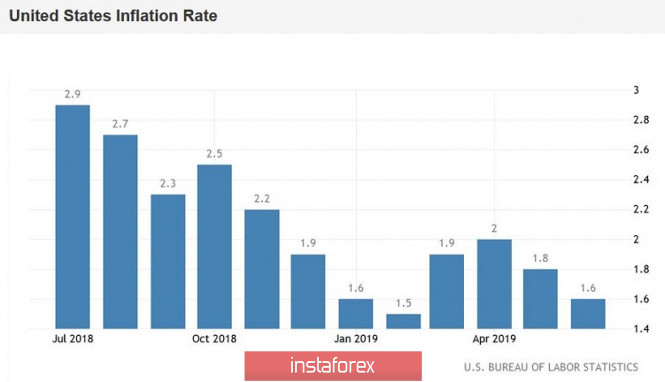
| EUR/USD: a preview of the week Posted: 12 Aug 2019 01:12 AM PDT Over the weekend, US President Donald Trump said that the White House will not devalue the dollar, despite similar actions of China against the yuan. And although the American President put an end to long disputes regarding the possibility of such actions, the market ignored his words. Moreover – the euro/dollar pair started the trading week with small corrective growth, returning to the 12th figure. This reaction is since the traders in recent time of the minimum estimated the probability of this scenario. In early August, White House economic adviser Larry Kudlow, as well as US Treasury Secretary Steven Mnuchin denied such intentions, and Trump, in turn, only confirmed their commitment to the position. But the further easing of the Fed's monetary policy parameters is still in the focus of market participants' attention, so the upcoming releases can cause increased volatility in the pair. However, Monday is empty in this context. Although the monthly budget execution report will be published today during the US session, it usually has little effect on the price dynamics of the pair. While on Tuesday, the most important indicator will be released – the US consumer price index. Let me remind you that at its July meeting, the US regulator hinted at a possible rate cut in September or one of the meetings before the end of the year – noting that the Fed's decision will depend on the incoming data (first of all, we are talking about the state of the labor market and inflation). But then, the market ignored this remark, due to the recovery of many economic indicators. In particular, Nonfarm, retail sales, consumer confidence, average hourly wage growth, and the GDP – all of these indicators showed growth.
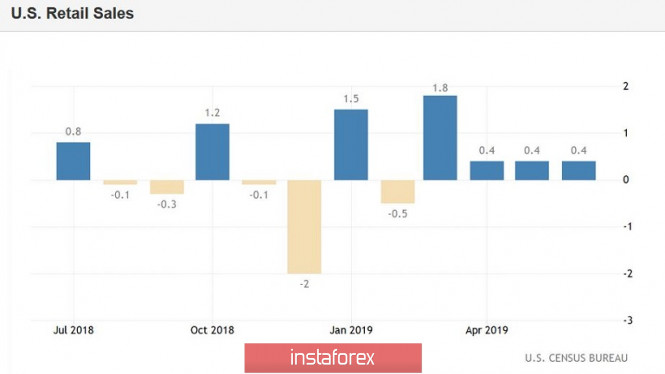
Such dynamics gave traders confidence that the Federal Reserve will limit itself to only one " precautionary" round of rate cuts. But the unexpected escalation of the trade war has exacerbated the general fundamental background, after which the probability of easing the Fed's monetary policy has increased again. Weak inflation will only increase concerns, putting pressure on the dollar. According to forecasts, the July consumer price index will show a positive trend – in monthly terms, it will grow to 0.3% (after a weak result of 0.1% in June), and in annual terms – to 1.7% (after a decline to 1.6%). In turn, the core index (excluding food and energy prices) should show a weaker result: +0.2% in m/m and 2.0% y/y. If the above figures come out worse than the forecast values, the dollar will again fall under the wave of sales. During the European session on Tuesday, the final estimate of inflation growth in Germany for July will be published (according to forecasts, the final estimate will coincide with the initial one). Also, we find the index of sentiment in the business environment from the ZEW Institute in Germany and throughout the euro area. In both cases, a negative result is expected – the indicators will not only remain in the negative area but also update the multi-month lows. On Wednesday, the EUR/USD pair will respond to Chinese data on industrial production (projected to fall from 6.3% to 6.0%), as well as data on the growth of the European economy – we learn the second estimate of GDP growth in the eurozone. According to general forecasts, the second estimate will coincide with the original (+0.2% q/q and +1.1% y/y). Also on Wednesday, preliminary data on the growth of the German economy will be published. According to experts, Germany's GDP in the second quarter will fall to a negative area (-0.1% q/q -0.3 y/y). On Thursday, many European trading platforms will be closed – the Catholic world celebrates the assumption of the blessed virgin Mary. Nevertheless, during the American session on Thursday, releases of quite important data are expected. First of all, we are talking about the indicator of retail sales in the US. July data should repeat the June results, so this release will affect the dynamics of the pair only if it is worse or better forecasts. Also on Thursday, it is worth paying attention to the labor cost index – according to some analysts, this is one of the "favorite" Fed inflation indicators. In the first quarter of this year, it fell to the level of -1.6%, but in the second quarter, the indicator is expected to recover to 1.7%. This indicator allows us to estimate the rate of wage growth in the United States and, accordingly, is a good indicator of inflationary pressure in the country. Again, if he disappoints, the concern of investors about the reaction of members of the Federal Reserve will only increase.
In general, macroeconomic reports will only complement the fundamental picture of the EUR/USD pair. Investors will continue to focus on the trade conflict between the US and China. Today, the People's Bank of China lowered the exchange rate of the national currency again – along with the dollar, the yuan has already weakened to 7.066. This suggests that the confrontation continues, and the Chinese do not intend to conclude a deal on deliberately unfavorable terms, especially in the context of the rating victories of Democrat Joe Biden. According to a poll conducted this weekend, the former Vice President of the United States in the struggle for the presidency would be ahead of the current president Donald Trump by eight percentage points. In light of these trends, Beijing will not rush to conclude a deal with Trump, which soon will only increase the pressure on China. This fact will harm the position of the US currency. However, the potential for corrective growth of the EUR/USD pair is limited due to the political crisis in Italy. The actual collapse of the coalition is fraught with early elections, the results of which may come to power more radical right-wing policies that will only exacerbate the conflict with Brussels. Thus, the euro/dollar pair is "under the crossfire" of fundamental problems – both on the part of the dollar and the euro. This fundamental picture assumes a wide-range flat in the range between 1.1155 (Tenkan-Sen line on the daily chart) and 1.1260 (the lower boundary of the Kumo cloud on the same timeframe). The material has been provided by InstaForex Company - www.instaforex.com |


| You are subscribed to email updates from Forex analysis review. To stop receiving these emails, you may unsubscribe now. | Email delivery powered by Google |
| Google, 1600 Amphitheatre Parkway, Mountain View, CA 94043, United States | |
No comments:
Post a Comment