Forex analysis review |
- Fractal analysis of the main currency pairs on August 22
- The game against the dollar will not bring benefits, and the pound will fall
- Gold at the crossroads: there are plenty of reasons for a correction, but no less in favor of growth
- The Swiss franc is stable, but it is recommended to hedge
- Under siege of sanctions: the market lost about 2.7 million barrels of Iranian oil
- EUR/USD: the dollar is waiting for signals from the Fed
- GBP/USD: Brussels expects a clear answer from London, selling the pound is still a priority
- USD/JPY: Bulls pull the cover onto themselves
- Will the Fed limit itself to one rate cut this year? The pound will remain volatile in the near future
- AUD/USD. The Australian dollar takes advantage of the lull as it tries to conquer the 68th figure
- Nervous expectations (daily review of EUR/USD and GBP/USD on 08.21.2019)
- What happens when a dog wags its tail? (we expect the EURUSD pair to consolidate and the USDCAD pair to decline again)
- August 21, 2019 : EUR/USD SHORT-TERM trend reversal is about to be confirmed.
- August 21, 2019 : GBP/USD Intraday technical analysis and trade recommendations.
- BTC 08.21.2019 - potential long term bear cycle in the play
- Gold 08.21.2019 - Completed ABC downward correction
- EUR/USD for August 21,2019 - Watch for upward breakout of the 3-day balance
- Canadian dollar boosted by inflation data, USD/CAD rallies
- GBP/USD: plan for the US session on August 21. The pound continues to storm, but buyers hold the market
- EUR/USD: plan for the US session on August 21. No news – no movement. The protocols of the Fed to undermine the markets
- Technical analysis of GBP/USD for August 21, 2019
- Analysis for EUR/USD and GBP/USD on August 21st. An empty calendar is not a reason to be upset
- Indicator analysis. Daily review for GBP/USD pair as of August 21, 2019
- Indicator analysis. Daily review for EUR/USD pair as of August 21, 2019
- Forecast for Bitcoin and US dollar on August 21st. The difference between bitcoin and any other investment tool
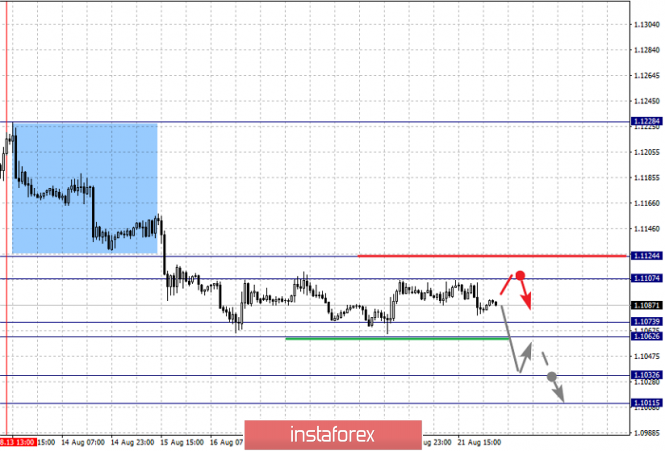
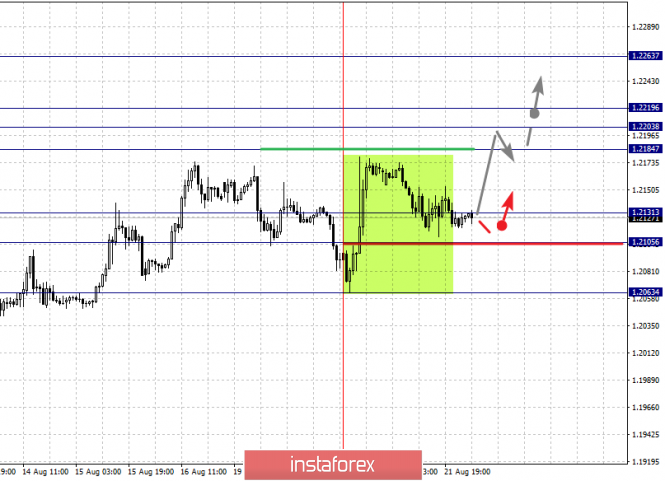
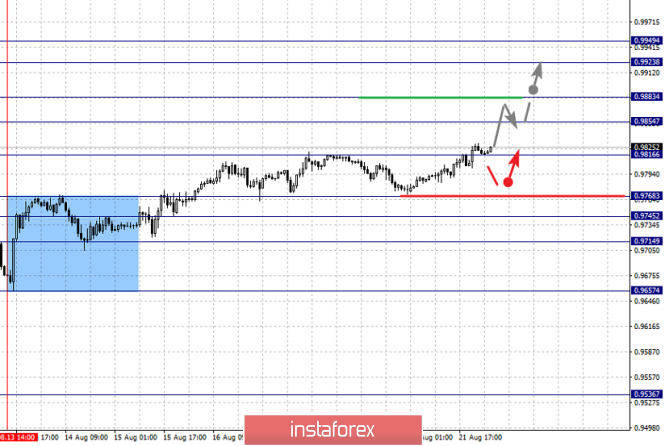
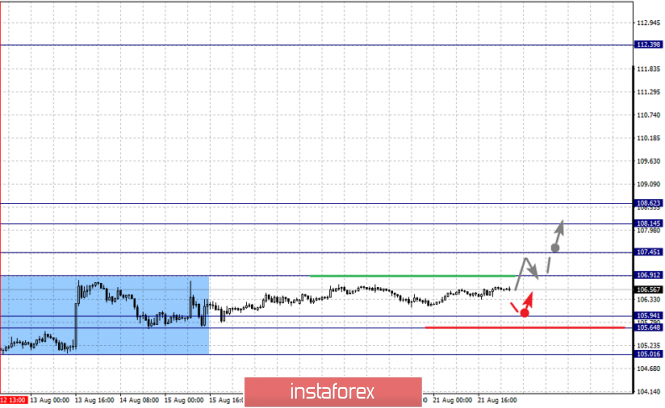
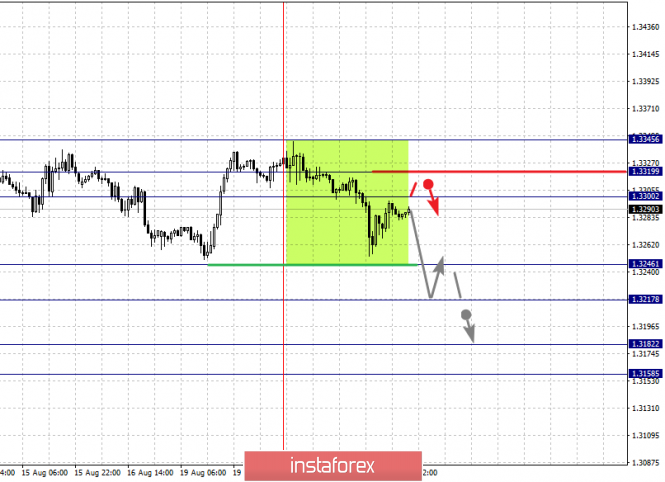
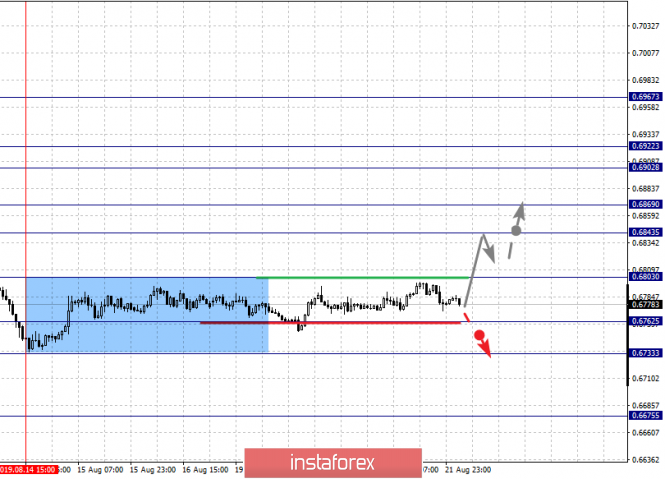
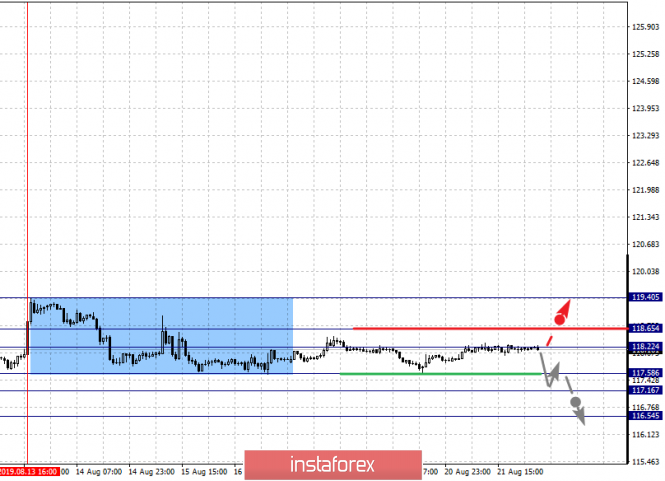
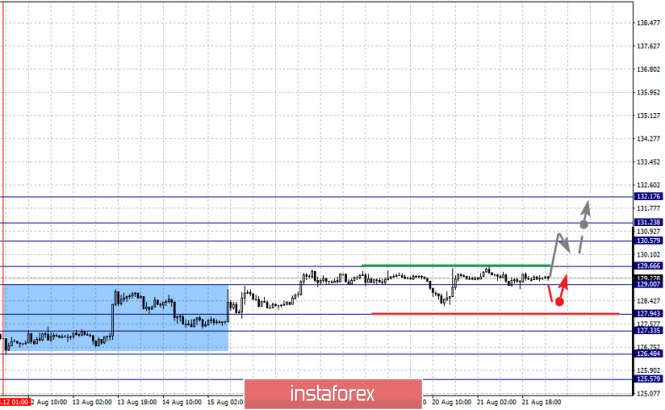
| Fractal analysis of the main currency pairs on August 22 Posted: 21 Aug 2019 06:26 PM PDT Forecast for August 22 : Analytical review of currency pairs on the scale of H1: For the euro / dollar pair, the key levels on the H1 scale are: 1.1124, 1.1102, 1.1073, 1.1062, 1.1032 and 1.1011. Here, the price is in correction from the downward structure on August 13. Short-term movement to the bottom is except in the range of 1.1073 - 1.1062. The breakdown of the latter value will lead to a pronounced movement. Here, the goal is 1.1032. Price consolidation is near this level and hence, the possibility of a correction. For the potential value for the downward trend, we consider the level of 1.1032. The breakdown of the level of 1.1107 will lead to the formation of a pronounced potential for the top. In this case, the first goal is 1.1124, wherein consolidation is near this level. The main trend is the downward cycle of August 13, the correction stage. Trading recommendations: Buy 1.1108 Take profit: 1.1122 Buy Take profit: Sell: 1.1060 Take profit: 1.1035 Sell: 1.1030 Take profit: 1.1011 For the pound / dollar pair, the key levels on the H1 scale are: 1.2263, 1.2219, 1.2203, 1.2184, 1.2131.1.2105 and 1.2063. Here, the price forms a local structure for the subsequent development of the upward trend and is currently in deep correction. The continuation of the movement to the top is expected after the breakdown of the level of 1.2185. In this case, the target is 1.2203, wherein consolidation is near this level. The passage of the price at the noise range 1.2203 - 1.2219 should be accompanied by a pronounced upward movement. Here, the target is 1.2263. We expect a pullback to this level from this level. Consolidated movement is possibly in the range of 1.2131 - 1.2105. The breakdown of the latter value will have the downward structure. In this case, the potential target is 1.2063. The main trend is the local structure for the top of August 20, the correction stage. Trading recommendations: Buy: 1.2185 Take profit: 1.2203 Buy: 1.2220 Take profit: 1.2260 Sell: 1.2129 Take profit: 1.2105 Sell: 1.2103 Take profit: 1.2065 For the dollar / franc pair, the key levels on the H1 scale are: 0.9949, 0.9923, 0.9883, 0.9854, 0.9816, 0.9768, 0.9745 and 0.9714. Here, we follow the ascending structure of August 13. At the moment, we expect a movement to the level of 0.9854. Short-term upward movement, as well as consolidation is in the range of 0.9854 - 0.9883. The breakdown of the level of 0.9883 should be accompanied by a pronounced upward movement. Here, the target is 0.9923. For the potential value for the top, we consider the level of 0.9949. Upon reaching which, we expect consolidation, as well as a pullback to the bottom. Short-term downward movement is possibly in the range of 0.9768 - 0.9745. The breakdown of the last value will lead to an in-depth correction. Here, the target is 0.9714. This level is a key support for the top. The main trend is the upward cycle of August 13. Trading recommendations: Buy : 0.9816 Take profit: 0.9854 Buy : 0.9856 Take profit: 0.9881 Sell: 0.9768 Take profit: 0.9747 Sell: 0.9743 Take profit: 0.9715 For the dollar / yen pair, the key levels on the scale are : 108.62, 108.14, 107.45, 106.91, 106.35, 105.94, 105.64 and 105.01. Here, we continue to monitor the ascending structure from August 12. The continuation of the movement to the top is expected after the breakdown of the level of 106.91. In this case, the target is 107.45, wherein consolidation is near this level. The breakdown of the level of 107.45 should be accompanied by a pronounced upward movement. Here, the goal is 108.14. For the potential value for the top, we consider the level of 108.62. Upon reaching which, we expect a pullback to the bottom. The range of 105.94 - 105.64 is a key support for the top. Its passage at the price will lead to the development of a downward movement. In this case, the target is 105.01. The main trend: building potential for the top of August 12. Trading recommendations: Buy: 106.91 Take profit: 107.43 Buy : 107.47 Take profit: 108.14 Sell: Take profit: Sell: 105.62 Take profit: 105.04 For the Canadian dollar / US dollar pair, the key levels on the H1 scale are: 1.3345, 1.3319, 1.3300, 1.3246, 1.3217, 1.3182 and 1.3158. Here, the price forms the potential for the downward movement of August 20. The continuation of the movement to the bottom is expected after the breakdown of the level of 1.3246. In this case, the target is 1.3217, and near this level is a price consolidation. The breakdown of the level of 1.3217 should be accompanied by a pronounced downward movement. Here, the target is 1.3182. For the potential value for the bottom, we consider the level of 1.3158. Upon reaching which, we expect consolidation, as well as a rollback to the top. Short-term upward movement is possibly in the range of 1.3300 - 1.3319. The breakdown of the latter value will favor the formation of an upward structure. Here, the target is 1.3345. The main trend is the formation of potential for the bottom of August 20. Trading recommendations: Buy: 1.3300 Take profit: 1.3316 Buy : 1.3321 Take profit: 1.3345 Sell: 1.3246 Take profit: 1.3219 Sell: 1.3215 Take profit: 1.3182 For the Australian dollar / US dollar pair, the key levels on the H1 scale are : 0.6967, 0.6922, 0.6902, 0.6869, 0.6843, 0.6803, 0.6762, 0.6733 and 0.6675. Here, we are following the development of the ascending structure of August 7, and the price has formed a small potential for the top of August 14. The continuation of the upward movement is expected after the breakdown of the level of 0.6803. In this case, the first target is 0.6843. Short-term upward movement, as well as consolidation is in the range of 0.6843 - 0.6869. The breakdown of the level of 0.6870 should be accompanied by a pronounced upward movement. Here, the target is 0.6902. Price consolidation is in the range of 0.6902 - 0.6922. For the potential value for the top, we consider the level of 0.6967. Upon reaching which, we expect a pullback to the bottom. We expect a consolidated movement in the range of 0.6762 - 0.6733. The breakdown of the level of 0.6733 will lead to the development of a downward structure. In this case, the potential target is 0.6675. The main trend is the ascending structure of August 7, the correction stage. Trading recommendations: Buy: 0.6805 Take profit: 0.6840 Buy: 0.6844 Take profit: 0.6867 Sell : 0.6760 Take profit : 0.6736 Sell: 0.6730 Take profit: 0.6680 For the euro / yen pair, the key levels on the H1 scale are: 119.40, 118.65, 118.22, 117.58, 117.16 and 116.54. Here, we are following the development of local potential for the bottom of August 13. Short-term downward movement is expected in the range of 117.58 - 117.16. The breakdown of the latter value will allow us to expect movement to a potential target - 116.54, where near this level is a consolidation. Short-term upward movement is expected in the range of 118.22 - 118.65. The breakdown of the last value will have the formation of an ascending structure for the top. Here, the first goal is 119.40. The main trend is the formation of a local descending structure of August 13. Trading recommendations: Buy: 118.22 Take profit: 118.62 Buy: 118.70 Take profit: 119.40 Sell: 117.56 Take profit: 117.18 Sell: 117.14 Take profit: 116.55 For the pound / yen pair, the key levels on the H1 scale are : 132.17, 131.23, 130.57, 129.66, 127.94, 127.33, 126.48 and 125.57. Here, we follow the development of the ascending structure of August 12. Short-term upward movement is expected in the range 129.00 - 129.66. The breakdown of the last value will lead to a pronounced upward movement. Here, the target is 130.57. Short-term upward movement, as well as consolidation is in the range of 130.57 - 131.23. For the potential value for the top, we consider the level of 132.17. Upon reaching which, we expect consolidation, as well as a pullback to the bottom. Short-term downward movement is possibly in the range of 127.94 - 127.33. The breakdown of the latter value will favor the development of a downward structure. Here, the first goal is 126.48. For the potential value, we consider the level of 125.57. The main trend is building potential for the top of August 12. Trading recommendations: Buy: 129.67 Take profit: 130.55 Buy: 130.60 Take profit: 131.20 Sell: 127.30 Take profit: 126.50 Sell: 126.44 Take profit: 125.60 The material has been provided by InstaForex Company - www.instaforex.com | ||||||||||||||||
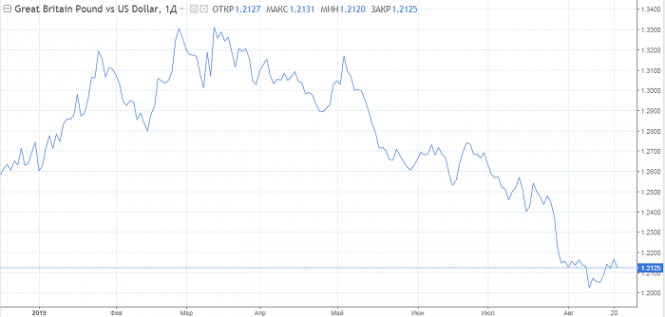
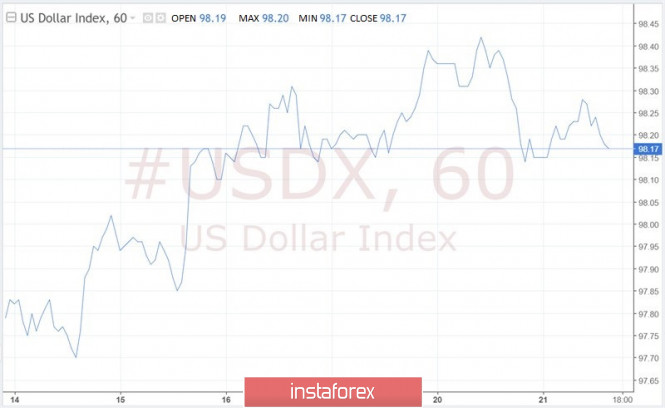
| The game against the dollar will not bring benefits, and the pound will fall Posted: 21 Aug 2019 05:03 PM PDT Recent positive macroeconomic data has lifted the mood for pound traders, but not for long. The approaching date of Britain's exit from the EU has forced the markets to decline from heaven to earth. "Hard Brexit" has not yet been canceled. Over the past three months, the GBP / USD pair has lost almost 7% of its value. Some short-term positive sterling brought Angela Merkel. According to the German Chancellor, EU members will think about practical solutions for the Irish border after Brexit. It was the other day, and yesterday, traders are discouraged again. The date of Britain's exit from the EU has changed twice, and apparently, there won't be a third time. Boris Johnson stubbornly insists that the country will leave the group on October 31 under any circumstances. This worries market participants and constantly puts pressure on the British currency. According to the market, the scandalous "divorce" with the European Union will harm the economy of England. Due to rising inflation, the probability of increasing rates in the country is growing. Moreover, the Central Bank will be able to increase them, provided that Brexit occurs without complications. In addition, Labor party leader Jeremy Corbyn is trying to influence the Brexit situation. He plans a third attempt to change the release date. To do this, the British Prime Minister should be removed from office. However, Corbyn's attempts to pass a vote of no confidence in Boris Johnson were unsuccessful. Although there is information that the Labor Party and the Scottish National Party are joining forces to prevent disordered Brexit. Meanwhile, Boris Johnson is scheduled to meet with European leaders this week. Given that the British government does not plan to change its position in relation to the exit from the EU, the pound should prepare for new negative news. Thus, the GBP / USD pair will remain under pressure until October 31. The "tough" scenario assumes the strongest depreciation of the English currency. This fundamental factor dominates technical analysis. Under current circumstances, you should pay attention to short positions in the pair GBP / USD. Long positions can only be considered after the growth of quotes above 1.2280. The first signal for purchases will be a breakdown of the short-term resistance level of 1.2120, but it should be bear in mind that growth above resistance levels of 1.2480 and 1.2530 is hardly possible. In general, the market is dominated by long-term negative dynamics, which means that short positions are preferred. The immediate goal of the decline is 1.20. This is the minimum level of 2017. As for the dollar, it remains stable in spite of Donald Trump's calls for an aggressive policy easing. Thus, the growing dollar makes the pound even more vulnerable to sales. Last Wednesday, the minutes of the July meeting of the Fed was published. If traders find hints in the document for further easing of the policy, the US currency may turn down, but there is no reason to expect a collapse. The US economy in the context of trade conflicts and a slowdown in global GDP remains stable and shows growth. Representatives of the White House and the Fed continue to convince the market, focusing on the fact that the States are far from a recession. This fact supports the demand for the dollar and US assets. The markets, in turn, seemed to have gone too far in their expectations, hoping for three rounds of rate cuts. Any slightly disappointing information can lead to emotional reactions. An even bigger catalyst for the markets will be Jerome Powell's speech at the Symposium on Friday. It is worth noting that such events were used by the Fed to communicate with markets during periods of uncertainty. The material has been provided by InstaForex Company - www.instaforex.com | ||||||||||||||||
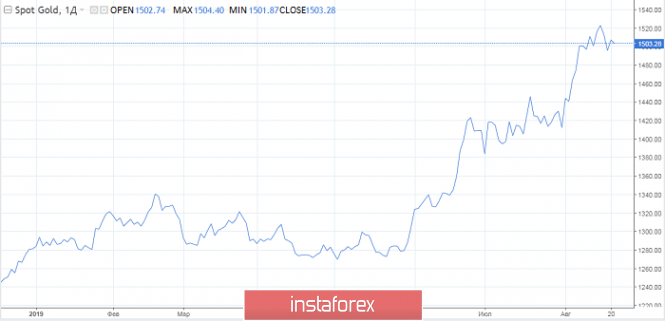
| Gold at the crossroads: there are plenty of reasons for a correction, but no less in favor of growth Posted: 21 Aug 2019 04:53 PM PDT Gold froze at a crossroads. Apparently, speculators who push prices higher, and consumers who want to buy cheaper metals, decided to take a break. Since the beginning of this year, gold has risen by almost 19% in price, breaking the psychologically important mark of $1,500 per ounce. The last time this level was observed was in April 2013. The main reason for the growth of quotes was the fear of investors about the global recession, which forces them to shift capital to safe haven assets. It is assumed that if the concerns of market participants begin to be confirmed, the rally of precious metals will continue. "Rising prices to a six-year high is primarily due to bonds, and it is extremely important for investors to monitor changes in their yield in order to understand what will be the dynamics," said Oax Hansen of Saxo Bank. The decrease in bond yields in the world has already led to the fact that sovereign bonds with a total volume of almost $16 trillion give a negative percentage. The jump in the cost of precious metals was also caused by expectations that the Fed, the ECB and other central banks would stimulate economic growth in various ways. The easing of monetary policy tends to lower interest rates and increase the investment attractiveness of gold. A sharp rise in prices carries the risks of an equally sharp decline, analysts warn. "The aggregate gold volume in ETFs is steadily growing and has reached 77.4 million ounces, which is the highest for six years. Previous similar bursts of speculative demand caused a serious correction of quotations," O. Hansen said. In addition, fears of a global recession may also be exaggerated: now markets are most likely driven by emotions. Recent macroeconomic data for the United States were positive and the reduction of interest rates by the world central bank is aimed at maintaining economic growth. Reducing tensions in Washington and Beijing's trade relations could also serve as a reason for a short, albeit sharp, price correction. Another negative point for gold may be the expected decline in demand for jewelry in India due to an increase in import duties in the country from 10% to 12.5%, as well as a change in ETF positions, which will respond to the sale of precious metals in response to a restoration of risk appetite . In case the Fed comes with a surprise - not to continue to lower the interest rate - a correction in gold prices is also possible. "We expect the Fed to disappoint the market without lowering interest rates in the coming months, and profit taking will ultimately trigger the end of the gold rally. In the event of a pullback, the $1,350 mark per ounce is likely to become a new level of support," representatives of the Fitch rating agency said. However, there are plenty of factors in favor of the growth of quotes. According to Deutsche Bank analysts, the main drivers of gold price growth will be real interest rates, stock risk premium, US dollar, as well as purchases of precious metals by central banks. According to the forecast of Deutsche Bank, the price of gold will be $1,575 per ounce in the next year and a half, and under certain conditions it can reach $1,700. "Gold is an extremely profitable investment amid the easing of monetary policy by the leading central banks of the world," said Mark Mebius, founder of the Mobius Capital Partners investment fund. "The long-term prospect of gold – up, up and only up, because the money supply in the world will grow, grow and grow again. Therefore, I believe that gold should be bought at any price," he said. The material has been provided by InstaForex Company - www.instaforex.com | ||||||||||||||||
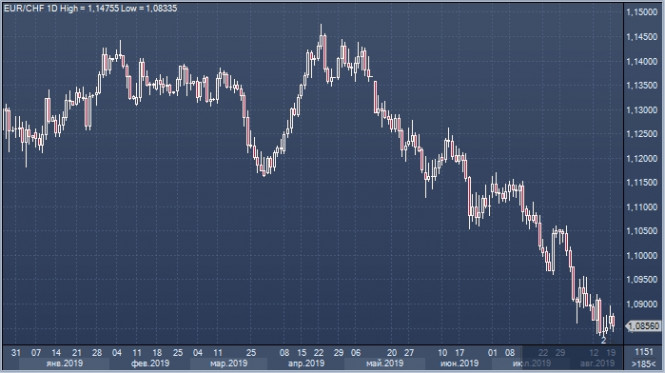
| The Swiss franc is stable, but it is recommended to hedge Posted: 21 Aug 2019 04:44 PM PDT According to analysts at the leading bank, Wells Fargo, the Swiss currency expects a gradual weakening against the European one. At the same time, experts do not exclude a slight rise of the franc against the US dollar. Thus, they recommend hedging the risks associated with the Swiss currency. As observed by Nick Bennenbroek, head of foreign exchange at Wells Fargo, the Swiss National Bank could begin to gradually weaken the national currency. At the moment, the regulator has stepped up measures aimed at curbing the growth of the Swiss franc. In this situation, investors who may suffer losses from changes in the franc / euro exchange rate should be hedged, warn Wells Fargo. Many market participants believe that the Central Bank of Switzerland is ready to lower interest rates. It is possible that this will happen next month, since traders are already laying such a step in prices. If the upward pressure on the franc continues, then on September 19, 2019, the National Bank of Switzerland will reduce rates, Wells Fargo is confident. Currently, the EUR / CHF pair is trading in the range of $ 1.08707– $ 1.08787. On the other hand, the USD / CHF pair is trading at $ 0.9771 and continues to move within the correction and the downward channel. An additional signal in favor of the fall of the USD / CHF pair may be a rebound from the resistance area, experts say. The forecast for this pair involves testing the resistance level near the $ 0.9785 mark. However, experts do not rule out the fall to the level of $ 0.9625. Wells Fargo believes that the Swiss currency will strengthen slightly against the US dollar relative to current levels, as well as against the euro, it will become weaker. | ||||||||||||||||
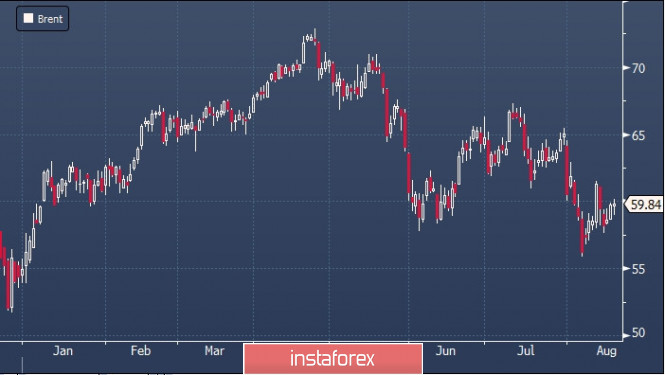
| Under siege of sanctions: the market lost about 2.7 million barrels of Iranian oil Posted: 21 Aug 2019 04:43 PM PDT According to information and analytical agency Refinitiv Eikon, last month, oil exports from Iran amounted to only 100 thousand barrels per day. According to analysts, Washington's sanctions on Tehran have robbed the global black gold market of nearly 2.7 million barrels of Iranian oil. Analysts at Refinitiv Eikon note that the United States eliminated Iran from the global market for the supply of raw materials. After the imposition of sanctions against Tehran in November 2018, 11 countries of the world had the exclusive right to buy Iranian oil. However, in May 2019, these counties lost their privileges. US authorities hoped to reduce the export of Iranian raw materials to zero, and now they are succeeding, analysts say. The world market has not received about 2.7 million barrels of black gold from Iran, and this is not the limit. It should be noted that since restrictions started November 2018, the Islamic Republic has not provided official data on oil exports, so it is difficult to assess the exact losses. Since the beginning of this year, Brent crude oil has risen in price on the world market by 11.3%, and light grade WTI - by 23.7%. Now the reference raw material is trading slightly below $60 per barrel, which is much less than the 2019 high of $75.60 per barrel. Analysts believe that we should not expect a steady increase in oil prices in the near future, as a number of factors put pressure on the market. These include concerns about a slowdown in global demand, a protracted trade conflict between the United States and China, the extension of the OPEC+ agreement to limit oil production, as well as US sanctions against Iran and Venezuela. | ||||||||||||||||
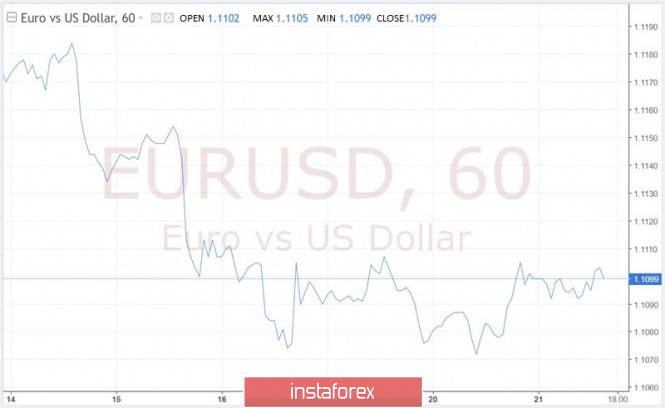
| EUR/USD: the dollar is waiting for signals from the Fed Posted: 21 Aug 2019 04:43 PM PDT Since the end of last week, the EUR/USD pair has been trading in a narrow range of 1.1060-1.1110. On one side of the scale, the European one, are the weak economic indicators of the eurozone, the political crisis in Italy and the uncertainty surrounding Brexit, on the other, the American one, there are eye-catching statistics for the US and statements by the White House and the Federal Reserve's leadership that the country's economy is still solid stands on its feet and she is not afraid of trade wars. The answer to the question on whose side the advantage should be, it would seem, is obvious - on the side of the greenback. Based on this, the nearest target for EUR/USD is support in the 1.1000-1.1025 zone, after breaking through to the parity of the euro against the dollar it will remain within reach. However, if you imagine other scales, then the picture becomes somewhat different. On the European scale - announced last week by Olli Rehn, a member of the Governing Council of the ECB, lower interest rates and the revival of the quantitative easing program (QE) in September, while on the American - the expectation of a recession in the United States, Donald Trump's criticism of the Fed's actions and a possible reduction in the federal funds rate by the end of this year from 2.25% to 1.75%. If Federal Reserve Chairman Jerome Powell succumbs to pressure from the White House, an upward turn in EUR/USD and growth to the area of 1.1300-1.1400 are not excluded. According to analysts, the minutes of the July Fed meeting, which will be released today, can provide some clarity about the US financial policy. Last month, the US central bank lowered the interest rate by 0.25% to counter the increased risk to the US economy associated with the slowdown in global growth and trade wars. It should be noted that there is no consensus among the leaders of the Fed on this matter. Two of the twelve members of the FOMC spoke out against the cut. Some other officials also questioned the need for such a step. "We should avoid over-scale easing of monetary policy in the absence of significant problems in the economy. It is necessary to focus on unemployment and inflation. I believe that the current economic situation in the country is quite favorable. The weakening of monetary policy is fraught with certain costs if it is done unnecessarily," said Boston Fed President Eric Rosengren last Monday. Despite the differences in the central bank's leadership, Fed Chairman J. Powell made it clear that further easing of monetary policy is quite possible. Therefore, market participants expect additional signals from the Federal Reserve regarding the prospects for monetary policy. It is assumed that the soft tone of the minutes from the July FOMC meeting will negatively affect the dollar, while the harsh rhetoric of the Fed leadership will push it to further growth. | ||||||||||||||||
| GBP/USD: Brussels expects a clear answer from London, selling the pound is still a priority Posted: 21 Aug 2019 04:43 PM PDT According to some analysts, despite the fact that the pound has managed to stay above the psychological support at $1.20 this month even in the conditions of growing uncertainty around Brexit, the chances of sellers to reach this mark are still high. UK Prime Minister Boris Johnson, is still determined to withdraw the country from the European Union on October 31, and negotiators from the eurozone still do not want to discuss a new deal. The day before, Reuters reported that 27 EU member states regretted the fact that the British prime minister had not yet made concrete proposals to replace the Irish back-stop. B. Johnson's point of view on this issue in many respects echoes the position of his predecessor - Theresa May. She also wanted to avoid a tight border in Ireland and find alternative mechanisms to achieve this goal, but her ideas were not supported by British MPs, and the current head of government is not immune from a similar scenario. Labour leader Jeremy Corbyn has already said that he will do everything possible to avoid Brexit without a deal, adding that in the event of a new referendum he will definitely introduce a clause that allows Great Britain to remain in the EU. Speaker of the House of Commons, John Bercow, in turn, said that he would not allow the prime minister to suspend the work of Parliament. As the political situation in the United Kingdom continues to deteriorate, outlining not the brightest prospects for the pound, analysts recommend that you refrain from opening long positions on the GBP/USD pair. On August 12, the British currency sank to its lowest level since the beginning of 2017 at $ 1.2015 against the US dollar. Last week, positive statistics on the labor market, inflation and retail sales in the UK kept GBP/USD from breaking below the level of 1.20. So far, the pair has not been able to go beyond the range of 1.20-1.2210. The risk of an absence of a deal with the EU and tensions in world trade affect the pound's dynamics, spurring the tendency to sell it during rebound periods. If the pound breaks the $1.20 mark, then it can test the low of $ 1.1841, which was reached in October 2016. The material has been provided by InstaForex Company - www.instaforex.com | ||||||||||||||||
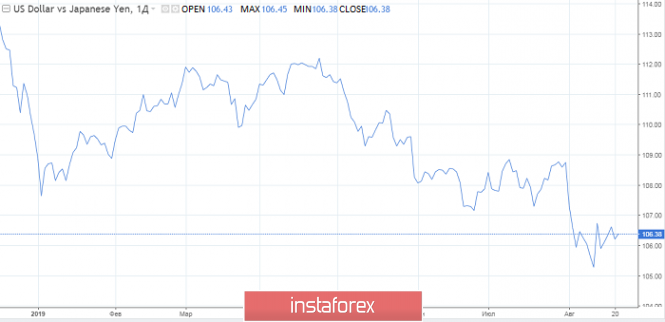
| USD/JPY: Bulls pull the cover onto themselves Posted: 21 Aug 2019 04:42 PM PDT The energetic yen has recently lost all its fuse and is in search of reasons for further growth. It can be inspired by previous market participants' refusal of risky assets or a decrease in treasury profitability. There is nothing on the horizon that could push the Japanese yen and strategists have talked about the potential for lowering the quotes of the safe haven currency. Despite the fact that economists at Goldman Sachs did not adjust their 3-month forecast for USD/JPY at 103, they do not exclude the transfer of control over the situation to the bulls. Data from the United States are mostly positive, the White House flatly refuses to talk about a possible recession in the country. Other states with problems in the economy have already responded by easing monetary policy. Meanwhile, traders continue to monitor the situation in China, markets are also worried about the slowdown in the global economy in the context of small opportunities to reduce rates by key securities. Fears may well serve as a catalyst for the yen's growth. However, a similar situation took place, as noted in Goldman Sachs. Three years ago, the influence of such drivers came to naught, and ended with an increase in USD/JPY quotes by 15% (!). Given the widespread support for fiscal stimulus, the prospects for global economic growth will improve. Fed officials will not need a hasty cut in rates. By the way, new measures are possible on the part of the Bank of Japan. This can be expressed as an increase in purchases of government bonds or as a revision of the yield target. Citigroup and Credit Suisse believe that the yen retains the potential for further growth. In the next 12 months, it can rise in price to 100 yen per dollar. The last time the USD/JPY pair visited the area was in August 2016. Currency strategists draw attention to the fact that this year the Japanese currency showed the best results among competitors from the Group of 10. In relation to the dollar, its growth amounted to 3%. Gold Gold, which is another defensive asset, has grown in price by 6% since the beginning of August. This figure emerged as a result of the aggravation of the trade conflict between the United States and China. Judging by how events are developing in US-Chinese relations, gold may continue the upward trend. Technical analysts predict precious metals at such levels like $1820 and $1920. Currently, the growth of gold quotes is interrupted, and there were opinions about the false start. According to strategists, the financial authorities' willingness to help the markets supports the risk appetite and puts pressure on defensive assets like gold in particular. However, the rise in prices for precious metals can not be called a false start. Another global financial crisis, which, according to the theory of cycles, can happen in the next two years, can not be avoided. An ounce of gold can grow to $1800. The material has been provided by InstaForex Company - www.instaforex.com | ||||||||||||||||
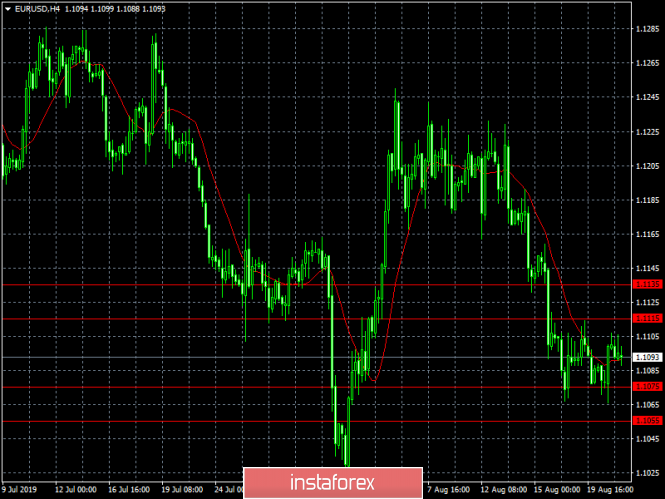
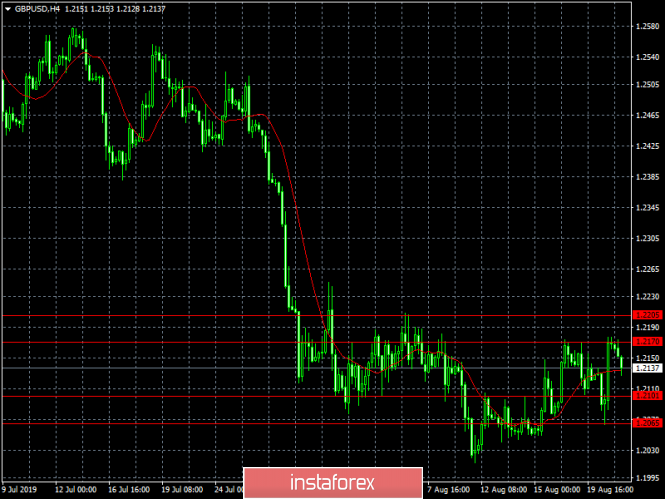
| Posted: 21 Aug 2019 03:53 PM PDT The pound fell in the morning following the release of a report on UK public sector borrowing, while the euro continued to trade in a narrow side channel against the US dollar in anticipation of the July Federal Reserve minutes The publication of the minutes will show how the committee looks at a further cut in interest rates this year, and to what level the rate can be reduced. This week, a number of Fed leaders have already expressed their views, but it is premature to draw any conclusions. Let me remind you during the Federal Open Market Committee meeting, which was held on July 30-31, they decided to lower the interest rate by a quarter point, although some economists suggested that the Fed would lower rates immediately by half a percent. This was the first drop in more than 10 years. Meanwhile, Fed Chairman Jerome Powell signaled that this decrease was purely corrective in the middle of the cycle, and it would not be entirely correct to count on a long reduction cycle in the future. Much will depend on the data on the economy that will come in the 3rd quarter of this year. So far, the only thing that could push the issue of lowering the rate by another quarter of a percentage point into consideration is the aggravation of the trade war between the United States and China, which is now at an impasse. Let me remind you that the new trade duties will come into force on September 1 of this year. In addition, very low inflation continues to be a problem for the Fed. Given the fact that the unemployment rate in the US is at a record low and household wages increase without creating additional inflationary pressure, the Fed is just thinking about the risks of deflation, which many Asian countries suffer from. Do not forget about the constant criticism of the work of the committee by Donald Trump, who "hung all the dogs" on the current Fed chairman Jerome Powell for what he delays in lowering rates and resuming the asset purchase program. By the way, the eurozone and the European Central Bank may return to such a program in the near future, which will further strengthen the US dollar against a number of risky assets and create additional problems for the export of American goods. In any case, Powell is still fighting off all threats from the US president, adhering to the neutrality that is so cared for within the Federal Reserve. As for the technical picture of the EURUSD pair, it has not changed at all. Bears will attempt to update last week's lows with a test of support levels of 1.1060 and 1.1030. If bulls make an attempt to build an upward correction in a pair, then it is best to consider short positions in the trading instrument from the upper boundary of the side channel of 1.1130. A larger resistance level is the area of 1.1160. GBPUSD The British pound slightly fell against the US dollar after the release of the report on net borrowing in the UK public sector. According to data in July this year, borrowing fell by 1.3 billion pounds after a larger reduction of 3.5 billion pounds a year ago. Net public sector demand for cash in the UK in July fell by 14.8 billion pounds against 17.6 billion pounds a year ago. All this suggests that the situation with Brexit, although not so brightly, continues to affect macroeconomic indicators in various fields, which negatively affects the overall economic indicator. In any case, the pound's further movement as a whole, like this whole year, will continue to be based on rumors and rebuttals from Brexit news, which exacerbates the overall picture and exposes the pound to excessive volatility. As for the technical picture of the GBPUSD pair, the upward trend is limited by the resistance of 1.2175, a breakthrough of which will build a new wave of growth and lead to the renewal of highs in the areas of 1.2220 and 1.2270. The medium-term boundary of the downward channel is above this range and it would be impossible to go beyond it without a positive outcome of the situation with Brexit. The material has been provided by InstaForex Company - www.instaforex.com | ||||||||||||||||
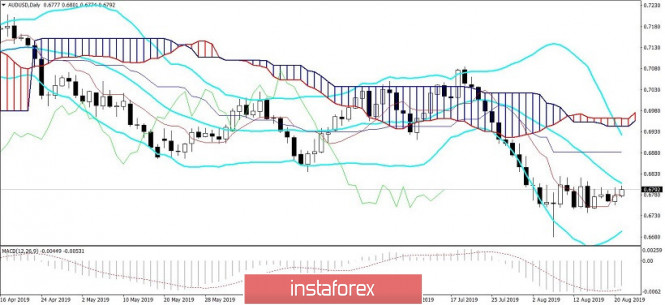
| AUD/USD. The Australian dollar takes advantage of the lull as it tries to conquer the 68th figure Posted: 21 Aug 2019 03:53 PM PDT The Australian dollar, coupled with the US currency, woke up from a lethargic dream today and tested the 68th figure, showing an upward impulse. However, this is far from the AUD/USD bulls' first attempt to enter the area of this figure - over the past two weeks, buyers have stormed the 0.6800 mark three times, but in each case they have come back. On the other hand, aussie bears also look helpless - trying to go below 0.6750, they likewise fail. In other words, a contradictory fundamental background allows both bulls and bears of the AUD/USD pair to intercept the initiative, but, on the other hand, does not allow them to go too far from the middle of the price range. Therefore, today we are witnessing only one of the attempts of traders to leave a given price range. Looking ahead, it is worth noting that this attempt is unlikely to be successful - dollar bulls froze in anticipation of Jerome Powell's speech in Jackson Hole, and the Australian currency does not have its own strength to break the pair's trend. Nevertheless, if AUD/USD bulls overcome the nearest resistance level of 0.6810 (the middle line of the Bollinger Bands indicator on the daily chart), they will have a chance to gain a foothold in the 68th figure, and in the future - rise one step higher, thereby approaching the key resistance level of 0.7000. However, it is too early to talk about such price heights. In general, the foreign exchange market shows minimal activity this week - and this is entirely justified, given the upcoming forum in Jackson Hole, which starts tomorrow. In addition, the Fed's minutes will be published at the end of today's US trading session, the rhetoric of which may also affect investor sentiment. And yet, the central event of the week is the speech of the head of the Federal Reserve (Friday, August 23, at 14:00 London time) - until that moment, dollar bulls are unlikely to decide on a large-scale offensive (or retreat). At the same time, it is worth noting that the Fed minutes is an important document, but at the same time it is belated. It reflects the mood of traders at the time of the meeting, although over the past two weeks there have been many events that could affect the position of members of the US regulator. For example, last week fairly good data were published on inflation in the United States, as well as on growth in retail sales. In addition, the level of labor costs in the United States was published last Thursday, which also ended up in the green zone, significantly ahead of forecasts. But all of the above releases were published after the July meeting of the Fed, so the minutes of this meeting must be considered through the prism of this fact. However, if members of the Federal Reserve voiced strong concern about the growing trade conflict between the United States and China, indicating in this context the possibility of further easing of monetary policy, the dollar may fall under a wave of sales, since since July 31 (that is, since the last meeting) the relationship between superpowers have not improved, despite the recent steps of Washington and Beijing. The Australian dollar also reacts quite sharply to the dynamics of the US-Chinese conflict, so the lull period allows aussie traders to switch to other fundamental factors. In particular, the minutes of the last meeting of the Reserve Bank of Australia published earlier this week reassured investors about the regulator's next steps. Although the RBA members did not exclude the option of a third rate cut this year, they made it clear that the central bank, firstly, will not resort to aggressive mitigation methods (by analogy with the RBNZ), and secondly, they will evaluate everything that is "for" and "against" before the next decision. Earlier, the head of the Australian regulator Philip Lowe voiced cautious, but at the same time optimistic assessments of the current situation. According to him, the Australian economy has reached a "soft turning point". The protective measures that were taken by the Australian government and the central bank (in particular, we are talking about tax cuts, lower interest rates) against the backdrop of the devaluation of the national currency, apparently, had a positive effect. According to RBA economists, the results of quarterly GDP growth will gradually improve. Thus, the fundamental background for the AUD/USD pair has improved somewhat - partly due to the wait-and-see attitude of dollar bulls and the RBA members. The renewed risk appetite in the foreign exchange market also contributed to the strengthening of the Australian dollar and, accordingly, it's correction. As mentioned above, the initial task of the pair's bulls is to overcome the mark of 0.6810. Then buyers will have chances to consolidate success (the next resistance level is at 0.6880 - this is the Kijun-sen line on D1). Otherwise, the pair will return to its familiar range of 0.6740-0.6880, where it will be traded before the Fed's speech on Friday. The material has been provided by InstaForex Company - www.instaforex.com | ||||||||||||||||
| Nervous expectations (daily review of EUR/USD and GBP/USD on 08.21.2019) Posted: 21 Aug 2019 03:53 PM PDT Against the background of a completely empty macroeconomic calendar, the dollar has somewhat weakened in relation to absolutely all currencies. The single European currency and the pound's growth were noteworthy since it was synchronous and coincided in time with the statements of Boris Johnson and Donald Tusk regarding Brexit. Although the essence of these same statements does not add any optimism. The so-called Backstop, which implies maintaining a transparent border between Ireland and Northern Ireland, remains a stumbling block. Even in the case of an unregulated Brexit, that is, without any transaction between London and Brussels. This mechanism, in essence, turns Northern Ireland into a transit zone through which goods and services will move between the European Union and the United Kingdom, bypassing customs control. In other words, by and large, the situation in trade after Brexit will remain exactly the same as it is at this moment in time, despite London's desire to make some changes. But the worst thing is that it will lead to the flow of transit revenues from other parts of the United Kingdom to Northern Ireland, which will result in an increase in internal conflicts and disputes. So it is not surprising that British MPs consider this item a threat to the integrity of Great Britain. So, Boris Johnson demands to exclude this item and work out some new options for resolving the issue. In turn, Dornald Tusk once again expressed the common position of the European Union that no changes would be made to the proposed version of the agreement. And in theory, this should have greatly disappointed investors, but the reaction was completely different. The thing is that as the prime minister, this is Boris Johnson's first official contact with Europe regarding this issue. Most importantly, all parties expressed the hope that it would nevertheless be possible to reach a compromise that would suit both Europe and the United Kingdom. That is, despite all the warlike statements, negotiations are ongoing. Despite the fact that negotiations on the economic part of the agreement will begin only after Brexit, which is due to take place on October 31, the fact that negotiations have continued has somewhat inspired market participants. Although all this is more like an attempt by a drowning man to grab onto a straw. In addition, do not disregard the nervousness of market participants, in anticipation of today's release of the text of the minutes of the Federal Open Market Committee meeting. Especially in the light of yesterday's decision of the People's Bank of China to lower the refinancing rate from 4.35% to 4.25%. After all, what we know for sure is that the decision to reduce the refinancing rate from 2.50% to 2.25% was not unanimous. It was accepted by a simple majority. Consequently, the simple conclusion suggests that this year the Federal Reserve will not mitigate monetary policy. Despite all of Donald Trump's spells, requiring its immediate reduction as much as 1.00%. All this against the background of a clear shift in the mood of almost all the central banks of the world to soften the parameters of their monetary policies. So there are still some concerns that the Federal Reserve will still decide to lower the refinancing rate again at the end of this year. The content of the text of the minutes of the Federal Open Market Committee meeting should remove all issues, but as they say, it is better to play it safe and for the time being proceed from the worst case scenario that the Federal Reserve will continue to mitigate its monetary policy. So that's what basically explains some of the dollar's uncertainty and the desire of investors to cling to any news. The text of the minutes of the Federal Open Market Committee meeting will be published quite late, so that the market will wager its contents tomorrow. So light jitters will persist throughout the day. Well, this to some extent favors the single European currency, which can grow to 1.1125. The situation is similar for the pound, however, the benchmark is 1.2175. | ||||||||||||||||
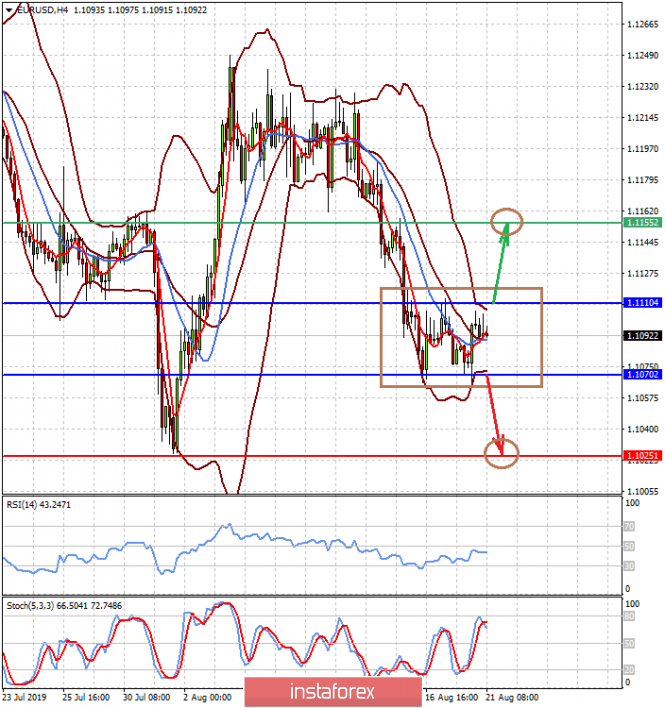
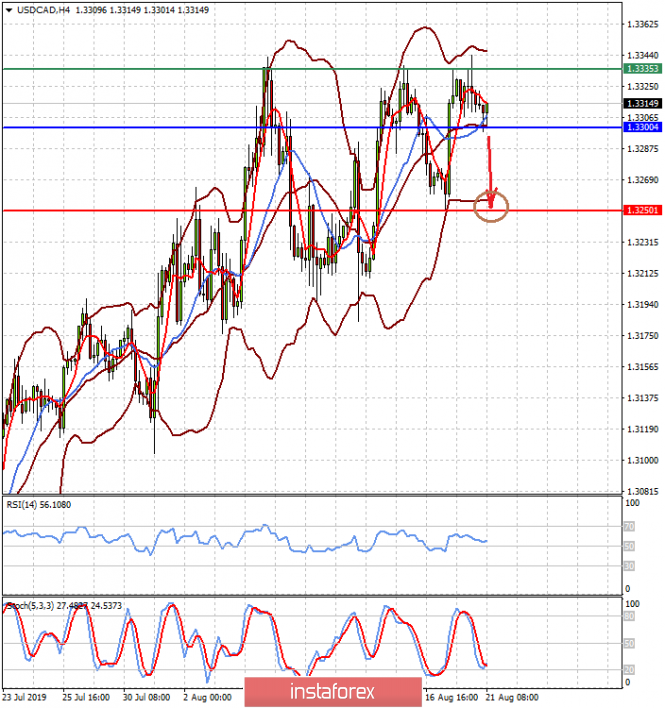
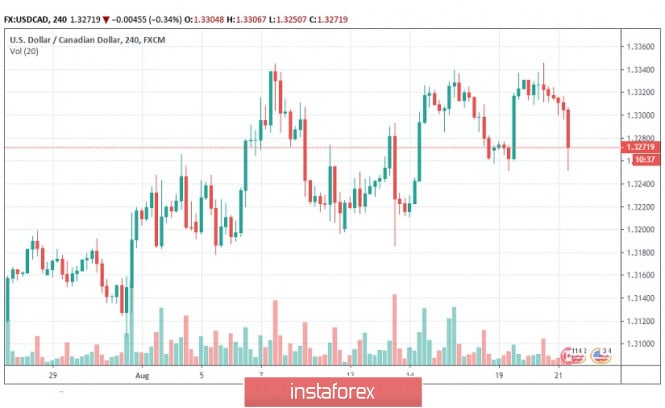
| Posted: 21 Aug 2019 03:53 PM PDT The current head of the Federal Reserve J. Powell is really not to be envied. He is actually between a rock and a hard place. On the one hand, President D. Trump has been exerting pressure on him for several months now, urging the regulator to lower interest rates in order to stimulate further growth of the national economy. In one of his last twitter posts, he wrote that he would like to lower rates by 100 basis points, or 1%. In addition, he mentioned that he does not exclude the possibility of additional tax cuts to stimulate the economy. On the other hand, the US financial market, which expects a recession or economic recession in the country in a few months to come, will be most pressured by the Fed if, as he believes, measures to support the national economy will not be taken, first of all, interest rates will be lowered to acceptable values. Investors motivate their fears by high risks to the economy from the widespread trade war between Washington and Beijing. In addition, it clearly demonstrates the growth of fears and the dynamics of profitability of 2-year-old and 10-year-old Treasuries, which practically converge in profitability and threaten to switch places, demonstrating the inversion factor. The Fed is in a really difficult situation. On the one hand, the country's economy is still showing acceptable growth, the value of GDP on an annualized basis is at 2.3%, but, on the other hand, many important production indicators, as well as consumer sentiment indices, have fallen significantly in growth rates. We understand the regulator's fears, as it believes that there is a real risk of rising inflation amid the effects of the trade war due to rising tariffs, which is one of the constraining factors that does not allow the US central bank to actively reduce rates. But, as we see it, the regulator will have to back down and continue to reduce rates, which means that Trump takes the form of the "tail" and the market wags the "dog" of the Fed, forcing it to do what he wants. Forecast of the day: EURUSD is trading in the range of 1.1070-1.1110 in anticipation of the release of the Fed minutes, as well as the performance of J. Powell in Jackson Hole. The pair may break today from the range both up to 1.1155 and down to 1.1025, if the minutes shows a great tendency that the central bank will further lower rates. USDCAD is trading above 1.3300 in anticipation of consumer inflation data in Canada. If inflationary pressures increase and crude oil prices continue to move upward in the wake of expectations of lower rates in the United States, the pair will continue to decline to 1.3250, breaking the level of 1.3300. | ||||||||||||||||
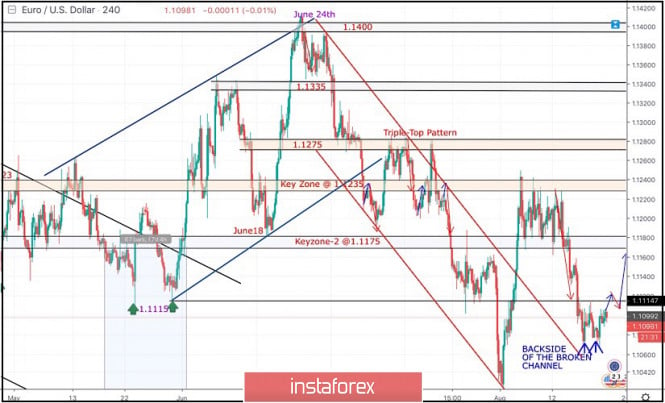
| August 21, 2019 : EUR/USD SHORT-TERM trend reversal is about to be confirmed. Posted: 21 Aug 2019 09:42 AM PDT Back in June 24, the EURUSD looked overbought around 1.1400 facing a confluence of supply levels. In the period between 8 - 22 July, sideway consolidation-range was established between 1.1200 - 1.1275 until a triple-top reversal pattern was demonstrated around the upper limit. Shortly after, evident bearish momentum (bearish engulfing H4 candlestick) could bring the EURUSD back below 1.1175. This facilitated further bearish decline towards 1.1115 (Previous Weekly Low) where temporary bullish rejection was demonstrated before bearish breakdown could take place on July 31. On July 31, Temporary Bearish breakdown below 1.1115 allowed further bearish decline towards 1.1025 (lower limit of the depicted recent bearish channel) where significant signs of bullish recovery were demonstrated. Risky traders were advised to look for bullish persistence above 1.1050 as a bullish signal for Intraday BUY entry with bullish target projected towards 1.1115, 1.1175 and 1.1235. Two weeks ago, the depicted Key-Zone around 1.1235 has been standing as a prominent Supply Area where THREE Bearish Engulfing H4 candlesticks were demonstrated. Thus, the EUR/USD was trapped between 1.1235-1.1175 for a few trading sessions until bearish breakout below 1.1175 occurred on August 14. Bearish breakout below 1.1175 promoted further bearish decline towards 1.1075 where the backside of the broken bearish channel has been providing significant bullish demand so far (A Bullish Double-Bottom pattern is in progress). A quick bullish breakout above 1.1115 is needed to confirm the short-term trend reversal into bullish. This would enhance further bullish advancement towards 1.1175. Trade recommendations : Conservative traders were advised to have a valid BUY entry anywhere around 1.1070 (where the backside of the broken bearish channel is located). It's running in profits now. Initial T/P levels should be located around 1.1130, 1.1175 and 1.1200. S/L should be placed just below 1.1020. The material has been provided by InstaForex Company - www.instaforex.com | ||||||||||||||||
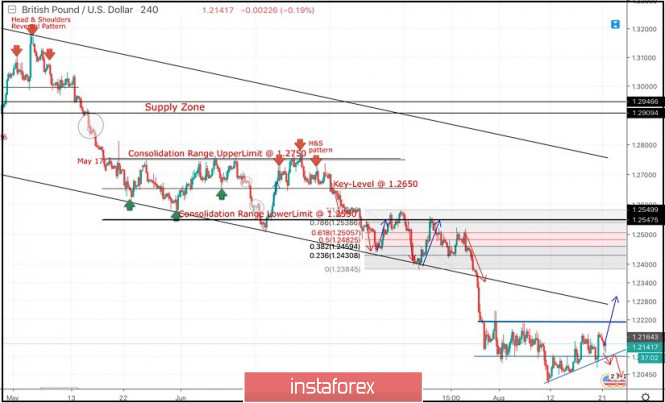
| August 21, 2019 : GBP/USD Intraday technical analysis and trade recommendations. Posted: 21 Aug 2019 09:31 AM PDT
Since May 17, the previous downside movement within the depicted bearish channel came to a pause allowing the recent sideway consolidation range to be established between 1.2750 - 1.2550. On July 5, a bearish range breakout was demonstrated below 1.2550 (the lower limit of the depicted consolidation range). Hence, quick bearish decline was demonstrated towards the price zone of 1.2430-1.2385 (the lower limit of the movement channel) which failed to provide consistent bullish demand for the GBP/USD. Moreover, Bearish breakdown below 1.2350 facilitated further bearish decline towards 1.2320, 1.2270 and 1.2100 which correspond to significant key-levels on the Weekly chart. The current price levels are quite risky/low for having new SELL entries. That's why, Previous SELLERS were advised to have their profits gathered. Two weeks ago, a temporary consolidation-range was demonstrated above 1.2100 before Friday when another bearish movement could be executed towards 1.2025. Recent bullish recovery was demonstrated off the recent bottom (1.2025). This brought the GBP/USD pair back above 1.2100 (recently-established SUPPLY Level). Further bullish advancement is expected to be demonstrated towards 1.2230 then 1.2320 if the current bullish momentum above 1.2100 (the short-term uptrend) is maintained on a daily basis. Otherwise, any bearish breakout below 1.2100 invalidates the previous scenario allowing another bearish visit towards 1.2025. Trade Recommendations: Intraday traders were advised to look for early bullish breakout above 1.2100 then above 1.2230 for counter-trend BUY entries. Conservative traders should wait for bullish pullback to pursue towards 1.2320 - 1.2350 for new valid SELL entries. S/L should be placed above 1.2430. Initial T/P level to be placed around 1.2279 and 1.2130. The material has been provided by InstaForex Company - www.instaforex.com | ||||||||||||||||
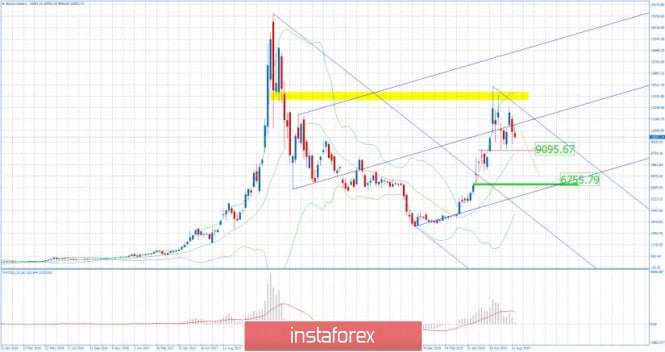
| BTC 08.21.2019 - potential long term bear cycle in the play Posted: 21 Aug 2019 08:06 AM PDT Industry news: The narrative about the Chinese buying up Bitcoin is flowing two ways – some reports say that the Chinese are turning to the cryptocurrency because of the FUD created by the US-China trade war, while others indicate that the Chinese are not buying up crypto. An article by Nikkei Asian Review highlights that China's central bank may be pushing the demand for Bitcoin after all. " Technical view:
Nothing changed since my yesterday's forecast.From the weekly time-frame prospective, BTC is trading inside of the trading range between the price of $12,275(high) and $9,000 (low).The high from June at $14,000 is holding well for 9 weeks and it is a warning for the further upside. I see potential for more downside. Yellow rectangle – Major resistance ($14,00) Purple horizontal line – Support 1 ($9,095) Green rectangle – Support 2 ($6,755) Blue lines – Pitchfork channels Weekly pivot points: S3 S2 S1 P R1 R2 R3
| ||||||||||||||||
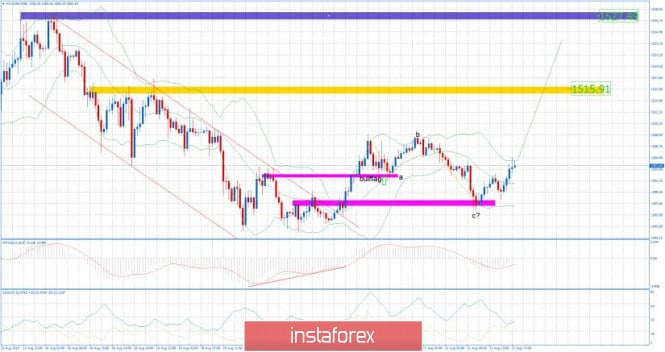
| Gold 08.21.2019 - Completed ABC downward correction Posted: 21 Aug 2019 07:44 AM PDT Today's market is waiting for more information from FED on the FOMC meeting minutes. That is main reason why the Gold is trading sideways at the price of $1,503. Further development
Analyzing the current trading activity, we can see that Gold did breakout the downward channel in the background and that there is potential for the ABC completion, which is sign that further upside is still present. As long as the Gold is trading above the $1,493, I would watch for buying opportunities. Based on the available information, it is possible to decompose a number of variations, let's consider them: - Positions for the purchase will be considered in the case of the breakout above the $1,508 with targets at $1,515 and $1,527. - Positions for sale are considered only in case of the strong breakout of the low at $1,493. It is more likely that we will have an up breakout... Indicator Analysis MACD indicator is showing that the slow line turned upward and there is decreasing in the downward momentum, which is positive sign for the further upside. ADX oscillator is showing reading above the 30 and rising, which is another great sign for rally. Bollinger band – There is potential breakout of the upper Bollinger band on the 30 minute time-frame. Daily pivot levels: S3 S2 S3 P R1 R2 R3
| ||||||||||||||||
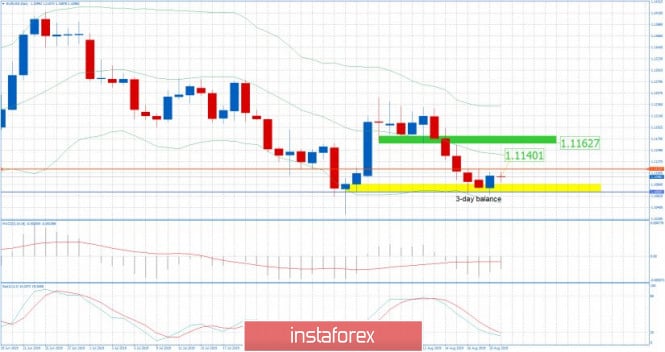
| EUR/USD for August 21,2019 - Watch for upward breakout of the 3-day balance Posted: 21 Aug 2019 07:25 AM PDT Today's market is waiting for more information from FED on the FOMC meeting minutes. That is main reason why the EUR is trading sideways at the price of 1.1100 (round number). Further development
Analyzing the current trading activity, we see that EUR is trading in the 3-day trading range and near the important resistance at the price of 1.1113, which is sign that there is potential for the breakout. Probably, investors awaiting for FOMC meeting minutes to pull the trigger. Based on the available information, it is possible to decompose a number of variations, let's consider them: - Positions for the purchase will be considered in the case of the breakout above the 1.1113 with targets at 1.1140 and 1.1160 - Positions for sale are considered only in case of the strong breakout of the balance low at 1.1064. It is more likely that we will have an up breakout... Indicator Analysis MACD indicator is showing that there is decreasing on the downside momentum and that slow line is holding well, which is positive sign for further rally. Stochastic oscillator is showing oversold condition and potential fresh up flip, which is another great indication for the potential rally. Bollinger band – There is potential for re-test of the middle Bollinger average Weekly pivot levels:
| ||||||||||||||||
| Canadian dollar boosted by inflation data, USD/CAD rallies Posted: 21 Aug 2019 05:54 AM PDT Canadian consumer prices rose 0.5% in July following a 0.2% decline in the previous month. The year-on-year increase held at 2.0% compared with consensus forecasts of a decline to 1.7%. The core CPI rate also held at 2.0% and the Bank of Canada core rate was unchanged at 2.03%. The Canadian dollar strengthened in light of the data with USD/CAD retreating to lows below 1.3260 before consolidation at near 1.3270. The Bank of Canada will hold its next policy meeting on September 4th. With inflation as the key criterion, the central bank is likely to take a broadly neutral tone, although it will voice some concerns over the risk of a global downturn. The bank will inevitably be cautious given that the ECB and Federal Reserve will hold policy meetings later in September, but the most dovish forecasts from investment banks are likely to be scaled back which will underpin the currency. The Canadian dollar's trajectory will also be influenced strongly by trends in risk appetite. Waning fears over global recession would tend to underpin the domestic currency. Trends in oil prices will set the tone for the loonie and will also be linked closely with trends in risk appetite. Crude has been undermined by the downgraded outlook of demand as global recession fears have increased. API data recorded a larger-than-expected decline in crude inventories of 3.5 mln barrels. Crude sentiment will strengthen if the EIA data posts a substantial weekly contraction with WTI trading higher at about $56.80 p/b ahead of the inventories data. The maket is likely to continue choppy trading in the short term with notable position adjustment ahead of Friday's speech by Fed Chair Powell, but with solid Canadian dollar support on dips. Technically, USD/CAD will need to break trend line support around 1.3255 to generate sustained downward momentum.
| ||||||||||||||||
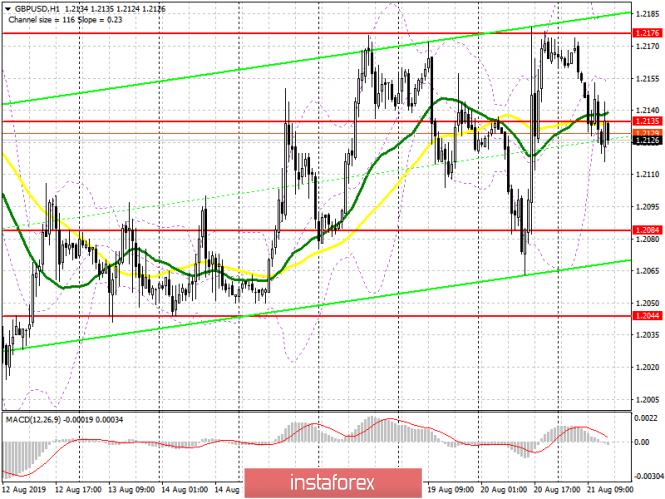
| Posted: 21 Aug 2019 05:48 AM PDT To open long positions on GBP/USD, you need: A weak report on the UK public sector borrowing put pressure on the British pound in the morning, however, buyers are trying to keep the pair around the level of 1.2135, and nd returning to this range to the opening of the North American session will lead to the continuation of the upward correction with a test maximum of 1.2176. The breakthrough of this level will provide GBP/USD a rush of larger buyers and exit to the level of 1.2217, where I recommend taking the profit. In the scenario of further GBP/USD decline in the second half of the day after the Fed report, it is best to consider new long positions on the rebound from the support of 1.2084, or after the update of a larger level of 1.2044. To open short positions on GBP/USD, you need: The bears managed to cope with the task and returned the pair to the support of 1.2135, and while trading will be below this range, we can expect continued downward correction after yesterday's growth, which occurred on Brexit news. The goal of the bears is the support of 1.2084, but the more significant level will still be at least 1.2044, where I recommend taking the profit. If the publication of the Fed's protocols supports the pair, it is best to consider new short positions on a false break from the weekly high of 1.2176, or on a rebound from the level of 1.2217. Indicator signals: Moving Averages Trading is conducted in the area of 30 and 50 moving averages, which indicates the lateral nature of the market. Bollinger Bands In the scenario of the pair growth in the second half of the day, it is best to count on short positions after updating the upper limit of the indicator in the area of 1.2185.
Description of indicators
| ||||||||||||||||
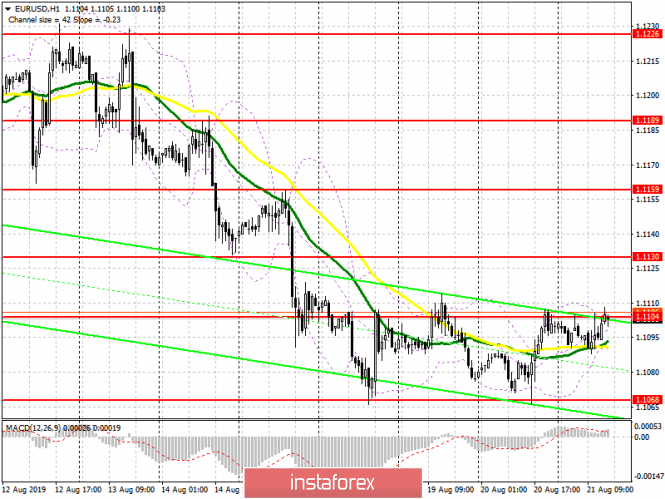
| Posted: 21 Aug 2019 05:32 AM PDT To open long positions on EURUSD, you need: In the first half of the day, due to the lack of important fundamental statistics, the market remained in a narrow side channel, and the technical picture has not changed. Only the exit and consolidation above the resistance of 1.1105 will strengthen the demand for the euro and will lead to an update of a larger maximum of 1.1130, as well as to the resistance test of 1.1159, where I recommend taking profit after the publication of the Fed protocols. If traders do not find new hints of the committee to further reduce the rate, it is possible to reduce the EUR/USD scenario. In this case, in the second half of the day, it is best to return to long positions on the rebound from the minimum of 1.1068, or after the update of new monthly levels in the area of 1.1028. To open short positions on EURUSD, you need: Bears made a false breakdown in the resistance area of 1.1105 in the morning, and while trading is below this range, the probability of a decline in EUR/USD will be quite high. The main goal of the sellers will be the support levels of 1.1068 and 1.1028, where I recommend fixing the profit. However, after the publication of the minutes of the July meeting of the Fed, the situation can completely go under the control of buyers of the euro. With a breakout scenario above the level of 1.1105, it is best to open short positions on a rebound from the highs of 1.1130 and 1.1159. Indicator signals: Moving Averages Trading is conducted in the area of 30 and 50 moving averages, which indicates the lateral nature of the market. Bollinger Bands Volatility decreases, which does not give signals to enter the market.
Description of indicators
| ||||||||||||||||
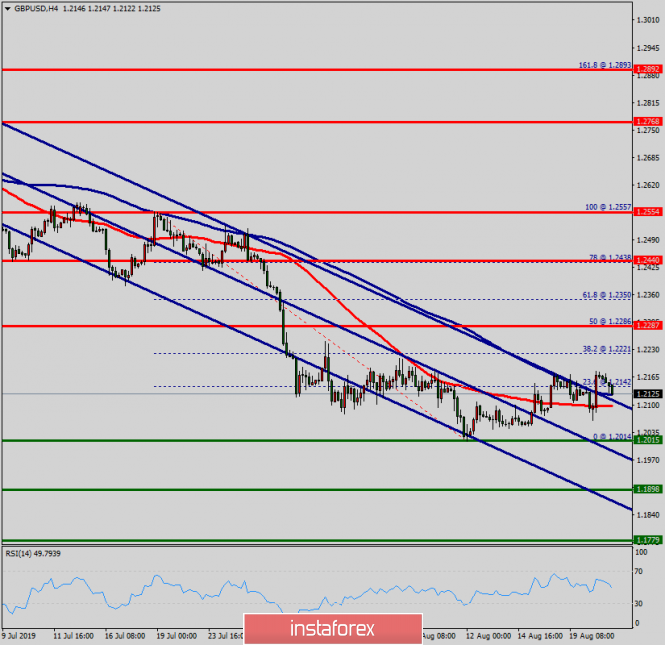
| Technical analysis of GBP/USD for August 21, 2019 Posted: 21 Aug 2019 03:24 AM PDT The GBP/USD pair continues to move downwards from the zone of 1.2287. The GBP/USD pair movement was debatable as it took place in a downside channel for a while. But, the market showed signs of instability between the levels of 1.2122 and 1.2045. Amid the previous events, the price is still moving between the levels of 1.2287 and 1.2015. The daily resistance and support are seen at the levels of 1.2287 and 1.2015 respectively. It is recommended to be cautious while placing orders in this area. Thus, we should wait until the downside channel has completed. Since the trend is below the 50% Fibonacci level, the market is still in a downtrend. Overall, we still prefer the bearish scenario. Trading recommandations: From this point, we expect the GBP/USD/CHF pair to continue moving in the bearish trend from the resistance level of 1.2287 towards the target level of 1.2015. If the pair succeeds in passing through the level of 1.2015, the market will indicate the bearish opportunity below the level of 1.2015 in order to reach the second target at 1.1898. However, it would also be sage to consider where to place a stop loss; this should be set above the first resistance of 1.2287. The material has been provided by InstaForex Company - www.instaforex.com | ||||||||||||||||
| Analysis for EUR/USD and GBP/USD on August 21st. An empty calendar is not a reason to be upset Posted: 21 Aug 2019 02:26 AM PDT EUR/USD
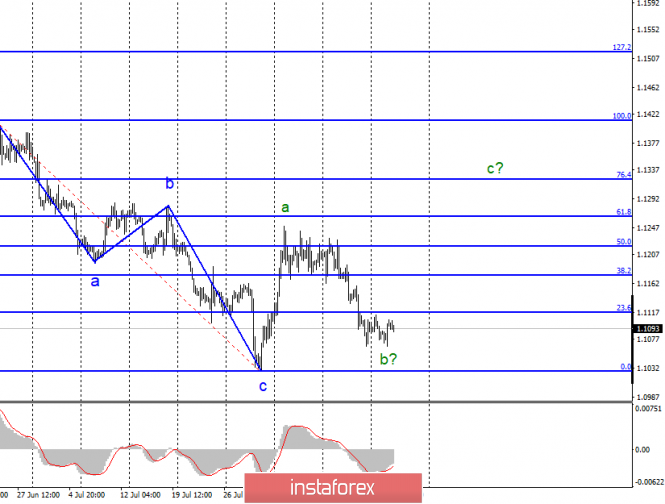
On Tuesday, August 20, the EUR/USD pair ended with an increase of 20 bps. Thus, there are new grounds to assume the completion of the construction of the wave b and the transition of the instrument to the wave c with targets located near the 13 figures. If this assumption is correct, the pair will continue to rise from its current position. As before, the main problem for the growth of the euro remains the news background. This week, the FOMC protocol may hinder the rise of the instrument tomorrow night, the US and European indexes of business activity on Thursday and Jerome Powell's performance on Friday. As for Powell and the FOMC protocol, it's simple. The more "dovish" signals the currency market will receive, the more chances for the growth of the euro/dollar pair in accordance with the wave pattern. If unexpected "hawkish" signals follow, which is unlikely, it can lead to a breakthrough of the minimum from August 1. The most likely option is a neutral speech by Jerome Powell, which will leave room for the Fed to maneuver at the next meeting in September. Purchasing goals: 1.1264 – 61.8% Fibonacci 1.1322 – 76.4% Fibonacci Sales targets: 1.1027 – 0.0% Fibonacci General conclusions and trading recommendations: The euro/dollar pair continues to build a section of the trend, which is now interpreted as corrective. Given the proximity to the minimum of the wave c, now is a good time to buy the instrument based on the construction of the wave c with targets located above the mark of 1.1250. I recommend placing restrictive orders under the minimum of August 1. GBP/USD
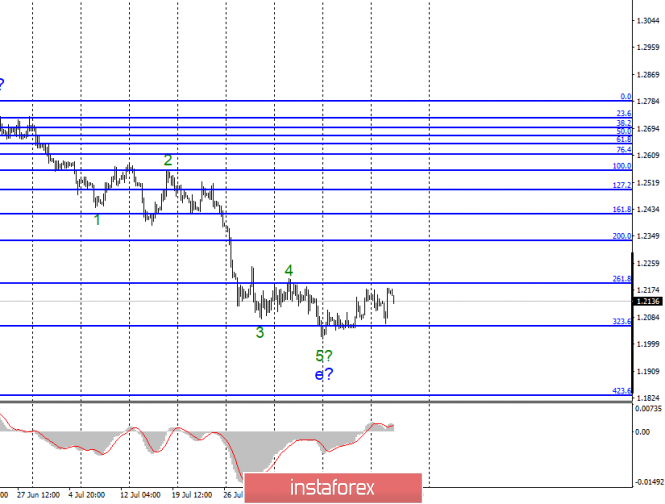
The GBP/USD pair increased by 40 basis points on August 20 and continues to move away from the previously reached lows. At the moment, the wave e is still interpreted as completed, but the news background still allows for a new complication of the downward trend. A successful attempt to break the low of August 12 will indicate the readiness of the markets for new sales of the pound sterling. Meanwhile, British Prime Minister Boris Johnson received a refusal from Donald Tusk, President of the European Council, to revise the existing agreement on Brexit and to exclude from it the point defining the "backstop" regime for the Northern Ireland border. For the pound, this is certainly bad news, as once again it becomes clear that there will be no new negotiations between the UK and the EU. This means a "hard" scenario or a new transfer of the Brexit date. Both are bad for the pound. Sales targets: 1.2056 – 323.6% Fibonacci 1.1830 – 423.6% Fibonacci Purchasing goals: 1.2334 – 200.0% Fibonacci General conclusions and trading recommendations: The downward part of the trend may become even more complicated. Despite the fact that the wave e appears to be complete, it may take more complicated form. Thus, on the break of the minimum of August 12, I recommend considering the pair's sales with targets near the level of 1.1830, which corresponds to 423.6% of Fibonacci. The material has been provided by InstaForex Company - www.instaforex.com | ||||||||||||||||
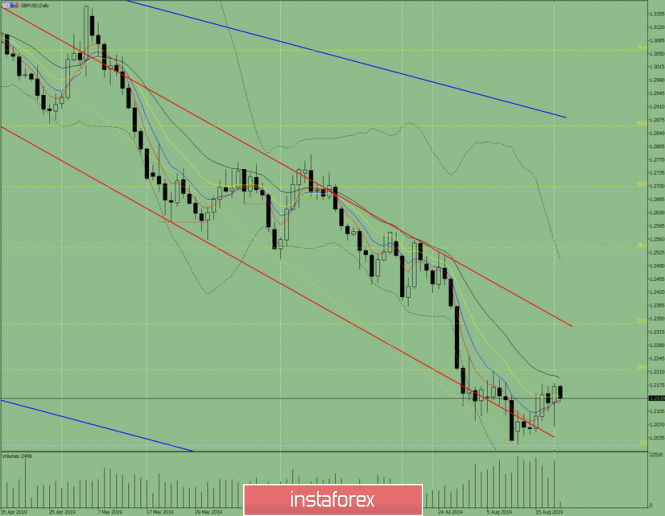
| Indicator analysis. Daily review for GBP/USD pair as of August 21, 2019 Posted: 21 Aug 2019 02:26 AM PDT On Tuesday, the pair moved down, failed to reach the resistance line – 1.2037 (red bold line), and after that, the price went up. On Wednesday, the pair will try to continue moving up. Strong calendar news is expected at 15:00 London time, 15:30 London time, and 19:00 London time (dollar). Trend analysis (Fig. 1). On Wednesday, the price may continue to move up with the first target of 1.2192 – 21 average EMA (black thin line).
Fig. 1 (daily chart). Complex analysis: - Indicator analysis – down; - Fibonacci levels – up; - Volumes – up; - Candle analysis – up; - Trend analysis – down; - Bollinger bands – down; - Weekly schedule - up. General conclusion: On Wednesday, the price may continue to move up with the first target of 1.2192 – 21 average EMA (black thin line). Unlikely scenario: a downward movement with target of 1.2064 – lower fractal. The material has been provided by InstaForex Company - www.instaforex.com | ||||||||||||||||
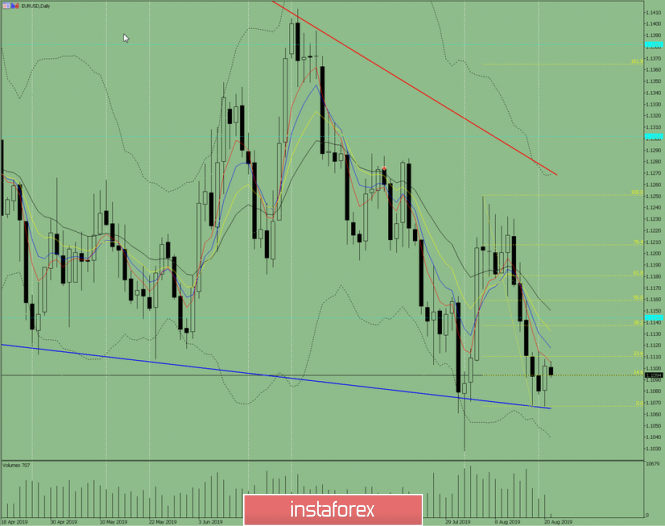
| Indicator analysis. Daily review for EUR/USD pair as of August 21, 2019 Posted: 21 Aug 2019 02:26 AM PDT On Tuesday, the pair made an upward movement after testing the support line of 1.1067 (blue bold line), almost testing the pullback level of 23.6% – 1.1110 (yellow dotted line). On Wednesday, it is possible to continue the upward movement. Strong calendar news expected at 15:00 London time, 15:30 London time, and 19.00 London time (dollar). Trend analysis (Fig. 1). On Wednesday, we expect an upward movement, with the target of 1.1108 – the upper fractal.
Fig. 1 (daily chart). Complex analysis: - Indicator analysis – down; - Fibonacci levels – up; - Volumes – up; - Candle analysis – up; - Trend analysis – up; - Bollinger bands – down; - Weekly schedule - up. General conclusion: On Wednesday, we expect an upward movement, with the target of 1.1108 – the upper fractal. Unlikely scenario: a downward movement with the target of 1.1065 – support line (blue bold line). The material has been provided by InstaForex Company - www.instaforex.com | ||||||||||||||||
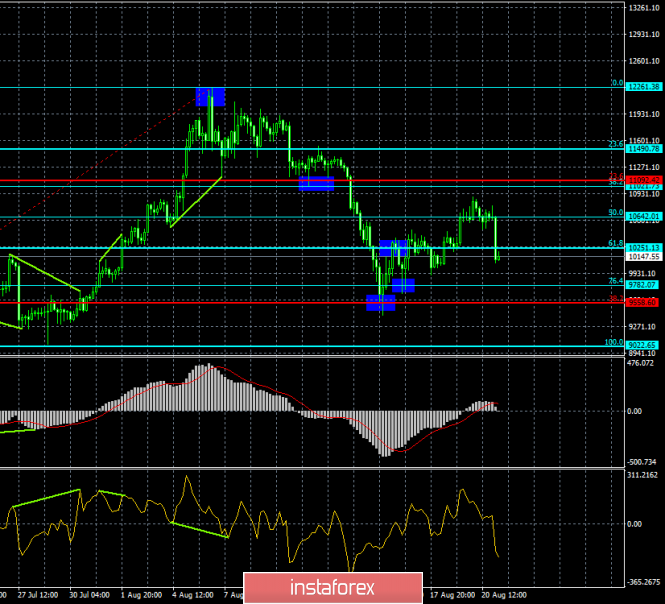
| Posted: 21 Aug 2019 02:26 AM PDT Bitcoin – 4H.
Over the past day, Bitcoin has fallen in price by almost $700, which is absolutely normal. This drawdown does not even cause panic in the cryptocurrency market. Now, imagine what would happen if the US dollar fell to the euro by 2 cents per day? This happens 2-3 times a year, and even then not every year. Bitcoin can lose or buy 5-10% of the cost per day and no one is surprised. Crypto experts continue to blow at all corners that bitcoin will rise in price in any case, it's only a matter of time. Now, another question: have you seen at least one forecast that would predict bitcoin falling to $2,000 - $3,000? The answer, I think, is obvious. You can take any pair, any instrument, and there will always be so-called bulls and bears, traders who believe that the instrument or currency will rise in price or, conversely, cheaper, and depending on their strategy. In the case of bitcoin, the question is different: either to buy or not to trade. It is from such obvious differences between bitcoin and any other investment instruments or currency that I continue to argue that the demand for the "cue ball" and its value by 80% depends on the influx of new investors who want to earn faster. It is for this that crypto experts, millionaires, billionaires regularly recommend buying bitcoin, predict its growth to fabulous figures. In order for more one-day investors to come to the market, the demand for BTC has increased, the cryptocurrency has risen in price. And at high levels, it can be sold by collapsing the market from $20,000 to $3,000, as it was already. Based on this, I do not claim that bitcoin does not need to be bought or that it will not grow, for example, to $50000. I only claim that bitcoin is a short-term investment tool, but not a long-term one. It does not perform the function of preserving the value, does not have its own value, its price depends entirely on market participants, the number of which allows major players to change the market conditions and mood. At the moment, the "cue ball" has completed the closure under the correction level of 61.8% ($10251), so I expect the cryptocurrency to continue falling in the direction of the next Fibo level of 76.4% ($9782). Divergence is not evident today. The Fibo grid is built on the extremes of July 17, 2019, and August 6, 2019. Forecast for Bitcoin and trading recommendations: Bitcoin completed the closure under the Fibo level of 61.8% ($10251). Thus, I recommend selling the cryptocurrency with the target of $9782, with the stop-loss order above the level of 61.8%. I recommend buying bitcoin with the target of $10642, and with the stop-loss level at $10251, if the consolidation above the correction level of 61.8% is performed. The material has been provided by InstaForex Company - www.instaforex.com |
| You are subscribed to email updates from Forex analysis review. To stop receiving these emails, you may unsubscribe now. | Email delivery powered by Google |
| Google, 1600 Amphitheatre Parkway, Mountain View, CA 94043, United States | |










No comments:
Post a Comment