
Forex analysis review |
- Technical analysis of BTC/USD for 30/08/2019:
- USD/JPY approaching support, possible bounce!
- Technical analysis of GBP/USD for 30/08/2019:
- Technical analysis of EUR/USD for 30/08/2019:
- Fractal analysis of the main currency pairs on August 30
- #USDX vs EUR / USD vs GBP / USD vs USD / JPY. Comprehensive analysis of movement options from August 30, 2019 APLs &
- Japanese currency trap sellers. Trading idea for the USDJPY.
- Golden steam engine - Trading ideas for GOLD
- GBP/USD: Johnson paused Parliament. What to expect next?
- The dollar is rising as the market wonders if the US and China can agree
- GBP/USD. August 29th. Results of the day. The pound calmed down from yesterday's shock, but did not recover from it
- EUR/USD. August 29th. Results of the day. US GDP growth might fall in the second quarter, but the dollar is still growing
- USD/CAD: Friday "test" for the loonie ahead of the central bank meeting
- EURUSD: German data increases the likelihood of lower interest rates in the eurozone
- USDJPY could reach 107.50-108 the next few days
- EURUSD breaking recent lows targeting 1.0950
- Has Gold topped?
- August 29, 2019 : Despite Recent Intraday Bearish Rejection, EUR/USD positivity remains an option.
- EUR/USD. Opinion: Germany's CPI is a harbinger of an inflationary catastrophe in the European Union
- August 29, 2019 : GBP/USD Intraday technical analysis and trade recommendations.
- GBP/USD. Opinion: what is happening in British politics?
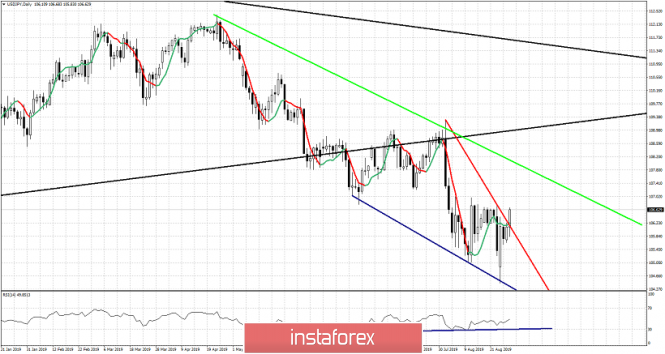
- USD/JPY analysis for August 29, 2019 - Support on the test, potential for rally
- USD/JPY depends on trade jitters, so cautious buying on dips
- Gold 08.29.2019 - Steady bullish trend, more upside yet to come
- GBP/USD: plan for the US session on August 29. The pound continues to storm but the bears failed to break below the support
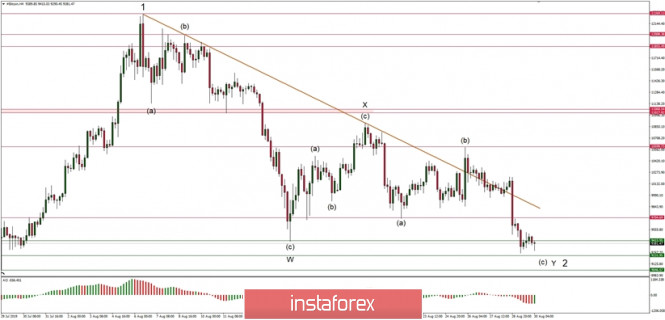
| Technical analysis of BTC/USD for 30/08/2019: Posted: 29 Aug 2019 08:06 PM PDT Crypto Industry News: The Portuguese tax office explained that both cryptocurrency trading and crypto payments would be VAT-free in that country, according to a Portuguese business newspaper. The agency reportedly provided explanations to a local cryptocurrency mining company by publishing an official judgment document. In the document, the authority states that the exchange of cryptocurrencies for fiat money is free of VAT, adding that cryptocurrency users do not have to pay any income tax. In an official statement, the Portuguese tax authority cited the 2015 European Court of Justice ruling regarding the case of Sweden's largest cryptocurrency portal and its moderator David Hedqvist. The court then ordered that Bitcoin is a means of payment, and therefore the exchange should be subject to VAT exemption. However, the Swedish tax agency then objected to the ruling, arguing that the court had not fully understood the case. This confirmation follows the previous tax ruling of the Portuguese authority saying that cryptocurrencies are not taxed in that country. A document published by the agency in 2016 states that revenues from the sale of cryptocurrencies in Portugal are not subject to income tax. Technical Market Overview: The BTC/USD pair is close to terminate the wave (c) development as the bears have broken below the trendline support around the level of $9,990 after a failure to break through the upper trendline resistance around the level of $10,200. The bears were able to make a new local low at the level of $9,466 and since then the market did not bounce much. Currently, the price is trading around the level of $9,534, just above the low of the old wave W of the overall corrective cycle. Any violation of this level will lead to sell-off acceleration towards the level of $9,046. Weekly Pivot Points: WR3 - $11,710 WR2 - $11,306 WR1 - $10,534 Weekly Pivot Pont - $10,091 WS1 - $9,320 WS2 - $8,854 WS3 - $8,140 Trading Recommendations: The best strategy in the current market conditions is to trade with the larger timeframe trend, which is still up. All the shorter timeframe moves are being treated as a correction inside of the uptrend. The larger degree WXY correction might have been completed and the market might be ready for another impulsive wave up of a higher degree. Any violation of the level of $9,049 invalidates the bullish impulsive scenario.
|
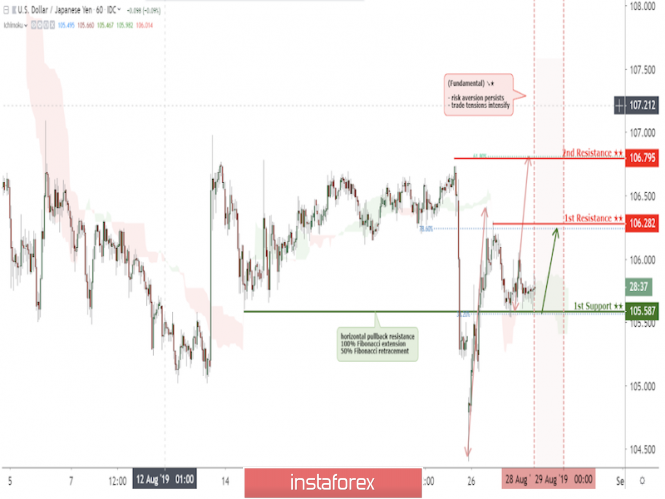
| USD/JPY approaching support, possible bounce! Posted: 29 Aug 2019 08:05 PM PDT
USDJPY is approaching support at 105.59 , possible bounce! Entry :105.66 Why it's good : horizontal pullback resistance 100% Fibonacci extension 50% Fibonacci retracement Take Profit : 106.28 Why it's good :Horizontal swing low support 78.6% Fibonacci retracement
|
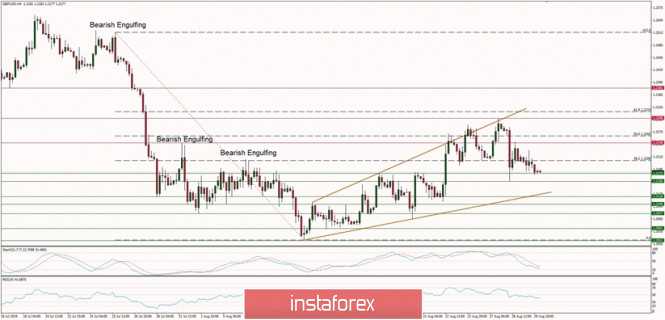
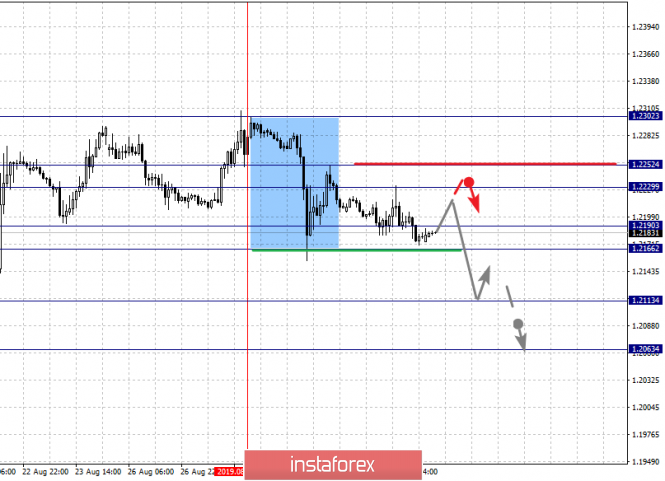
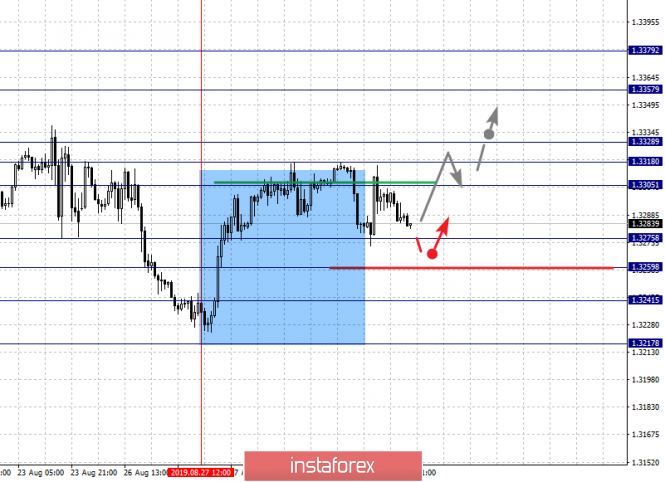
| Technical analysis of GBP/USD for 30/08/2019: Posted: 29 Aug 2019 08:02 PM PDT Technical Market Overview: The GBP/USD pair did not bounce much as only the level of 1.2248 has been hit before the price reversed again. The Broadening Wedge price pattern might have been completed then because the price has broken below the technical support at the level of 1.2248 and 1.2175. The whole move up is still a part of the correction, because it does not look like the beginning of a new, impulsive trend. The pair is currently testing the nearest technical support located at the level of 1.2156 in overbought market conditions. Weekly Pivot Points: WR3 - 1.2616 WR2 - 1.2455 WR1 - 1.2395 Weekly Pivot Pont - 1.2226 WS1 - 1.2161 WS2 - 1.2001 WS3 - 1.1935 Trading Recommendations: The best strategy for current market conditions is to trade with the larger timeframe trend, which is down. All upward moves will be treated as local corrections in the downtrend. In order to reverse the trend from down to up, the key level for bulls is seen at 1.2429 and it must be clearly violated. As long as the price is trading below this level, the downtrend continues.
|
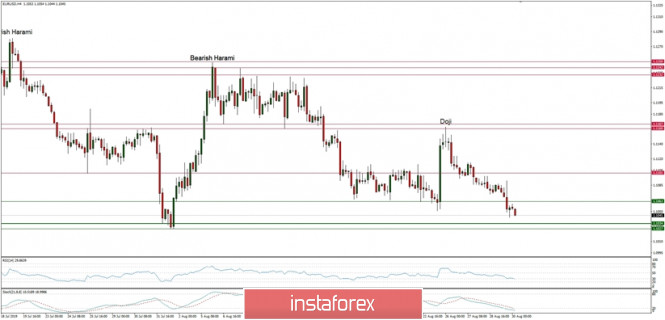
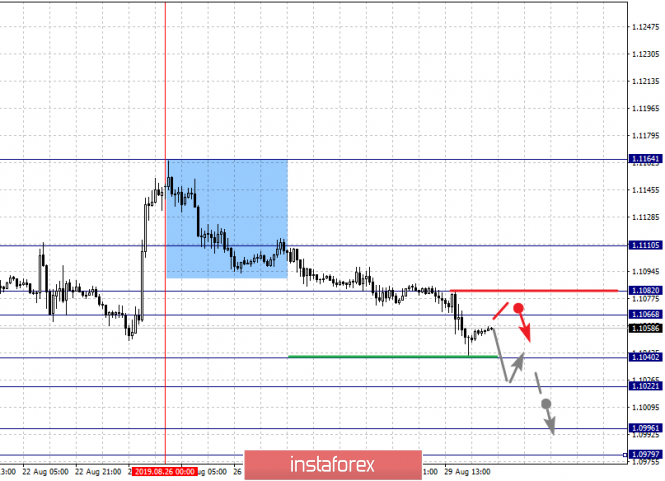
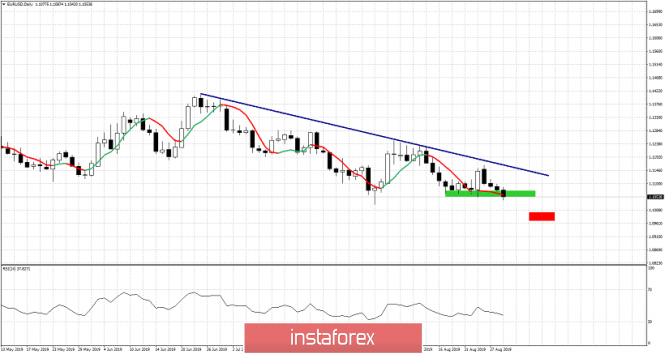
| Technical analysis of EUR/USD for 30/08/2019: Posted: 29 Aug 2019 07:59 PM PDT Technical Market Overview: The EUR/USD pair gets closer to the kry technical support as the new local low was made at the level of 1.1040. The bears are clearly in control of this market and the momentum is now weak and negative. Please keep an eye on the current developments as any move lower can change the market positioning for the next days. Any breakout below the level of 1.1027 opens the way towards the next technical support at 1.0912. The downtrend continues. Weekly Pivot Points: WR3 - 1.1293 WR2 - 1.1218 WR1 - 1.1193 Weekly Pivot Pont - 1.1119 WS1 - 1.1089 WS2 - 1.1014 WS3 - 1.0984 Trading Recommendations: The best strategy for current market conditions is to trade with the larger timeframe trend, which is down. All upward moves will be treated as local corrections in the downtrend. The downtrend is valid as long as it is terminated or the level of 1.1445 clearly violated. There is an Ending Diagonal price pattern visible on the larget timeframes that indicate a possible downtrend termination soon. The key short-term levels are technical support at the level of 1.1027 and the technical resistance at the level of 1.1250.
|
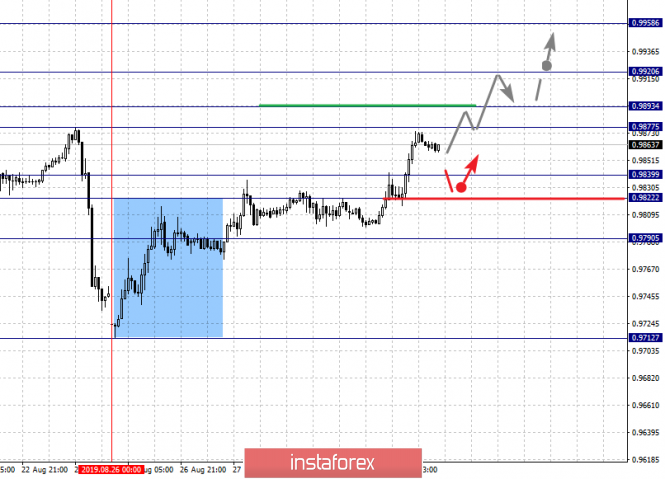
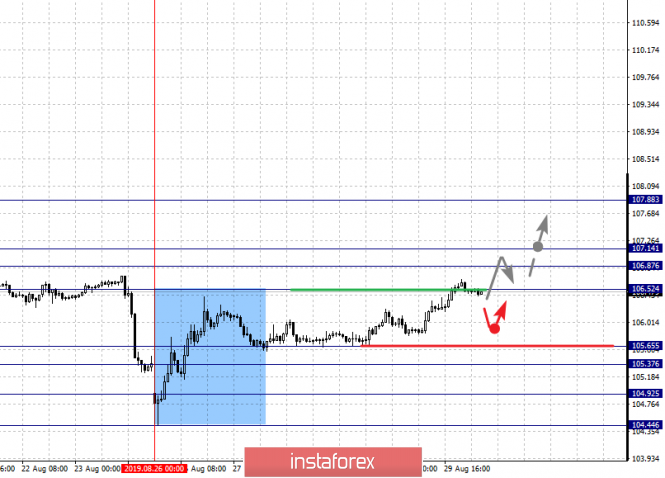
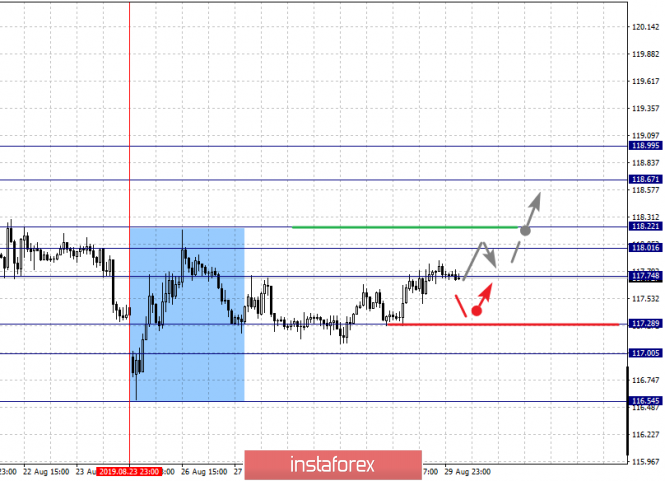
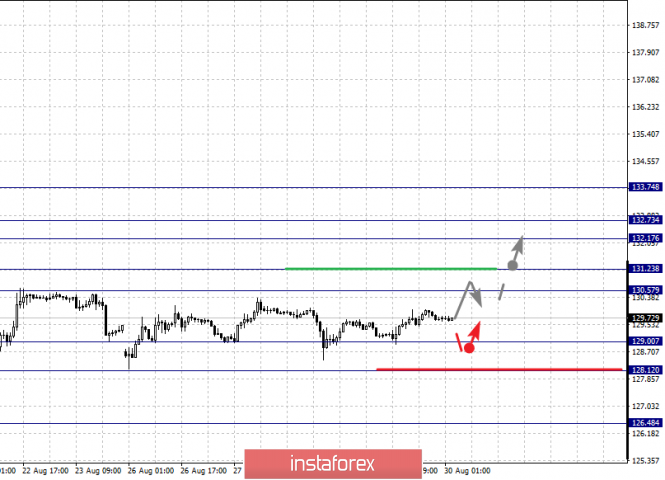
| Fractal analysis of the main currency pairs on August 30 Posted: 29 Aug 2019 05:39 PM PDT Forecast for August 30: Analytical review of currency pairs on the scale of H1: For the euro / dollar pair, the key levels on the H1 scale are: 1.1110, 1.1082, 1.1066, 1.1040, 1.1022, 1.0996 and 1.0979. Here, we continue to monitor the descending structure of August 26. Short-term downward movement is expected in the range of 1.1040 - 1.1022. The breakdown of the last value should be accompanied by a pronounced downward movement. Here, the target is 1.0996. For the potential value for the bottom, we consider the level of 1.0979. Upon reaching this level, we expect a rollback to the top. Short-term upward movement is expected in the range of 1.1066 - 1.1082. The breakdown of the last value will lead to an in-depth correction. Here, the goal is 1.1110. This level is a key support for the downward structure. The main trend is the downward cycle of August 26. Trading recommendations: Buy 1.1066 Take profit: 1.1080 Buy 1.1084 Take profit: 1.1110 Sell: 1.1040 Take profit: 1.1024 Sell: 1.1021 Take profit: 1.0996 For the pound / dollar pair, the key levels on the H1 scale are: 1.2302, 1.2252, 1.2229, 1.2190, 1.2166, 1.2113 and 1.2063. Here, the price forms a pronounced potential for the downward movement of August 27. Consolidated movement is expected in the range 1.2190 - 1.2166. The breakdown of the last value should be accompanied by a pronounced downward movement. Here, the target is 1.2113. For the potential value for the bottom, we consider the level of 1.2063. Upon reaching this level, we expect a pullback to the top. Short-term upward movement is expected in the range of 1.2229 - 1.2252. The breakdown of the latter value will favor the formation of an upward structure. Here, the potential target is 1.2302. The main trend is the formation of potential for the bottom of August 27. Trading recommendations: Buy: 1.2230 Take profit: 1.2252 Buy: 1.2255 Take profit: 1.2300 Sell: 1.2190 Take profit: 1.2167 Sell: 1.2164 Take profit: 1.2115 For the dollar / franc pair, the key levels on the H1 scale are: 0.9958, 0.9920, 0.9893, 0.9877, 0.9839, 0.9822 and 0.9790. Here, we continue to monitor the ascending structure of August 26. The continuation of the movement to the top is expected after the price passes the noise range 0.9877 - 0.9893. In this case, the target is 0.9920. For the potential value for the upward trend, we consider the level of 0.9958. Upon reaching which, we expect a pullback to the bottom. Short-term downward movement is possibly in the range of 0.9839 - 0.9822. The breakdown of the latter value will lead to in-depth movement. Here, the target is 0.9790. This level is a key support for the top. The main trend is the ascending structure of August 26. Trading recommendations: Buy : 0.9893 Take profit: 0.9920 Buy : 0.9922 Take profit: 0.9958 Sell: 0.9839 Take profit: 0.9822 Sell: 0.9820 Take profit: 0.9790 For the dollar / yen pair, the key levels on the scale are : 107.88, 107.14, 106.87, 106.52, 105.65, 105.37, 104.92 and 104.44. Here, we follow the development of the ascending structure of August 26. The continuation of the movement to the top is expected after the breakdown of the level of 106.52. In this case, the target is 106.87, where consolidation is near this level. The price passage of the noise range 106.87 - 107.14 should be accompanied by a pronounced upward movement. Here, the potential target is 107.88. Consolidation is near this level. Short-term downward movement is possibly in the range of 105.65 - 105.37. The breakdown of the latter value will lead to the development of a downward structure. In this case, the first target is 104.92. For the potential value for the bottom, we consider the level of 104.44. Consolidation is near this level. The main trend: the ascending structure of August 26. Trading recommendations: Buy: 106.52 Take profit: 106.85 Buy : 107.15 Take profit: 107.88 Sell: 105.35 Take profit: 104.94 Sell: 104.90 Take profit: 104.46 For the Canadian dollar / US dollar pair, the key levels on the H1 scale are: 1.3379, 1.3357, 1.3328, 1.3318, 1.3305, 1.3275, 1.3259, 1.3241 and 1.3217. Here, the price forms a pronounced potential for the upward movement of August 27. The continuation of the movement to the top is expected after the breakdown of the level of 1.3305. In this case, the target is 1.3318, where consolidation is near this level. The price passage of the noise range 1.3318 - 1.3328 should be accompanied by a pronounced upward movement. Here, the target is 1.3357. For the potential value for the top, we consider the level of 1.3379. Upon reaching this level, we expect a pullback to the bottom. Short-term downward movement is possibly in the range of 1.3275 - 1.3259. The breakdown of the last value will lead to a long correction. Here, the target is 1.3241. This level is a key support for the upward structure. Its price passage will lead to the development of a downward movement. In this case, the first potential target is 1.3217. The main trend is the formation of potential for the top of August 27. Trading recommendations: Buy: 1.3305 Take profit: 1.3318 Buy : 1.3328 Take profit: 1.3357 Sell: 1.3275 Take profit: 1.3262 Sell: 1.3257 Take profit: 1.3241 For the Australian dollar / US dollar pair, the key levels on the H1 scale are : 0.6859, 0.6822, 0.6808, 0.6786, 0.6768, 0.6748 and 0.6725. Here, we are following the formation of the ascending structure of August 26. At the moment, the price is close to the cancellation of this structure, which requires the breakdown of the level of 0.6725. In this case, the potential target for the downward movement is 0.6690. The continuation of the upward trend is expected after the breakdown of the level of 0.6768. In this case, the first target is 0.6786. The breakdown of which, in turn, will allow you to count on movement to 0.6808. short-term upward movement, as well as consolidation is in the range of 0.6808 - 0.6822. The breakdown of the level of 0.6822 should be accompanied by a pronounced upward movement. Here, the target is 0.6859. Consolidation is near this level, as well as a pullback to the bottom. The main trend is the formation of the ascending structure of August 21, the stage of deep correction. Trading recommendations: Buy: 0.6786 Take profit: 0.6808 Buy: 0.6809 Take profit: 0.6820 Sell : 0.6745 Take profit : 0.6728 Sell: 0.6722 Take profit: 0.6695 For the euro / yen pair, the key levels on the H1 scale are: 118.99, 118.67, 118.22, 118.01, 117.74, 117.28, 117.00 and 116.54. Here, the price forms the potential for the top of August 23. The continuation of the upward movement is expected after the breakdown of the level of 117.74. In this case, the first target is 118.01. The passage of the price at the noise range 118.01 - 118.22, will lead to a pronounced movement. In this case, the target is 118.67. Consolidation is near this level. For the potential value for the top, we consider the level of 118.99. Upon reaching this level, we expect a pullback to the bottom. The range of 117.28 - 117.00 is a key support for the upward structure. Its price passage will favor the development of a downward movement. In this case, the first potential target is 116.54. The main trend is the downward cycle of August 13, the formation of the potential for the top of August 23. Trading recommendations: Buy: 117.75 Take profit: 118.01 Buy: 118.22 Take profit: 118.65 Sell: 117.28 Take profit: 117.05 Sell: 117.00 Take profit: 116.55 For the pound / yen pair, the key levels on the H1 scale are : 133.74, 132.73, 132.17, 131.23, 130.57, 129.00 and 128.12. Here, price has entered an equilibrium state. Short-term upward movement is expected in the range of 130.57 - 131.23. The breakdown of the latter value will lead to a pronounced upward movement. Here, the target is 132.17. Short-term upward movement, as well as consolidation is in the range of 132.17 - 132.73. For the potential value for the top, we consider the level of 133.74. Upon reaching which, we expect consolidation, as well as a pullback to the bottom. The range of 129.00 - 128.12 is the key support for the ascending structure of August 12. The breakdown of the level of 128.12 will favor the development of the downward movement. In this case, the first potential target is 126.48. The main trend is the equilibrium state. Trading recommendations: Buy: 130.58 Take profit: 131.23 Buy: 131.26 Take profit: 132.17 Sell: 128.96 Take profit: 128.12 Sell: 128.10 Take profit: 126.55 The material has been provided by InstaForex Company - www.instaforex.com |
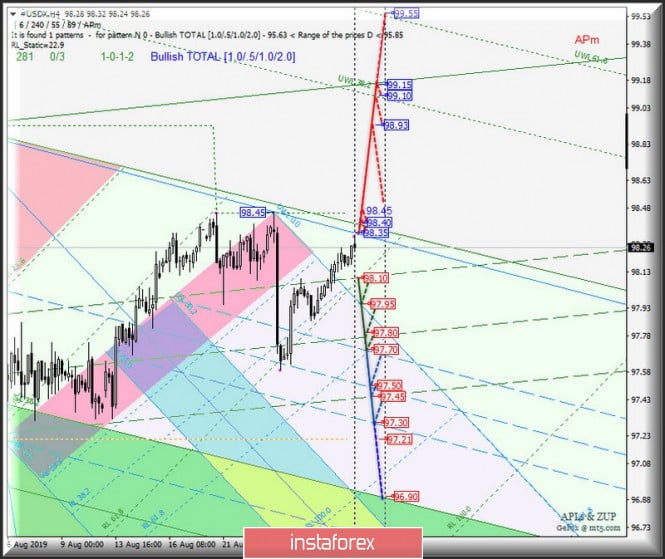
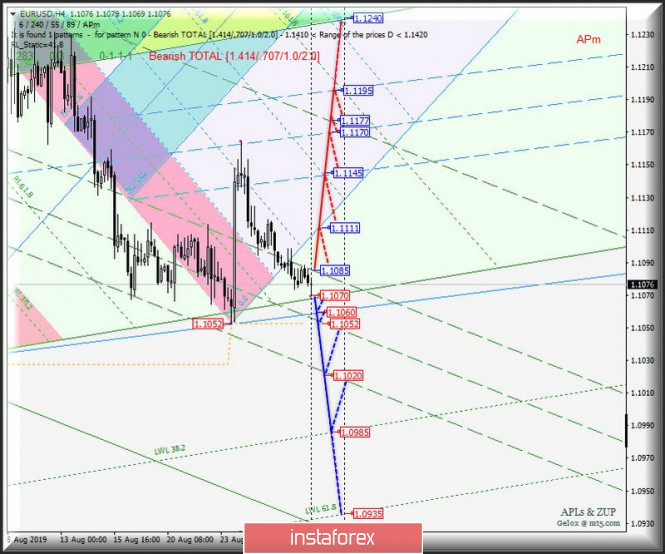
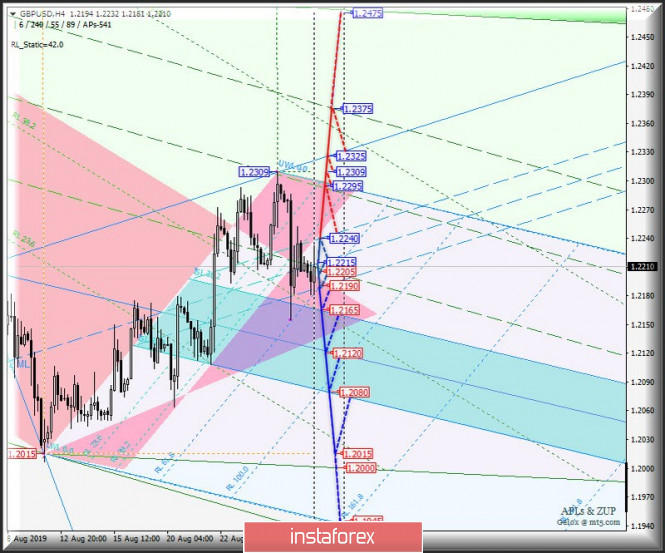
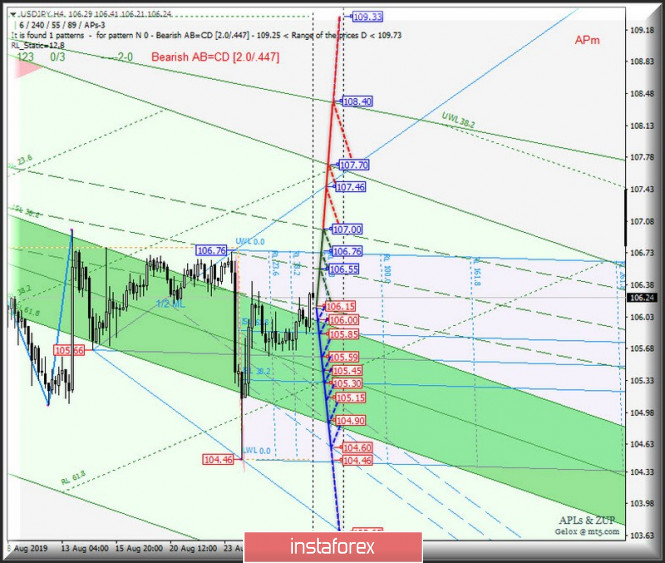
| Posted: 29 Aug 2019 05:39 PM PDT Let me bring to your attention a comprehensive analysis of the options for the movement of currency instruments #USDX, EUR / USD, GBP / USD and USD / JPY from August 30, 2019 Minuette operational scale (H4 time frame) ____________________ US dollar index The direction of the range breakdown :
will determine the development of the movement of the dollar index #USDX from August 30, 2019. The breakdown of the support level of 98.10 will determine the development of the movement of the dollar index within 1/2 Median Line channels of the Minuette operational scale - (98.10 - 97.80 - 97.45) and Minuette (97.70 - 97.50 - 97.30). The upward movement of #USDX can be continued with the combined breakdown of the UTL control line (resistance level of 98.35) and the initial SSL line (98.40) of the Minuette operational scale fork, with the subsequent update of the local maximum 98.45 and the following targets of this movement will be - maximum 98.93 - warning line UWL38. 2 Minuette (99.10) - control line UTL Minuette (99.15). The details of the #USDX movement are presented in the animated chart. ____________________ Euro vs US dollar The movement of the single European currency EUR / USD from August 30, 2019 will also receive its development depending on the direction of the breakdown of the range :
The breakdown of the resistance level of 1.1085 (the upper boundary of the 1/2 Median Line Minuette channel) will determine the development of the EUR / USD movement to the targets - the initial SSL Minuette line (1.1111) - the 1/2 Median Line channel (1.1145 - 1.1170 - 1.1195) of the Minuette operational scale fork. A consecutive breakdown of the SSL start line (support level of 1.1070) of the Minuette operational scale fork and the LTL control line (1.1060) for the Minuette operational scale and 1/2 Median Line Minuette (1.1052) will make the continuation of the downward movement of the single European currency towards the targets relevant - the lower boundary of the 1/2 Median Line channel Minuette (1.1020) - warning line LWL38.2 Minuette (1.0985). The details of the EUR / USD movement options are shown in the animated chart. ____________________ Great Britain pound vs US dollar On the other hand, the development of Her Majesty's GBP / USD currency movement from August 30, 2019 will be due to the development and direction of the breakdown of the boundaries of the 1/2 Median Line channe (1.2240 - 1.2215 - 1.2190) of the Minuette operational scale fork. We look at the animated chart for movement details within this channel. The breakdown of the resistance level of 1.2240 at the upper boundary of the 1/2 Median Line channel of the Minuette operational scale fork will determine the development of the upward movement of Her Majesty's currency to the targets - 1/2 Median Line Minuette (1.2295) - local maximum 1.2309 - control line UTL Minuette (1.2325) - upper channel boundary 1/2 Median Line Minuette (1.2375). In case of breakdown of the lower boundary of the 1/2 Median Line Minuette channel (support level of 1.2190), the downward movement of GBP / USD can continue to the equilibrium zone (1.2165 - 1.2120 - 1.2080) of the Minuette operational scale fork with the prospect of reaching a minimum of 1.2015. The details of the GBP / USD movement can be seen in the animated chart. ____________________ US dollar vs Japanese yen The development of the movement of the currency of the "land of the rising sun" USD / JPY from August 30, 2019 will be due to the development and direction of the breakdown of the boundaries of the 1/2 Median Line channel (107.00 - 106.55 - 106.15) of the Minuette operational scale fork. Look at the animated graphics for the movement details inside this channel. The breakdown of the support level of 105.06 at the lower boundary of the 1/2 channel Median Line Minuette together with ISL38.2 Minuette (106.00) will make it possible to develop the USD / JPY movement within the equilibrium zone (106.00 - 105.45 - 104.90) of the Minuette operational scale fork taking into account the development of the boundaries of the equilibrium zone (105.85 - 105.59 - 105.30) and 1/2 Median Line channel (105.15 - 104.90 - 104.60) of the Minuette operational scale fork. In case of breakdown of the upper boundary of the 1/2 Median Line channel (resistance level of 107.00) of the Minuette operational scale fork, the upward movement of the currency of the "country of the rising sun" can continue to the targets - control line UTL (107.46) of the Minuette operational scale fork - the initial SSL Minuette line (107.70) is the control line of UTL Minuette (108.40). We look at the details of the USD / JPY movement in the animated chart. ____________________ The review is made without taking into account the news background. The opening of trading sessions of major financial centers does not serve as a guide to action (placing orders "sell" or "buy"). The formula for calculating the dollar index : USDX = 50.14348112 * USDEUR0.576 * USDJPY0.136 * USDGBP0.119 * USDCAD0.091 * USDSEK0.042 * USDCHF0.036. where the power coefficients correspond to the weights of the currencies in the basket: Euro - 57.6% ; Yen - 13.6% ; Pound Sterling - 11.9% ; Canadian dollar - 9.1%; Swedish Krona - 4.2%; Swiss franc - 3.6%. The first coefficient in the formula leads the index to 100 at the start date of the countdown - March 1973, when the main currencies began to be freely quoted relative to each other. The material has been provided by InstaForex Company - www.instaforex.com |
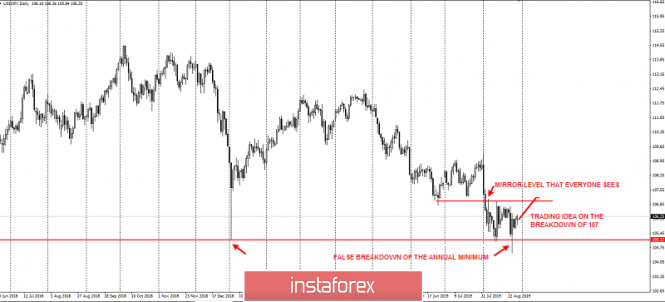
| Japanese currency trap sellers. Trading idea for the USDJPY. Posted: 29 Aug 2019 05:22 PM PDT Japanese trap sellers Trading idea for the USDJPY Dear traders, please pay attention to the instrument, which has undeservedly forgotten recently. Everyone knows that the yen often acts as a funding currency, and during periods of crisis, turmoil, and political uncertainties, investors are very pleased to "sit out" in the yen. Thus, it happened this time. Trade wars and exchange of duties led to the strengthening of the Japanese currency against the dollar, and since the spring of this year, we have seen a good short-term trend for USDJPY. However, this instrument is moving not only because of the strength of the yen, but also because of weak demand for the dollars in general. So, judging by the slowdown in the dynamics of MEGA-overbought gold, a wave of strengthening of the dollar is coming, which will lead to an upward trend in USDJPY as well as earning good money from it. The technical picture In August, the yen updated last year's minimum of 105 and rebounded - exposing a false breakdown in weeks. From the point of view of D1, the pair formed an ideal level of support-resistance on the quote in the area of the round level 107. This level is a magnet for attracting sellers' stops according to the trend. However, few people know that the so-called "mirror" pattern works well from 1-2 touches, and the longer the market stands at an obvious level, the more likely it is considered as a BREAK. As you know, I am a supporter of the "hunting for feet" method and I am deeply convinced that in most cases, everyone who puts their feet behind at obvious extremes and levels will sooner or later suffer losses. And the situation with the yen will not be an exception. Therefore, it is suggested to look at the long positions on USDJPY in order to update the level of 107. The material has been provided by InstaForex Company - www.instaforex.com |
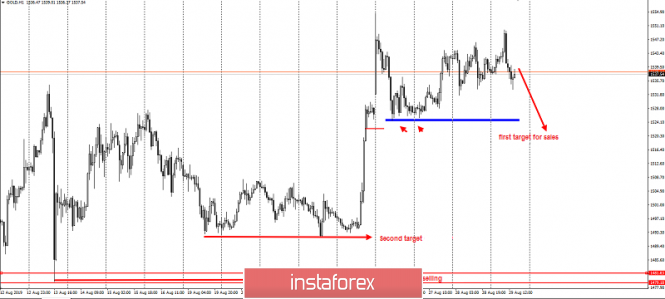
| Golden steam engine - Trading ideas for GOLD Posted: 29 Aug 2019 05:00 PM PDT Gold is going upwards by leaps and bounds, leaving the "corpses" of traders behind who want to average their short positions on an unprecedented bullish trend. Thus, gold absorbs absolutely all the sales that speculators offer it, which is normal in these conditions. Imagine yourself as an investor today. How to keep your currency assets? In the euro - with uncertainty in the eurozone and Merkel leaving? In pounds - with Boris Johnson? Or in gold, as banks do it? At the time of geopolitical and trade uncertainties - the answer is obvious. Since the spring of this year, gold has passed an incredible 27,000 points, as well as another 15,000 p over the past six months. This is practically without significant pullbacks. However, the last movement of quotes 1535 given to gold is not easy. And on D1, the mirror level on it is obvious. As usual, everyone who bought above will first of all hide their risks there, while below is the hourly TF with the most likely levels that will be captured in the near future. This will happen, as usual, on the next news. For example, NFP, or will be the "unexpected" from Trump. On the other hand, the first prerequisites for gold sales have already begun to appear, including the other day's American session. Although, this may not be direct sales, but banal profit-taking of those who are already given sitting in longs and sees that the dynamics of gold growth decreased by D1. In any case, working in shorts on an incredibly overbought instrument in the presence of obvious "debts" below looks very promising, especially in the calculation on fixing the hyper-profits of gold buyers. I also recommend selling gold from a false breakdowns of 1550 and 1555 with the first goal of taking profit at 1525. It is expected that after a wave of sales, gold may well return to the range of 1500-1550 dollars per troy ounce already on a weekly scale. The material has been provided by InstaForex Company - www.instaforex.com |
| GBP/USD: Johnson paused Parliament. What to expect next? Posted: 29 Aug 2019 04:34 PM PDT The fall of the GBP/USD pair to weekly lows has become perhaps one of the most interesting events in the foreign exchange market in recent days. Another attack on the weakness of the pound was provoked by the Prime Minister of the United Kingdom, Boris Johnson. The head of government asked the Queen of England to suspend the work of the British Parliament from September 9 to October 14, and she granted his request. Thus, lawmakers can only prevent Great Britain's exit from the European Union during the period from September 3 to 9, and also from October 14 to 31. According to analysts, the fact that the pound quickly lost ground previously won indicates that B. Johnson remains at least one step ahead of his opponents. So, the British prime minister made his move, what will follow next and how does this affect the dynamics of the pound? 1. Since the beginning of the Parliament, that is, from September 3, it is worth waiting for a vote of no confidence in B. Johnson and a slight but steady fall in GBP/USD. Most likely, it will not be possible to remove the prime minister from the legislators, since there are still disagreements in the Parliament. 2. Between September 9 and October 14, B. Johnson should expect actions related to an attempt to reach an agreement with the EU. If the eurozone makes concessions, it will be good news for the pound, as it seems to have come to terms with the "hard" Brexit. In this case, the GBP/USD pair will increase, which may be more or less serious. 3. If there are no agreements with the EU and the Parliament starts work from October 14, it is worth paying attention to whether it will be possible for the legislators to delay the terms of the hard Brexit or not. If so, then this will be a small positive for the GBP/USD pair. Otherwise, the UK's exit from the bloc without a deal will be inevitable. However, it can still change, and it is still difficult to make reliable forecasts. However, one thing is clear: B. Johnson is not David Cameron and Theresa May. An idea, albeit insane (in the opinion of some British MPs), firmly stuck in his head, and he intends to complete the matter, that is, to withdraw the United Kingdom from the EU at all costs. The material has been provided by InstaForex Company - www.instaforex.com |
| The dollar is rising as the market wonders if the US and China can agree Posted: 29 Aug 2019 04:34 PM PDT For the second time in the past two months, US Treasury Secretary Steven Mnuchin said the United States is not going to interfere with forex, but things could change in the future. BofA Merrill Lynch analysts believe that this can happen if the EUR/USD pair drops to the level of 1.05-1.07, while Citigroup analysts expect intervention near the 1.05 mark. "The risk of one-sided US currency intervention will not go away so easily," said Keith J., Societe Generale currency strategist. He estimates the probability of intervention at 25% and recommends that investors buy the Canadian dollar if this threat becomes real. According to the analyst, the Canadian currency is underestimated and has fewer shortcomings than most others amid the trade dispute between Washington and Beijing. Standard Chartered Bank's Steven Englander believes traders should buy the euro to benefit from any intervention. "If the United States wants to weaken the greenback, the only effective way to do this is to buy EUR and sell USD," he said. "If the US is targeting currencies such as the offshore yuan and the euro, then long positions in these currencies should be profitable in the event of an intervention," said Scotiabank Shaun Osborne. At the same time, he warns that traders who want to play on foreign exchange intervention must be agile with tactical rates, since the initial shock from any move by the US can quickly disappear. "Washington's unilateral intervention is unlikely to have a long-term effect on the markets," said Osborne. Despite the fact that a lot has been said about the dangers of a strong dollar, which includes US President Donald Trump, the greenback continues to strengthen. The USD index is still trading near annual highs. The main drivers of its growth are the high interest rates of the Fed, the difference in economic growth of the United States and other countries, as well as the belief that Washington will win the trade war with Beijing. According to recent research by Bloomberg Economics, the situation in China continues to deteriorate: business activity and exports are slowing, and stock indices are falling. The United States and China continue to send conflicting signals to the market regarding trade negotiations. US Presidential National Security Advisor John Bolton said Washington and Beijing still have significant trade disagreements. At the same time, White House spokesman Marc Short was optimistic about the deal. Gao Feng, the official spokesman for the Chinese Ministry of Commerce, said the parties should create the conditions for progress in the negotiations, adding that his country is against the escalation of the trade war with the United States and seeks to calmly resolve the dispute. At the same time, he noted that he was hoping for the abolition of new US duties on Chinese goods and added that Beijing has large-scale retaliatory measures in its arsenal. The fact that the yield on 10-year US government bonds is at the lows of July 2016 (around 1.5%), demonstrates that investors doubt the imminent end of the trade war. The greenback is also supported by hawkish statements by FOMC members. In particular, Richmond Fed President Tom Barkin drew attention to signs of accelerating inflation and strong consumer spending in the United States, while San Francisco Federal Reserve Head Mary Daly said that a further cut in interest rates threatens the country's financial stability. The EUR/USD pair continues to consolidate in the range of 1.1050-1.11150 in anticipation of US GDP data for the second quarter, which may reflect the impact of the Washington and Beijing trade war on the US economy. The material has been provided by InstaForex Company - www.instaforex.com |
| Posted: 29 Aug 2019 04:12 PM PDT 4-hour timeframe Amplitude of the last 5 days (high-low): 63p - 164p - 100p - 78p - 134p. Average volatility over the past 5 days: 108p (high). Thursday, August 28, passed in a calm direction without sharp jolts for the GBP/USD pair. Volatility in the pound/dollar pair as a whole remains quite high, more than 100 points per day. Meanwhile, passions continue to rage in the UK around Boris Johnson's decision to stop Parliament from September 9 to October 14. This decision has already been approved by Queen Elizabeth II. Boris Johnson and his entourage reject the accusation that the suspension of Parliament has been started in order to prevent deputies from vetoing the secession from the EU without a "deal". The prime minister claims to have sent MPs on vacation for an additional 5 weeks to plan a new government program. Protests have already taken place across the UK. Most opponents of the hard Brexit are calling Johnson's actions "unconstitutional and undemocratic." Member of the Conservative Party (!!!) Philip Hammond says the following: "This is a gross constitutional violation - not to allow Parliament to control the government during a national crisis. The prime minister's deeply undemocratic decision." A petition has already appeared on the internet, which has gained more than a million signatures in a day, demanding not to allow the Parliament to stop working. Observance with the principle of "democracy" is indeed called into question by Johnson's actions. It turns out that when democracy comes to a standstill (the three proposals rejected by Parliament for Theresa May's "deal"), it can easily be circumvented with the help of the Queen, who usually does not interfere in political issues. Labour and opposition leader Jeremy Corbyn said Johnson's actions were undemocratic and promised at a Parliamentary meeting that he would endorse a vote of no confidence in the prime minister. According to promptly conducted surveys, only 27% of respondents support Boris Johnson's decision to suspend Parliament. At the same time, the leader of the British House of Commons, Jacob Rees-Mogg, stated that the decision on new negotiations on a "deal", or "divorce", without any agreements lies entirely with the European Union. Rees-Mogg also rejects any allegations that the decision of Boris Johnson deprives the deputies of the opportunity to stop the chaotic exit from the EU. After October 14, Rees-Mogg believes, MPs will be able to speak out about this. The fact that October 14 will remain 2 weeks before Brexit is not taken into account in all seriousness. What this all means for the pound is clear to everyone. It is surprising that the British currency did not fall under a mass sell-off today. Probably, market participants still want to wait for the first Parliamentary meetings before the new "recess" and watch the actions of Jeremy Corbyn and the opposition. If Johnson doesn't succeed, the pound will almost completely go to a new lingering decline. The technical picture shows that so far the pound retains chances not to increase, but not to resume the fall. Below, the British pound is supported by the Senkou Span B strong line and the support level of 1.2133. If bears manage to overcome these supports, the British currency will continue to fall. Trading recommendations: The pound/dollar currency pair continues to adjust. Formally, long positions can be considered while aiming for the resistance level of 1.2298 if the pair returns above the Kijun-sen critical line. However, the fundamental background clearly does not imply the purchase of the British currency. In addition to the technical picture, fundamental data and the time of their release should also be considered. Explanation of the illustration: Ichimoku indicator: Tenkan-sen is the red line. Kijun-sen is the blue line. Senkou Span A - light brown dotted line. Senkou Span B - light purple dashed line. Chikou Span - green line. Bollinger Bands Indicator: 3 yellow lines. MACD indicator: Red line and bar graph with white bars in the indicator window. The material has been provided by InstaForex Company - www.instaforex.com |
| Posted: 29 Aug 2019 04:00 PM PDT 4-hour timeframe Amplitude of the last 5 days (high-low): 49p - 101p - 70p - 30p - 25p. Average volatility over the past 5 days: 55p (average). The euro continues to slowly fall against the US dollar and crept close to the lows of last Friday. Volatility in the US trading session increased, as several interesting reports were published in the United States at once. In the morning we said that all the reports of today are interesting, but they are unlikely to cause a serious reaction from traders, since all the "numbers" are preliminary. We already learned that the unemployment rate in Germany did not change in August (5%), and the inflation rate fell to 1.4%, which came as a surprise even to the most pessimistic analysts. Of course, as we have said, this is not the final meaning, it can still change for the better ... or for the worse. What is important is dynamics. And the dynamics show that inflation in individual countries of the eurozone continues to fall. As a whole in the eurozone. In the afternoon, a no less interesting report on US GDP for the second quarter was released from the Bureau of Economic Analysis. According to this report, GDP will drop to 2.0%, and this is also not the final value, but a decrease in the indicator may be a consequence of the trade war that Donald Trump is actively unleashing against China. One way or another, but we would like to note one important factor - US GDP (albeit an intermediate value) is declining, but the US currency still rises in price on Thursday, August 29. Thus, traders are unequivocally set to a "bearish" trend and see no serious reason to complete medium-term and long-term sales of the euro/dollar pair. Also in the United States, a report was published on the number of pending home sales transactions and it turned out that their number was reduced by 2.5% mom in July. This was a negative and was also ignored by market participants. The bottom line, we have the fact that today's macroeconomic statistics were generally ignored by traders. If it weren't, the dollar would not have risen in price. And so we have overcome the support level of 1.1078 and open the road to the second support level of 1.1015. On the last trading day of the week and month, that is, tomorrow, we will find out if we were right in the forecasts of a slowdown in EU inflation based on the fall in inflation in Germany. According to analysts, inflation in the EU in August will be "whole" 1.0% y/y and will not change compared to the previous month. We believe that a slowdown is possible, therefore it is entirely possible to count on a new fall in the euro currency on Friday, August 30. The technical picture is as clear as the fundamental one. A sell signal from Ichimoku "dead cross" has formed, the EUR/USD pair has overcome the level of 1.1078, bears continue to hold the initiative in their hands. Trading recommendations: EUR/USD continues to move down. At the moment, we can consider sell orders with the target support level of 1.1015. Bulls remain extremely weak, so buying the pair is now impractical. In addition to the technical picture, fundamental data and the time of their release should also be considered. Explanation of the illustration: Ichimoku indicator: Tenkan-sen is the red line. Kijun-sen is the blue line. Senkou Span A - light brown dotted line. Senkou Span B - light purple dashed line. Chikou Span - green line. Bollinger Bands Indicator: 3 yellow lines. MACD indicator: Red line and bar graph with white bars in the indicator window. The material has been provided by InstaForex Company - www.instaforex.com |
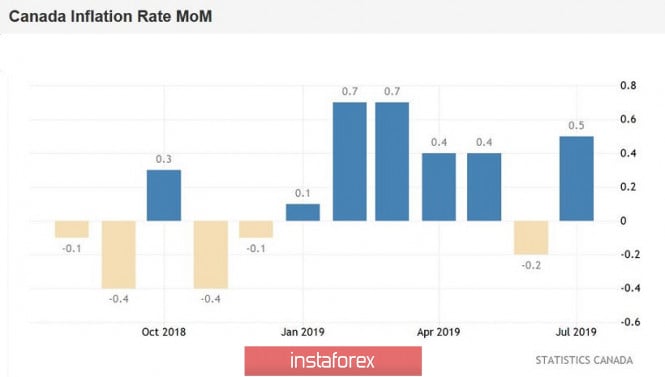
| USD/CAD: Friday "test" for the loonie ahead of the central bank meeting Posted: 29 Aug 2019 03:47 PM PDT Over the past four weeks, the Canadian dollar has been in a flat against the US currency, the scope of which covers an almost 100-point range. The loonie does not fall below the 32nd figure, but does not rise above the middle of the 33rd level. In this band, the price "walks" all of August, despite high-profile events of a geopolitical nature. Nevertheless, with a high degree of probability it can be assumed that very soon the pair will leave the indicated price niche. The only question is what kind of movement vector the traders will choose - either return to the bottom of the 30th figure with the intention of entering the area of the twentieth figures, or repeat the upward course to the annual high of 1.3560. This intrigue will not torment traders of the pair for too long - next week we will learn about the further intentions of the members of the Canadian central bank. If they join the ranks of the rest of the central banks of the leading countries of the world, embarking on the path of easing monetary policy, the loonie will collapse throughout the market. But an alternative scenario will help the loonie not only catch up on lost points, but also update the annual low. Let me remind you that the Bank of Canada spent five rounds of raising the rate since July 2018, essentially following its "southern neighbor" from the USA. However, over the past six meetings, the regulator has not taken any action. In addition, at the April meeting, the central bank deleted from the text of its accompanying statement a phrase about the further need to tighten monetary policy. Rumors about the likelihood of reversing steps in the direction of easing monetary policy were quite expected on the market. Against the backdrop of such conversations, the USD/CAD pair in late spring grew to the middle of the 35th figure, thereby setting the annual high. But over time, these conversations calmed down: moreover, the Canadian regulator remained "neutral" even after the head of the Fed, Jerome Powell, actually announced a rate cut at the July meeting. Traders of the USD/CAD pair expected similar hints from Stephen Poloz, however, his rhetoric at the last (July) meeting was "optimistic and restrained". Although he noted the economic risks from trade conflicts, he did not dramatize the situation. Unlike Powell, he announced a possible cut in interest rates - even as a preventative measure. Moreover, the head of the Bank of Canada noted that the regulator's forecast is "balanced" and does not require revision. At the same time, Poloz rather peculiarly allowed a rate cut in the future - according to him, the regulator will take this step if faced with "unaccounted for risks". Given this vague wording, the question emerged among traders - can the recent events of a geopolitical nature be classified as "unaccounted for risks"? Unfortunately, the opinions of analysts on this subject were divided. Some of them refer to the rhetoric of representatives of the Canadian regulator, who spoke after the July meeting of the BC. In particular, according to the First Deputy Governor of the Bank of Canada, Caroline Wilkins, further escalation of trade conflicts will be the "greatest risk" for both the global and Canadian economies, as the effects of the global trade war are becoming more tangible. However, not all currency strategists are certain that the Canadian central bank will follow the Fed's example, at least in the near future. Proponents of a wait-and-see attitude point to key macroeconomic reports. For example, the July consumer price index unexpectedly came out better than expected: on a monthly basis, the indicator left the negative area and reached 0.5% (with a forecast of growth to 0.1%). In annual terms, the indicator remained at a two percent level, although, according to the general opinion of economists, it should have dropped to 1.7%. Core inflation also grew: over the course of five months (from February to June) the core index exceeded 1.8%, but in July exceeded expectations and rose to 1.9%. Given such an ambiguous fundamental picture for the USD/CAD pair on the eve of the next meeting of the Bank of Canada (which will take place on September 4), tomorrow's data plays a special role. This is a growth indicator for the Canadian economy in June. Over the course of two months, Canada's GDP declined: in April, the indicator reached 0.3%, in May - 0.2% (in monthly terms). The consensus forecast suggests that in June the indicator will also show negative dynamics, falling to 0.1%. In annual terms, the key indicator should remain at the May level, that is, at around 1.4%. If, contrary to forecasts, real numbers are higher than expected, the Canadian dollar will receive substantial support. This circumstance will increase the likelihood that the Canadian central bank will take a wait and see attitude next week - especially against the background of ongoing trade negotiations (consultations) between Beijing and Washington. Given the lack of consensus on the possible position of the Bank of Canada, a positive report on the growth of the national economy may provoke a decrease in the price of USD/CAD at least to the bottom of the 32nd figure, that is, to the lower line of the Bollinger Bands indicator on the daily chart. The material has been provided by InstaForex Company - www.instaforex.com |
| EURUSD: German data increases the likelihood of lower interest rates in the eurozone Posted: 29 Aug 2019 03:37 PM PDT Demand for safe haven assets slightly decreased, and the US dollar strengthened its position after good news emerged regarding trade negotiations between the US and China, which are likely to continue in September this year. The Ministry of Commerce of China said today that they maintain effective communication on trade issues with the United States, and have sufficient means to respond if necessary. Negotiations are expected to continue in September this year in Washington. The ministry also called on the United States to create the necessary conditions for continuing negotiations, hinting at the abolition of new trade duties, which will take effect literally a few days in early autumn. Data on Germany further strengthened traders' expectation that the European Central Bank will nevertheless go on easing monetary policy at the next meeting this fall. Thus, applications for unemployment benefits in Germany rose in August this year. This once again confirms the fact of a slowdown in economic growth, which affects the labor market. The report of the Federal Employment Agency shows that the number of applications for unemployment benefits were up by 4,000 in August 2019 after an increase of 1,000 in July, while economists expected an increase in applications of 3,000. Unemployment in August remained unchanged, at level 5.0% Preliminary inflation data also suggests the need for the ECB's intervention. According to the report, preliminary CPI of Germany fell by 0.2% in August compared with July, while a decrease of only 0.1% was expected. Compared to the same period of 2018, inflation grew by 1.4% with a forecast of growth of 1.5%. As for inflation harmonized by EU standards, the German consumer price index fell by 0.1% in August and increased by 1.0% compared to last year. We pass from Germany to the eurozone. Here, the consumer confidence index in August this year fell even further to -7.1 points versus -6.6 points in July, which indicates the growth of skeptical households amid a slowdown in the global economy and aggravation of trade conflicts. Economists had expected consumer confidence to drop to -7.1 points. The eurozone economic sentiment index rose slightly in August, thanks to a slight improvement in the industrial sector, which suffered most this year from trade conflicts due to a sharp decline in exports. According to the data, the eurozone industry confidence index in August was -5.9 points versus -7.3 points in July. The confidence index in the eurozone services sector, by contrast, fell to 9.3 points from 10.6 points. The total index was 103.1 points. As for the technical picture of EURUSD, a bearish dynamics is clearly visible. Sellers are still looking at the support level of 1.1050 and at its update, which will lead to the formation of a new bearish trend, capable of pulling down risky assets in the area of lows 1.1020 and 1.0960. The material has been provided by InstaForex Company - www.instaforex.com |
| USDJPY could reach 107.50-108 the next few days Posted: 29 Aug 2019 12:01 PM PDT USDJPY is bouncing above 106.50 and is breaking short-term resistance levels. The bullish divergence warning signs in the RSI that we mentioned yesterday get confirmed today. This bounce could push price even towards 108-109 if we break above 106.70-106.80.
Red line -short-term resistance trend line Green line - very important trend line resistance USDJPY is moving above the red trend line resistance. Holding and stabilizing above 106.50 is key for the bullish scenario. USDJPY has the potential to bounce towards 108 or even 109 but bulls need to break above 106.80 next and stay above it. First bounce target is to see price touch the green downward sloping trend line resistance. If this trend line is broken we should expect USDJPY to touch the lower broken triangle boundary around 109. Holding above 105.65-105.80 is key for this short-term bounce. The material has been provided by InstaForex Company - www.instaforex.com |
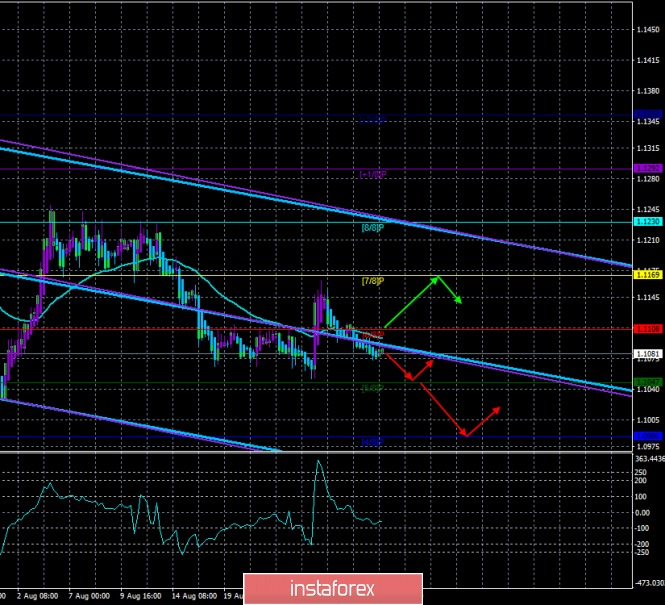
| EURUSD breaking recent lows targeting 1.0950 Posted: 29 Aug 2019 11:53 AM PDT EURUSD is trading at 1.1050 and looks very vulnerable to a move below 1.10 towards 1.0950. As long as price is below 1.1152 trend will remain bearish. There are bullish divergence signs but no reversal signal yet.
Green rectangle - support Red rectangle -target if support fails to hold EURUSD bulls remain weak. Price is breaking below the green support area and should continue lower towards the red rectangle at 1.0950. Trend is bearish. Resistance is at 1.1150 at the blue trend line. Bulls need to break above that trend line in order to hope for a short-term trend reversal to the upside. Bears remain in control of the trend for now. The material has been provided by InstaForex Company - www.instaforex.com |
| Posted: 29 Aug 2019 11:47 AM PDT Gold price got rejected at $1,545-50 and has canceled the bullish cup with handle pattern. Gold price could see price move $100 lower as there are Daily bearish divergence warning signs that should not be ignored.
Green line - bearish divergence Gold price is trading inside the bullish channel. Trend is bullish. However the RSI bearish divergence suggests that bulls need to be very cautious. Support is at $1,492 and resistance at $1,550. Important for the short-term trend is also the $1,539 level. As long as we trade below this level short-term trend is bearish with potential for a move lower towards the 38% Fibonacci retracement and the $1,450 area. The last stand for short-term bulls is at $1,492. Failure to stay above it will be a bearish sign. $1,510 is also short-term support and breaking it will be a sign of strength from the side of bears. Support is also found at the lower channel boundary at $1,472. The material has been provided by InstaForex Company - www.instaforex.com |
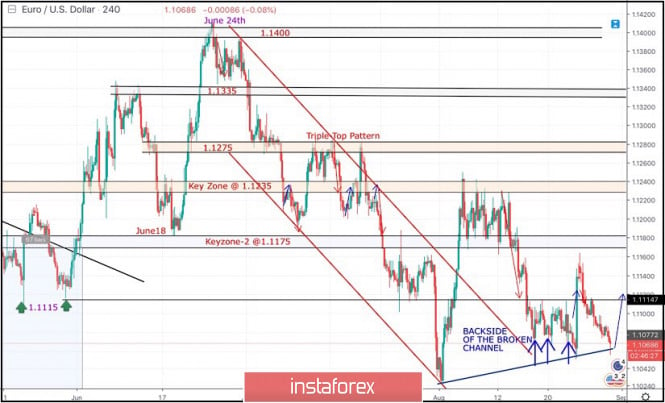
| August 29, 2019 : Despite Recent Intraday Bearish Rejection, EUR/USD positivity remains an option. Posted: 29 Aug 2019 07:51 AM PDT
Back in June 24, the EURUSD looked overbought around 1.1400 facing a confluence of supply levels which generated significant bearish pressure over the pair. Shortly after, In the period between 8 - 22 July, a sideway consolidation-range was established between 1.1200 - 1.1275 until a triple-top reversal pattern was demonstrated around the upper limit. Then, Evident bearish momentum (bearish engulfing H4 candlestick) could bring the EURUSD below 1.1175. This facilitated further bearish decline towards 1.1115 (Previous Weekly Low) then 1.1025 (the lower limit of the depicted recent bearish channel) where significant signs of bullish recovery were demonstrated. Risky traders were advised to look for bullish breakout above 1.1050 as a bullish signal for an Intraday BUY entry with bullish targets around (1.1115, 1.1175 and 1.1235). All of which were successfully reached. Shortly-After in Mid-August, the EUR/USD has been trapped between 1.1235-1.1175 for a few trading sessions until bearish breakout below 1.1175 occurred on August 14. Bearish breakout below 1.1175 promoted further bearish decline towards 1.1075 where the backside of the broken bearish channel has been providing significant bullish demand so far (A Bullish Triple-Bottom pattern is in progress). Bullish persistence above 1.1115 is needed to confirm the short-term trend reversal into bullish. This would enhance another bullish spike towards 1.1175 as an initial bullish target. Intraday bearish rejection is currently being manifested on the chart. However, bullish expectations remain valid unless quick bearish breakout below 1.1040 is achieved during today's consolidations. Trade recommendations : Conservative traders are advised to have a valid BUY entry anywhere around the current price levels. Initial T/P levels should be located around 1.1150, 1.1175 and 1.1200. Tight S/L should be placed just below 1.1040 ( the depicted newly-established uptrend line). The material has been provided by InstaForex Company - www.instaforex.com |
| EUR/USD. Opinion: Germany's CPI is a harbinger of an inflationary catastrophe in the European Union Posted: 29 Aug 2019 07:27 AM PDT
This morning, we drew traders' attention to a macroeconomic report such as inflation in Germany for August. We also noticed that the report is quite interesting but it is unlikely to cause a strong reaction of traders. And so it happened. During today, the volatility of the EUR/USD pair remains low, no more than 32 points. Also, the downward mood of traders remains, as macroeconomic statistics from Europe disappointed again. The German inflation report showed a slowdown to 1.4% y/y, while forecasts predicted a decrease to 1.5% and the previous value was 1.7% y/y. In monthly terms, inflation lost 0.2%. Based on these figures, we may well expect the same low total for inflation in Germany for August, as well as a slowdown and European inflation. Recall that in July, EU inflation fell from 1.3% to 1.0% y/y. Accordingly, in August, we can expect a slowdown in the consumer price index to values of less than one percent. What will the ECB do with disappointing inflation? The obvious answer is to use monetary stimulus: cut rates, print money, lend to banks. Next question: when? We believe that the negative trend in reducing inflation will force Mario Draghi to take emergency measures at the next meeting, that is, in September. Most likely, it will be in September that the rate cut will be announced, as well as the resumption of the quantitative stimulus program. It should also be remembered that in two months, the 8-year term of the contract, Mario Draghi, will expire and he will resign. He will be replaced by Christine Lagarde, who has already left the post of IMF chairman. Many experts believe that Draghi will want to "slam the door" in the end and will go to a significant easing of the monetary policy of the ECB. In the context of the euro and the EUR/USD currency pair, this does not bode well for the euro. We have repeatedly noted that the Fed has taken a course to reduce the rate, but this does not mean anything good for the euro, because the Fed will reduce the rate from 2.5%, and the ECB will start to reduce the rate from 0.0% -0.4%. Thus, the balance of monetary policies between the EU and the States will remain completely in favor of the euro. Accordingly, we may well expect a further fall in the euro. The material has been provided by InstaForex Company - www.instaforex.com |
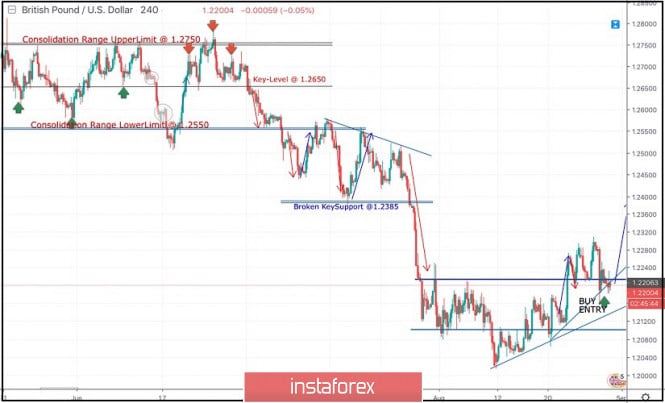
| August 29, 2019 : GBP/USD Intraday technical analysis and trade recommendations. Posted: 29 Aug 2019 07:26 AM PDT
On July 5, a consolidation range bearish breakout was demonstrated below 1.2550 corresponding to the lower limit of the depicted consolidation range. Moreover, Bearish breakdown below 1.2385 (Prominent Bottom) facilitated further bearish decline towards 1.2320, 1.2210 and 1.2100 which corresponded to significant key-levels on the Weekly chart. The previously-mentioned price levels were risky for having new SELL entries. That's why, Long-term SELLERS were advised to have their profits gathered few weeks ago. In Early August, a temporary consolidation-range was established above 1.2100 before August 9 when temporary bearish movement was executed towards 1.2025. Recent bullish recovery was demonstrated off the recent bottom (1.2025). This brought the GBP/USD pair back above 1.2100 (Lower limit of the recently established consolidation-zone). As expected, further bullish advancement was demonstrated towards 1.2230 then 1.2280 where recent bearish rejection was manifested towards 1.2215-1.2200. For the intermediate-term, Further bullish advancement is expected to pursue towards 1.2320 then 1.2380 as long as the current bullish momentum above 1.2200 and 1.2160 (the recent consolidation range pivot-point) is maintained on a daily basis. Otherwise, another quick bearish decline should be anticipated towards 1.2100 where a new set of trading decisions can be considered On the other hand, If the current bullish movement pursued further bullish momentum, price action should be watched cautiously around 1.2380 as bearish rejection maybe anticipated around this price level (being a correspondent to a broken Key-Support dating back to July 17). Trade Recommendations: Intraday traders can look for a valid BULLISH entry anywhere around 1.2200-1.2170. Next T/P level to be placed around 1.2280, 1.2340 and 1.2385 while S/L should be placed below 1.2100. The material has been provided by InstaForex Company - www.instaforex.com |
| GBP/USD. Opinion: what is happening in British politics? Posted: 29 Aug 2019 07:09 AM PDT
For the first two years after the 2016 referendum, London held constructive talks with Brussels, and everything went to the fact that the "deal" would be concluded, and the parties would part amicably. However, after three refusals by the British Parliament to accept the agreement reached by Theresa May, it became clear that the legislative machine has failed. Theresa May resigned, and there were immediate hopes that the situation would be resolved. After all, a new Prime Minister will come with new ideas. None of this happened. Boris Johnson arrived, who easily won the race for the prime minister's chair. And now, just a month after he took office, the parliament does not know how to remove him from this position. Johnson did nothing destructive. Just from the very first day of his term, he began to push through the "hard" Brexit scenario and prepare the country for such an outcome. And it is difficult to accuse him of lying, as the essence of his policy on Brexit was known to everyone, and during the elections, which lasted more than a month, and before the election. Purely "for a show", Johnson tried to negotiate with EU leaders, went to Germany and France, wrote a couple of letters to Donald Tusk. Naturally, he was refused by the European Union on his proposal to delete the item on "backstop" from the Brexit agreement and calmed down. In the face of the public, he tried to negotiate with the EU, but the Alliance refused to negotiate. Then frank blackmail began. Johnson said that Britain will refuse to pay 39 billion pounds for leaving the EU, and will pay only 9. Johnson's last action was to stop the parliament for 1 month. Meanwhile, the Conservatives, Labor and other parties are preparing to announce a vote of no confidence in the Prime Minister. Labor leader Jeremy Corbyn has been hatching the idea of declaring a vote for several weeks, but now that Johnson has begun to force things ahead of the curve, Corbyn has no choice but to organize parliamentary hearings as quickly as possible, in which he declares a vote of no confidence in Johnson. Announce and hope that most parliamentarians will support him. Indeed, already on the 9th, the parliament's work will be suspended, and there will be no chance to stop the "hard" Brexit. And there are two possible scenarios:
|
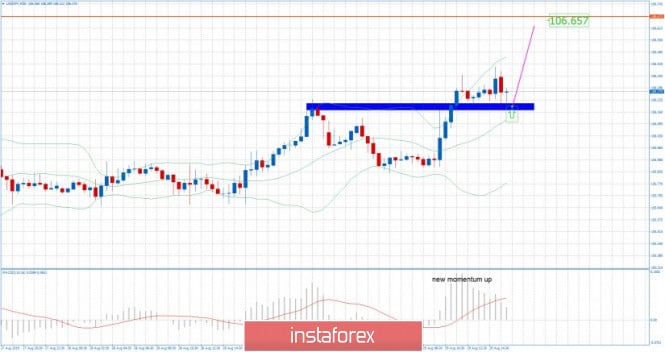
| USD/JPY analysis for August 29, 2019 - Support on the test, potential for rally Posted: 29 Aug 2019 06:33 AM PDT USD/JPY has been trading upwards today and there is a good momentum on the upside present. I would watch for buying opportunities on the dips with the potential target at 106.65
Blue rectangle – Intraday support Red horizontal line – Resistance and objective target Magneta upward line – Expected path MACD oscillator is showing new up momentum in the background and I do expect at least another movement higher. Key resistance is at 106.65 and intraday support at 106.17.Bears need to be very cautious as there is still a overall bullish trend. I will stay bullish as long we don't see any big reversal sign. Upward momentum will not disappear easily, it will take time to slowdown. Buying opportunities are preferable. The material has been provided by InstaForex Company - www.instaforex.com |
| USD/JPY depends on trade jitters, so cautious buying on dips Posted: 29 Aug 2019 06:23 AM PDT The US economic data had little impact and USD/JPY moves will be dominated by trade developments. With markets looking for fresh impetus, the US economic data was oflittle importance to traders. The revised reading of the second-quarter GDP came in at 2.0% from the flash reading of 2.1% and in line with consensus forecasts, although consumer spending growth was revised upward. Initial jobless claims increased to 215,000 from 211,000 previously, also in line with market expectations. The goods trade deficit narrowed to $72.3bn in July from $74.2bn in the previous month as imports declined slightly on the month. Treasuries edged lower after the data, but the 10-year yield was trapped below 1.50%. USD/JPY hit resistance close to 106.40 and retreated to 106.25 with the US currency struggling to take advantage of gains in US equity futures. The overall yield structure will limit potential USD support with Japanese funds wary over funnelling capital overseas. Trade rhetoric will continue to set the tone in the market in the short term. Although China has confirmed that US and Chinese trade teams have been conversing, it also stated that negotiations in September would be dependent on the right atmosphere to nurture constructive negotiations. The dollar will get a short-lived boost if it is confirmed that the September negotiations in Washington will take place as scheduled. However, overall sentiment will inevitably remain fragile, especially given the threat of erratic rhetoric from President Trump. Trading volumes will also decline ahead of the US long weekend with Labor Day on Monday. There will be very tough resistance on any USD/JPY approach to 106.75 with short-term support on approach to 105.70.
|
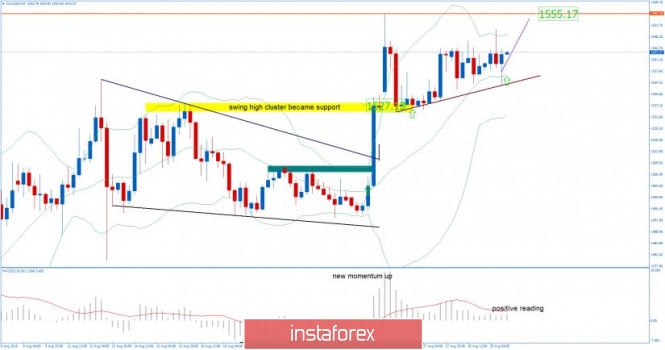
| Gold 08.29.2019 - Steady bullish trend, more upside yet to come Posted: 29 Aug 2019 06:09 AM PDT Gold has been trading sideways at the price of $1,544 but my structure for upside didn't change. I still expect more upside and potential test of $1,555.There are no signs of any reversal yet and I am still bullish on the Gold.
Brown diagonal trend line– Rising support Yellow rectangle – Resistance became support Red horizontal line – Resistance and our upward target Green moving average – Support Middle Bollinger band MACD oscillator is still showing stable up momentum in the background and I do expect at least another movement higher. Key resistance is at $1,555 and support at $1,525. Gold found today support at $1,533, which is the level of recent swing lows. Bears need to be very cautious as there is still a overall bullish trend. I will stay bullish as long we don't see any big reversal sign. As long as the Gold is trading above the $1,525, I would watch for buying opportunities on the dips with target at $1,555. If you got long position from yesterday is is good idea to secure position on the breakeven and watch for potential target at $1,555.The material has been provided by InstaForex Company - www.instaforex.com |
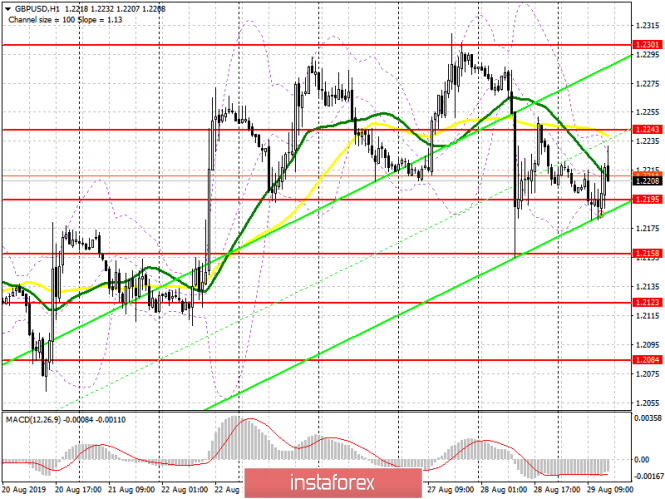
| Posted: 29 Aug 2019 06:04 AM PDT To open long positions on GBP/USD, you need: In the morning, I paid attention to the support of 1.2195, after a false breakdown of which the pound buyers had to return to the market, which happened. At the moment, the task of the bulls is the resistance of 1.243, which will limit the upward potential, but the main goal will be a maximum of 1.2301, where I recommend fixing the profits. Given that the market is unstable, after yesterday's news about the suspension of the UK Parliament, it is possible that the pound will fall further. With a repeated test of the support of 1.2195, I recommend to postpone long positions until the test of larger lows of 1.2158 and 1.2123. To open short positions on GBP/USD, you need: The sellers were not able to catch the first support for 1.2195, but also, as can be seen on the chart, no one wants to rush into buying the pound either. The task of the bears, as in the first half of the day, will be to break and consolidate below the level of 1.2195. Only after that can we expect a further drop in GBP/USD in the area of larger supports of 1.2158 and 1.2123, where I recommend fixing the profits. If the pound will continue to show an upward correction, it is best to look at short positions after a false breakdown from a maximum of 1.2250 or sell on a rebound from 1.2300. Signals of indicators: Moving Averages Trading is below 30 and 50 moving averages, indicating a return to the sellers market. Bollinger Bands The growth of the pound has already stopped the upper limit of the indicator at 1.2230. The bears will be focused on the break of the lower border of 1.2190, which will lead to a further decrease in the pair.
Description of indicators
|


| You are subscribed to email updates from Forex analysis review. To stop receiving these emails, you may unsubscribe now. | Email delivery powered by Google |
| Google, 1600 Amphitheatre Parkway, Mountain View, CA 94043, United States | |
No comments:
Post a Comment