Forex analysis review |
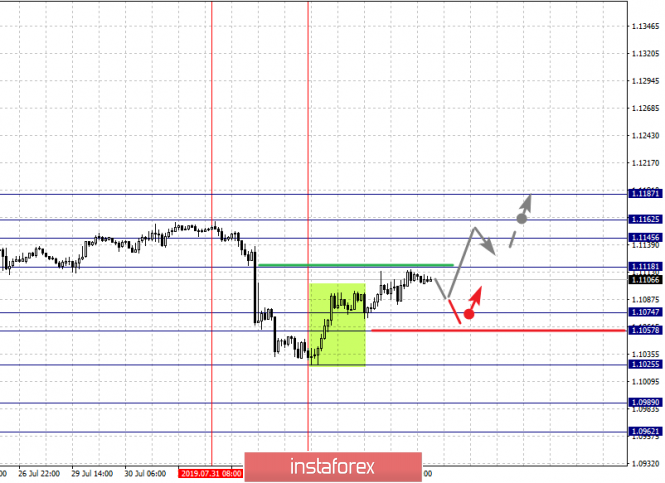
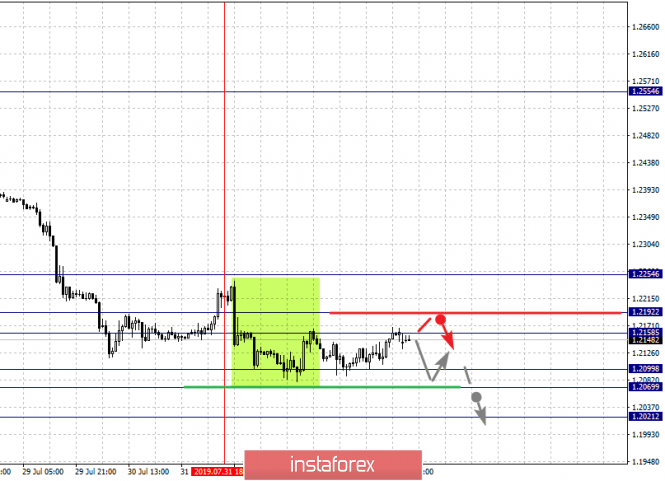
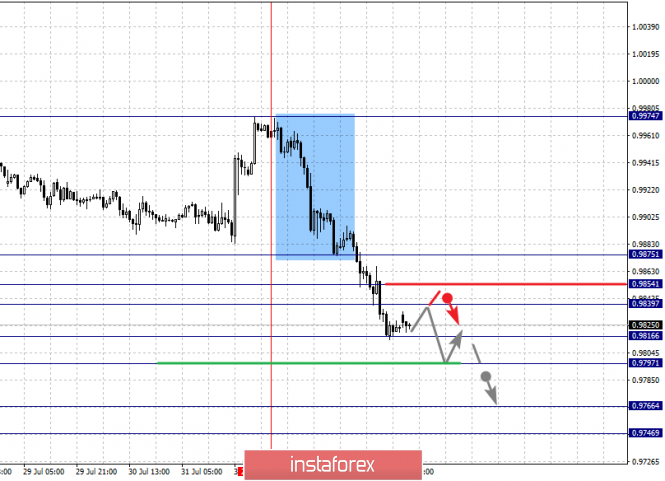
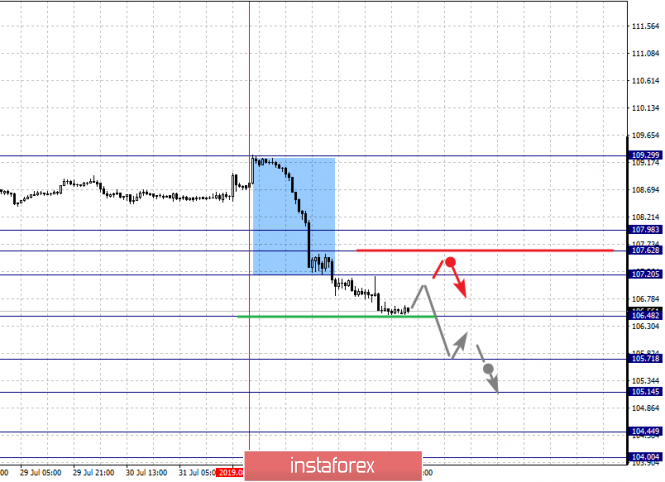
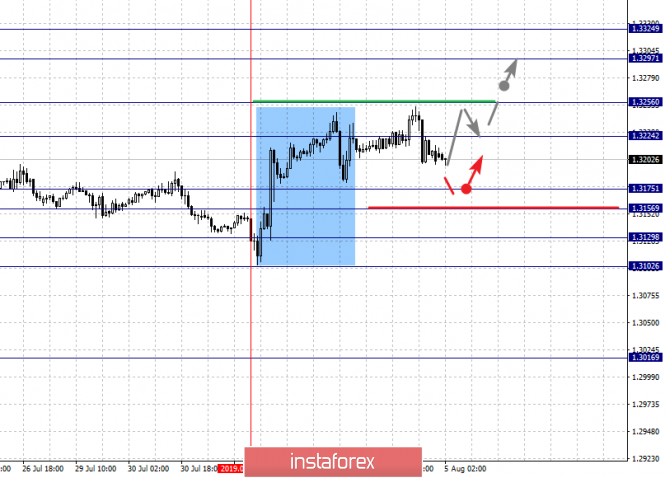
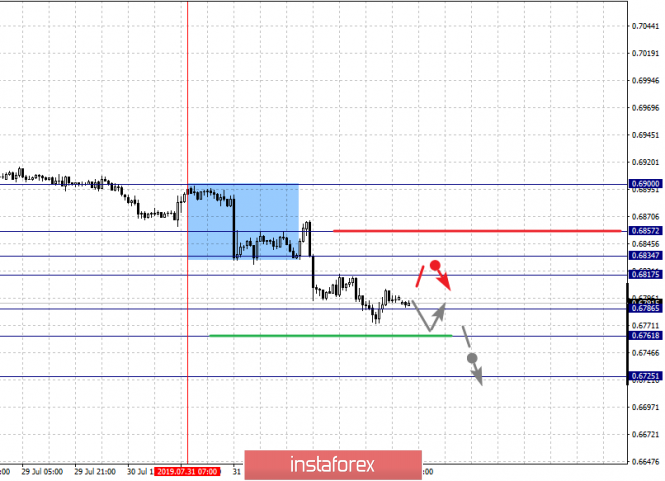
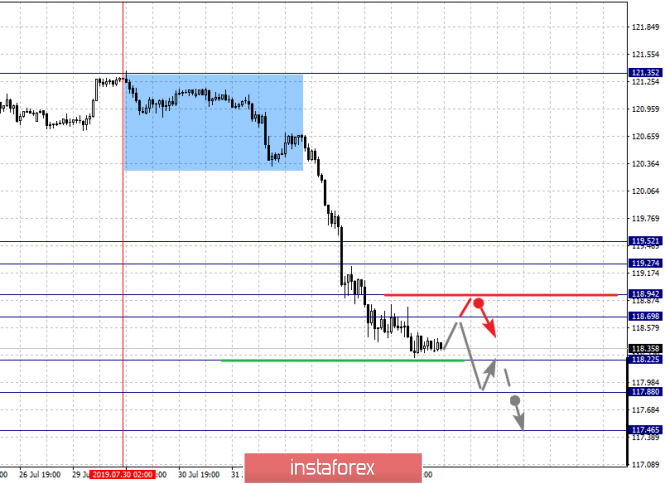
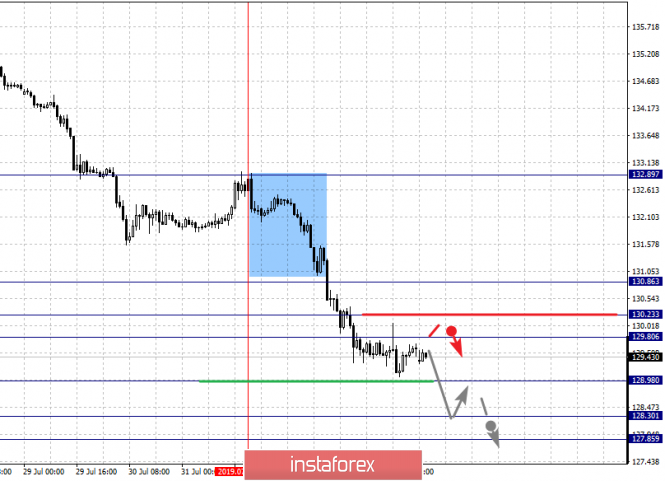
| Fractal analysis of major currency pairs on August 5 Posted: 04 Aug 2019 05:37 PM PDT Forecast for August 5 : Analytical review of H1-scale currency pairs: For the euro / dollar pair, the key levels on the H1 scale are: 1.1187, 1.1162, 1.1145, 1.1118, 1.1074, 1.1057, 1.1025, 1.0989 and 1.10962. Here, the development of the ascending structure of August 1 is expected after the breakdown of the level of 1.1118. In this case, the goal is 1.1145. Meanwhile, in the range of 1.1145 - 1.1162, there is a price consolidation. For the potential value for the top, we consider the level of 1.1187. After reaching which, we expect a rollback to the bottom. The range of 1.1074 - 1.1057 is the key support for the ascending structure. Its price passage will have a downward trend. Here, the goal is 1.1025. This level is the key resistance for the subsequent downward movement. Its breakdown will make it possible to count on pronounced movement. Here, the goal is 1.0989. For the potential value for the bottom, we consider the level of 1.0962, and near which, we expect consolidation. The main trend is the local downward structure of July 31, the formation of the structure for the top of August 1. Trading recommendations: Buy 1.1118 Take profit: 1.1145 Buy 1.1162 Take profit: 1.1186 Sell: 1.1056 Take profit: 1.1027 Sell: 1.1023 Take profit: 1.0990 For the pound / dollar pair, the key levels on the H1 scale are: 1.2254, 1.2192, 1.2158, 1.2099, 1.2069 and 1.2021. Here, we are following the downward cycle of July 19, as well as the local downward structure of July 31. Short-term movement to the bottom is expected in the range of 1.2099 - 1.2069. The breakdown of the last value will allow to expect movement to the potential target - 1.2021. From this level, we expect a departure to the correction. Short-term upward movement is possibly in the range of 1.2158 - 1.2192. The breakdown of the latter value will lead to the formation of the initial conditions for the top. Here, the potential target is 1.2254. The main trend is the downward cycle of July 19, the local structure of July 31. Trading recommendations: Buy: 1.2158 Take profit: 1.2191 Buy: 1.2194 Take profit: 1.2254 Sell: 1.2099 Take profit: 1.2070 Sell: 1.2067 Take profit: 1.2025 For the dollar / franc pair, the key levels on the H1 scale are: 0.9875, 0.9854, 0.9839, 0.9816, 0.9797, 0.9766 and 0.9746. Here, we are following the development of the downward cycle of August 1. Short-term downward movement is expected in the range of 0.9816 - 0.9797. The breakdown of the last value should be accompanied by a pronounced downward movement. Here, the goal is 0.9766. For the potential value for the bottom, we consider the level of 0.9746. After reaching which, we expect consolidation, as well as rollback to the top. Short-term upward movement is possibly in the range of 0.9839 - 0.9854. The breakdown of the latter value will lead to in-depth correction. Here, the goal is 0.9875. This level is a key support for the downward structure of August 1. The main trend is the downward structure of August 1. Trading recommendations: Buy : 0.9839 Take profit: 0.9854 Buy : 0.9856 Take profit: 0.9875 Sell: 0.9815 Take profit: 0.9800 Sell: 0.9795 Take profit: 0.9766 For the dollar / yen pair, the key levels on the scale are : 107.98, 107.62, 107.20, 106.48, 105.71, 105.14, 104.44 and 104.00. Here, we are following the formation of the downward structure of August 1. The continuation of the movement to the bottom is expected after the breakdown of the level of 106.48. In this case, the goal is 105.71. Short-term downward movement, as well as consolidation is in the range 105.71 - 105.14. The breakdown of the level of 105.14 should be accompanied by a pronounced downward movement. Here, the goal is 104.45. For the potential value for the bottom, we consider the level of 104.00. After reaching which, we expect to go into a correction. Care in the adjustment zone is expected after the breakdown of the level of 107.20. Here, the goal is 107.62. The range of 107.62 - 107.98 is the key support for the downward structure. The main trend: the formation of the downward structure of August 1. Trading recommendations: Buy: 107.20 Take profit: 107.60 Buy : 107.62 Take profit: 107.98 Sell: 106.45 Take profit: 105.71 Sell: 105.69 Take profit: 105.20 For the Canadian dollar / US dollar pair, the key levels on the H1 scale are: 1.3324, 1.3297, 1.3256, 1.3224, 1.3175, 1.3156, 1.3129 and 1.3102. Here, we continue to monitor the local ascending structure of July 31. The continuation of the movement to the top is expected after the breakdown of the level of 1.3224. Here, the goal is 1.3256, where consolidation is near this level. The breakdown of the level 1.3257 should be accompanied by a pronounced upward movement. Here, the target is 1.3297. We consider the level of 1.3324 to be a potential value for the top. Upon reaching this level, we expect consolidation as well as a rollback to the bottom. Short-term downward movement is possibly in the range of 1.3175 - 1.3156. The breakdown of the latter value will lead to a prolonged correction. Here, the goal is 1.3129. This level is a key support for the top. The main trend is the local ascending structure of July 31. Trading recommendations: Buy: 1.3225 Take profit: 1.3255 Buy : 1.3257 Take profit: 1.3295 Sell: 1.3175 Take profit: 1.3156 Sell: 1.3153 Take profit: 1.3130 For a pair of Australian dollar / US dollar key levels on the H1 scale are : 0.6857, 0.6834, 0.6817, 0.6786, 0.6761 and 0.6738. Here, we are following the downward structure of July 31. The continuation of the downward trend is expected after the breakdown of the level of 0.6786. In this case, the target is 0.6761. For the potential value for the downward structure of July 31, we consider the level of 0.6738. Upon reaching which, we expect a rollback to the top. Short-term upward movement is possibly in the range of 0.6817 - 0.6834. The breakdown of the latter value will lead to in-depth correction. Here, the target is 0.6857. This level is a key support for the downward structure. The main trend is the local downward structure of July 31. Trading recommendations: Buy: 0.6817 Take profit: 0.6832 Buy: 0.6835 Take profit: 0.6855 Sell : 0.6786 Take profit : 0.6764 Sell: 0.6760 Take profit: 0.6738 For the euro / yen pair, the key levels on the H1 scale are: 119.52, 119.27, 118.94, 118.69, 118.22, 117.88 and 117.46. Here, we are following the development of the downward cycle of July 30th. Short-term downward movement is expected in the range of 118.22 - 117.88. Hence, there is a high probability of movement in the correction. For the potential value for the bottom, we consider the level of 117.46. From which, we expect a rollback to the top. Short-term upward movement is possibly in the range of 118.69 - 118.94. The breakdown of the latter value will lead to a prolonged correction. Here, the target is 119.27. The range of 119.27 - 119.52 is a key support for the downward structure. The main trend is the downward cycle of July 30th. Trading recommendations: Buy: 118.70 Take profit: 118.92 Buy: 118.96 Take profit: 119.27 Sell: 118.20 Take profit: 117.90 Sell: 117.86 Take profit: 117.46 For the pound / yen pair, the key levels on the H1 scale are : 130.86, 130.23, 129.80, 128.98, 128.30 and 127.85. Here, we are following the local downward structure of July 31. The continuation of the movement to the bottom is expected after the breakdown of the level of 128.98. In this case, the goal is 128.30. Price consolidation is in the range of 128.30 - 127.85. Short-term upward movement is possibly in the range of 129.80 - 130.23. The breakdown of the latter value will lead to a prolonged correction. Here, the goal is 130.86. This level is a key support for the bottom. The main trend is the local downward structure of July 31. Trading recommendations: Buy: 129.80 Take profit: 130.20 Buy: 130.26 Take profit: 130.84 Sell: 128.95 Take profit: 128.30 Sell: 128.28 Take profit: 127.85 The material has been provided by InstaForex Company - www.instaforex.com |
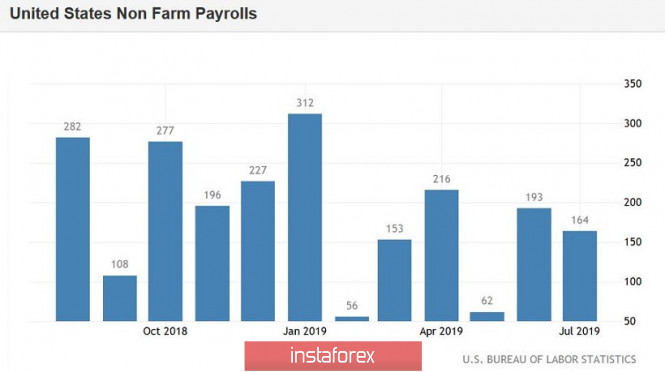
| EUR/USD. Useless Nonfarms: Trump made traders turn away from macroeconomic reports Posted: 04 Aug 2019 03:46 PM PDT Data on the growth of the US labor market could not support the dollar, which rather unexpectedly came under pressure from an external fundamental background. Another escalation of the trade war between the United States and China has mixed all the cards with dollar bulls. After all, at the end of the July Fed meeting, traders had the confidence that the regulator would limit itself to one round of rate cuts, as a precautionary measure. However, after the release of an extremely weak ISM index in the manufacturing sector, as well as after a resonant statement by Donald Trump, concerns about the Fed's next steps returned to the market. Let me remind you that at the end of last week, the US president promised to introduce an additional 10 percent duty on imports of Chinese goods worth $300 billion starting on September 1, given that Beijing does not agree to conclude a deal with the United States before this deadline. If this scenario is implemented, additional tariffs will cover almost all imports from China. Trump was also outraged by the fact that China refused to comply with the agreements that were reached at the G-20 summit (we are talking about the resumption of purchases of agricultural goods). The fact that Washington, in fact, did not fulfill its part of the agreements (regarding the lifting of sanctions against Huawei), the head of the White House modestly kept silent. Nevertheless, the fact remains: recent events suggest that the positive results of the G20 summit have been completely offset. The first round of negotiations after the summit was completed ahead of time and without any clear result, whereas a few days later, Trump announced the above ultimatum. Here, even without official comments, it becomes clear that the parties are still defending their positions, despite the formal desire to find a mutually beneficial compromise. Before the start of the negotiations, Trump suggested that the Chinese would deliberately pull time before the next presidential election in the United States (which will take place in November 2020), hoping for a change of power. The most likely candidates from the Democratic Party are really ahead of the current president - at least for today. Therefore, there is certainly some sense in Beijing's actions: why make a knowingly unprofitable deal with Trump, if in a year it will be possible to agree on other conditions with Biden? This is the reason for such haste in Donald's decisions - given the rating gap from the Democrats, he needs a victory in a trade war, the negative consequences of which are felt not only by China and the world economy, but also by the US economy. Such prospects had a fairly strong pressure on the US currency. Traders again increased the likelihood of another round of rate cuts at one of the autumn meetings (most likely in September), while some analysts do not rule out more radical scenarios - either a one-time rate cut of 50 basis points or a third decline in December. of the year. Such an unexpected reversal of the plot allowed the EUR/USD pair to move away from the level of a multi-year low (1.1026) and demonstrate corrective growth to the level of 1.1117. In general, the dollar index in a few hours of Friday fell from 98.258 to 97.873. The yield on 10-year-old Treasuries has also declined significantly - the indicator has collapsed to almost a three-year low (1.843%). The market clearly focused on geopolitical events, as it completely ignored one of the key macroeconomic indicators, Nonfarms. Although this release was supposed to support a further rally in the US currency: the US labor market continues to recover, demonstrating the growth of the main components. Thus, the number of people employed in the non-agricultural sector increased by 164,000 (which fully coincided with the forecast), while the unemployment rate remained at a record low of 3.7%. The number of people employed in the manufacturing sector of the economy increased by 16 thousand (a positive trend for the 2nd month in a row). The growth rate of the average hourly wage also pleased investors: in annual terms, the indicator rose to 3.2% (for the first time since April), and in monthly terms, the component rose to 0.3% (at this level, the indicator goes for the third month in a row). Thus, the July data completely offset concerns about the dynamics of growth in the US labor market, although this issue was on the agenda this spring, both among investors and members of the US regulator. It is likely that after the release of Friday's data, EUR/USD bears would try to enter the ninth figure area or at least try to test a strong support level of 1.0980 (lower Kumo cloud boundary on the monthly chart) - but an unexpected move by the US president ruined the plans of the dollar bulls. When trading was about to close, the pair approached the first resistance level of 1.1120 (Tenkan-sen line on the daily chart), and if the growth of anti-risk sentiment continues, then the bulls will be able to develop further correction - up to the levels of 1.1190 and 1.1220 (middle line BB and Kijun-sen line on D1). Here it is worth noting that on Friday, the Chinese Ministry of Commerce has already accused Donald Trump of violating the June agreement with Xi Jinping, promising to use "countermeasures". It is likely that this week we will find out what measures we are talking about. Strengthening the US-China conflict will put pressure on the dollar, since the escalation of trade war is seen by the market through the prism of prospects for further easing of the Fed's monetary policy. The material has been provided by InstaForex Company - www.instaforex.com |
| You are subscribed to email updates from Forex analysis review. To stop receiving these emails, you may unsubscribe now. | Email delivery powered by Google |
| Google, 1600 Amphitheatre Parkway, Mountain View, CA 94043, United States | |


No comments:
Post a Comment