
Forex analysis review |
- USD / JPY vs EUR / JPY vs GBP / JPY. Comprehensive analysis of movement options from September 13, 2019 APLs & ZUP analysis
- Fractal analysis of the main currency pairs for September 13
- EUR/GBP returns to growth, pound lacks good news
- Euro gloom: the meltdown
- EUR/USD. "Bear feast" cancelled: the ECB disappointed sellers of the pair
- EURUSD: Results of the ECB meeting: expected decision on interest rates and a return to the asset purchase program
- GBP/USD. September 12. Results of the day. Fifth defeat of Boris Johnson. Collection of failures replenished
- EUR/USD. September 12. Results of the day. A crazy day for the euro currency
- EURUSD makes major double bottom
- Gold gets rejected at important short-term resistance
- September 12, 2019 : EUR/USD Intraday technical analysis and trade recommendations.
- September 12, 2019 : GBP/USD Intraday technical analysis and trade recommendations.
- BTC 09.12.2019 - Important short-term resitance on the test at $11,400, watch for sell opportunities
- Gold 09.12.2019 - Strong rejection of the resistance cluster at $1,518, more downside yet to come
- GBP/USD 09.12.2019 - End of the downward correction and potential new bullish wave
- Different scenarios for EUR/USD pair following an important ECB meeting
- What can be expected from the decision of the ECB? (We sell or buy EUR/USD pair based on the decision of the ECB and expect
- GBP/USD: plan for the American session on September 12th. The pound remains in a narrow side channel and waits for inflation
- EUR/USD: plan for the American session on September 12th. The refinancing rate remained unchanged, and deposits fell even
- Trading recommendations for the GBPUSD currency pair – placement of trade orders (September 12)
- Oil went negative as Trump claims
- Control zones for GBP / USD pair on 09/12/19
- Trading strategy for Bitcoin on September 12th. Bitcoin is heading for a long-term goal of $4,000?
- Technical analysis of EUR/USD for September 12, 2019
- Trading strategy for EUR/USD and GBP/USD on September 12th. The results of the ECB meeting are important but do not forget
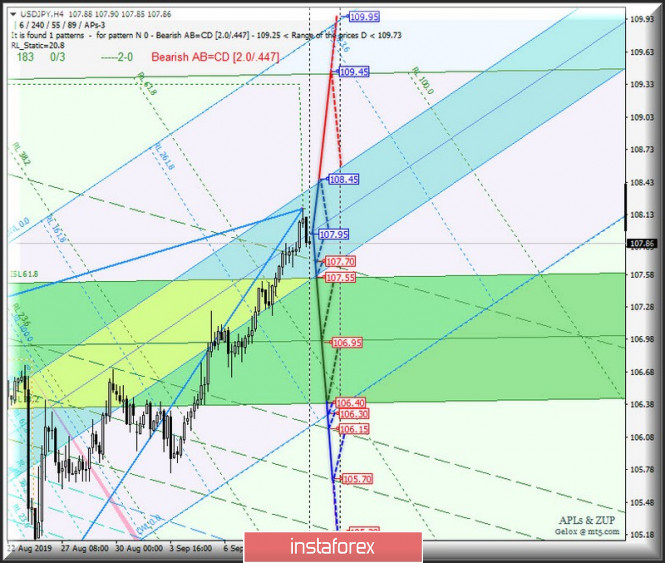
| Posted: 12 Sep 2019 06:29 PM PDT Let me bring to your attention a comprehensive analysis of the development options for the movement of the currency of the "land of the rising sun" USD / JPY and its cross-instruments EUR / JPY and GBP / JPY from September 13, 2019 Minuette operational scale (H4 timeframe) ____________________ US dollar vs Japanese yen The currency of the "country of the rising sun" in the equilibrium zone of the Minuette operational scale forks, respectively, the further development of the USD / JPY movement from September 13, 2019 will be due to the development and direction of the breakdown of the boundary levels (108.45 - 107.95 - 107.55) of this zone. Traffic markings are shown in the animated graphics. The breakdown of the support level of 107.55 at the intersection of the lower boundary of ISL38.2 of the Minuette operational scale forks and ISL61.8 Minuette will determine the development of the currency of the country of the rising sun in the equilibrium zone (107.55 - 106.95 - 106.40) of the Minuette operational scale forks with the prospect of reaching the starting line SSL Minuette (106.30) and channel of the 1/2 Median Line Minuette (106.15 - 105.70 - 105.20). In the case that the upper boundary of ISL61.8 is broken (resistance level of 108.45) equilibrium zone of the Minuette operational scale fork, the upward movement of USD / JPY can be continued to the final line FSL (109.45) of the Minuette operational scale forks. The details of the USD / JPY movement, depending on the breakdown direction of the above equilibrium zone, are shown in the animated chart. ____________________ Euro vs Japanese yen The development of the cross-instrument movement EUR / JPY from September 13, 2019 will be determined by the development and direction of the breakdown of the range :
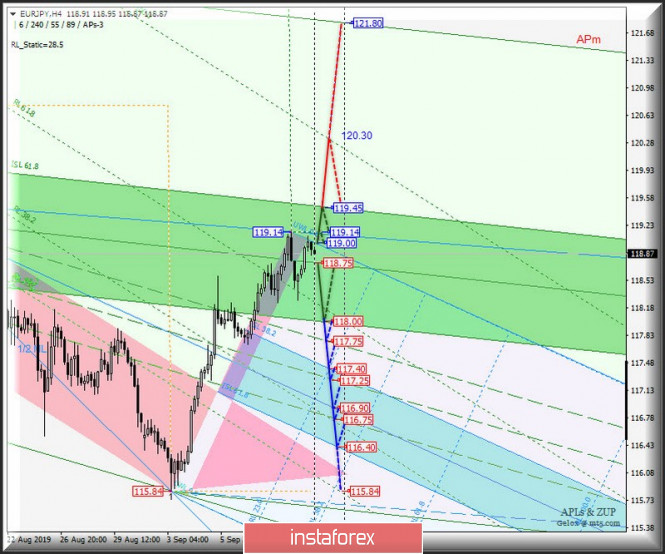
In case of the breakdown of the Median Line Minuette midline (support level of 118.75), the development of the EUR / JPY movement can continue towards the goals - the lower boundary of ISL38.2 (118.00) of the equilibrium zone of the Minuette operational scale forks - channel of the 1/2 Median Line Minuette (117.75 - 117.25 - 116.75) - equilibrium zone (117.40 - 116.90 - 116.40) of the Minuette operational scale forks. On the contrary, a combined breakdown of the resistance level of 119.00 on the initial SSL line of the Minuette operational scale forks and the control line UTL Minuette (119.14 - local maximum) will make the continuation of the upward movement development relevant to this cross instrument to the reaction line RL100.0 Minuette (120.30) with the possibility of reaching the final line FSL (121.80) of the Minuette operational scale forks. The details of the movement of EUR / JPY, depending on the development of the boundaries of this range, are presented in the animated chart. ____________________ Great Britain pound vs Japanese yen The development of the GBP / JPY cross-instrument movement from September 13, 2019 will also become determined by the direction of the breakdown of the range:
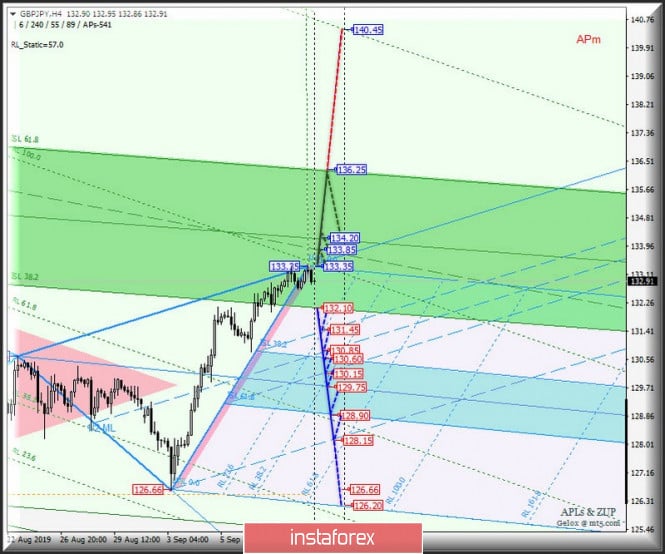
The breakdown of the lower boundary of ISL38.2 (support level of 132.10) of the equilibrium zone of the Minuettte operational scale forks - the development of the GBP / JPY movement to the boundaries of the 1/2 Median Line channel (131.45 - 130.85 - 130.15) and the equilibrium zone (130.60 - 129.75 - 128.90) of the Minuette operating scale fork with the prospect of reaching the ultimate Schiff Line Minuette (128.15). Meanwhile, updating the local maximum (resistance level of 133.35) with successive breakdown of the final Schiff Line (133.85) and the Median Line (134.70) of the Minuette operational scale fork will determine the continuation of the development of the upward movement of GBP / JPY to the upper boundary of the ISL61.8 (136.25) equilibrium zone of the Minuette operating scale fork with the prospect of reaching the reaction line RL161.8 Minuette (140.45). We look at the animated chart for the GBP / JPY movement options, depending on the breakdown direction of the above range. ____________________ The review is made without taking into account the news background. The opening of trading sessions of the main financial centers does not serve as a guide to action (placing orders "sell" or "buy"). The formula for calculating the dollar index: USDX = 50.14348112 * USDEUR0.576 * USDJPY0.136 * USDGBP0.119 * USDCAD0.091 * USDSEK0.042 * USDCHF0.036. where the power coefficients correspond to the weights of the currencies in the basket: Euro - 57.6%; Yen - 13.6% ; Pound Sterling - 11.9%; Canadian dollar - 9.1%; Swedish Krona - 4.2%; Swiss franc - 3.6%. The first coefficient in the formula leads the index to 100 at the start date of the countdown - March 1973, when the main currencies began to be freely quoted relative to each other. The material has been provided by InstaForex Company - www.instaforex.com |
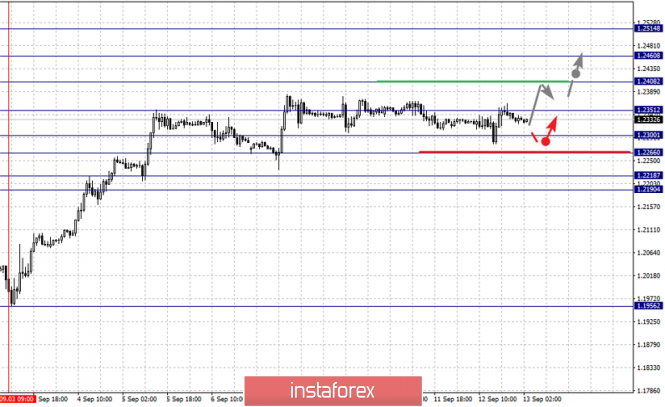
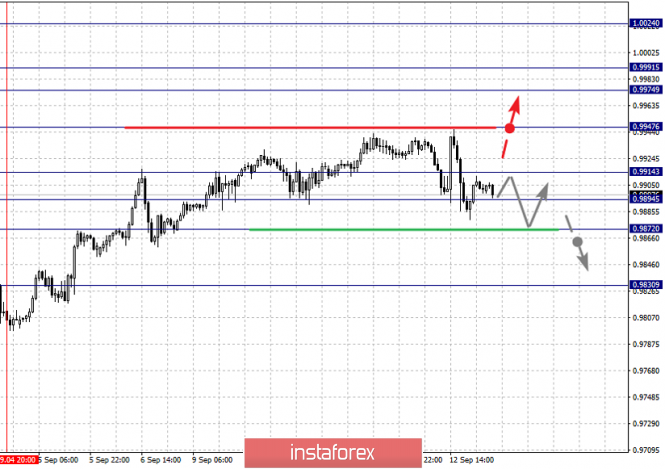
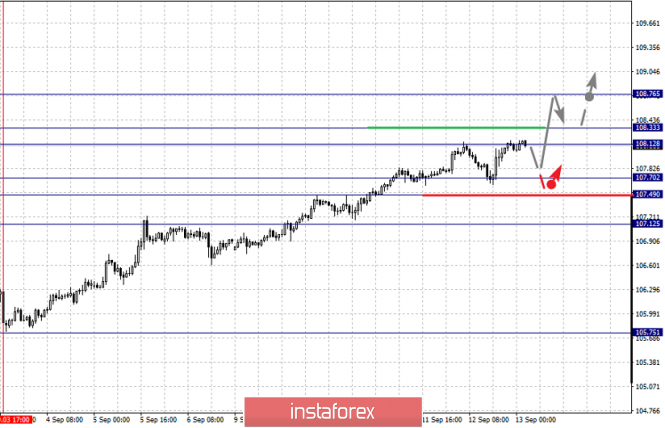
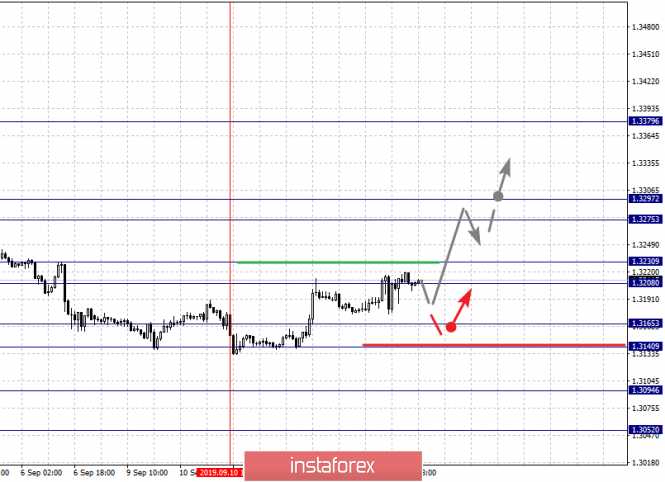
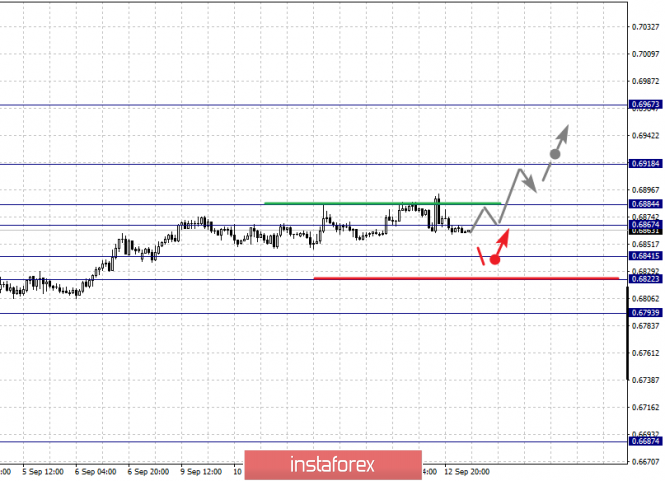
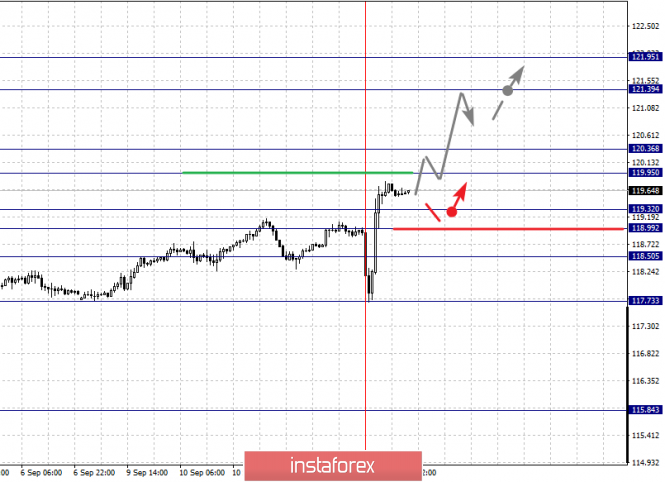
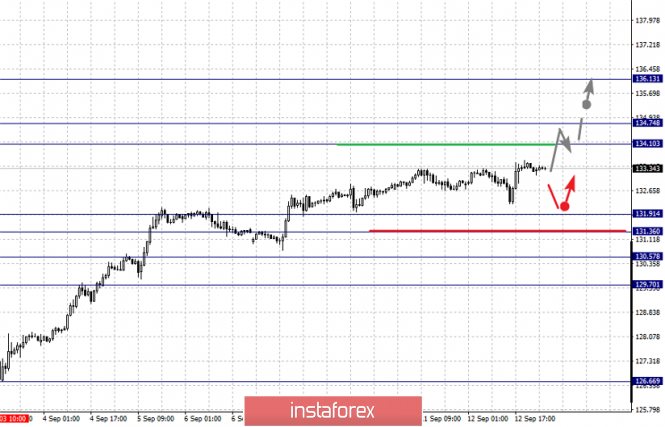
| Fractal analysis of the main currency pairs for September 13 Posted: 12 Sep 2019 06:05 PM PDT Forecast for September 13: Analytical review of currency pairs on the scale of H1: For the euro / dollar pair, the key levels on the H1 scale are: 1.1188, 1.1135, 1.1114, 1.1086, 1.1044, 1.1021 and 1.0987. Here, we determined the subsequent goals for the top from the local ascending structure on September 12. The continuation of the movement to the top is expected after the breakdown of the level of 1.1086. In this case, the target is 1.1114. Short-term upward movement, as well as consolidation is in the range of 1.1114 - 1.1135. For the potential value for the top, we consider the level of 1.1188. The movement to which, is expected after the breakdown of the level of 1.1135. Short-term downward movement is expected in the range of 1.1044 - 1.1021. The breakdown of the last value will lead to an in-depth correction. Here, the target is 1.0987. This level is a key support for the upward structure. The main trend is the local structure for the top of September 12. Trading recommendations: Buy: 1.1086 Take profit: 1.1114 Buy 1.1136 Take profit: 1.1186 Sell: 1.1044 Take profit: 1.1022 Sell: 1.1018 Take profit: 1.0989 For the pound / dollar pair, the key levels on the H1 scale are: 1.2460, 1.2408, 1.2351, 1.2300, 1.2266, 1.2218 and 1.2190. Here, we continue to monitor the development of the upward cycle of September 3. The continuation of the movement to the top is expected after the breakdown of the level of 1.2351. In this case, the target is 1.2408. The breakdown of which, in turn, will allow us to expect movement to the level of 1.2460, and upon reaching this level, we expect consolidation in the range of 1.2408 - 1.2460. For the potential value for the top, we consider the level of 1.2514. Upon reaching which, we expect a pullback to the bottom. Consolidated movement is expected in the range of 1.2300 - 1.2266. The breakdown of the latter value will lead to an in-depth correction. Here, the target is 1.2218. The range of 1.2218 - 1.2190 is the key support for the upward cycle. The main trend is the upward cycle of September 3. Trading recommendations: Buy: 1.2351 Take profit: 1.2406 Buy: 1.2409 Take profit: 1.2460 Sell: 1.2300 Take profit: 1.2268 Sell: 1.2264 Take profit: 1.2218 For the dollar / franc pair, the key levels on the H1 scale are: 1.0024, 0.9991, 0.9974, 0.9947, 0.9914, 0.9894, 0.9872 and 0.9830. Here, we are following the development of the ascending structure of September 4. At the moment, the price is in correction. The continuation of the movement to the top is expected after the breakdown of the level of 0.9947. In this case, the target is 0.9974. Price consolidation is in the range of 0.9974 - 0.9991. For the potential value for the top, we consider the level of 1.0024. Upon reaching this value, we expect a pullback to the bottom. Consolidated movement is expected in the range of 0.9914 - 0.9894. The breakdown of the latter value will lead to an in-depth correction. Here, the target is 0.9872. This level is a key support for the top. Its price movement should be accompanied by a pronounced downward movement. In this case, the potential target is 0.9830. The main trend is the ascending structure of September 4, the correction stage. Trading recommendations: Buy : 0.9948 Take profit: 0.9972 Buy : 0.9991 Take profit: 1.0024 Sell: 0.9892 Take profit: 0.9872 Sell: 0.9870 Take profit: 0.9835 For the dollar / yen pair, the key levels on the scale are : 108.76, 108.33, 108.12, 107.70, 107.49 and 107.12. Here, we follow the development of the ascending structure of September 3. Short-term upward movement is expected in the range of 108.12 - 108.33. The breakdown of the last value will lead to movement to a potential target - 108.76, when this level is reached, we expect a pullback to the bottom. Short-term downward movement is possibly in the range of 107.70 - 107.49. The breakdown of the last value will lead to an in-depth correction. Here, the goal is 107.12. This level is a key support for the top. Main trend: local upward structure from September 3. Trading recommendations: Buy: 108.12 Take profit: 108.30 Buy : 108.35 Take profit: 108.76 Sell: 107.70 Take profit: 107.50 Sell: 107.46 Take profit: 107.12 For the Canadian dollar / US dollar pair, the key levels on the H1 scale are: 1.3297, 1.3275, 1.3230, 1.3208, 1.3165, 1.3140, 1.3094 and 1.3052. Here, we follow the development of the downward structure of September 3. At the moment, the price is in correction and forms the potential for the top of September 10. After the price passes through the noise range 1.3208 - 1.3230, we expect the development of the ascending structure. In this case, the target is 1.3275. Price consolidation is in the range of 1.3275 - 1.3297. Short-term downward movement is possibly in the range of 1.3163 - 1.3140. The breakdown of the latter value will lead to the subsequent development of a downward trend. In this case, the first potential target is 1.3094. The main trend is the descending structure of September 3, the stage of deep correction. Trading recommendations: Buy: 1.3230 Take profit: 1.3275 Buy : 1.3275 Take profit: 1.3295 Sell: 1.3165 Take profit: 1.3143 Sell: 1.3138 Take profit: 1.3096 For the Australian dollar / US dollar pair, the key levels on the H1 scale are : 0.6967, 0.6918, 0.6884, 0.6867, 0.6841, 0.6822 and 0.6793. Here, we are following the development of the ascending structure of September 3. Short-term upward movement is expected in the range of 0.6867 - 0.6884. The breakdown of the latter value will lead to a movement to the level of 0.6918. Price consolidation is near this value. For the potential value for the top, we consider the level of 0.6967. Upon reaching this level, we expect a pullback to the bottom. Short-term downward movement is possibly in the range of 0.6841 - 0.6822. The breakdown of the last value will lead to a long correction. Here, the potential target is 0.6793. This level is a key support for the top. The main trend is the upward structure of September 3. Trading recommendations: Buy: 0.6886 Take profit: 0.6918 Buy: 0.6920 Take profit: 0.6965 Sell : 0.6840 Take profit : 0.6822 Sell: 0.6820 Take profit: 0.6795 For the euro / yen pair, the key levels on the H1 scale are: 121.95, 121.39, 120.36, 119.95, 119.32, 118.99, 118.50 and 117.73. Here, we determined the subsequent goals for the top from the local ascending structure on September 12. Short-term upward movement is expected in the range of 119.95 - 120.36. The breakdown of the last value should be accompanied by a pronounced upward movement. Here, the target is 121.39. For the potential value for the top, we consider the level of 121.95. Upon reaching which, we expect consolidation, as well as a pullback to the bottom. Short-term downward movement is expected in the range of 119.32 - 118.99. The breakdown of the latter value will lead to an in-depth correction. Here, the goal is 118.50. This level is a key support for the upward structure. The main trend is the local structure for the top of September 12. Trading recommendations: Buy: 119.95 Take profit: 120.34 Buy: 120.40 Take profit: 121.30 Sell: 119.32 Take profit: 119.00 Sell: 119.95 Take profit: 118.50 For the pound / yen pair, the key levels on the H1 scale are : 136.13, 134.74, 134.10, 131.91, 131.36, 130.57 and 129.70. Here, we continue to monitor the development of the upward cycle of September 3. At the moment, we expect movement to the level of 134.10. Short-term upward movement, as well as consolidation is in the range of 134.10 - 134.74. For the potential value for the top, we consider the level 136.13. Upon reaching which, we expect a pullback to the bottom. Short-term downward movement is possibly in the range of 131.91 - 131.36. The breakdown of the last value will lead to an in-depth correction. Here, the target is 130.57. This level is a key support for the upward structure. Its passage in price will lead to the formation of a downward structure. Here, the potential target is 129.70. The main trend is the upward structure of September 3. Trading recommendations: Buy: 132.96 Take profit: 134.10 Buy: 134.10 Take profit: 134.72 Sell: 131.90 Take profit: 131.36 Sell: 131.34 Take profit: 130.58 The material has been provided by InstaForex Company - www.instaforex.com |
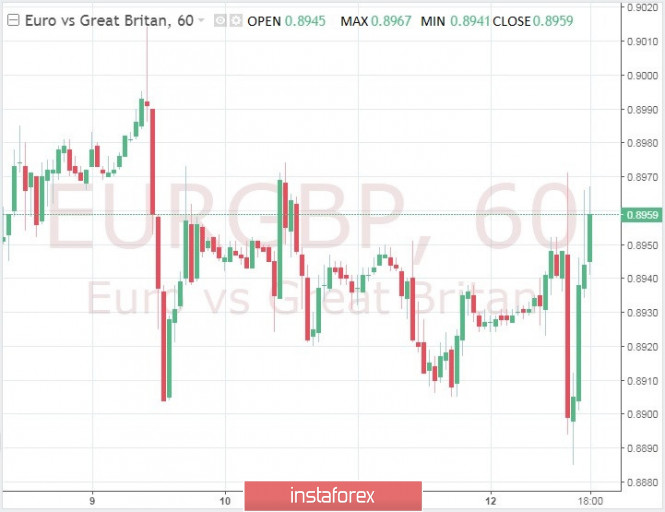
| EUR/GBP returns to growth, pound lacks good news Posted: 12 Sep 2019 04:43 PM PDT A Scottish court ruled that the suspension of Parliament was unlawful and the uncertainty exacerbated the GBP. The EUR/GBP pair returns to the level of 0.8940 after three consecutive sessions of decline. Returning to the political situation in the UK, one should take into account the forecasts, which set out several worst-case scenarios in the event of the hard version of Brexit at the end of October. Analysts emphasize the high likelihood of riots, rising food prices and shortages of medical supplies. On the other hand, the euro also cannot find support. The German Consumer Price Growth Index is likely to fall by 0.2 percent in August compared with July and grow by 1.4 percent year on year. Additional data indicate a decrease in industrial production in the eurozone in July by 0.4 percent compared with the previous month and by two percent year on year, which is below market expectations. The sale of the British pound also caused a slight downward correction after recent positive results. Sterling will remain under scrutiny, as political pressure has not subsided, and the issue with Brexit has not been resolved. Now everyone is looking at the events taking place in the political arena of Great Britain during the period of "inaction" of the Parliament, which will begin its work in mid-October, it is expected that the queen will personally deliver a speech. At the same time, we remember that the Bank of England recently ruled out "negative interest rates" and expressed its opinion about the "likelihood of a recession in the country." The material has been provided by InstaForex Company - www.instaforex.com |
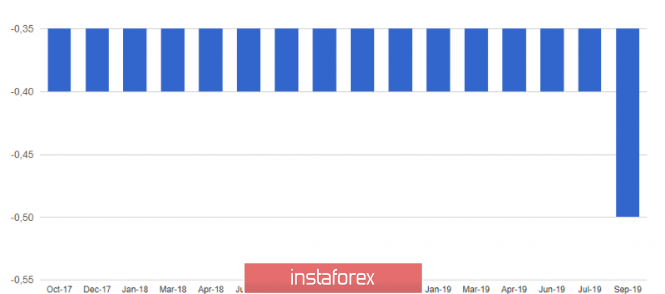
| Posted: 12 Sep 2019 04:38 PM PDT The clouds, gathering over the market in anticipation of the ECB meeting, erupted in thunder in the form of a reduction in interest rates and the introduction of a new policy of quantitative easing. A similar scenario was expected, but pulled down the European currency, analysts say. After the meeting of the European regulator, the euro plunged, and bonds rose after the announcement of a reduction in interest rates and the introduction of a new program of quantitative easing to support the weakened economy of the region. As a result, the single European currency was around a two-year low. The reason for this was the decision to reduce interest rates to -0.50% and resume the program for the purchase of bonds in the amount of €2.6 trillion in November 2019 at a rate of €20 billion per month. Another decision of the regulator was the introduction of a two-level system of negative rates. Less than a year ago, the ECB completed a €2.6 trillion quantitative easing program. The regulator made it clear that by the end of 2019 it will raise interest rates. Since then, the ECB has changed the direction of monetary policy, as well as several other central banks. The main goal of the monetary policy of the European regulator is to maintain inflation in the eurozone slightly below 2%. The bank has not been able to achieve this goal since 2013. Inflation in the eurozone amounted to 1% in August 2019. This is the lowest value since the end of 2016, experts emphasize. In addition, the European regulator lowered deposit rates from a record low of -0.4% to -0.5%. Experts are wary of such a decision, since a decrease in the deposit rate may lead to a short-term strengthening of the euro against the dollar to 1.11–1.12. In the future, the nearest reference point for the euro will be the mark of 1.08 to the US dollar, experts predict. This is possible after the Federal Reserve cuts rates after the meeting scheduled for September 18. After the ECB meeting, the European currency may end the week below the $1.1 mark against the greenback, according to strategists at Nordea Bank. Since the leadership of the ECB began to signal a weakening monetary policy, the euro/dollar has fallen by 3.5%. To date, the single European currency has fallen by 0.42%. It trades between $1.0959–$1.0960. Analysts admits that the euro could further fall against the dollar. According to experts, this month the euro reached its lowest level in the last two years. The ECB meeting confused the cards to market participants and left them in suspense regarding the further dynamics of the EUR/USD pair. Uncertainty remains in the market, since it is not known what the new easing of the monetary policy of the regulator will bring for the euro. The material has been provided by InstaForex Company - www.instaforex.com |
| EUR/USD. "Bear feast" cancelled: the ECB disappointed sellers of the pair Posted: 12 Sep 2019 04:21 PM PDT The proposition "buy on the rumor, sell on the news" summed up many EUR/USD traders today. It turned out the other way around: over the past few days, the pair has been selling on rumors of a large-scale easing of the ECB's monetary policy, and after the news, the euro then updated its high of the day and week. This situation confirms another notorious fact: anything can happen in the market, and even the most recognized algorithms sometimes fail. However, so far it is only a short-term reaction of traders. There is no talk of any turning point in the trend, since the price has remained in the same positions as all previous days. If you do not take into account the 150-point price fluctuation, then we can say that the September meeting of the ECB did not affect the value of the pair. Of course, this fact looks anomalous, since all the decisions and theses voiced at today's meeting were against the euro. Perhaps, with one exception: Mario Draghi did not announce a further reduction in the interest rate. In other words, the entourage of previous events played a key role today. Representatives of the ECB, all kinds of experts, analysts, currency strategists and the successor of Mario Draghi - Christine Lagarde - all of them have been aggravating the situation for several weeks, preparing the market for large-scale easing of monetary policy parameters. The European Central Bank as a whole met the expectations of the market by lowering the interest rate by 0.1% and announcing the resumption of QE from November 1 by 2.6 trillion euros with a monthly volume of 20 billion euros. But, as you know, "appetite comes with eating": market participants were ready for more drastic measures (lowering rates to -0.60%, and QE with a monthly volume of 40-50 billion). At least on the eve of today's meeting, precisely these values were discussed among experts (which, in fact, was responsible for the downward impulse of EUR/USD at the beginning of this week). Therefore, when the central bank announced its decision, the pair fell to the bottom of the 9th figure on emotions. Then the price bounced back - when it became clear that the regulator, firstly, didn't use the arsenal of available tools "to the fullest", and secondly, it made it clear that it did not intend to take the interest rate further into the negative area for the foreseeable future. A similar situation was seen in December 2015. Back then, the European regulator abandoned the idea of using shock therapy, focusing on the option of a gradual and longer-term effect. In exactly the same way as now, four years ago, everyone was expecting and discussing the rate reduction during the previous several months. They also spoke with the same confidence about the expansion of the stimulating program: opinions differed only with regard to the size of the increase. However, the regulator only reduced the rate and did not resort to large-scale integrated measures. Moreover, Draghi made it clear that the ECB will not return to the issue of easing monetary policy for at least several months, giving the European economy time to recover. After this meeting, the EUR/USD pair rebounded and strengthened by 300 points, although many predicted the euro collapse. Now the situation is somewhat different. On the one hand, Mario Draghi is unlikely to initiate and support the issue of further easing of monetary policy - at least until November. But his cadence ends in the last month of autumn, so the ECB's further steps will largely depend on Lagarde, who has already announced that the monetary policy is adaptive "in the foreseeable future", and the nature of the regulator's further actions will depend on the conditions of the financial market . She also said that she "does not believe" that the central bank has set an effective lower limit for interest rates. In other words, the future head of the ECB fairly transparently hinted at an acceptable backlash in this matter. This means that, hypothetically, the European regulator may not be limited to one round of lowering rates further into the negative area. That is why the reaction of the EUR/USD bulls to the results of the September meeting is relatively limited. I can assume that if it were not for the "Lagarde factor", then the pair would be at least in the middle of the 11th figure, and maybe it would test more significant price heights. But for now, EUR/USD is trying to overcome only the middle line of the Bollinger Bands indicator on the daily chart, which corresponds to the mark of 1.1060. If the bulls consolidate on this target, then the price will be the second resistance level of 1.1150 - this is the upper line of Bollinger Bands, which coincides with the lower boundary of the Kumo cloud on the same timeframe. In general, the next critical "test" for the pair will take place next week, when the September meeting of the Federal Reserve will take place. If the members of the US regulator, in contrast to the ECB, exceed the "dovish" expectations of investors, then the large-scale correction will be continued - up to 12-13 figures. The material has been provided by InstaForex Company - www.instaforex.com |
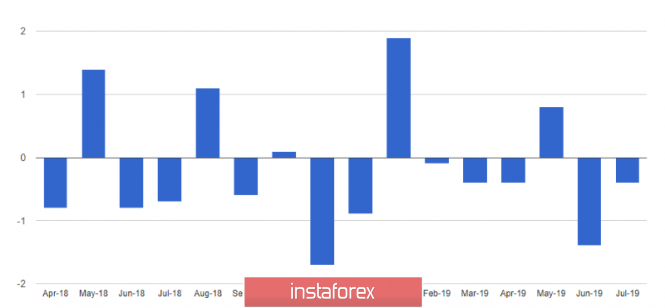
| Posted: 12 Sep 2019 04:10 PM PDT Today it became known that the European Central Bank lowered the rate on deposits, in order to return to the necessary inflationary growth, which has recently caused serious concern for the regulator. Thus, the European Central Bank lowered the deposit rate to -0.5% from -0.4%, but left the refinancing rate unchanged at 0.0%. This decision was quite expected, but the ECB said that rates would remain at current or lower levels at least until inflation starts to meet the target level. In other words, even in the long term, until inflation returns to around 2.0%, no one will even understand the topic of raising interest rates. This, of course, is a strong bearish signal for holders of risky assets. More pressure on the euro was created after the regulator announced that it would restart its bond purchasing programme, which few market participants expected. The ECB was not expected to rush, but confine itself to stimulating the economy through low interest rates. As it became known today, asset purchases will be resumed in November of this year, and the ECB will buy bonds worth 20 billion euros per month, while this is necessary. TLTRO terms will also be amended to support lending. TLTRO operations will be carried out at a refinancing rate, but the ECB will propose measures to mitigate the negative impact on eurozone banks. Here we are talking about the quite expected system of a differentiated approach to interest rates in order to provide some exemptions for commercial banks, since risks due to negative interest rates, load and reduction in profits can negatively affect the financial system. Thus, the ECB said that for banks that lend above the target level, TLTRO will be offered at a rate corresponding to the rate on deposits. The data released in the morning on the state of the European economy further complicated the task for the European Central Bank. According to the report, the largest eurozone economy can expect a recession. At Ifo, the German institute on Thursday lowered German GDP growth forecasts for 2019 and 2020. According to the data, German GDP growth in 2019 will be equal to 0.5%, whereas earlier the economy was expected to increase by 0.6%. In 2020, economists expect growth of only 1.2% against the previous forecast of 1.7%. Revision of forecasts is directly related to the weakness of the manufacturing sector. Immediately after this report, data were released on the industrial production of the eurozone, which sharply fell by 0.4% in July this year and fell by 2.0% compared to the same period in 2018. Economists predicted a decline in production of only 0.1% and 1.1%, respectively. In June, industrial production was revised to -1.4%. In a CNBC interview today, US Treasury Secretary Stephen Mnuchin reiterated that he really looks forward to progress in the course of trade negotiations with China over the next two weeks, as Donald Trump is now ready to raise duties and introduce new ones. Mnuchin once again noted that the United States wants China to buy American agricultural products, and also retreated from manipulating foreign exchange rates. The US Treasury Secretary also commented on today's decision of the European Central Bank, saying that it is not surprised that the European regulator lowered rates, as it is obvious that the European economy has slowed significantly. As for the technical picture of the EURUSD pair, the breakthrough of the large support 1.0990 led to the formation of a new bear market, the purpose of which will be the lows of this year around 1.0925 and their update, which will allow sellers of risky assets to approach the levels of 1.0900 and 1.0840. The material has been provided by InstaForex Company - www.instaforex.com |
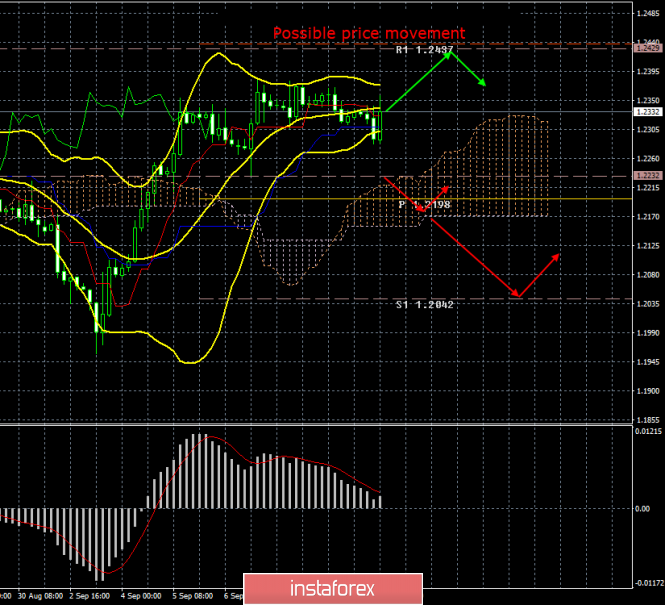
| Posted: 12 Sep 2019 03:57 PM PDT 4-hour timeframe Amplitude of the last 5 days (high-low): 144p - 65p - 151p - 73p - 58p. Average volatility over the past 5 days: 98p (high). The EUR/USD currency pair had a very fun day today, which has not yet ended. If you look at the GBP/USD pair's chart for today's movement, you get the impression that nothing interesting has happened in the UK and the United States. However, this is not the case. Firstly, we already wrote in another article that the consumer price index in the US unexpectedly failed in August and amounted to only +1.7% y/y. What does it mean? the fact that inflation is slowing down and is moving further from the target level of the Federal Reserve, and also the fact that at its next meeting, which will be held on September 17-18, it will most likely take this slowdown into account and also lower the key rate. Against the background of this report and the considerations associated with it, the pound has grown in the US trading session. However, all the most interesting events were again associated with Brexit. Either Boris Johnson had not yet managed to send a second letter to Brussels, in which he wanted to ask EU leaders NOT to grant UK deferment for Brexit, or EU leaders simply ignored Johnson's request, however, European Parliament President David Sassoli said that the EU is ready to grant an extension to the UK, if it helps to avoid the "hard" Brexit or helps to hold parliamentary elections in the UK. However, Sassoli emphasized, an agreement on Brexit is still impossible without a "back-stop" clause. In principle, if the European Parliament does provide a respite until January 31, this will mean the fifth consecutive defeat of Boris Johnson. Earlier, the British Parliament blocked the hard Brexit without its consent (1), twice rejected the prime minister's offer to hold parliamentary re-elections (2 and 3), after which the Scottish court ruled that Johnson's decision to send deputies for vacation was illegal (4). The European Parliament can now approve the Brexit postponement, at least showing its readiness for this (5). This is certainly good news for the pound, since all of Boris Johnson's policy, all his actions were aimed at the speedy implementation of the hard Brexit, to which the pound reacted negatively. Now, when Boris Johnson suffers one defeat after another, the pound is resurrected before the eyes, as the chances of delaying the hard Brexit are growing, and given the general dissatisfaction with Johnson's actions in Parliament and in the European Union, one can safely count on the adoption of a vote of no confidence in the prime minister is coming soon. First you need to wait for the Supreme Court to issue an official ruling on the annulment of Johnson's decision on the forced vacation of MPs until October 14. And after that, the second stage of the Parliament's war against its prime minister will begin, the goal of which will undoubtedly be the displacement of Boris Johnson from his position. Perhaps this is a bit of a bold assumption, but what other goals should the Parliament set up, which is waging an open war against a politician who is trying hard to implement a scenario that is destructive for the country? From a technical point of view, the pound/dollar pair failed to consolidate below the critical line and the US inflation report arrived in time. Thus, the upward trend has continued and in the near future the British currency may continue to grow. Trading recommendations: The GBP/USD currency pair remains within the upward trend, therefore long positions remain relevant with the target level of 1.2429, obtained based on the average volatility of the pair. To open them, it is recommended to wait until the MACD indicator turns up or the price rebounds from the Kijun-sen critical line (it may take place on the current bar). Small pound sales can be seen below the Kijun-sen line with the first targets of 1.2232 and Senkou Span B line. In addition to the technical picture, fundamental data and the time of their release should also be taken into account. Explanation of the illustration: Ichimoku indicator: Tenkan-sen is the red line. Kijun-sen is the blue line. Senkou Span A - light brown dotted line. Senkou Span B - light purple dashed line. Chikou Span - green line. Bollinger Bands Indicator: 3 yellow lines. MACD indicator: Red line and bar graph with white bars in the indicator window. The material has been provided by InstaForex Company - www.instaforex.com |
| EUR/USD. September 12. Results of the day. A crazy day for the euro currency Posted: 12 Sep 2019 03:39 PM PDT 4-hour timeframe Amplitude of the last 5 days (high-low): 68p - 37p - 52p - 29p - 70p. Average volatility over the past 5 days: 51p (average). In order to describe all the events of today, after which the EUR/USD currency pair, which usually shows very modest volatility (50-60 points per day), crashed down by 100 points and then grew by 100 points at the same rate, you will need three articles. However, we will try to consider all the events of Thursday, September 12, in one. The day began very expectedly, with the publication of a report on industrial production in the European Union, which showed a decrease of 2.0% y/y, instead of the forecast -1.3%. In monthly terms, industrial production decreased by 0.4%. Given the failed indexes of business activity in the manufacturing sector in recent months, nothing surprising has happened. Furthermore, all the attention of traders was focused on the results of the ECB meeting and the press conference of the head of regulator Mario Draghi. It all started again as expected. The European Central Bank lowered the deposit rate by 0.1% and now it is at -0.5%. The interest rate on loans remained unchanged at 0.0%. The regulator announced the restart of the quantitative easing program in the amount of 2.6 trillion euros, which will begin its operation in November 2019. Each month, the ECB will buy back securities worth 20 billion euros. The central bank's release also notes that the asset repurchase program will remain in effect until the regulator makes sure that interest rates begin to positively affect the economic situation and ends shortly before the start of the key interest rate hike. By and large, this means that the program will last a very long time, possibly several years. However, this is far from the most interesting. Along with the start of the press conference, Mario Draghi released a report on inflation in the United States, which unexpectedly for many is below forecast values. The consumer price index in August is only +1.7% YoY (against expectations of traders +1.8%), which causes a wave of disappointment and massive euro sellofs opened just 30-40 minutes ago, started to close. Around the same time, Donald Trump went on the air, who seemed to be following the ECB's decision with no less interest than the entire community of Forex traders. In his Twitter account, the US president wrote: "They (the European Union) are trying and succeeding, in depreciating the euro against a VERY strong dollar, hurting U.S. exports... And the Fed sits, and sits, and sits. They get paid to borrow money, while we are paying interest!". It's easy to guess into whose garden the next cobblestone of Donald Trump flew ... To understand how fast Trump's reaction to the results of the ECB meeting was, it should be simply noted: there was about 45 minutes between the publication of the rate decision and the beginning of Mario Draghi's press conference. During his speech, Mario Draghi fended off (!!!) Trump's accusations, saying that the ECB does not intend to devalue the European currency. Mario Draghi also said that the likelihood of a recession is low, and negative interest rates have helped to achieve many positive effects. At the end of his speech, the ECB chairman announced a decrease in GDP forecasts for 2019 (from +1.2% to +1.1%) and for 2020 (from +1.4% to +1.2%). What can be said about all these events? The ECB has taken the exact steps that were expected of it: it softened monetary policy and resumed the program of stimulating the economy. Traders just did not know what volumes of monthly repurchase of securities will be discussed and when the program will begin to operate. The fact that the ECB has lowered its forecasts for GDP is also not surprising, given the state of its economy, which forces the ECB to lower already ultra-low rates. The fall of the euro is an absolutely logical reaction of the market. The further rise of the euro currency is a gift from America for the next holiday, since it is the failed inflation, due to which the Federal Reserve is now almost guaranteed to lower its rate and this saved the euro/dollar pair from updating two-year lows, to which only one point remained. Now you need to wait until the passions in the market calm down, as strong movements within a few hours "knocked down" all the technical indicators. Trading recommendations: The EUR/USD pair has shown enviable volatility for today. However, it is recommended not to open new positions today, since technical indicators (Bollinger Bands and Ishimoku) show an ambiguous picture due to overly strong movements. In addition to the technical picture, fundamental data and the time of their release should also be taken into account. Explanation of the illustration: Ichimoku indicator: Tenkan-sen is the red line. Kijun-sen is the blue line. Senkou Span A - light brown dotted line. Senkou Span B - light purple dashed line. Chikou Span - green line. Bollinger Bands Indicator: 3 yellow lines. MACD indicator: Red line and bar graph with white bars in the indicator window. The material has been provided by InstaForex Company - www.instaforex.com |
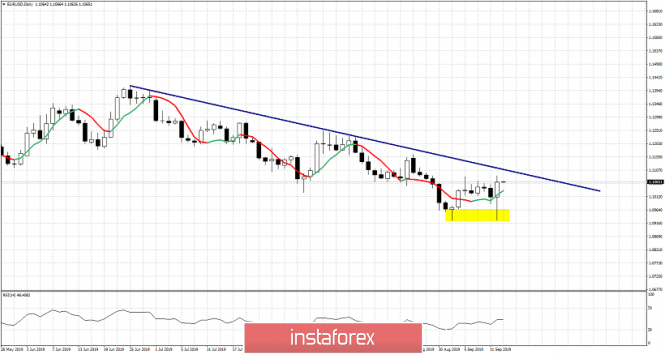
| EURUSD makes major double bottom Posted: 12 Sep 2019 02:34 PM PDT EURUSD was quiet nervous today as price opened above 1.10, fell as low as 1.0926 and then closed near 1.1063. With a double bottom at 1.0926 and a big positive daily candlestick, bulls look ready to break the resistance.
Yellow rectangle - support double bottom EURUSD is still below the blue trend line resistance. As long as this is the case then price is vulnerable to turning lower. Breaking above the resistance trend line will be a very bullish signal for EUR and could push price above 1.12-1.13.
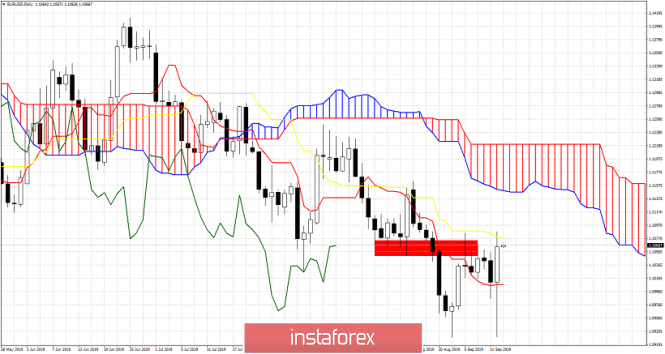
EURUSD is challenging the 1.1080-1.1090 resistance area. This is where we also find the kijun-sen (yellow line indicator). A daily close above the kijun-sen will push price towards the cloud resistance at 1.1150. Support by the tenkan-sen (red line indicator) at 1.10. The material has been provided by InstaForex Company - www.instaforex.com |
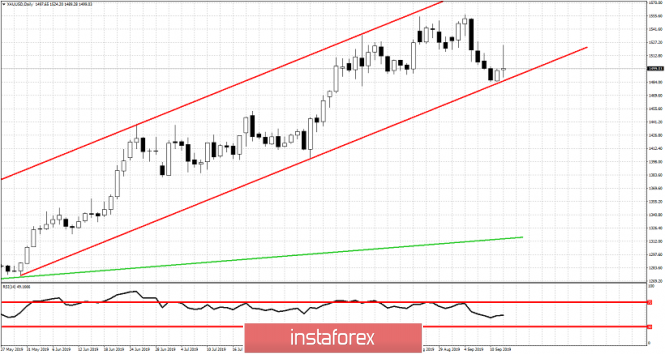
| Gold gets rejected at important short-term resistance Posted: 12 Sep 2019 02:25 PM PDT In our last analysis, we expected Gold price to bounce and maybe start a new upward move that could bring us to new 2019 highs. However for this scenario to happen we noted that a certain resistance would have to break first. I said that the bullish scenario would strengthen with a break above $1,520. Unfortunately for bulls price slightly moved above this level today but got rejected as sellers pushed price below $1,500 again. This was a sign of weakness.
Green line - major support trend line Gold price remains inside the bullish channel. However the daily candlestick pattern is a bearish one, not giving much hope for any upside. The long upper tail confirms that sellers were stronger today and usually after such days, we expect a follow through, in this case more downside.
|
| September 12, 2019 : EUR/USD Intraday technical analysis and trade recommendations. Posted: 12 Sep 2019 10:24 AM PDT
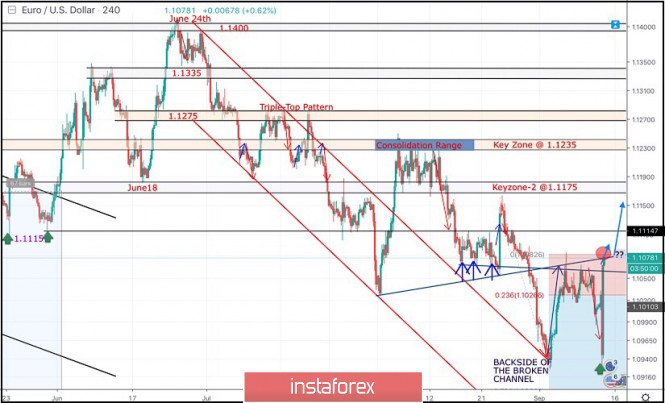
In Mid-August, the EUR/USD has been trapped between 1.1235-1.1175 for a few trading sessions until bearish breakout below 1.1175 occurred on August 14. Bearish breakout below 1.1175 promoted further bearish decline towards 1.1075 where the backside of the broken bearish channel has provided temporary bullish demand for sometime (Bullish Triple-Bottom pattern). Bullish persistence above 1.1115 was needed to confirm the short-term trend reversal into bullish. However, the depicted Triple-Bottom pattern was invalidated especially after the EURUSD pair bulls have failed to establish Bullish persistence above 1.1115. Moreover, the recently established short-term uptrend line has been invalidated as well thus rendering the short-term outlook as bearish. Two weeks ago, a quick bearish decline was demonstrated towards 1.0965 - 1.0950 where the backside of the broken channel came to meet the EURUSD pair again. Risky traders were advised to look for a valid BUY entry anywhere around the price levels of 1.0950. All T/p levels were successfully reached within the recent bullish movement during last week's consolidations. Earlier this week, the EUR/USD pair was testing the backside of both broken trends around 1.1060-1.1080 where significant bearish pressure pushed the pair directly towards 1.0940 (Prominent Weekly Bottom). Bearish Breakdown below the price level of 1.0940 was needed to enhance further bearish decline towards 1.0900 and 1.0840 (Fibonacci Expansion Key-Levels). However, SIGNIFICANT bullish rejection is being demonstrated as a quick bullish spike towards 1.1080 where cautious watching of price action should be done. Bullish breakout above 1.1080 gives an early signal of short-term bullish reversal possibility as a bullish double-bottom pattern with a projected target towards 1.1175. The material has been provided by InstaForex Company - www.instaforex.com |
| September 12, 2019 : GBP/USD Intraday technical analysis and trade recommendations. Posted: 12 Sep 2019 10:01 AM PDT
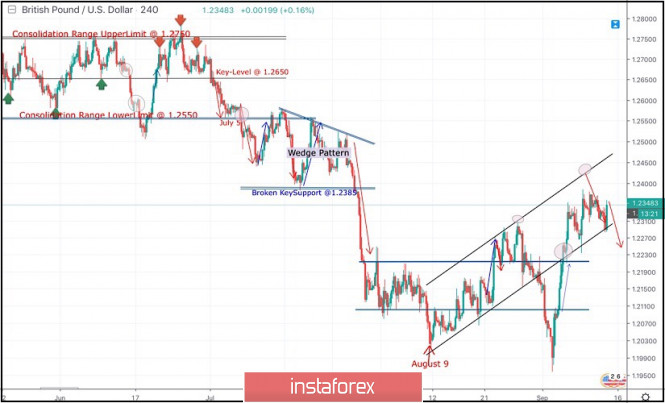
On July 26, Bearish breakdown below 1.2385 (Wedge-Pattern Key-Level) facilitated further bearish decline towards 1.2210 and 1.2100 which corresponded to significant key-levels on the Weekly chart. In Early August, another consolidation-range was temporarily established above 1.2100 before August 9 when temporary bearish movement was executed towards 1.2025 (Previous Weekly-Bottom). Recent bullish recovery was demonstrated off the recent bottom (1.2025). This brought the GBP/USD pair back above 1.2100 (Lower limit of the recently established consolidation-zone) within the depicted short-term bullish channel. As expected, further bullish advancement was demonstrated towards 1.2230 then 1.2280 where recent bearish rejection was demonstrated (near the upper limit of the recent movement channel). That's why, another quick bearish decline was demonstrated towards 1.2100 then 1.2000 (corresponding to the previous bottom established on August 9). Last Week, Early signs of bullish recovery (Bullish Engulfing candlesticks) were manifested around 1.1960 bringing the GBPUSD back above 1.2100 and 1.2220 where the GBPUSD pair looked overbought. However, further bullish momentum was demonstrated towards 1.2320 bringing the pair back inside the depicted movement channel again. The Long-term outlook remains bearish as long as the upper limit of the current movement channel around 1.2400 remains defended by the GBPUSD bears. Temporary bullish advancement may be demonstrated towards 1.2400 - 1.2420 where the upper limit of the current movement channel comes to meet the pair. On the other hand, early bearish breakdown below 1.2270 can turn the short-term outlook into bearish, thus allowing more bearish decline towards 1.2220 and 1.2100. Trade Recommendations: Conservative traders should wait for a bearish breakout below 1.2270 for a valid SELL entry. T/P level to be placed around 1.2250, 1.2220 and 1.2110 while S/L should be placed above 1.2350. The material has been provided by InstaForex Company - www.instaforex.com |
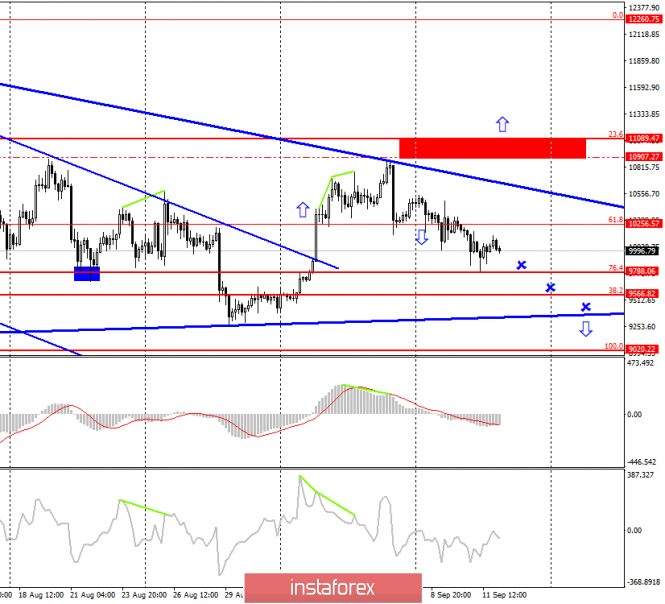
| BTC 09.12.2019 - Important short-term resitance on the test at $11,400, watch for sell opportunities Posted: 12 Sep 2019 09:36 AM PDT Bitcoin 4H time-frame:
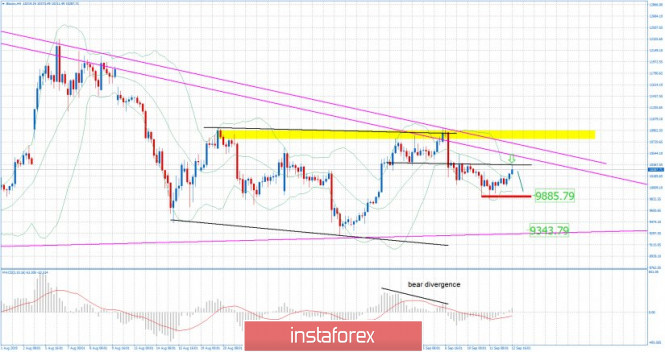
MACD oscillator on the 4H is not showing any new momentum up on the recent rally, which is sign of the weak buying. Important resistance at the price of $10,400 is on the test and you should be careful with long positions. I didn't find any reaction after the ECB meeting today, which is indication that no institutional money is involved into Bitcoin for now. Bitcoin Forecast and recommendations for traders: Bitcoin is in overall consolidation phase but most recently I found weak bullish momentum on the MACD oscillator, which is sign that there is chance for more downside and potential of $9,855 or $9,350. Thus, I recommend selling cryptocurrency with the first target at $9,855.The material has been provided by InstaForex Company - www.instaforex.com |
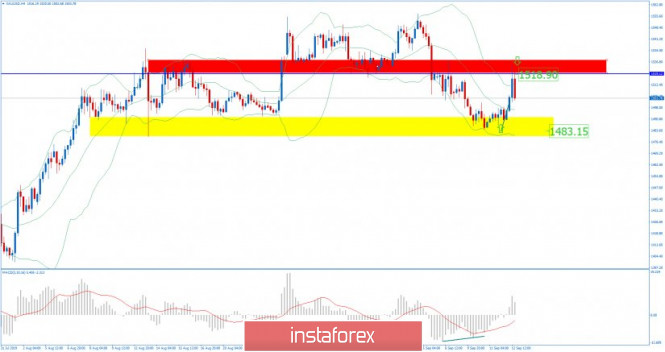
| Gold 09.12.2019 - Strong rejection of the resistance cluster at $1,518, more downside yet to come Posted: 12 Sep 2019 08:50 AM PDT Gold did exactly what I expected yesterday and our upward target at the price of $1,518 has been reached. I found strong reaction from sellers of the key resistance at $1,518, which is sign that new down wave is possible and re-test of $1,483.
Red rectangle – Resistance cluster Yellow rectangle – Support cluster Gold got rejected of the strong resistance and there is chance for more downside. Test of the $1,483 is very likely to happen. The Gold is trading below two major levels. Support is seen at the price of $1,483 and resistance at $1,518. If the Gold breaks the level of $1,483, next downward level will be at $1,458. I wouldn't watch for long positions as long as the Gold is trading below the $1,520. The material has been provided by InstaForex Company - www.instaforex.com |
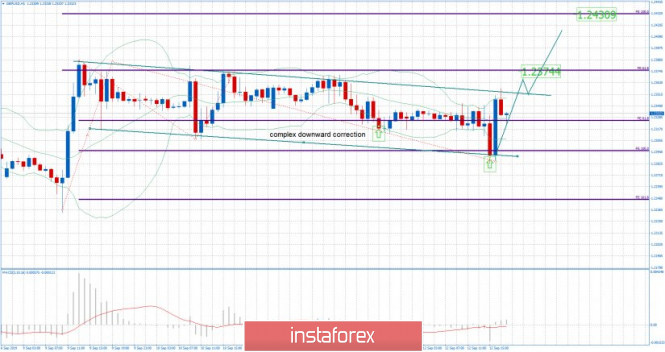
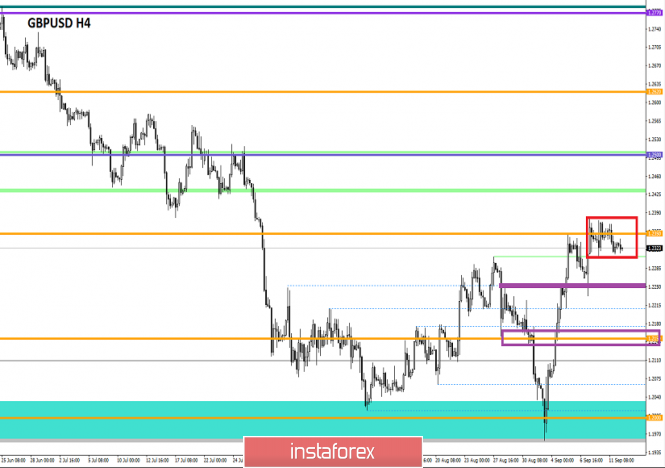
| GBP/USD 09.12.2019 - End of the downward correction and potential new bullish wave Posted: 12 Sep 2019 08:42 AM PDT GBP did exactly what I expected yesterday. The price went to test major support at the level of 1.2295 and found aggressive buyers, which is strong side for further upside movement. I still expect further upside and end of the downward correction.
Green lines – Corrective channel Purple horizontal lines – Resistance levels and upward targets GBP is in complex corrective structure in my opinion and there is still chance for more upside. The momentum from September 9 is still active and it just question of the time when the new buyers will join and that upward movement will continue. Resistance levels are seen at 1.2375 and 1.2430. Major short term support level is set at 1.2295. MACD oscillator is not important at this point when GBP is correcting but it is going higher on the hourly time-frame. The material has been provided by InstaForex Company - www.instaforex.com |
| Different scenarios for EUR/USD pair following an important ECB meeting Posted: 12 Sep 2019 06:26 AM PDT The EUR/USD will not budge ahead of the ECB meeting. Markets expect a 10 bp cut in rates and restarting the quantitative easing program. The pair is trading in a tapering triangle, or wedge. Technical analysis suggests that high volatility will replace a narrow trading range when the pair determines its direction. Where will she go? Most indicators indicate a decline. Support is expected at 1.0985, followed by 1.0960 and then 1.0926. If we talk about growth, then the resistance is expected at 1.1055, then 1.1090 and 1.1115. On the whole, there is tension in the market, everyone is waiting for the speech of the head of the ECB, Mario Draghi, who will introduce new measures to combat the slowdown in economic growth and inflation. According to one version, the ECB intends to reduce interest rates by at least 10 bp, and, most likely, this will confirm obligations to maintain low-interest rates. In this case, EUR/USD may jump. The ECB hawks speak in favor of this scenario, and if they win, then the EUR/USD bulls will also win. On the other hand, the Board of Governors may reduce rates by 20 bp, as well as resume the bond purchase program with a budget of 30-50 billion euros. This will cause the pair to fall. The ECB must act in response to worsening economic conditions. Inflation remains low, with the underlying CPI dropping below 1%. Germany's economy contracted in the second quarter, and third quarter indicators point to another recession, which is a clear recession. Eurozone suffers due to weak demand from China and trade wars. Nevertheless, the most recent events have been positive. The US President Donald Trump postponed the introduction of new tariffs and China allowed companies to buy American agricultural products. These goodwill gestures precede high-level negotiations and help ease market tensions. |
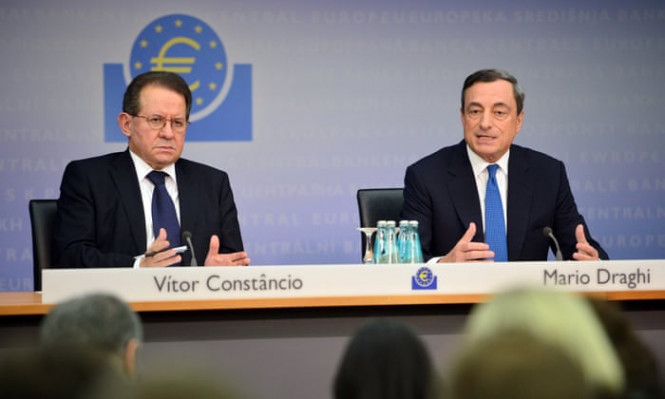
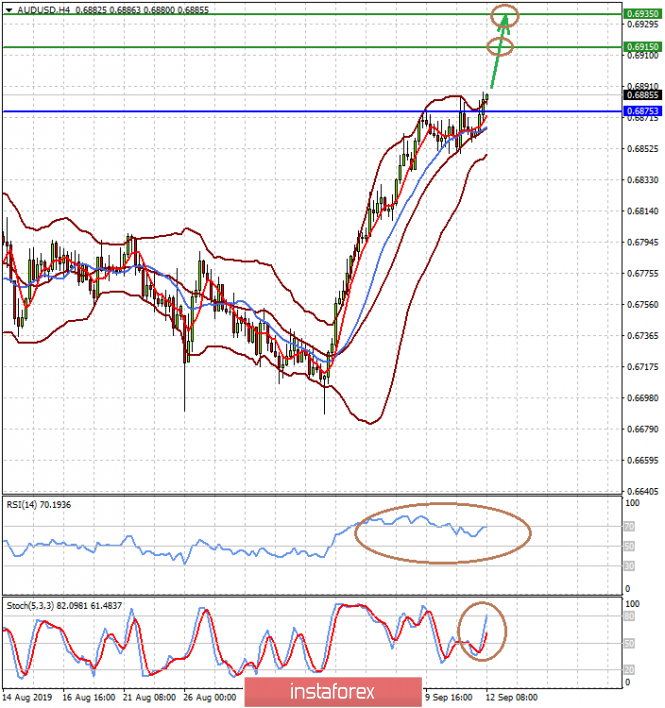
| Posted: 12 Sep 2019 06:05 AM PDT Today's meeting of the ECB, chaired by M. Draghi, will be the last in his career as president of the European Central Bank. He has held this high post since November 2011, and his powers expire on October 31 of this year. Over the course of his work, he showed himself to be a balanced leader and launched an unprecedented in scope for Europe program with him to stimulate the economy of the euro region to support economic growth, which was almost completely stopped in December last year. And on the eve of the ECB meeting, markets continue to wonder what the regulator will do in the face of these difficult economic conditions in large Europe. Three options are being considered. The first one contains a slight decrease in the deposit interest rate by 0.10% with the repurchase of corporate bonds by 5 billion euros within 6 months. The average option, which most market participants are inclined to, is to reduce the deposit interest rate by 0.20% with the repurchase of corporate bonds by 5 billion euros within 9 months and government bonds in the amount of 25 billion euros within 9 months. the last most radical option reflects the possibility of cutting the deposit interest rate by 0.40% with the repurchase of corporate bonds worth 5 billion euros for 9 months and government bonds worth 75 billion euros for 9 months. It is extremely difficult to assume what option will be taken or it will be mixed. But based on the fact that market expectations are based on (conditionally speaking), the second option and the dynamics of the Euro currency, as it depended on this, the first option may have a supporting effect on the euro. The third will significantly weaken it. But if a mixed option is undertaken, then, in our opinion, a lot will depend on how much government bonds will be redeemed in terms of volume and time period. Recall that earlier, the decision was to buy out state assets against the background of cutting interest rates that caused the weakness of the euro exchange rate. But another option is possible - the fourth, when M. Draghi simply confines himself to promises, transferring all the responsibility of actions to the new leader C. Lagarde, who takes office on November 1. In this case, we expect a sharp increase in the single currency. Forecast of the day: The EUR/USD pair is consolidating in the range 1.0990-1.1060 in anticipation of the ECB's final monetary policy decision. We are waiting for the ECB's decision on monetary policy and proceed from the variability of ECB decisions. Minor incentives or simply promises of Draghi will lead to the growth of the pair, in which case it may rush to 1.1115. The reverse actions coupled with large-scale incentives will exert pressure on the pair, and it may fall to 1.0935. The AUD/USD pair is trading above 0.6875. Fixing above this level against the backdrop of the US decision to postpone the introduction of new customs duties on Chinese imports until October 15 may stimulate a price increase -first to 0.6915, and then to 0.6935. |
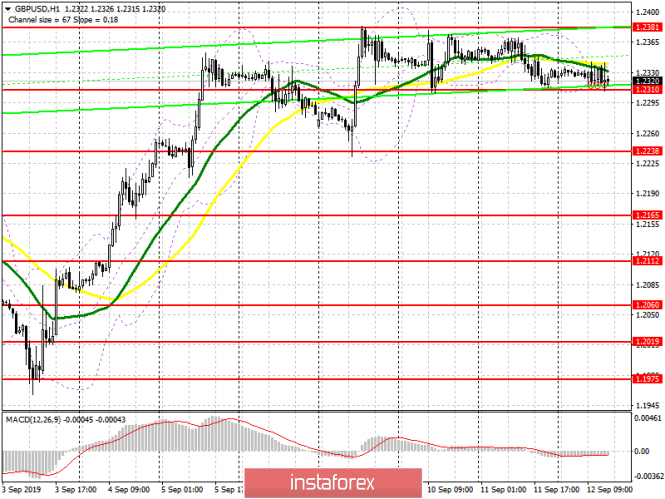
| Posted: 12 Sep 2019 05:36 AM PDT To open long positions on GBPUSD, you need: Not surprisingly, buyers of the British pound lost interest in it amid the lack of positive fundamental statistics and news on Brexit. Only US inflation data, which is expected in the second half of the day, will rock the market. At the moment, the task of the bulls is to break through the same resistance of 1.2380, which limits the upward potential this week. Only this will allow you to resume the bullish market, which will target the highs of 1.2427 and 1.2460, where I recommend fixing the profits. It is best to open long positions from the level of 1.2310 only in the scenario of a false breakdown against the background of a weak US inflation report. I recommend buying GBP/USD immediately for a rebound only in the area of a minimum of 1.2238, which is the lower boundary of the side channel. To open short positions on GBPUSD, you need: Sellers did not let GBP/USD close to the resistance of 1.2380 today, which led to the formation of a downward correction. However, the main target of the bears for the second half of the day will be the support test of 1.2310, the breakdown of which can increase the pressure on the pound, which will lead to a decrease in the area of the minimum of 1.2238, where I recommend taking the profit. If the bullish momentum in the North American session leads to a breakdown of the resistance at 1.2380, it is best to consider new short positions after updating the local highs around 1.2427 and 1.2460. However, without news on Brexit, and preferably positive, it will be very problematic to count on a larger increase in GBP/USD. Signals of indicators: Moving Averages Trading around 30 and 50 moving averages, indicating the sideways nature of the market. Bollinger Bands Volatility is very low, which does not give signals to enter the market.
Description of indicators
|
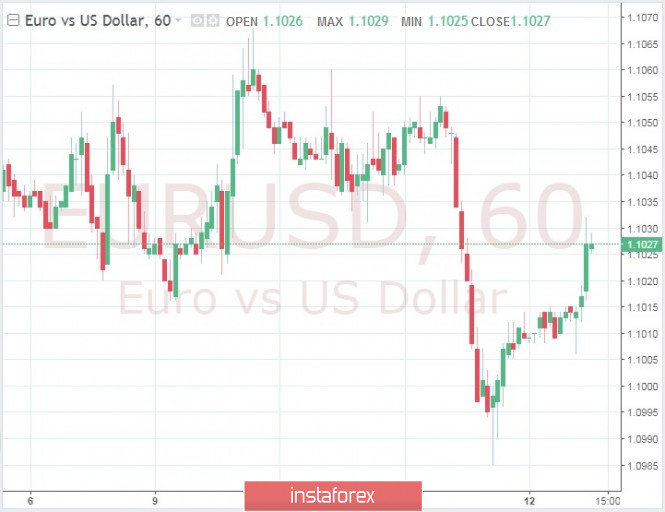
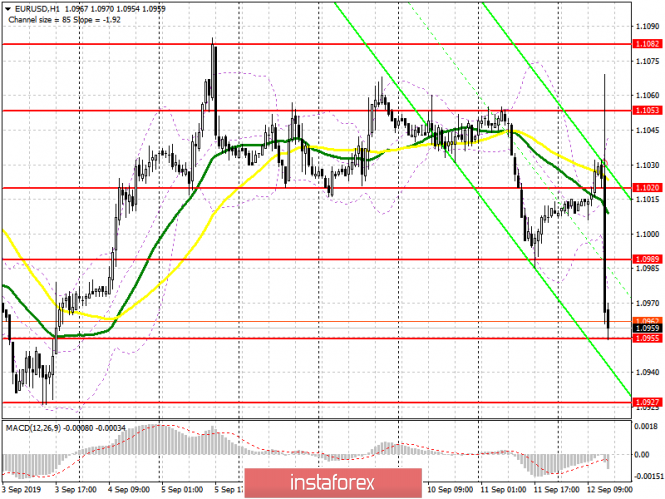
| Posted: 12 Sep 2019 05:36 AM PDT To open long positions on EURUSD, you need: The euro fell to the low of 1.0955, which I drew attention to in my morning forecast after it became known that the European Central Bank left the refinancing rate unchanged, lowering only the deposit rate. It was also announced the launch of the asset buyback program from November this year. Today, buyers can only hope to hold the support level of 1.0955, but more interesting levels for opening long positions are still in the area of 1.0927 and 1.0900. A return to the resistance of 1.0990 will also help the bulls to return to the level of 1.1020, where I recommend taking the profit. To open short positions on EURUSD, you need: Sellers will seek to break through the support level of 1.0955 as soon as possible, which can happen already during the press conference of the President of the European Central Bank Mario Draghi, who will signal a tendency to a soft monetary policy. In this scenario, the bears will expect to update the lows of this month in the area of 1.0927 and 1.0900, where I recommend fixing the profit. If the demand for the euro returns, for example, after a very weak report on the growth of inflation in the US, it is best to consider new short positions after a false breakdown in the resistance area of 1.0989 or sell EUR/USD immediately for a rebound from the maximum of 1.1020. Signals of indicators: Moving Averages Trading is below 30 and 50 moving averages, which indicates the formation of a bearish market after the news. Bollinger Bands In the case of euro growth in the second half of the day, it is best to count on short positions when forming a false breakdown near the upper limit of the indicator 1.1035.
Description of indicators
|
| Trading recommendations for the GBPUSD currency pair – placement of trade orders (September 12) Posted: 12 Sep 2019 05:19 AM PDT The pound/dollar currency pair shows low volatility of 57-70 points for the second day in a row, having driven itself into a relatively narrow accumulation. From technical analysis, we see that the quote continues to develop along with the range level of 1.2350, forming a distinct accumulation of 1.2310/1.2380 in the market. In this case, the behavior of quotes is justified, after an almost week-long rally, where market participants are in some kind of stunning state, trying to realize everything that is happening. As discussed in the previous review, traders rolled so well on impulse candles in the first week of September that they took a wait-and-see position. Traders can understand what is the point of jumping in a narrowly developing range if you can work on its breakdown and go into the main course of the market. Looking at the trading chart in general terms (daily period), we see that the corrective move is still maintained in the market, where a slowdown of remarkable candles is formed on its top. It is really difficult to say whether this slowdown will play in terms of restoring the initial trend since from technical analysis, this should happen, but in terms of the information flow, the angle may be different. The news background of the last day had data on producer prices in the United States, were they initially predicted growth, but then the data was revised and on the day of publication indicated that producer prices remained at 1.7%. The data are published with an acceleration of 1.7% – 1.8%, where the US dollar received local growth. What has changed in the general picture of GBPUSD is not at all, the movement in the lateral range has been preserved, and the ambiguous information background is to blame. So the Scottish court ruled that Boris Johnson's decision to suspend parliament was illegal. The court decision described the Prime Minister's actions as a "glaring case" where the generally accepted standards of conduct of public authorities were not met. The final decision will be made by the Supreme Court of Great Britain, the government itself intends to appeal the decision to the Supreme Court, and Boris Johnson believes that parliament should not return to work until this court makes a decision. However, a group of opposition lawmakers gathered in front of the Palace of Westminster, calling for parliament to reconvene. Honestly, Santa Barbara is live, and that's not the end of it. It turns out that the Prime Minister has long concealed documents confirming the significant threat of leaving the EU without an agreement, said the "shadow minister" on issues of leaving the EU, Keir Starmer. "These documents confirm the significant threats of leaving the EU without an agreement, which the Laborites are desperately trying to prevent. It is completely irresponsible on the part of the government to try to ignore these warnings and hide facts from society. Boris Johnson is obliged to admit that he behaved in bad faith towards the British people," Keir Starmer said in a statement. Today, the focus of the economic calendar is the ECB meeting, where its head Mario Draghi will outline plans for further action. The news, of course, is not in Britain, but in the event of a correlation between the EURUSD & GBPUSD currency pairs, synchronous movement may occur. In terms of statistical indicators, we are waiting for the publication of inflation data in the United States, where, it seems, the acceleration from 1.6% to 1.8% should be confirmed. Further development Analyzing the current trading chart, we see a sluggish movement horizontally, all with the same boundaries as were previously 1.2310/1.2380. Relative to the current points, accumulation is carried out near the lower border of the corridor. In turn, traders continue to stay out of the market, waiting for clear passages outside the existing boundaries. It is necessary to understand that there is no hurry, the information background puts so much pressure on market participants that the uncertainty in actions is felt more than ever. It is likely to assume that the fluctuation within 1.2310/1.2380 (+/- 15 points) will remain in the market for some time. In this case, I advise you to make a stronger emphasis on the analysis of the information background and third – party factors, since from technical analysis, we have only one signal – to sell. Based on the above information, we will derive trading recommendations:
As you can see, the recommendations remain the same, thus we are looking for a basis that will help to implement the given plans. Technical analysis Analyzing different sector timeframes (TF), we see that the indicators in the short-term and intraday period signal sales, but the indicators are variable due to the accumulation. The medium-term outlook retains an upward interest due to the impulse jumps of the past week. Volatility per week / Measurement of volatility: Month; Quarter; Year Measurement of volatility reflects the average daily fluctuation, calculated for the Month / Quarter / Year. (September 12 was built taking into account the time of publication of the article) The volatility of the current time is 27 points, which is an extremely low value for this period. Slowing and falling volatility gives us a leading signal of a possible jump, the market is preparing, and we also need to be ready to enter the market. Key level Resistance zones: 1.2350**; 1.2430; 1.2500; 1.2620; 1.2770**; 1.2880 (1.2865-1.2880)**. Support zones: 1.2150**; 1.2000***; 1.1700; 1.1475**. * Periodic level ** Range level *** The article is based on the principle of conducting transactions, with daily adjustments. The material has been provided by InstaForex Company - www.instaforex.com |
| Oil went negative as Trump claims Posted: 12 Sep 2019 03:54 AM PDT Black gold is getting cheaper amid a series of news. The US President Donald Trump said that an increase in US duties to 35% was postponed until October 15 this year. The American leader is also ready to discuss the possibility of easing sanctions against Iran. Experts say that the current situation has significantly "rocked" the oil market. Black gold fell in price yesterday on Wednesday, September 11, although the volume of raw materials in the US fell more than analysts had expected. A report by the US Department of Energy recorded a sharp drop in reserves. Experts attribute this to the fact that the data diverged greatly from the API forecasts published the day before. Stock statistics favored the bulls of the oil market more. According to the US Department of Energy, stocks of raw materials in the country decreased by 6.9 million barrels to 416.1 million barrels over the past week. This is 2% below the average for the last five years, experts emphasized. Production in the United States remained at 12.4 million barrels. Another reason for the collapse of oil was speculation regarding a reduction in the US rate. The situation was also influenced by the OPEC report, which refers to the growth of raw material production. Currently, the price of Brent crude oil has dropped to $60.41 per barrel and continues to decline. The unstable dynamics of oil quotes was influenced by the reports of D. Trump, who considers the mitigation of sanctions against Iran to be acceptable. Such a statement caused the collapse of the Brent brand from $63 to $61 per barrel. The Iraqi Oil Ministry reacted to this message, saying that the possible lifting of restrictions from Iran should not greatly affect the global black gold market due to strong domestic demand. Experts believe that the price of a barrel of Brent will stay just above $60 for this month and the reaction from the foreign exchange market will be minimal. However, a further fall is not excluded as reflected in serious fluctuations in the oil market. The material has been provided by InstaForex Company - www.instaforex.com |
| Control zones for GBP / USD pair on 09/12/19 Posted: 12 Sep 2019 03:46 AM PDT The test of monthly short-circuit at the beginning of this week became an obstacle to growth. Moreover, the likelihood of further strengthening of the British pound decreased to 30%. The retest of the maximum of the current week can be considered for the formation of the "false breakdown" pattern. Since the end of last week, the formation of a local accumulation zone is taking place, which may become decisive in the search for a new priority. False breakdown of this zone will open the prices for a profitable entry into the position. An alternative model will be developed if today's trading closes above a weekly high. This will indicate a continuation of the bullish momentum, but sales will have to wait as there will be opportunities for more profitable deals. Daily CZ - daily control zone. The area formed by important data from the futures market, which changes several times a year. Weekly CZ - weekly control zone. The area formed by marks from the important futures market, which changes several times a year. Monthly CZ - monthly control zone. The area is a reflection of the average volatility over the past year. The material has been provided by InstaForex Company - www.instaforex.com |
| Trading strategy for Bitcoin on September 12th. Bitcoin is heading for a long-term goal of $4,000? Posted: 12 Sep 2019 03:16 AM PDT Bitcoin – 4H.
On September 11, Bitcoin rebounded from the correction level of 76.4% ($9788) and a small increase. However, the tendency of bitcoin to fall remains, as the quotes remain within the tapering triangle formed by the two trend lines. Since the "cue ball" quotes rebound from the upper line, I expect the fall to the bottom line, which is located near the price value of $9350. This level is the maximum potential fall in the current conditions. A further drop in BTC quotes will be possible if traders manage to close below the trend line. In this case, bitcoin may decline in the medium term to the target levels of $4000 - $5000 per coin indicated by John Bollinger. I recommend buying cryptocurrency after the price goes beyond the triangle through the upper trend line, that is, under current conditions, not lower than the levels of $10400 - $10500. Or after the rebound from the bottom trend line. A new interesting forecast came from one of the famous crypto experts, based on the study of the cyclical complexity of cryptocurrency mining. Based on the expert's considerations, only the growth and fall of the capacities required for mining are cyclical. The crypto expert correlated the complexity of block mining (that is, the volume of production capacity and costs) with the value of bitcoin. Based on calculations, the new maximum value of bitcoin is $31000. However, the analysis does not say when BTC can reach these figures. Meanwhile, an increasing number of analysts note a decrease in the maximum value of bitcoin on the 4-24 hourly charts. This phenomenon is visible to the naked eye. It is this factor that can speak in favor of a further decline in the quotes of the "cue ball", and confirmation of this scenario will be the closure under the lower line of the triangle, which we have already written above. Another interesting forecast came from a well-known analyst and one of the founders of Fundstrat Global Advisors Tom Lee. According to Lee, the Fed's rate cut may lead to an increase in the value of bitcoin, and by the end of the year, the cryptocurrency will grow to $20000 per coin. According to Lee, bitcoin is used by investors to hedge risks, and the rate cut by the central bank causes an increase in volatility, which applies both to the transfer of funds to high-risk assets and hedging instruments. From my point of view, this is a very controversial statement, and we have heard a lot of such forecasts from "experts". However, while bitcoin is getting cheaper, and its most important peaks (there are two of them and they are visible on the monthly or weekly chart) says the opposite: Bitcoin is preparing to fall to $4000 per coin, since the second upward impulse was much weaker than the first, when bitcoin reached almost $20000. Overall results: Bitcoin continues to become cheaper, though at a low pace. Based on the picture in the illustration, the most likely option is a decrease in the area of $9300 - $9400. The rebound of BTC from the trend line will allow traders to count on the growth of the "cue ball" quote to $10000 - $10500. But more likely, from my point of view, there is still an option with a fall much lower than $9350. The Fibo grid is based on the extremes of July 17, 2019, and August 6, 2019. Forecast for Bitcoin and trading recommendations: Bitcoin performed a rebound from the Fibo level of 76.4%. However, I recommend that you still consider sales with targets of $9788 (76.4% of Fibonacci), $9566 (38.2% of Fibonacci) and $9350 (the bottom line of the triangle). I do not recommend buying bitcoin now, as the cryptocurrency remains in a narrowing triangle, which implies a fall in the price. The material has been provided by InstaForex Company - www.instaforex.com |
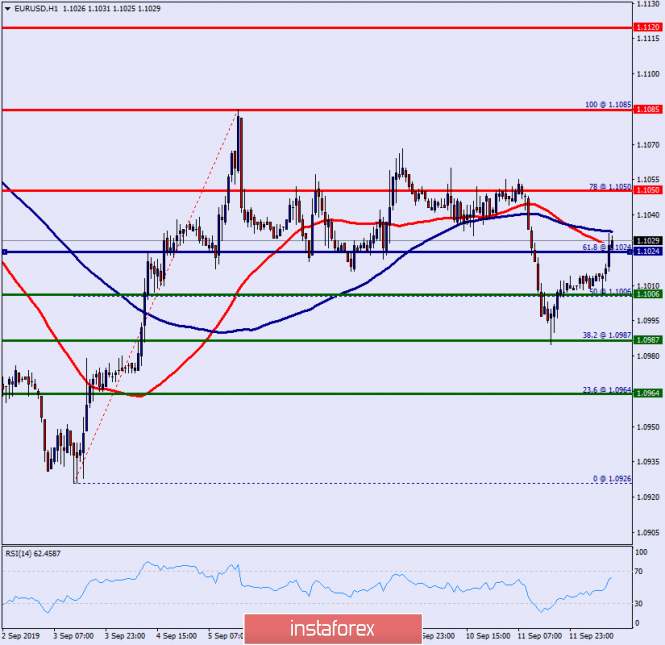
| Technical analysis of EUR/USD for September 12, 2019 Posted: 12 Sep 2019 03:07 AM PDT The EUR/USD pair in the 1-hour time frame. It is also worth noting that the price at 1.0987 will possibly form a strong support. Accordingly, saturation around 1.0987 to rebound the pair is likely to occur. The market is going to start showing the signs of bullish market from the zone of 1.0987 and 1.1006. Few days ago, the level of 1.0987 was broken to the upside, constituting a considerable demand level. This is shown to us as the current price is in a bullish channel. According to the previous events, we expect that the EUR/USD pair will move between 1.0987 and 1.1100 in coming hours. The depicted supprt level of 1.1006 acted as an important key level offering a valid buy entry. So, buy above the 1.1006 level with the targets of 1.1050,and 1.1085 today. Conversely, stop loss should be placed above the low reached near the second support (1.0964). The material has been provided by InstaForex Company - www.instaforex.com |
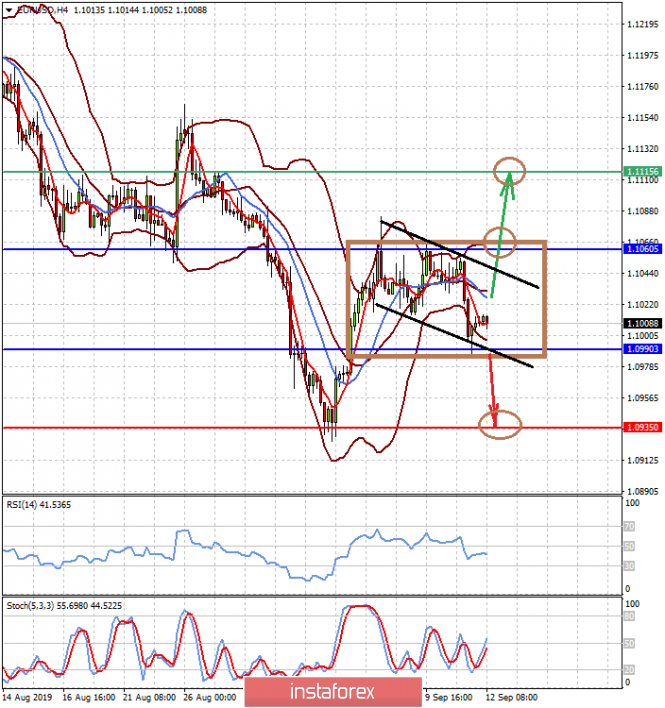
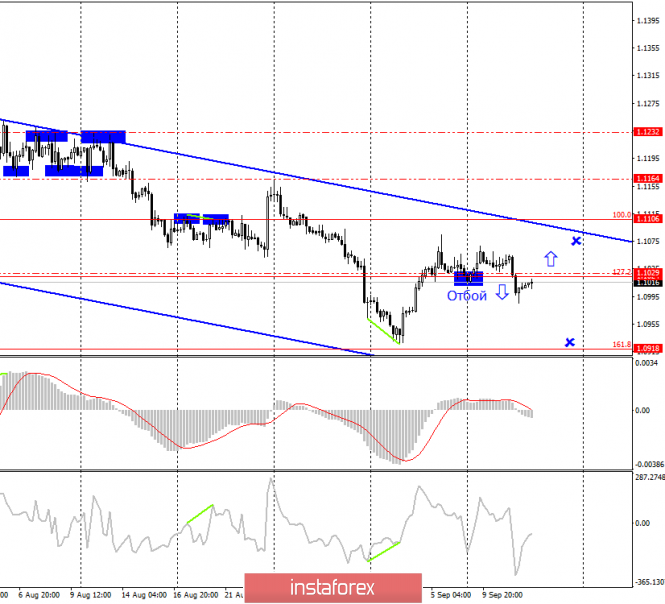
| Posted: 12 Sep 2019 02:42 AM PDT EUR/USD – 4H.
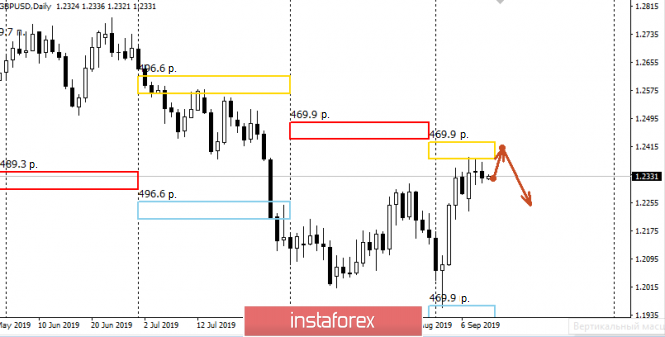
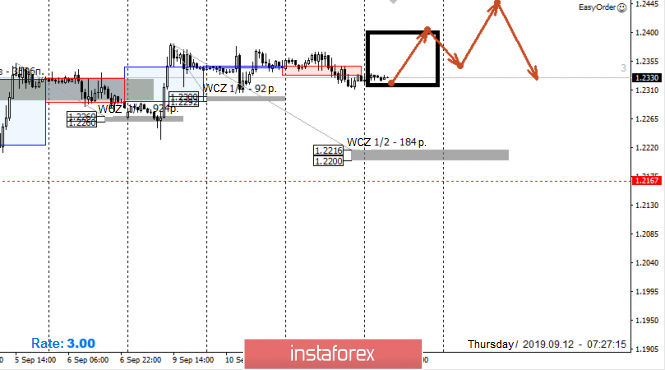
On September 11, the EUR/USD pair performed a reversal in favor of the US currency on the 4-hour chart and consolidated under the correction level of 127.2% (1.1024). It is a day earlier than the start of the results of the ECB meeting, which traders are waiting since the beginning of the week. However, I wrote yesterday that this option is possible. Today's program starts not with the ECB meeting, but with the report on industrial production in the European Union for July. The forecasts are disappointing, the indicator is expected to fall by another 1.3% y/y after falling in June by 2.6%. Only after 2 hours 45 minutes, information will begin to come from the European Central Bank, where the decisions of the monetary committee will be announced first, and then a press conference will be held by Mario Draghi, at which he will explain in detail the reasons for the decisions taken on monetary policy, as well as report on their expectations of changes in the economic situation (in Europe and the world) and share forecasts. Simultaneously with the start of Mario Draghi's press conference, a report on inflation in the US will be released. Traders expect that inflation will remain in the range of 1.6% - 1.8%, but the value of + 1.8% y/y will be considered an acceleration and will support the US dollar, and + 1.6% – a slowdown, and will cause pressure on the US currency. I also note that there is an option in which the ECB meeting will be the least interesting event of the day. The fall of the euro/dollar yesterday was no coincidence. Most likely, traders began to open purchases of US currency in advance. Thus, if the ECB does not surprise today with too strong policy easing, then traders may not react to the summing up of the meeting. What to expect from the euro/dollar currency pair? On September 12, I expect the euro/dollar pair to fall further. The probability of this option is about 90%. The only question is how strong it will be. 10% – I leave the opposite reaction to the market. Sometimes it happens that the news says one thing, but the market is moving steadily in the opposite direction. That is why there is no 100% probability of a certain movement. Thus, a 10% probability – a surprise from the ECB and Mario Draghi, it is a weak report on inflation in the US. If everything goes according to the main plan, then I expect a fall in the direction of the corrective level of 161.8% (1.0918). The Fibo grid is based on the extremes of May 23, 2019, and June 25, 2019. Forecast for EUR/USD and trading recommendations: I recommend selling the pair with the target of 1.0918 since it was consolidated below the level of 1.1024. A stop-loss order above the level of 1.1029. You can buy the pair after closing above the levels of 1.1024 – 1.1029 with the target of 1.1106. A stop-loss order below the level of 1.1024. Purchases of the pair, given the information background, is not a priority. GBP/USD – 4H.
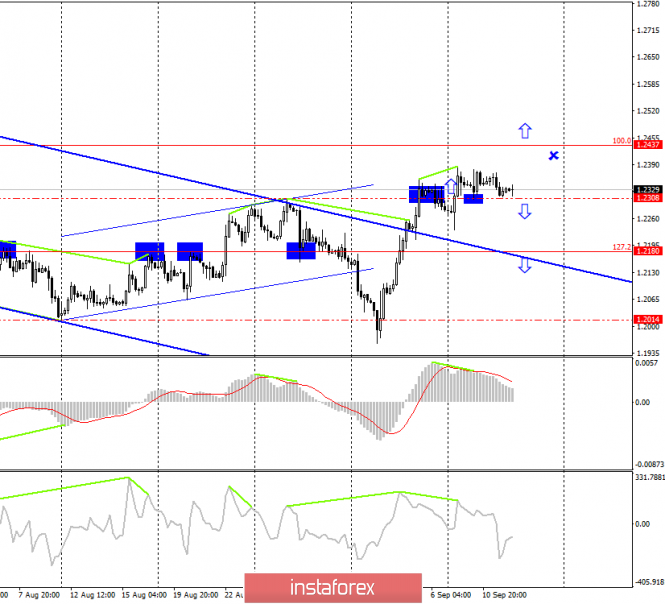
In the UK, passions are boiling over Boris Johnson's decision to suspend the work of parliament. As we see, the work of the parliament has been suspended since September 9, but the deputies themselves do not think to go to the sea and beaches. An initiative group of British deputies, consisting of representatives of different parties, made the court recognize the illegality of the decision of Boris Johnson to send parliamentarians on vacation. The court saw Johnson's decision as impeding the influence of deputies on Brexit. The court also believes that Johnson deliberately misled Queen Elizabeth II when he asked her to suspend the work of parliament, saying that this is a necessary measure, but not to prevent deputies from preventing him from implementing Brexit "No Deal". Thus, after the 17th, when the case will be considered by the Supreme Court, the parliament can return to its duties, and the Prime Minister himself has already said that he will decide on the judicial system, as he "respects the independence of this system". It sounds nice, but Johnson is unlikely to give up without a fight. Most likely, the prime minister's team is already preparing appeals. At the same time, a 5-page document was published on the website of the UK government, which defines Brexit's most critical scenario "No Deal". The deputies again forced the prime minister to take such a step, having adopted the corresponding bill before the parliament was closed. In short, the document called Yellowhammer contains a list of possible problems that the country will face in the case of Brexit without any agreements with the European Union. Boris Johnson would surely want this document to be kept a secret, but the deputies, on the contrary, would make it public. Now the population of the UK can more clearly understand what awaits the country in case of the implementation of Brexit by Johnson. What to expect from the pound/dollar currency pair? The pound/dollar pair has consolidated above the level of 1.2308, however, whether the pair will continue to grow is still a question. The bearish divergence of the CCI indicator has doubled the divergence of the MACD indicator, and both divergences remain valid. Thus, indicator analysis shows a higher probability of pair growth in the direction of the correctional level of 100.0% (1.2437). The probability of this is 55-60%. The consolidation of the rate pairs under the level 1.2308 work in favor of the US dollar and start falling of quotations in the direction of the correction level to 127.2% (1.2180). The Fibo grid is based on the extremes of January 3, 2019, and March 13, 2019. Forecast for GBP/USD and trading recommendations: I recommend maintaining the pair's already open purchases with the target of 1.2437 and stop at 1.2308, but I do not recommend opening new purchases due to two bearish divergences. I recommend selling a pair with the target of 1.2180, if the closing is performed under the level of 1.2308, with the stop-loss order above the level of 1.2308. The material has been provided by InstaForex Company - www.instaforex.com |


| You are subscribed to email updates from Forex analysis review. To stop receiving these emails, you may unsubscribe now. | Email delivery powered by Google |
| Google, 1600 Amphitheatre Parkway, Mountain View, CA 94043, United States | |
No comments:
Post a Comment