Forex analysis review |
- Weekly market review
- Trading strategy for EUR / USD and GBP / USD on September 2
- EUR/USD: if there is a rebound, it will be short-lived, the decline will continue
- Bitcoin price forecast: buy before the next rally begins
- GBP/USD is still staying at around 1.2100, but it will not last long
- EUR/USD. September 2. Results of the day. Business activity in the industry, as expected, did not stop the fall of the euro
- GBP/USD. September 2. Results of the day. British Parliament's last chance to prevent Brexit without a "deal"
- EURUSD and GBPUSD: Boris Johnson threatened members of his party, and the opposition is preparing a bill to block Brexit
- The Dollar index approaches our 99.15 target
- Gold remains in a bullish trend
- The Central Bank will put the "Australian" on pause
- September 2, 2019 : GBP/USD Intraday technical analysis and trade recommendations.
- #USDX vs EUR / USD vs GBP / USD vs USD / JPY: Comprehensive analysis of movement options from August 01, 2019 APLs &
- American currency strengthens its position
- September 2, 2019 : EUR/USD Intraday technical analysis and trade recommendations.
- To open short positions on GBP / USD pair, you need:
- EUR / USD plan for the American session on September 2: MACD Morning Divergence helps stop the decline of euro
- BTC 09.02.2019 - Sell zone for Bitcoin
- Bitcoin trading strategy for September 2: A good opportunity to sell bitcoin
- Wave analysis for GBP and JPY on September 2: The weakening trend against the dollar continues
- USD/CAD analysis for September 02, 2019 - Breakout of the Acending triangle
- Gold is not afraid of volatility
- Gold 09.02.2019 - Gold in the buy zone, more upside in play
- Technical analysis of the GBP/USD currency pair for September 2019
- The guns of the trade war started firing (High risks of the resumption of the fall in the EUR/USD and EUR/JPY pairs)
| Posted: 02 Sep 2019 04:39 PM PDT Greetings, dear traders! Congratulations to everyone on the beginning of autumn and, hopefully, on the increase in volatility associated with the end of the holiday period, including the bank traders, and the Forex market, as you know, is the interbank market, and the private traders who are here – random people. The first week of autumn is an important trading period associated with a change in order placements in anticipation of non-farm payrolls, and after them. Often, it is the "nanoc" that one ends and other tendencies of instruments related to the American dollar begin. Today, Monday, according to most professional traders, is the worst time to open new trading positions and decide on a change in trading trends. Moreover, it is also today, September 2, 2019 - is a holiday in the USA and Canada - Labor Day. Therefore, let us congratulate the United States labor teams on this holiday! For us, this means that trading during this evening will take place in narrow ranges and it is not worth waiting for super-movements from the markets today. Only "Donald Trump" can break the "trade silence" with his Twitter. Sometimes, it seems to me that Donald is an avid trader who "rules" his unprofitable positions with his own, often diametrically opposite, statements on the network. Today, the main trading idea related to the American dollar for me is to strengthen the dollar in USD/JPY and GBP/USD, which gave last week. I also have very interesting ideas on certain crosses, which will be published soon. What to do for traders in a period of low volatility? Of course, developing trading skills in the "strategy tester", as well as working on the analysis of profitable / unprofitable positions of the last week, in order to understand - how you earn and how much you lose and at what volumes and at what time you have it is obtained most efficiently. Good luck in trading! And see you at the evening reviews of cross-courses! The material has been provided by InstaForex Company - www.instaforex.com |
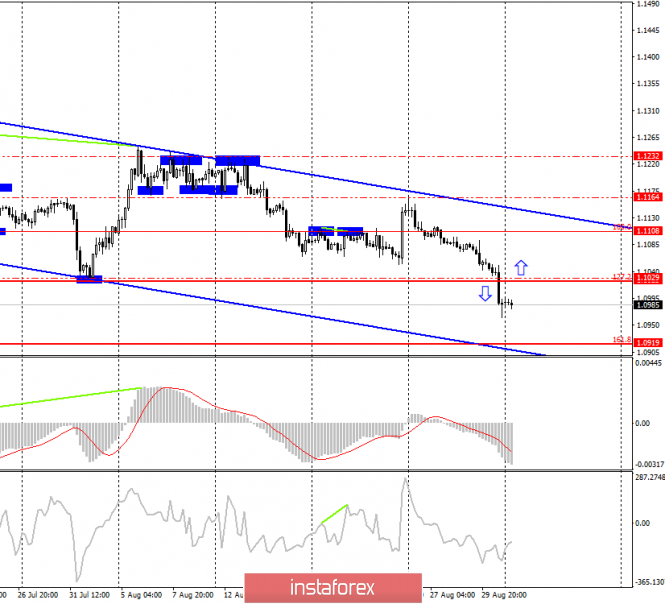
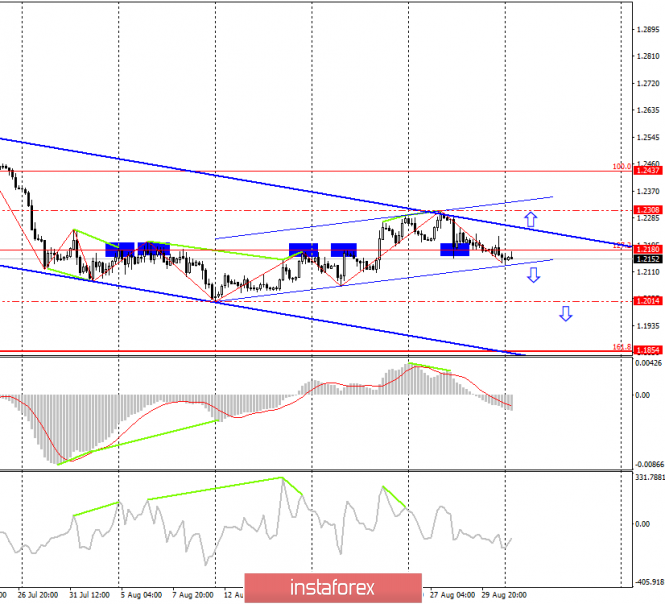
| Trading strategy for EUR / USD and GBP / USD on September 2 Posted: 02 Sep 2019 04:39 PM PDT EUR / USD - 4H. On the four-hour chart, the EUR / USD pair continues the process of falling, in the direction of the correction level of 161.8% - 1.0919. The signal for a new fall of the euro-dollar pair was received on Friday, August 30, at the closing of quotations below the Fibo level of 127.2% - 1.1024. This signal is already in operation. Meanwhile, an equidistant channel unambiguously indicates which direction the current trend has. From the latest news, I note the speech of Christine Lagarde, the future chairman of the ECB, who will succeed Mario Draghi at the end of October 2019. Ms. Lagarde stated that the European Central Bank should be ready for action against the background of a difficult economic situation. Also, according to Ms. Lagarde, "the ECB has the opportunity to cut rates, even if it negatively affects financial stability and the banking sector." What to expect from a currency pair on Monday? On September 2, I expect a further decline in the euro-dollar pair in the direction of the level of 1.0919, since I do not see any interference and obstacles to the implementation of this scenario. Usually, traders take profits at the end of the week or month, but this did not happen on Friday. Accordingly, traders are ready to maintain sales. Therefore, today, I look forward to continued decline. The information background is also unlikely to be on the side of the euro, since business activity in Germany and the European Union is likely to remain at low levels, indicating a decline in industry. Below the level of 1.1024, sales can only be considered. One can think about the growth of the European currency after the pair consolidates above the Fibo level of 127.2%. On the other hand, upcoming divergence is not observed in any indicator today. The Fibo grid was built at the extremes of May 23, 2019 and June 25, 2019. Forecast on EUR / USD and recommendations to traders: I recommend selling the pair with the target of 1.0919, as the pair completed consolidation under the correction level of 127.2%. Stop Loss - Over 1.1029. You can buy a pair after closing above the level of 1.1029 with the target of 1.1108. In this case, the pair will still remain inside the downward trend. GBP / USD - 4H. So far, the correction equidistant channel indicates the preservation of the upward trend for the pair GBP / USD. The rebound of quotations from the bottom line of this channel allows traders to expect some growth in the direction of the level of 1.2308 (peak of August 27). At the same time, the upper line of the trend equidistant channel, which continues to support the long-term downward trend, may become an insurmountable obstacle to this level. Based on this, I believe that the pair has a better chance of closing under the correction channel. In this case, the path to the levels of 1.2014 (low of August 12) and 1.1854 (Fibo level of 161.8%) will be open and accessible without barriers. Given the background and the events that will take place in the UK tomorrow, I believe that this scenario is highly likely. Today, traders can only pay attention to UK business activity in the industrial sector, which is likely to remain around 48.0. That is, it is unlikely to force traders to buy pound sterling. But tomorrow, British parliamentarians will leave the vacation, and war will begin in parliament. The war between Prime Minister Boris Johnson, who at the weekend had already announced that he would expel from the party all who would impede Brexit's "No Deal" and Brexit's opposing deputies on October 31. Accordingly, it is tomorrow that we will learn how the story will develop with the suspension of parliament by Boris Johnson. What to expect from a currency pair on Monday? The main obstacle for a new fall of the pound is now the bottom line of the correction channel. Accordingly, I look forward to overcoming this line, which will allow traders to expect the pair to fall in the direction of levels 1.2014 and 1.1854. Today, news are not expected from the UK, but in America, today is Labor Day - a national holiday. I do not expect the growth of the British currency, since there is practically no reason for this. Moreover, I think that the trend segment on August 27 ended when the pound grew. Now, you just have to wait for confirmation of this assumption. The Fibo grid was built at the extremes of January 3, 2019 and March 13, 2019. GBP / USD Forecast and recommendations for traders: I recommend buying the pair very carefully (or not buying at all) with the target of 1.2437, if closing is performed above the upper line of the trend channel (downward). Purchasing near the top line inside the channel is dangerous. I recommend selling a pair with targets 1.2014 and 1.1854 and with a Stop Loss level above 127.2% - 1.2180 if closing is performed under the lower line of the correction channel. The material has been provided by InstaForex Company - www.instaforex.com |
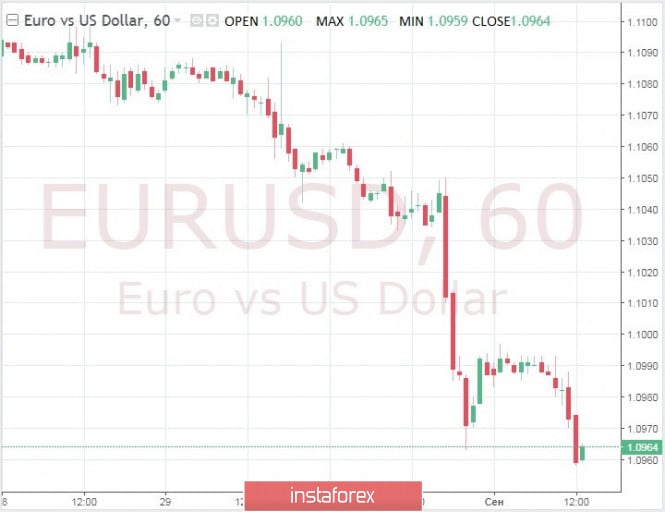
| EUR/USD: if there is a rebound, it will be short-lived, the decline will continue Posted: 02 Sep 2019 03:40 PM PDT After a slight rebound, the EUR/USD pair may resume falling, as the trend is still in a downward direction. Resistance is expected at a psychologically significant level of 1.1000, followed by 1.1027, then 1.050, at which EUR/USD held in mid-August. A potential rebound, if any, will be temporary. Although the situation in the German political arena encourages the euro's growth, Italy has not yet formed a government, and in Germany, the key parties have agreed only on fundamental principles and still need to agree on many details. Moreover, the economic situation in the eurozone remains alarming. Markit purchasing managers' final indices for the manufacturing sector show that prospects remain bleak. How low can the euro go? This question after the Friday crash worries many traders. Most likely, the market will see a temporary recovery. The chancellor of the ruling CDU party, Angela Merkel, won the local elections in Saxony. In other regions, fears of the victory of extremists from the Alternative German State (AfD) also did not materialize. These results will help stabilize the shaky coalition and strengthen the role of Merkel as a guarantor of stability on the continent. There is another reason for the rebound. US President Donald Trump, although he introduced new duties, recalled that high-level talks should be held at the end of this month in Washington. Until recently, the relative lull in the trade war stimulated the growth of the dollar, now the dollar will experience downward pressure. In addition, the escalation of the trade war means better prospects for German manufacturers, which depend on exports to China. The material has been provided by InstaForex Company - www.instaforex.com |
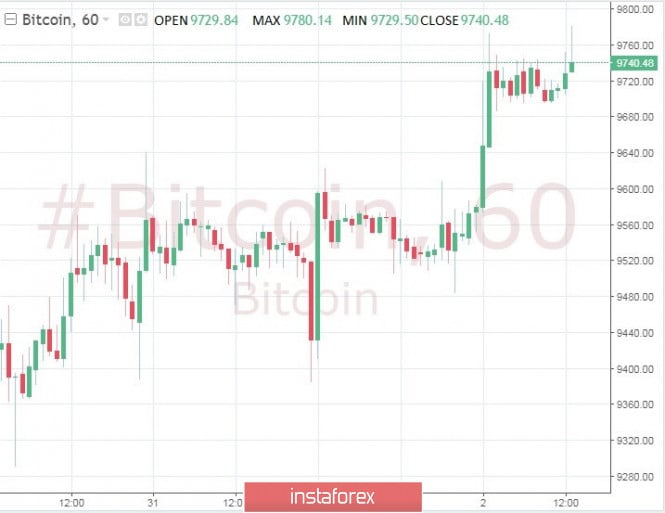
| Bitcoin price forecast: buy before the next rally begins Posted: 02 Sep 2019 03:40 PM PDT In the last month, Bitcoin has been smoothly falling. A drop in price to $9,300 was necessary for the next rally. The course continues to attract buyers, as investors are waiting for the next parabolic stage. Bitcoin went down from the level of $10,000 dollars, updating lows close to $9,300, after the current recovery began. The currency is currently trading at $9,771. The first resistance line is observed at $9826. If Bitcoin manages to rise above this barrier, the move will remain unchanged until it reaches the next level of $9928. The biggest obstacle to $10,000 is the $9928 level. If it can be overcome, then the next stage is $10,400 dollars and then another resistance level will approach, $ 10,436 dollars. If the trend unfolds, then before dropping to the most powerful support level of $8606, Bitcoin is waiting for the marks of $9725, $9420 and $9000. Expecting a new serious rally, we recall the forecast of the famous trader and analyst Peter Brandt, who said that Bitcoin is moving to the fourth parabolic phase. Brandt is remembered for accurately predicting a downward trend last year, and now the analyst claims that the next spurt will bring the first cryptocurrency closer to $100,000. In May of this year, Brandt began to determine the potential of Bitcoin in 2019. He believes that the movement of bitcoin over the past four months indicates the beginning of a new long-term growth cycle. "Bitcoin is aiming for the $100,000 mark. The BTC/USD pair is experiencing its fourth parabolic phase since 2010. No other market in my 45 years in trade has become so parabolic on the log chart," the analyst said. The material has been provided by InstaForex Company - www.instaforex.com |
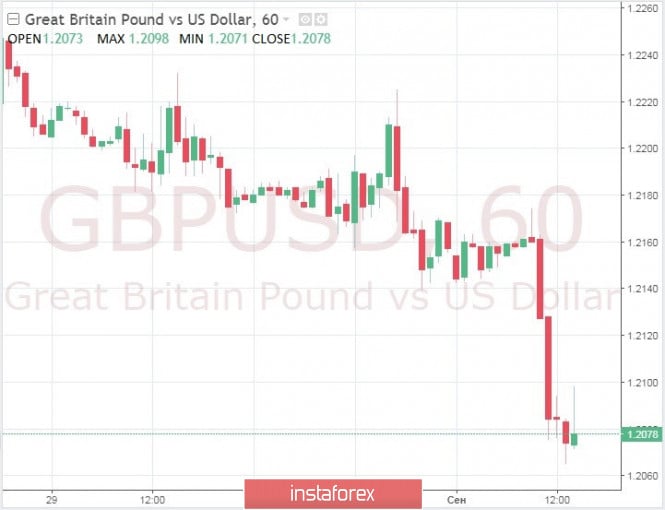
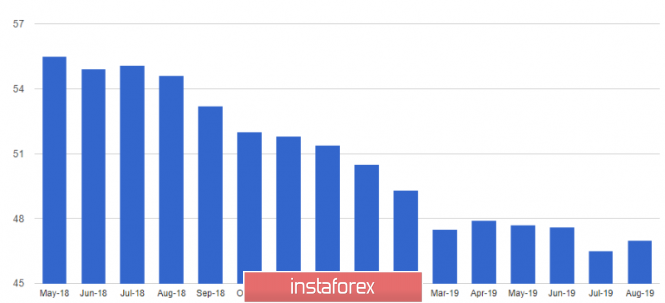
| GBP/USD is still staying at around 1.2100, but it will not last long Posted: 02 Sep 2019 03:40 PM PDT Great Britain: the latest IHS Markit report showed that the decline in activity in the manufacturing sector continued in August. Seasonally adjusted, the IHS Markit Purchasing Managers Index (PMI) fell in August to seven-year lows of 47.4 points from the expected 48.4 points and 48.0 points in July. New orders arrive at the slowest pace in seven years. Business confidence fell to a record low. "High levels of economic and political uncertainty, along with continued tensions in international trade, stifled British producers in August. Business conditions have deteriorated as much as possible over the past seven years, as companies cut production in response to the sharpest drop in new orders since mid-2012. The latest PMI indicates a quarterly decline in GDP close to 2%. The prospects have worsened," commented Rob Dobson, director of IHS Markit. Horrible activity indicators in the manufacturing sector of the UK strengthen the bearish sentiment around the pound. The pound dropped to nine-day lows of $1.2094. The currency is also under pressure from uncertainty about Brexit due to the growing risks of a new referendum. Conservative party member David Gauke said MPs will be able to block the hard Brexit. Meanwhile, his party counterpart, Prime Minister Boris Johnson, threatened to "expel the rebels" from the party if they did not support him in a key vote on Brexit on Tuesday. The material has been provided by InstaForex Company - www.instaforex.com |
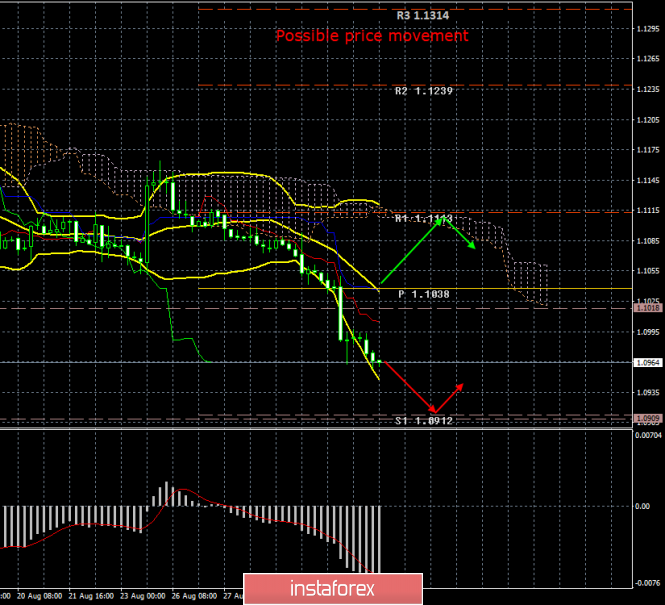
| Posted: 02 Sep 2019 03:40 PM PDT 4-hour timeframe Amplitude of the last 5 days (high-low): 70p - 30p - 25p - 51p - 98p. Average volatility over the past 5 days: 55p (average). In the morning review on the euro currency, we wrote that there are no visible obstacles for traders to continue selling the European currency after a disappointing Friday. Macroeconomic reports that were released today in Germany and the European Union, as expected, did not provide any support for the euro. The index of business activity in the industrial sector of Germany in August fell even stronger (!!!), amounting to 43.5 with the forecast and previous value of 43.6. The situation in the European Union is slightly better, business activity in the manufacturing sector did not change in August and amounted to 47.0, which is fully consistent with forecasts. In the morning, we talked about the fact that even if these indices were higher than forecasted values, then traders would still refuse to buy euros. There are currently too many reasons against the long positions in the euro/dollar pair. And so it turned out in practice. Disappointing business activity may result in an even greater slowdown in the EU economy the future, in an even greater reduction in industrial production, which will negatively affect inflation, the labor market, and GDP. Thus, forecasts for the main macroeconomic indicators remain negative, and the speeches by Christine Lagarde and Mario Draghi about the need to stimulate the EU economy look, of course, ambiguous, but fully correspond to the truth. By the way, Christine Lagarde will make a new speech tomorrow morning, this time before the EU Committee on Economic and Monetary Affairs. Thus, it is quite possible to expect a new portion of "encouraging and optimistic" information that will cause new sales of the euro. It is unlikely that in two days the rhetoric of Lagarde will change. But the more interesting question now is: will Mario Draghi reduce the rate and mitigate the monetary policy after Friday's announcement of the ECB's future actions after changing its head? It is no secret that Mario Draghi also believes that the threats of trade wars, the global recession and the weak state of inflation in the EU are grounds for easing monetary policy. Many analysts agreed that in the last two months of his reign, Draghi is implementing all the instruments of monetary policy available to him to stop the recession in the European Union. Now this moment is in question. Surely Christine Lagarde and Mario Draghi had a conversation with each other, and most likely not alone. Perhaps Lagarde asked Draghi not to radically change the monetary policy, as she has her own thoughts on this subject and her own methods of dealing with the new economic crisis. Thus, Mario Draghi may not make fundamental changes in the ECB's policy in September and October. Unfortunately, this news is still not positive for the euro currency. The best that awaits the euro is the completion of the fall against the dollar, temporary. The best option is technical growth, which is by no means based on fundamental factors. The technical picture shows the absence of any signs of the beginning of an upward correction, and the MACD indicator may soon begin to discharge, since it is at its lowest position. Trading recommendations: The EUR/USD pair continues its uncorrected downward movement. Thus, now it is still recommended that the EUR/USD pair be sold with a target of 1.0912. It is clear that there is no question of any purchases now. Buy positions can be considered no lower than the level of 1.1050. In addition to the technical picture, fundamental data and the time of their release should also be taken into account. Explanation of the illustration: Ichimoku indicator: Tenkan-sen is the red line. Kijun-sen is the blue line. Senkou Span A - light brown dotted line. Senkou Span B - light purple dashed line. Chikou Span - green line. Bollinger Bands Indicator: 3 yellow lines. MACD indicator: Red line and bar graph with white bars in the indicator window. The material has been provided by InstaForex Company - www.instaforex.com |
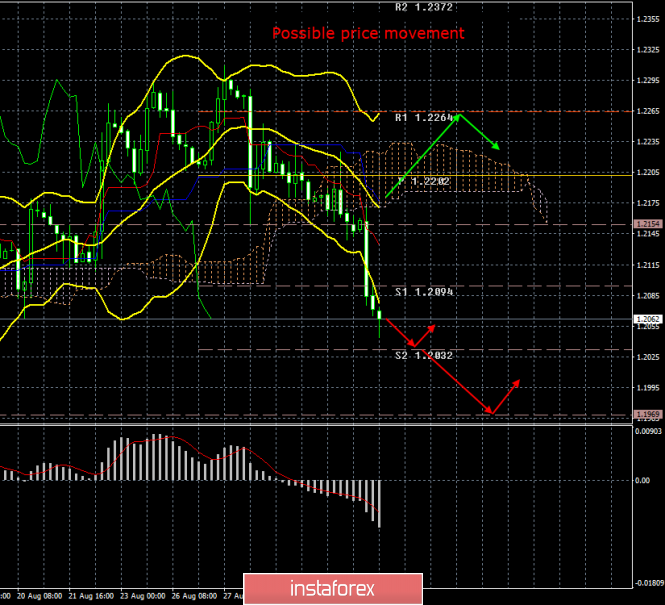
| Posted: 02 Sep 2019 03:40 PM PDT 4-hour timeframe Amplitude of the last 5 days (high-low): 100p - 78p - 134p - 60p - 86p. Average volatility over the past 5 days: 92p (high). On the first trading day of the new week and month, September 2, the British pound fell under another wave of mass sales. In less than a day, the British currency has already lost about 120 points and is not going to stop there. The reasons for this collapse lie in the sharply increased chances of Brexit without any agreement. As we all know, MPs will leave their holiday tomorrow and they will have exactly 6 days to pass the bill that blocks "hard" Brexit, or to cancel Boris Johnson's decision to suspend the Parliament, recognizing it as illegitimate. Both issues can be resolved tomorrow, since it is on Tuesday that the first parliamentary meeting will be held and hearings will be held on the suspension of the work of the British Parliament for the period from September 9 to October 14. Labour and opposition leader Jeremy Corbyn said Monday that in the next 28 hours it will become known what exactly will be proposed to the deputies in Parliament in order to prevent Brexit, which is destructive for the country. Jeremy Corbyn also said that "if it's not possible to take effective measures to prevent leaving the EU without a deal this week, then the probability of a Brexit on October 31 will be 100%." It was against the backdrop of this statement that the pound, most likely, went to the next steep trough. The opposition leader also said the hard Brexit "will ruin our economy." "Johnson and his team do not think about the consequences of such a move," summed up Corbyn. Well, if we add to this the declining index of business activity in the UK manufacturing sector, it becomes clear why the pound ends the first day of the week in a deep negative. Macroeconomic statistics continue to disappoint, and by the end of this week, it will become absolutely clear whether Britain will leave Brussels's jurisdiction without any agreement or if there will still be any hope of an orderly "divorce." Since there is no optimistic information about this so far, the bears continue to "crush" the pound. And the situation is unlikely to change until encouraging news arrives from Parliament. But whether they will arrive at all is a big question. One way or another, tomorrow it is recommended to closely monitor any news from the UK. Sharp price reversals, strong movements, high volatility are possible. Based on the technical picture, the pound/dollar continues to move steadily down and there is no reason to expect at least a correction now. However, fundamental events tomorrow can greatly affect the technical picture. You need to be prepared for this. Trading recommendations: The GBP/USD currency pair continues its downward movement. Therefore, it is recommended to sell the pound with targets at support levels of 1.2032 and 1.1969. Increased caution is required in trading tomorrow, as news will come from the Scottish Court and the British Parliament throughout the day. In addition to the technical picture, fundamental data and the time of their release should also be taken into account. Explanation of the illustration: Ichimoku indicator: Tenkan-sen is the red line. Kijun-sen is the blue line. Senkou Span A - light brown dotted line. Senkou Span B - light purple dashed line. Chikou Span - green line. Bollinger Bands Indicator: 3 yellow lines. MACD indicator: Red line and bar graph with white bars in the indicator window. The material has been provided by InstaForex Company - www.instaforex.com |
| Posted: 02 Sep 2019 03:39 PM PDT The euro continued to decline after a series of weak reports on manufacturing activity in the eurozone countries, which once again confirms the fact that economic growth has slowed and there is a need for intervention by the European Central Bank. As throughout this year, the decline in production activity in the eurozone is due to a sharp decline in exports due to the aggravation of trade conflicts between the United States and China and the EU, as well as due to a slowdown in global economic growth, which is still the "echo" of US protectionist policies. According to Markit, the PMI for Purchasing Managers Index for Italy's manufacturing sector remained below 50 points and amounted to 48.7 points in August this year, which indicates a reduction in the sphere against 48.5 points in July this year. Economists had expected the index to be 48.5 points. France is perhaps the only country where the manufacturing sector has returned to the right track. According to the report, the PMI Purchasing Managers Index for France's manufacturing sector rose to 51.1 points in August this year, while it was 49.7 points in July. Economists had expected the index at 51.0 points. Germany continues to alarm with very weak fundamental statistics, which have been coming in all last week and continue to come in now. Thus, the PMI Purchasing Managers Index for Germany's manufacturing sector again declined in August to 43.5 points against 43.2 points in July. Economists had forecast the index at 43.6 points. Therefore, it is not surprising that the general index of procurement managers for the manufacturing sector of the eurozone remained unchanged at its level below 50 points and amounted to 47.0 points in August, which fully coincided with the forecasts of economists. As for the technical picture of the EURUSD pair, bears continue to push the market down on bad reports, and it turns out that they are pretty good. The next goal is support at 1.0950, a breakthrough of which will draw risky assets even lower to the area of 1.0920 and 1.0900 levels. GBPUSD The British pound continued to decline after the release of the same weak report on activity in the UK manufacturing sector, which fell in August amid falling new orders and company confidence. The situation with Brexit also does not add optimism and creates a number of uncertainties. A hearing will be held today on the case of the illegitimate suspension of the work of the British Parliament in the Scottish Court. However, most likely, it will be a failure, which will only put pressure on the British pound in the afternoon. The opposition's actions on September 3, the official date for the Parliament's return from the summer holidays, remain more interesting. Most likely, the emphasis will be placed not on a vote of no confidence in current Prime Minister Boris Johnson, but on the development of a law that does not allow Britain to leave the EU without any agreement on Brexit. In other words, the Laborites will try to exclude an unordered exit without an agreement, to which everything now goes. Meanwhile, Boris Johnson is not standing aside. At the weekend, he announced that those Conservative MPs who oppose Brexit without an agreement and want to delay it can ultimately be left without their seats in Parliament. The leader of the Conservative Party also noted that any Conservative deputy who decides to join the opposition on this issue will be expelled from the party in Parliament. As for the data that I spoke about above, the IHS Markit report indicated that the PMI purchasing managers index for the UK manufacturing sector fell to 47.4 points in August from 48.0 points in July. Markit drew attention to the fact that some respondents, companies in the eurozone, began to avoid suppliers from the UK, which is directly related to the emergence of new trade barriers due to the situation with Brexit. The British pound, meanwhile, is storming new weekly lows in the support area of 1.2060. Their breakthrough will lead to a new wave of decline to the lows of the year in the region of 1.2020 and 1.1985. The material has been provided by InstaForex Company - www.instaforex.com |
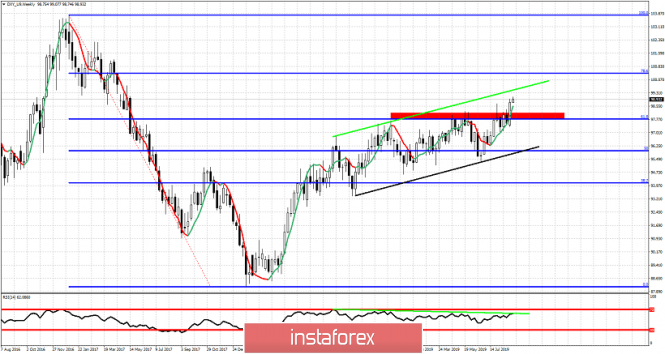
| The Dollar index approaches our 99.15 target Posted: 02 Sep 2019 12:15 PM PDT In a previous analysis back in August 20th we mentioned that we expect price to eventually break the resistance area around 98 and move towards 99-99.20 level. Today's high is at 99.07 and the weekly RSI continues to diverge.
Black line - major support trend line Red rectangle - resistance (broken) The Dollar index has broken above a multi month resistance area where prices got rejected several times. This time the break is real and prices move towards 99 as expected. Trend remains bullish and the break above the 61.8% Fibonacci retracement is a big win for bulls. As long as price is above 98-97.70 bulls remain in control of the trend. The weekly RSI is testing important resistance area. The RSI does not confirm the new high by price. Traders should not ignore this bearish divergence. This is not a reversal signal but only a warning. The material has been provided by InstaForex Company - www.instaforex.com |
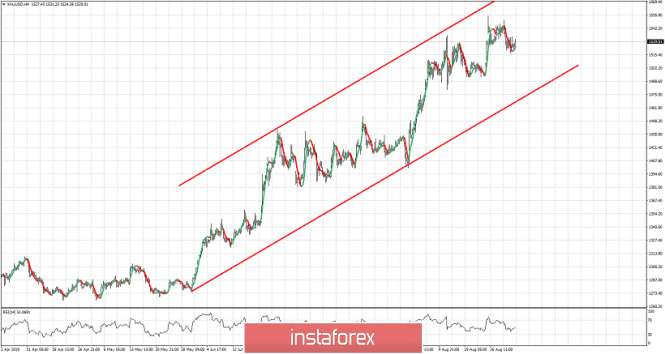
| Gold remains in a bullish trend Posted: 02 Sep 2019 12:09 PM PDT Gold price pulled back as low as $1,516 (respecting the $1,500-$1,490 support area) and is now trying to continue its up trend towards our target of $1,570 which is the 161.8% Fibonacci extension of the August 2018 to February 2019 rise.
Red lines - bullish channel Gold price continues to make higher highs and higher lows. Short-term trend remains bullish as long as price is above $1,500-$1,490 and inside this bullish channel. Support is found at $1,515 and next at $1,500. Resistance is at $1,533 and next at $1,550. As we mentioned in our previous post, Gold price could continue higher towards $1,570, however bulls should be cautious and protect their long positions by raising stops, as there are bearish divergence signs in the RSI. A new higher high around $1,570 with another bearish divergence in the 4 hour RSI would be ideal for at least a short-term top. The material has been provided by InstaForex Company - www.instaforex.com |
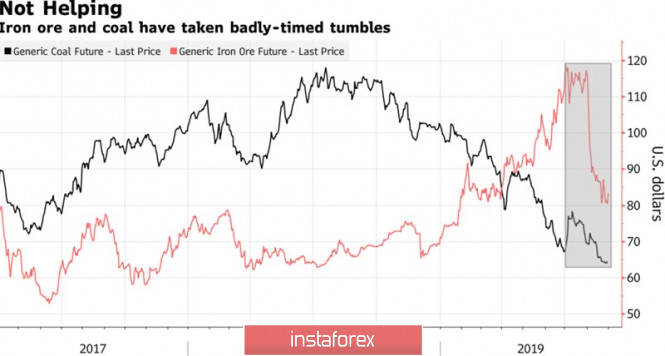
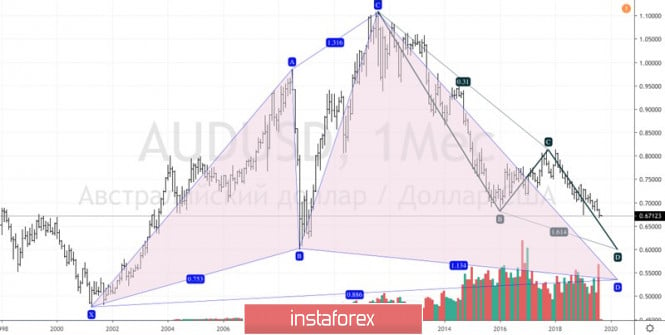
| The Central Bank will put the "Australian" on pause Posted: 02 Sep 2019 08:14 AM PDT Talks about the resumption of trade negotiations between the US and China, as well as the serious package of macroeconomic statistics, (including data on foreign and retail trade, GDP) and the meeting of the Reserve Bank, are forcing investors to look closely at the Australian dollar. In late August, he was marked by a fall to a 10-year-old bottom relative to his American namesake but the situation could change in September. The green continent can get rid of the double deficit, budget and current account for the first time since 1975 and the reasons for this must be sought in the rapid growth of the assets of the commodity market and the devaluation of "Aussie". Over the past 12 months, the AUD/USD pair has lost about 7% of its value. At the same time, iron ore soared in the spring to the level of $120 per ton, which was the maximum for several years. Budget revenues increased and export earnings. Dynamics of coal and iron ore Improving the state of the budget and foreign trade is one of the important arguments in favor of a pause in the process of monetary expansion of the RBA. In June and July, the Reserve Bank lowered its basic interest rate to a historically low level of 1%, and now it needs to see how the economy of the Green Continent responds to the weakening of monetary policy. The derivatives market believes that the pause will be short-lived (by March 2020), the cash rate may drop to 0.5% amid continuing trade tensions between the US and China. The Central Bank itself does not exclude a fall in borrowing costs to 0.25-0.5% and the area from which, its colleagues from the United States, Canada and Britain usually began to raise rates. Nomura believes that there is a 40% chance of using unconventional monetary policy measures, including an asset purchase program. In August, iron ore prices were the worst dynamics in history due to a reduction in demand from Chinese consumer plants and a solution to supply problems from Brazil. This circumstance, coupled with the escalation of the conflict between Washington and Beijing and the RBA's intention to continue to weaken monetary policy, made the outsider G10 out of the Australian dollar. Only the Scandinavian currencies and the "New Zealander" look worse than him, whose Central Bank decided to reduce the rate by 50 bp immediately during one meeting. Despite the fact that RBA deputy governor, Guy Debelel, believes that AUD/USD pair may fall to 0.5 due to external factors, improving the economy of the Green Continent and increasing the sensitivity of US GDP to trade wars can help fans of the "Australian" find the bottom. In particular, the passivity of the Reserve Bank in September, strong data on the gross domestic product of the Green Continent and weak statistics on the American labor market can lead to an increase in the analyzed pair. Technically, the harmonious trading patterns AB=CD and "Shark" signal that the pair may collapse to 0.6 and 0.53 on the monthly AUD / USD chart. However, in my opinion, this will require a recession in the US and a significant slowdown in the Chinese economy. If the bulls manage to close September above 0.685, the risks of correction will increase. AUD / USD monthly chart |
| September 2, 2019 : GBP/USD Intraday technical analysis and trade recommendations. Posted: 02 Sep 2019 07:53 AM PDT
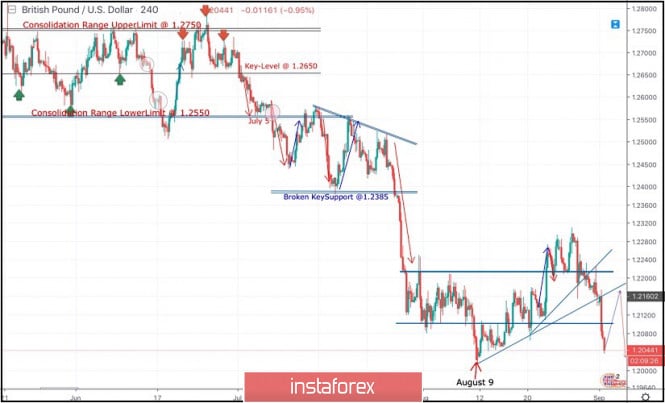
On July 5, a consolidation range bearish breakout was demonstrated below 1.2550 corresponding to the lower limit of the depicted consolidation range. Moreover, Bearish breakdown below 1.2385 (Prominent Bottom) facilitated further bearish decline towards 1.2320, 1.2210 and 1.2100 which corresponded to significant key-levels on the Weekly chart. In Early August, a temporary consolidation-range was established above 1.2100 before August 9 when temporary bearish movement was executed towards 1.2025. Recent bullish recovery was demonstrated off the recent bottom (1.2025). This brought the GBP/USD pair back above 1.2100 (Lower limit of the recently established consolidation-zone). As expected, further bullish advancement was demonstrated towards 1.2230 then 1.2280 where recent bearish rejection was demonstrated. Bullish persistence above 1.2160 (the recent consolidation range pivot-point) was needed to enhance further bullish advancement towards 1.2320 then 1.2380. However, recent bearish rejection was demonstrated around 1.2215 (backside of the depicted broken uptrend line). That's why, another bearish decline is currently taking place towards 1.2050. Thus, challenging the recent weekly bottom established on August 9. Trade Recommendations: Conservative traders are advised to wait for a bullish pullback towards 1.2160 for a valid SELL entry. T/P level to be placed around 1.2100 and 1.2020, while S/L should be placed above 1.2220. The material has been provided by InstaForex Company - www.instaforex.com |
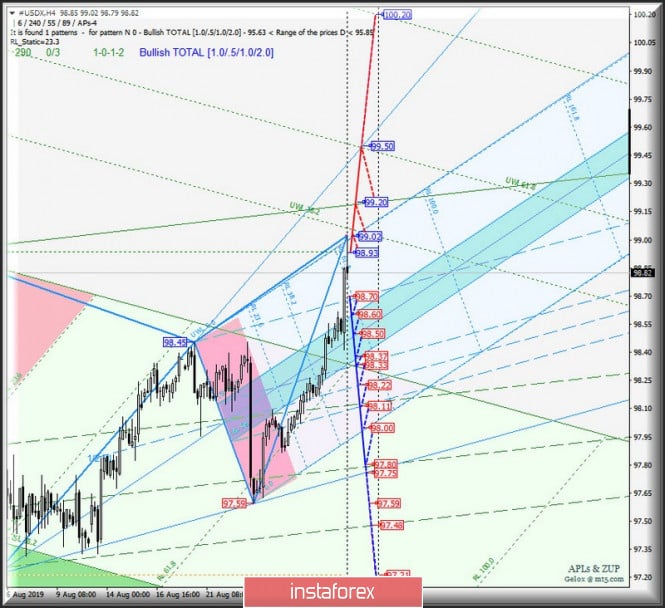
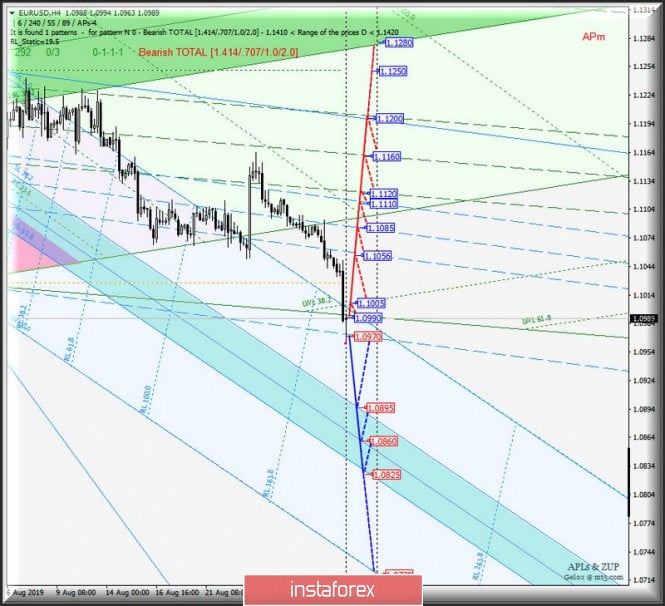
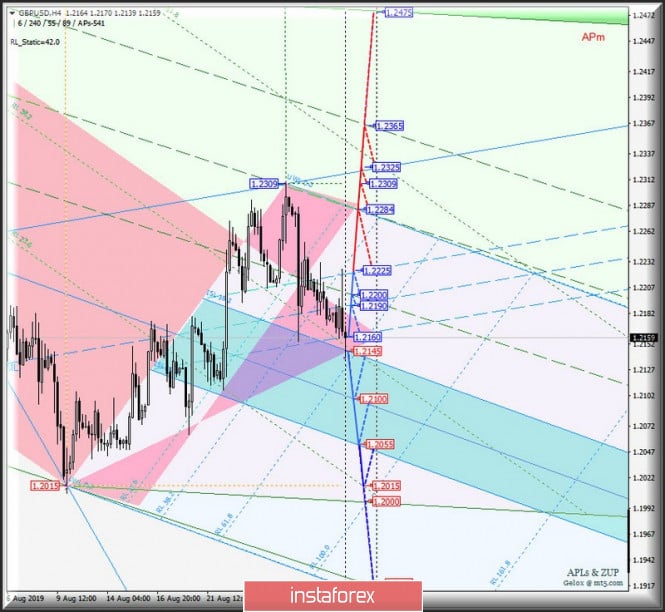
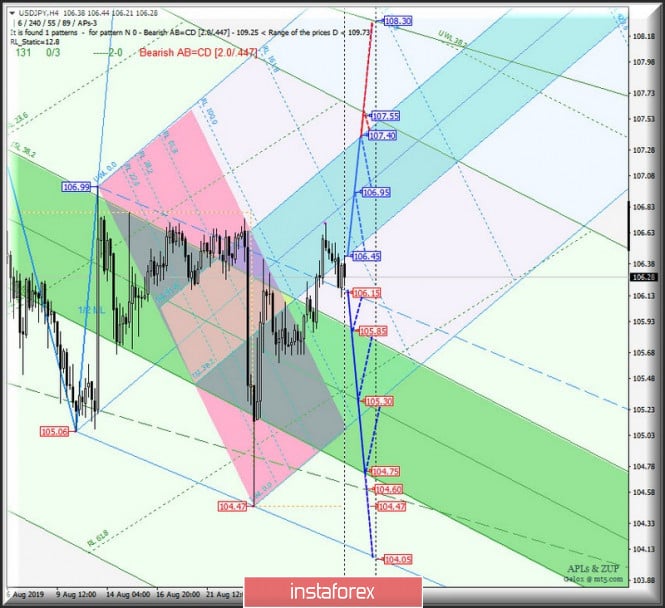
| Posted: 02 Sep 2019 07:42 AM PDT What the first month of autumn prepares for us is a comprehensive analysis of the options for the movement of currency instruments, particularly #USDX, EUR/USD, GBP/USD and USD/JPY pairs from September 1, 2019. Minute Operational Scale (H4 timeframe ) Previous review on #USDX, EUR / USD, GBP / USD of 08/29/2019 17:37 UTC + 3 US dollar index The direction of breakdown range : The resistance level is at 98.93 (local maximum); The support level is at 98.70 (final Schiff Line Minuette operational scale pitchfork), which will determine the development of the movement of the dollar index #USDX from September 1, 2019. Breakdown of support level at 98.70 (the final Minuette Schiff Line) is an option for the development of the downward movement of the dollar index to the borders of the equilibrium zone (98.60 - 98.50 - 98.37) and channel at 1/2 of the Median Line (98.33 - 98.22 - 98.11) forks of the Minuette operational scale with the prospect of achieving the initial SSL Minuette (98.00) and 1/2 Median Line Minute ( 97.80) lines. The upward movement of #USDX can be continued with the upgrade of maximum`s 98.93 and 99.02, and it will be directed to the goals - control line UTL (99.20) forks Minuette operational scale- control line UTL (99.50) forks Minuette operational scale. Details of the #USDX movement are presented in the animated chart. ____________________ Euro vs US Dollar The movements of the single European currency against the dollar from September 1, 2019 will also receive its development depending on the direction of the breakdown of the range: The resistance level is at (control line LTL Minuette operational scale pitchfork); The support level is at (final Schiff Line Minuette operational scale pitchfork) A breakdown of the resistance level at 1.09905 (control line LTL forks of the operational scale Minute) followed by a breakdown of the warning line LWL38.2 Minute (1.1005) will determine the development of the upward movement of the single European currency to the channel boundaries 1/2 Median Line forks of the operational scale - Minuette (1.1056 - 1.1085 - 1.1110) and Minute (1.1120 - 1.1160 - 1.1200). Breakdown of the final Schiff Line Minuette (support level of 1.0970) will make it relevant to continue the downward movement of the EUR/USD pair to the borders of the equilibrium zone (1.0895 - 1.0860 - 1.0825) forks of the Minuette operational scale. Details of the EUR/USD movement options are shown in the animated chart. ____________________ Great Britain Pound vs US Dollar As with previous currency instruments, the development of GBP/USD currency movement from September 1, 2019 will depend on the direction of the breakdown of the range : The resistance level is at 1.2160 (lower boundary of the channel 1/2 Median Line Minuette); The support level is at 1.2145 (upper limit of the ISL38.2 equilibrium zone of the forks of the Minuette operational scale) In case of a breakdown of the resistance level at 1.2160, the GBP/USD movement will again occur inside the 1/2 Median Line Minuette channel (1.2160 - 1.2190 - 1.2225), If the upper boundary (1.2225) of this channel is broken, the upward movement of this instrument can continue to the targets - the initial line SSL ( 1.2284 ) forks of operational scale Minuette, which coincides with 1/2 Median Line Minute - local maximum 1.2309 - control line UTL Minuette (1.2325) - upper boundary of the channel 1/2 Median Line Minute (1.2385). In case of breakdown of ISL38.2 Minuette (support level 1.2145), the GBP/USD movement will continue in the equilibrium zone (1.2145 - 1.2100 - 1.2055) forks of the Minuette operational scale with the prospect of reaching and updating the minimum of 1.2015. Details of the GBP/USD movement can be seen on the animated chart. ____________________ US Dollar vs Japanese Yen The development of the currency movement of the "country of the rising sun" USD/JPY from September 1, 2019 will also be determined by the direction of the breakdown of the range: The resistance level is at 106.45 (lower boundary of ISL38.2 equilibrium zone of forks of Minuette operational scale); The support level is at 106.15 (final Schiff Line Minuette) The breakdown of the support level 106.15 (the final Schiff Line Minuette) will direct the USD/JPY movement to the equilibrium zone (105.85 - 105.30 - 104.75) forks of the Minuette operational scale. With the breakdown of ISL38.2 Minuette (resistance level of 106.45), the development of the currency of the "rising sun country" will continue in the equilibrium zone (106.45 - 106.95 - 107.40) of the Minuette operational scale forks with the prospect of reaching the SSL start line (107.55) of the Minute operational scale. We look at the details of the USD/JPY movement on the animated chart. ____________________ The review is made without taking into account the news background, the opening of trading sessions of the main financial centers and it is not a guide to action (placing orders "sell" or "buy"). The formula for calculating the dollar index: USDX = 50.14348112 * USDEUR0.576 * USDJPY0.136 * USDGBP0.119 * USDCAD0.091 * USDSEK0.042 * USDCHF0.036. where the power coefficients correspond to the weights of the currencies in the basket: Euro - 57.6% ; Yen - 13.6% ; Pound Sterling - 11.9% ; Canadian dollar - 9.1%; Swedish Krona - 4.2%; Swiss franc - 3.6%. The first coefficient in the formula leads the index to 100 at the start date of the countdown on March 1973, when the main currencies began to be freely quoted relative to each other. ZUP and Andrews Pitchfork (terms, concepts, parameters). ZUP & APL`s Analysis Study Materials. The material has been provided by InstaForex Company - www.instaforex.com |
| American currency strengthens its position Posted: 02 Sep 2019 07:33 AM PDT Currently, the trend to strengthen the US dollar is developing in the financial markets. In many ways, this contributes to the next round of the trade war between Washington and Beijing. The US dollar index also shows peak values, experts said. The American currency rises in relation to the majority of world currencies. Analysts believe the inflow of capital into the United States from a number of American investors seeking to secure their assets is the reason for this. As a result, the US dollar index, considering the ratio of the US currency to a basket of major currencies and the main trading partners of America, has skyrocketed since May 2017. This is the most significant weekly increase over the past 16 months, analysts emphasized. At the moment, the EUR/USD pair has overcome an important psychological milestone at the level of 1.10. On Monday, September 2, experts recorded a recovery of purchases in the EUR/USD. Experts are sure that a similar trend indicates that the main battle for the 1.1000 mark is yet to come. Some experts believe that the growth of the US dollar index is largely due to the weakening of the European currency. However, further strengthening of the US currency is quite possible. Cancellation of the "bullish" scenario may be the return of the index quotes to the support level of 98.65. In the EUR/USD pair, a breakout to the support of 1.1065–1.1070 will provoke a strong wave of sales and as a result, it will open the possibility to achieve targets of 1.1025 and 1.1000. At the moment, the psychological support level of 1.1000 has been broken. In this regard, experts predict a further weakening of the pair in the long term. The global "bearish" scenario remains the main one until quotes return above the level of 1.1070, analysts emphasized. Weak indicators from the US can hold back the strengthening of the American currency and provoke its rollback after the previous growth. However, an upward trend in the US dollar index is possible in the long term, experts assured. The current trend to strengthen the US currency may further develop. Experts concluded that support will be provided by tough trade rhetoric of the US Federal Reserve and growing concern about the global economic growth rate. The material has been provided by InstaForex Company - www.instaforex.com |
| September 2, 2019 : EUR/USD Intraday technical analysis and trade recommendations. Posted: 02 Sep 2019 07:22 AM PDT
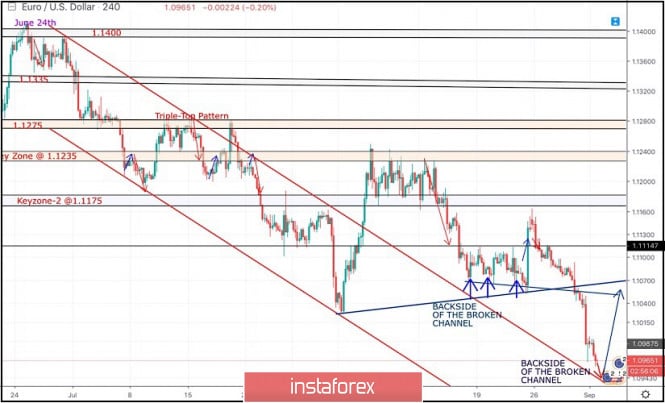
Back in June 24, the EURUSD looked overbought around 1.1400 facing a confluence of supply levels which generated significant bearish pressure over the pair. Shortly after, In the period between 8 - 22 July, a sideway consolidation-range was established between 1.1200 - 1.1275 until a triple-top reversal pattern was demonstrated around the upper limit. Then, Evident bearish momentum (bearish engulfing H4 candlestick) could bring the EURUSD below 1.1175. This facilitated further bearish decline towards 1.1115 (Previous Weekly Low) then 1.1025 (the lower limit of the depicted recent bearish channel) where significant signs of bullish recovery were demonstrated. Shortly-After in Mid-August, the EUR/USD has been trapped between 1.1235-1.1175 for a few trading sessions until bearish breakout below 1.1175 occurred on August 14. Bearish breakout below 1.1175 promoted further bearish decline towards 1.1075 where the backside of the broken bearish channel has provided temporary bullish demand for sometime (Bullish Triple-Bottom pattern). Bullish persistence above 1.1115 was needed to confirm the short-term trend reversal into bullish. However, the depicted Triple-Bottom pattern was invalidated especially after the EURUSD pair bulls have failed to establish Bullish persistence above 1.1115. Moreover, the recently established short-term uptrend line has been invalidated as well. This turned the short-term outlook as bearish. By the end of last week's consolidations, a quick bearish decline was demonstrated towards 1.0980-1.0965 where the backside of the broken channel comes to meet the EURUSD pair again. Trade recommendations : Risky traders are advised to look for a valid BUY entry anywhere around the current price levels down to 1.0950. T/p levels to be located around 1.1015 and 1.1050. Conservative traders should wait for bullish pullback towards 1.1050-1.1070 for a valid SELL entry. S/L should be placed just above 1.1095 while target levels can be determined later based on theupcoming price action. The material has been provided by InstaForex Company - www.instaforex.com |
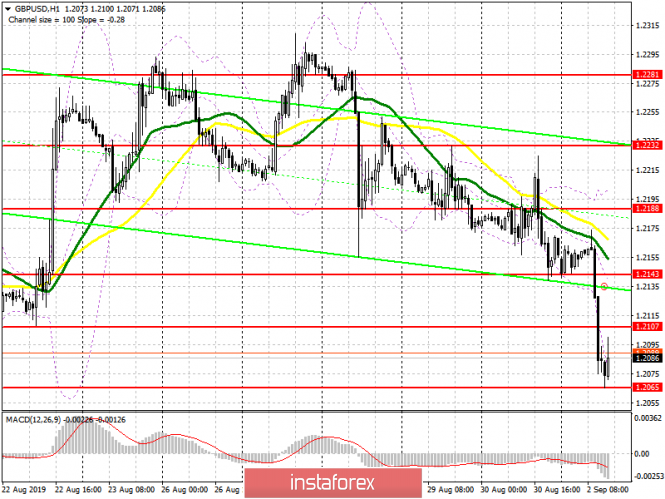
| To open short positions on GBP / USD pair, you need: Posted: 02 Sep 2019 07:17 AM PDT To open long positions on GBP / USD pair, you need: The report on a sharp decline in manufacturing activity in the UK put pressure on the British pound. Furthermore, the breakthrough of quite important support levels led to the triggering of stop orders of buyers and a larger downward movement of the pound. Currently, buyers have managed to stop the decline in the GBP/USD pair in the support area of 1.2065, but it is too early to talk about a larger upward correction. While trading is conducted above the range of 1.2065, albeit, the chance to strengthen the pound remains very small. However, it is best to rely on larger long positions after updating the lows of 1.2018 and 1.1985. The main objective of the bulls is to close the day above the resistance of 1.2107, from which the growth of the pound may remain until the maximum of 1.2143 is updated, where I recommend taking profits. To open short positions on GBP / USD pair, you need: The pressure of Boris Johnson on conservative deputies of his party, who supports an attempt to block Britain's exit from the EU without an agreement, and weak fundamental data continues to put pressure on the pound. The breakout of the support at 1.2143 has expectedly led to a major sell-off of the pound, which I paid attention to in my morning review. At the moment, the bears need a second test of a minimum of 1.2065, which will resume pressure on the GBP/USD pair and will lead to an update of levels 1.2018 and 1.1985. However, the only thing that keeps the pound from a larger fall is so far a day off in the US and Canadian markets in connection with the celebration of Labor Day, which will significantly reduce trading volumes. In an upward correction scenario, it is best to consider short positions in a pound after a false breakdown of resistance 1.2107 or on a rebound from a maximum of 1.2143. Signals of indicators: Moving averages Trade is conducted below 30 and 50 moving averages, which indicates a return of the sellers to the market. Bollinger bands In the case of pound growth, the upward potential will be limited by the average border of the indicator in the region of 1.2145. Description of indicators MA (moving average) 50 days - yellow MA (moving average) 30 days - green MACD: Fast EMA 12, Slow EMA 26, SMA 9 Bollinger Bands 20 The material has been provided by InstaForex Company - www.instaforex.com |
| Posted: 02 Sep 2019 07:17 AM PDT To open long positions in the EUR/USD pair, you need: In the morning forecast, I drew attention to the divergence formed on the MACD indicator and the support level of 1.0955, from which I recommended to open long positions in the euro. The purchase scenario worked out completely. While trading is above the range of 1.0955, we can expect the EUR/USD pair to return to the resistance area of 1.0982, where I recommend taking profits. Fixation above this level will lead to a larger upward correction to a maximum of 1.1010. If the bears return to the market in the afternoon, which is unlikely amid the day off and activity on the US and Canadian markets will be very low, it is best to count on new long positions after updating the minimum of 1.0927. To open short positions in the EUR/USD pair, you need: Euro sellers expectedly took advantage of the weak report on activity in the manufacturing sector of the eurozone and sold the euro below the support of 1.0982, which I also paid attention to in the morning. However, it was not possible to break through the first time below the minimum of 1.0955. Currently, the main task of the euro sellers is to retest this area, which is likely to lead to its breakthrough and a further downward movement of the pair in the region of lows 1.0927 and 1.0900, where I recommend taking profit. If the demand for the euro remains in the afternoon against the backdrop of a weekend in the US, it is best to count on short positions after a false breakdown in the resistance area of 1.0982 or a rebound from a maximum of 1.1010. Signals of indicators: Moving averages Trading is below 30 and 50 moving averages, which indicates a bear market. Bollinger bands In case of growth of the euro, the upside potential of the indicator will be limited by the upper border of the indicator in the region of 1.1000. Description of indicators MA (moving average) 50 days - yellow MA (moving average) 30 days - green MACD: Fast EMA 12, Slow EMA 26, SMA 9 The material has been provided by InstaForex Company - www.instaforex.com |
| BTC 09.02.2019 - Sell zone for Bitcoin Posted: 02 Sep 2019 07:12 AM PDT Bitcoin 1H time-frame:
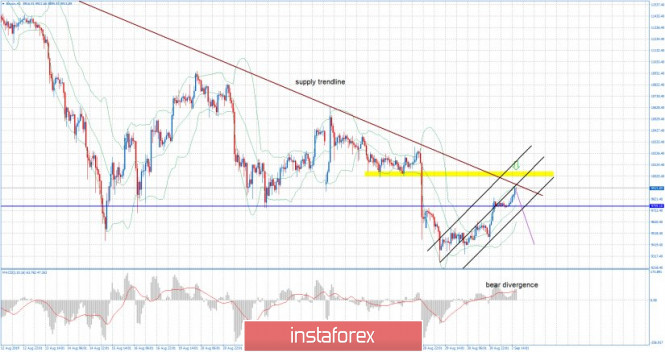
Yellow rectangle – Major resitance Pink trendline – Expected path Brown trendline – Supply-Resitance trendline Bitcoin on the 1-hour is testing the key supply trend line. I do expect potential end of the upward correction in near future. I didn't find any major reversal activity in the background and that is why I still see more potential for the downside. Major resistance is set at the price of $10,000. I also found the bearish divergence in creation on the MACD oscillator, which is another indication for the further downside. Bitcoin Forecast and recommendations for traders: Bitcoin is in overall consolidation phase but most recently I found test of the major resistance, which is sign that there is chance for more downside and potential of $9,727 or $9,106. Thus, I recommend selling crypto currency with a target of $9,270, with a Stop Loss level of $10,700. The material has been provided by InstaForex Company - www.instaforex.com |
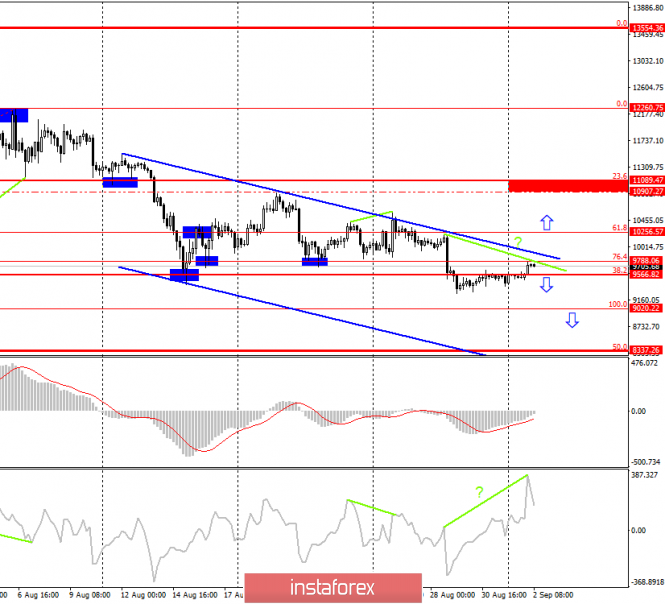
| Bitcoin trading strategy for September 2: A good opportunity to sell bitcoin Posted: 02 Sep 2019 06:56 AM PDT 4H - Bitcoin Bitcoin was quiet and calm at the weekend. After the quotes of the "cue ball" closed below the Fibo level of 38.2% - 9566%, the bears decided to take a short pause, and the cryptocurrency went into a two-day correction. However, now we have a brewing bearish divergence near the CCI indicator and a possible rebound from the correction level of 76.4% at $9788, from which BTC had already performed two rebounds, as well as finding the cryptocurrency near the top line of the trend equidistant channel (which in itself is a good place for sales). Thus, I expect the cryptocurrency to close below the Fibo level of 38.2%, which will confirm the intention of traders to resume sales of the main cryptocurrency on September 2. From my point of view, it will be possible to buy bitcoin not earlier than closing above the trend channel and a correction level of 61.8% at $10,256. At the same time, the famous technical analyst, John Bollinger, who created the indicator of the same name, warns traders about a possible global reversal. According to him, the signal for a long-term decline has not yet been confirmed but everything is going to ensure that Bitcoin will begin to fall in the coming weeks. The potential reduction is $4000 - $5000. Also, John Bollinger notes that the bulls have about a week to change the situation. If this week becomes "bullish", then change in scenario is possible. In turn, we can add that in order for the week to become "bullish" and a close above the trend channel and the level of $ 10256 is just necessary. The Fibo grid was built at the extremes of July 17, 2019, and August 6, 2019. Bitcoin Forecast and recommendations for traders: Bitcoin has completed preparing for a new drop in value. I recommend selling cryptocurrency if there is a rebound from the level of 76.4% at $ 9788 with targets of $9020 (100.0% Fibo) and $8337 (50.0% Fibo senior). I recommend buying bitcoin with a view to the area of $10907-$11089 with a Stop Loss at the level of $10256 if closing occurred above the correction level of 61.8%. The material has been provided by InstaForex Company - www.instaforex.com |
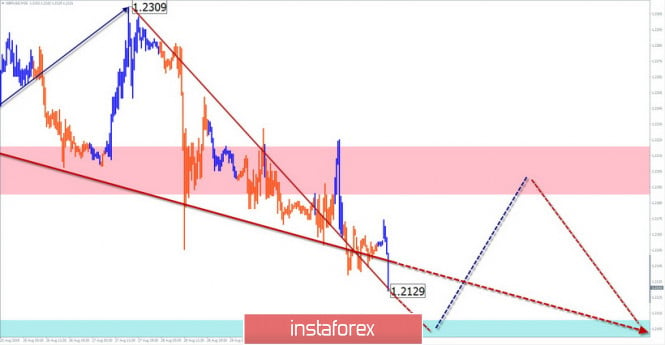
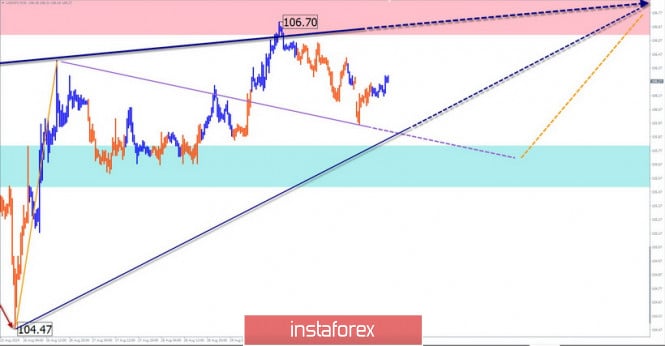
| Wave analysis for GBP and JPY on September 2: The weakening trend against the dollar continues Posted: 02 Sep 2019 06:56 AM PDT GBP / USD pair A wave analysis of the last section of the British currency chart shows the beginning of the formation of a bearish wave. The potential reversal pattern looks like an expanding triangle. Meanwhile, the previously expected internal correction reached only the lowest possible level. Forecast: Today, the development of the described construction is expected to continue with a downward vector of the main course of movement. At the next session, a short-term rise in the price of a major is not ruled out. The range of daily fluctuations is limited by inverse zones. Recommendations: At the next trading sessions, it is recommended to give priority to pound sales. It is more reasonable for supporters of longer transactions to refrain from bidding until the upcoming rollback is completed and clear sell signals appear. Resistance Zones: - 1.2190 / 1.2220 Support Areas: - 1.2110 / 1.2080 USD / JPY pair Since August 6, a rising wave has been developing on the chart of the Japanese yen. The first 2 parts (A + B) are formed in its structure. From August 26, the initial zigzag of the final part (C) is formed. In recent days, the price has been rolling back. Forecast: Today, a continuation of the downward course is expected, until the complete completion of the entire current correction. Price reduction is likely no further than estimated support. By the end of the day, the chance of a price rise begins to increase. Today, a continuation of the downward course is expected until the complete completion of the entire current correction. Price reduction is likely no further than estimated support. By the end of the day, the chance of a price rise begins to increase. Recommendations: Sales carry a high degree of risk and they should reduce the working lot. It is more promising to refrain from trading for the duration of the downward move and to look for buy signals in the support area of the pair. Resistance Zones: - 106.60 / 106.90 Support Areas: - 105.80 / 105.50 Explanations to the figures: The simplified wave analysis uses waves consisting of 3 parts (A – B – C). Each of these analyzes the last incomplete wave. Zones show calculated areas with the highest probability of reversal. The arrows indicate the wave marking by the method used by the author. The solid background shows the formed structure and the dotted exhibits the expected movement. Note: The wave algorithm does not take into account the duration of tool movements over time. The material has been provided by InstaForex Company - www.instaforex.com |
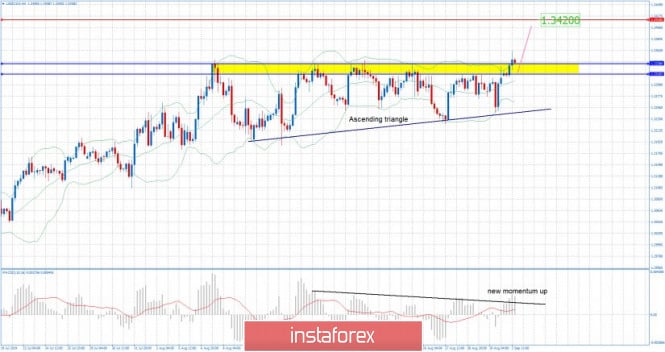
| USD/CAD analysis for September 02, 2019 - Breakout of the Acending triangle Posted: 02 Sep 2019 06:55 AM PDT USD/CAD has been trading upwards. The price tested the level of 1.3360. I still expect more upside and potential test of 1.3420.
Red horizontal line – Important resistance and upward objective Yellow rectangle - major support area Pink rising line – Expected path MACD oscillator is showing new momentum up, which is good confirmation for the further upside. Key support is at 1.3330 and 1.3320 and resistance at 1.3420. Bears need to be very cautious as there is strong upward momentum in the background and the breakout of the 20-day ascending triangle, which is another good confirmation for the upside. Watch for buying opportunities on the dips with the main target at 1.3420. The material has been provided by InstaForex Company - www.instaforex.com |
| Gold is not afraid of volatility Posted: 02 Sep 2019 06:49 AM PDT Active growth in the price of yellow metal is the leading trend in recent months. According to analysts, its value has increased by 20% since the beginning of the year, breaking the mark of $1,500 per 1 ounce. Experts believe that the concern about the escalation of the trade conflict between the United States and China is the reason for this. If the global economic situation worsens and macroeconomic indicators decline, investors "run" into gold, preferring it to other safe assets. The precious metal is also supported by a reduction in interest rates by the US Federal Reserve. At the same time, investors are actively acquiring not only physical gold but also shares of "gold" ETF funds, which are backed by the yellow metal. What interests them are papers of gold mining companies such as Barrick Gold. Wall Street currency strategists expect the gold price rally to continue. Therefore, the $1,600 per ounce bar will be overcome sooner or later. Most investors are concerned about the state of the global economy and the financial system, hence, precious metals are becoming very much in demand as a safe haven asset. It is with the help of gold that market participants seek to preserve their capital. According to analysts, the probability of overcoming the mark of $1,600 per 1 troy ounce is very high as a new uptrend has formed in the gold market. Experts believe that we are on the verge of forming another bull market. Deutsche Bank experts are confident that the purchase of gold from leading regulators will be one of the main supporting factors for the yellow metal. Central banks seek to diversify the international reserves of their countries in order to minimize risks in the event of a crisis. In the short term, support for gold prices will have the activity of private investors and traders and the policy of world regulators in the long term, experts say. |
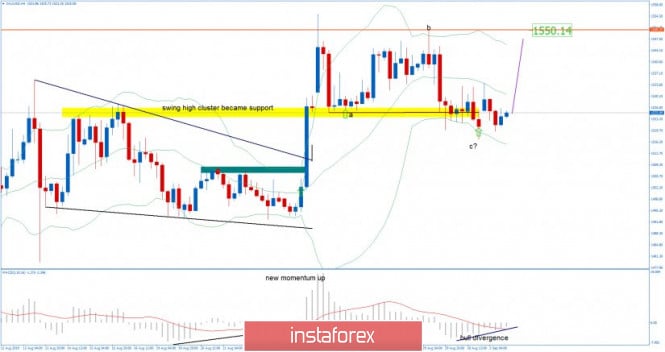
| Gold 09.02.2019 - Gold in the buy zone, more upside in play Posted: 02 Sep 2019 06:42 AM PDT Gold has been trading sideways at the price of $1525. Anyway, I still expect more upside and at least another upward swing. Key support at the price of $1,525.00 held successfully many times, which is good positive sign for further upside continuation.
Red horizontal line – Important resistance and upward objective Yellow rectangle - major support area Purple rising line – Expected path Nothing changed since my previous forecast. MACD oscillator is showing bullish divergence, which is good confirmation for upside and I do expect at least another push higher. Key support is at $1,525 and resistance at $1,554. Bears need to be very cautious as there is strong upward momentum in the background and potential buying the deep type of feeling. As long as the Gold is holding above $1,525 there is a chance for potential test of $1,554. Don't forget that short-term and long-term trends are bullish.The material has been provided by InstaForex Company - www.instaforex.com |
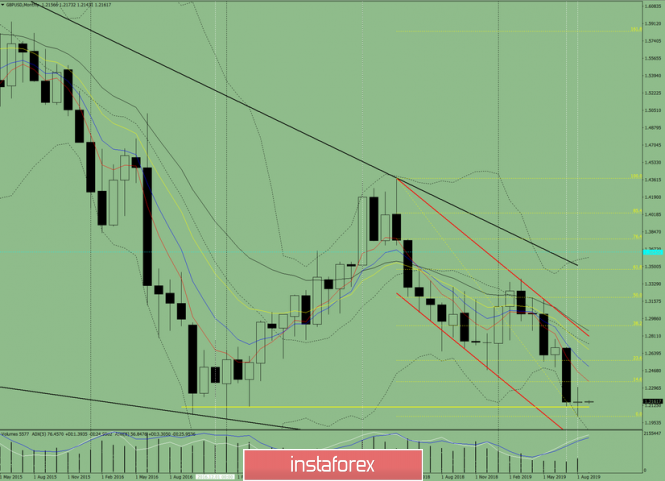
| Technical analysis of the GBP/USD currency pair for September 2019 Posted: 02 Sep 2019 06:10 AM PDT The price is moving downward in August, testing the historical support level of 1.2107 (yellow bold line) and after that, the price went upward in a pullback. After an uptrend for the past two weeks, the price almost reached a pullback level of 14.6% at 1.2308 (yellow dashed line). After the intervention of the fundamental analysis, the price has been moving downward again last week. As a result, the monthly candle closed with a Doji. Trend analysis In September, it is possible to move upward with the first target of 1.2356 with a retreating level of 14.6% (yellow dashed line). Fig. 1 (monthly chart). Indicator Analysis: - indicator analysis - up; - Fibonacci levels - up; - volumes - up; - candlestick analysis - up; - trend analysis - up; - Bollinger Lines - up; Conclusion on a comprehensive analysis - the upper hand is possible. According to the monthly chart, the total result of calculating the GBP/USD candle currency pair: the price will most likely have an upward trend with the absence of the first lower shadow (the first week of the month is white) and the absence of the second upper shadow (last week is white). The material has been provided by InstaForex Company - www.instaforex.com |
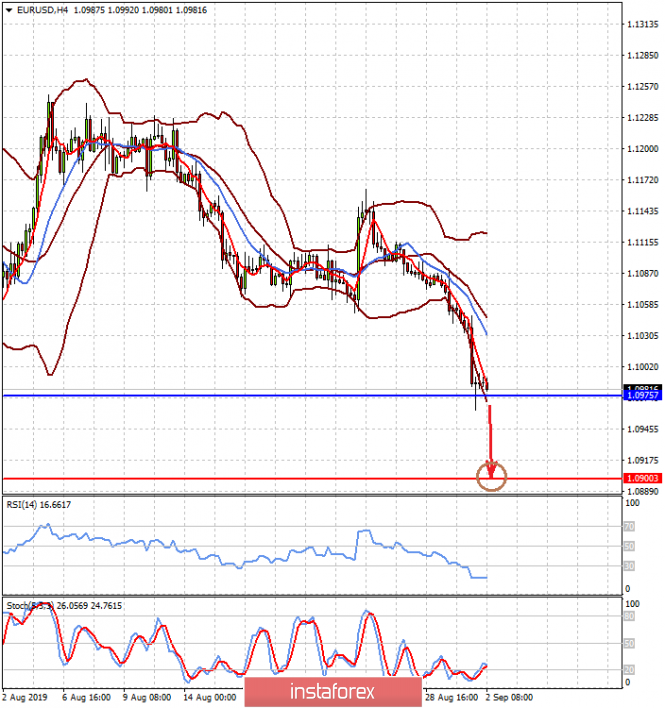
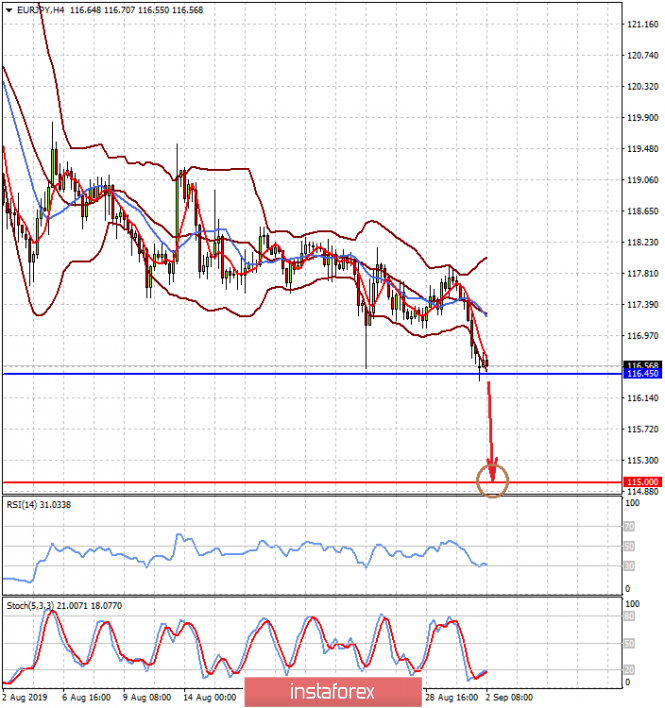
| Posted: 02 Sep 2019 06:09 AM PDT The foreign exchange markets still characterized by low investor activity last week amid the continuing uncertainty of the prospects for a trade war between the United States and China, despite the informational stuff from Donald Trump about the resumption of negotiations with the Chinese side, as well as confirmation of this fact from Beijing. On September 1, Washington and Beijing introduced previously announced trade duties. The states raised duties on Chinese imports in the amount of 112 billion dollars and after this, China almost immediately increased the rate of duties on US imports by 75 billion dollars. In addition, Washington is also expected to increase customs duties by 15% by the end of this year on goods from the "heavenly places" with a total value of $ 160 billion. In general observation of everything that happens, we can say that the hopes of the markets to possibly alienate the fact of a large-scale trade war did not come true. As we pointed out earlier, it seems that before the parties make a mutual compromise, they will test their strength economic "weapons" on the enemy, and only then, weakening in the mutual struggle, they will go to each other to meet. As it seems to us, this will not happen soon. In the foreign exchange market last week, the only noticeable event was the collapse of the single European currency against the Japanese yen and the US dollar. The drop at the moment was more than 1%. What caused this unexpected fall? The reason for this was the commentary of some representatives of the ECB namely, Sabine Lautenschlager, Elizabeth Holtzman, and Olli Rehn, who made it clear that there are serious contradictions in the European regulator in the views on the future of incentive measures. ECB board member Lautenschlager and Austrian new head Holtzman said they still doubt the need for incentive measures. At the same time, their colleague, Rehn, said in his commentary that the ECB is ready for decisive measures to support the European economy amid a decline in economic activity, which, by the way, is already noted. In fact, he made it clear that incentive measures would be taken. Investors in this situation are frightened by the lack of a unified view in the bank on solving economic problems in the region, which caused the euro to collapse. Assessing the overall picture in the markets, we believe that this will locally support the demand for protective assets, including the US dollar. Regarding the prospects for the dynamics of the euro, we expect a continued local decline, especially when paired with the US dollar. Forecast of the day: The EUR/USD pair has every chance to continue to fall in the wake of the growth of pessimism in the markets and discord in the ECB regarding the prospects of monetary policy. A pair falling below 1.0975 may continue to fall to 1.0900. The EUR/JPY pair also has prospects for a fall on the wave of the above reasons. We believe that its decline below the level of 116.45 will lead to its fall to 115.00. |
| You are subscribed to email updates from Forex analysis review. To stop receiving these emails, you may unsubscribe now. | Email delivery powered by Google |
| Google, 1600 Amphitheatre Parkway, Mountain View, CA 94043, United States | |








No comments:
Post a Comment