
Forex analysis review |
- #USDX vs EUR / USD vs GBP / USD vs USD / JPY. Comprehensive analysis of movement options from September 24, 2019 APLs &
- Pound at a loss, but does not lose optimism
- GBP/USD: Johnson still has no clear plan, is it too early to sell the pound?
- Gold: will the precious metal rally continue?
- Yen came with trump cards
- EUR/USD. ECB Head Mario Draghi: Show Must Go On
- GBP/USD. September 23. Results of the day. Michel Barnier: 'Difficult to see' how brexit deal can be reached
- EUR/USD. September 23. Results of the day. Euro currency: entry into a new downward trend
- EURUSD: Horrible manufacturing activity in the eurozone is another sign of economic recession
- BTC 09.23.2019 -First objective has been met, more downside on break
- September 23, 2019 : GBP/USD Intraday technical analysis and trade recommendations.
- EUR/USD for September 23,2019 - Broken 5-day tranding range on the downside, more selling yet to come
- September 23, 2019 : EUR/USD Intraday technical analysis and trade recommendations.
- Gold 09.23.2019 - Breakout of the symmetrical triangle, up trend continues
- Trading recommendations for the EURUSD currency pair – placement of trade orders (September 23)
- Trading recommendations for the GBP/USD currency pair on September 23: placement of trade orders
- Swiss Franc Special Path: Strengthening and Rallying
- EUR/USD: plan for the American session on September 23rd. Data on manufacturing activity collapsed the euro
- GBP/USD: plan for the American session on September 23rd. The pound continues to lose ground, and the bulls missed an important
- You should not expect noticeable changes in the foreign exchange markets in the near future (We anticipate a continued decline
- Review of EUR/USD and GBP/USD pairs on 09/23/2019: Confused who has a recession
- Saudi Arabia sets the tone -a year without cheap oil?
- Technical analysis of EUR/USD for September 23, 2019
- Trading strategy for GBP/USD on September 23rd. Britain is increasingly overwhelmed by the political crisis
- Trading strategy for EUR/USD on September 23rd. Business activity in Germany knocked out euro
| Posted: 23 Sep 2019 05:34 PM PDT Let us consider, in a comprehensive manner, how the development of the movement of currency instruments #USDX, EUR / USD, GBP / USD and USD / JPY will begin from September 24, 2019. Minuette (H4 time frame) ____________________ US dollar index The development of the #USDX dollar index movement from September 24, 2019 will be due to the development and direction of the breakdown of the boundaries of the 1/2 Median Line channel (98.95 - 98.75 - 98.53) of the Minuette operational scale fork. The movement marking inside this channel is shown in the animated chart. If the upper boundary of the 1/2 Median Line channel (resistance level of 98.95) of the Minuette operational scale fork is broken, it will be possible to continue the development of the upward movement of the dollar index to the targets - warning line UWL38.2 Minuette (99.30) - maximum 99.37 - control line UTL Minuette (99.65). The breakdown of the lower boundary of the 1/2 Median Line Minuette channel (support level of 98.53), in turn, will direct the development of the #USDX movement to the boundaries of the 1/2 Median Line Minuette channel (98.35 - 98.23 - 98.10) with the prospect of reaching the final Schiff Line (97.85) and the upper boundary of ISL38. 2 (97.50) of the Minuette operational scale fork. The details of the #USDX movement are presented in the animated chart. ____________________ Euro vs US dollar The movement of the single European currency EUR / USD from September 24, 2019 will also be determined by the processing and the direction of the breakdown of the boundaries of the 1/2 Median Line channel (1.1010 - 1.0980 - 1.0955) of the Minuette operational scale fork. Look at the animated chart for the details of the marking movement inside this channel. The breakdown of the lower boundary of the 1/2 Median Line channel (support level of 1.0955) of the Minuette operational scale fork will determine the further development of the movement of the single European currency in the equilibrium zone (1.0955 - 1.0927 - 1.0905) Minuette operational scale forks with the prospect of reaching the warning UWL61.8 (1.0870) and LTL control (1.0860) lines of the Minuette operational scale forks. Meanwhile, In case of breakdown of the upper boundary of the 1/2 Median Line channel (resistance level of 1.1010) of the Minuette operational scale fork, it will be possible to develop an upward movement of EUR / USD to the boundaries of the 1/2 Median Line channel (1.1030 - 1.1050 - 1.1070) of the Minuette operational scale, then continue to reach the final Shiff Line Minuette (1.1095) and update the local maximum 1.1110. The details of the EUR / USD movement options is shown in the animated chart. ____________________ Great Britain pound vs US dollar The development of Her Majesty's GBP / USD currency movement from September 24, 2019 will depend on the development and direction of the breakdown of the boundaries of the 1/2 Median Line channel (1.2435 - 1.2390 - 1.2345) of the Minuette operational scale fork. The development markup is presented in the animated graphics. In case of breakdown of the lower boundary of the 1/2 Median Line channel (support level of 1.2345) of the Minuette operational scale fork, it will be important to reach and test GBP / USD of the boundaries of the equilibrium zones of the Minuette operational scale fork (1.2325 - 1.2245 - 1.2165) and Minuette (1.2305 - 1.2220 - 1.2135). On the contrary, if Her Majesty's currency returns above the resistance level of 1.2435 (the upper boundary of the 1/2 Median Line Minuette channel), it will become possible to develop the upward movement of this currency instrument to the goals - local maximum 1.2582 - control line UTL (1.2610) of the Minuette operational scale fork - warning line UWL38. 2 (1.2700) of the Minuette operational scale fork. The details of the GBP / USD movement can be seen on the animated chart. ____________________ US dollar vs Japanese yen The development of the USD / JPY currency movement of the "country of the rising sun" from September 24, 2019 (in fact, as with the above-mentioned currency instruments) will be due to the development and direction of the breakdown of the boundaries of the 1/2 Median Line channel (107.50 - 107.15 - 106.80) of the Minuette operational scale fork. We look at the animated chart for details. The breakdown of the lower boundary of the 1/2 Median Line Minuette channel (support level of 106.80) will make it possible for the currency of the "land of the rising sun" to reach the boundaries of the equilibrium zone (106.65 - 106.10 - 105.60) of the Minuette operating scale fork and 1/2 Median Line Minuette channel (105.80 - 105.35 - 104.85). A combined breakdown of the upper boundary of the 1/2 Median Line channel (resistance level of 107.50) of the Minuette operational scale fork and the upper boundary of ISL38.2 (resistance level of 107.60) of the equilibrium zone of the Minuette operational scale fork will determine the development of the upward movement of USD / JPY and whose goals will be - SSL Minuette start line (108.40) - local maximum 108.50 - UTL Minuette control line (108.70). We look at the details of the USD / JPY movementon in the animated chart. ____________________ The review is made without taking into account the news background. Thus, the opening of trading sessions of major financial centers does not serve as a guide to action (placing orders "sell" or "buy"). The formula for calculating the dollar index : USDX = 50.14348112 * USDEUR0.576 * USDJPY0.136 * USDGBP0.119 * USDCAD0.091 * USDSEK0.042 * USDCHF0.036. where power factors correspond to the weights of the currencies in the basket: Euro - 57.6% ; Yen - 13.6% ; Pound Sterling - 11.9% ; Canadian dollar - 9.1%; Swedish Krona - 4.2%; Swiss franc - 3.6%. The first coefficient in the formula leads the index to 100 at the start date of the countdown - March 1973, when the main currencies began to be freely quoted relative to each other. The material has been provided by InstaForex Company - www.instaforex.com |
| Pound at a loss, but does not lose optimism Posted: 23 Sep 2019 04:34 PM PDT Hopes of the British pound to rise gradually fade, but the probability of growth still remains, analysts say. The currency of the United Kingdom slightly grew on the positive news last week, but this effect was short-lived. Recall, last Friday, analysts marked a rally of the pound, which has risen in price on the wave of new optimism regarding a possible deal on Brexit. This rise was triggered by the comments of Jean-Claude Juncker, President of the European Commission, who stated the likelihood of Britain leaving the EU with an agreement. However, the official did not disclose the details of this decision, in connection with which experts considered the position of the pound to be rather unstable. The experts were right in many respects: on Monday, September 23, the British currency tried to break through strong option levels on the news about alternative solutions to the problem of the Irish border, proposed by the government of Boris Johnson. Some of them even won the approval of Brexit's main opponents without a deal, the Northern Ireland Democratic Union Party (DUP). Many representatives of the EU leadership, including Juncker, softened the general rhetoric, but the signal that the EU was ready to amend the agreement and approve the deal turned out to be false. As a result, the last chance to retain Britain as part of the EU was lost. The unstable political situation shook the British currency. It still clings to its former optimism, but it is fading before our eyes. At the same time, the GBP/USD currency pair is traded in the structure of the first impulse of decline. The goal is the level of 1.2444, and then a correction to 1.2515 is expected. In the future, analysts do not rule out a fall to the level of 1.2444 and lower, to 1.2360. On Friday, it became clear that no real breakthrough regarding Brexit is expected. Boris Johnson is quite happy with the country's exit from the EU without a deal, and an attempt to organize new negotiations is unlikely to drastically change the current state of affairs. In this situation, not only the pound and the entire British economy will suffer, but also the eurozone economy, analysts at the Organization for Economic Cooperation and Development (OECD) are certain. They confirmed the negative scenario in the event of a "hard" Brexit, which would hit the eurozone GDP, reducing it by 0.5 percentage points (pp), while UK GDP would fall by 2 pp. Currently, the GBP/USD pair is trying to "hold face" and not slide to the lows, however, analysts are at a loss to answer how long the pound will last. Like a true English gentleman, it seeks to remain steadfast and a good face in any game. In the short term, the British currency can test the range of 1.2700-1.2720, analysts said. However, the market still hopes for growth, although the priority in terms of volume remains with deferred sales. Moreover, even a slight negative signal against the GBP/USD pair will throw it into a strong resistance zone to the level of 1.2250, analysts said. The material has been provided by InstaForex Company - www.instaforex.com |
| GBP/USD: Johnson still has no clear plan, is it too early to sell the pound? Posted: 23 Sep 2019 04:34 PM PDT Great Britain's Boris Johnson has a plan to achieve a new improved deal with the European Union, or is he just leading the country to exit without an agreement? Last week, European Commission President Jean-Claude Juncker announced Brussels's readiness to abandon the idea of a "back-stop" on the Irish border if the British prime minister offers something new and viable. Against this background, the pound sharply jumped against the US dollar, rising above $1.2570 for the first time since mid-July. However, after Irish Foreign Minister Simon Coveney stated that there was still a lot of disagreement between the United Kingdom and the EU on issues related to Brexit, the GBP/USD pair deviated from two-month highs and the pound gave way to a correction. Despite the approach of the next Brexit deadline, B. Johnson flatly refuses to ask the EU to prolong the transition period after October 31, which is being forced by local MPs. It would seem that in a hopeless situation, the prime minister maintains good spirits and intends to achieve a deal with the EU. "Does Johnson have any plan to find a path in the chaos that he helped create?" It is possible that there is. At the last minute, he can bounce back to the center and form a coalition of delighted Tories and Labor in support of a modified version of the same agreement that was proposed by former Prime Minister Theresa May and was rejected three times by Parliament. In this scenario, Johnson may lose part of his right flank, but will receive the support of a sufficient number of Labor deputies and Tory rebels. At this moment, everyone will feel relief, because, finally, it will be possible to avoid a sudden and hard break with the EU. In this case, the main problem for Johnson will be finding a way to save face in the issue of the so-called "backstop". Apparently, he is ready to consider the idea of a common Irish market (at least for agricultural products), provided that the agreed text of the agreement will in no way be an admission that Northern Ireland remains in the common EU market," said the former British Minister of Government Mark Malloch Brown. "However, many deputies and experts see a man who does not have a plan in Johnson, but an elephant in the Westminster China shop. He himself closed the path to compromise, ignores the decisions of Parliament and quickly rushes either to exit without an agreement or to the fall of his own government. His only lifeboat (if, of course, he manages to get to it) is the general election, which he will try to present as a people against Parliament battle," he added. According to the Financial Times, the British government is ready to make Northern Ireland a special economic zone in order to avoid border checks with Ireland. Meanwhile, Arlene Foster, leader of the Democratic Unionist Party of Northern Ireland, announced her readiness to take all decisions of London and Brussels along the Irish border if they do not violate the constitutional status of the region. The softening of the position of the DUP frees Johnson's hands, because otherwise he would lose the support of this party in the early elections. According to estimates by the Organization for Economic Co-operation and Development, in the event of a disordered Brexit, eurozone GDP will lose 0.5% and British GDP with 2%. As a result, the currency bloc will be on the verge of decline, and Great Britain will plunge into a recession. Responding to such forecasts and Johnson's intentions to withdraw the country from the EU at any cost, market participants got rid of the pound, as a result of which the British currency approached the 2016 lows. Three years ago, rebounding from the 1.1945-1.1985 area, the GBP/USD pair went up and reached 1.43 in January 2018. This historical experience allows some investors who believe, if not in the UK-EU deal, then in prolonging the Brexit transition, to keep the pound in their portfolios. If the "bullish" scenario is realized, then the GBP/USD pair will rise to the area of 1.2575-1.2645, and then to the level of 1.3100. However, the situation around Brexit remains uncertain, so it is possible that during the fall, the GBP/USD pair will again try to test record lows in the 1.19 area. The material has been provided by InstaForex Company - www.instaforex.com |
| Gold: will the precious metal rally continue? Posted: 23 Sep 2019 04:34 PM PDT This month, the gold exchange rate reached six-year highs amid softening policies of leading central banks. The main question, which now, apparently, worries many traders, is whether the precious metal rally will continue, or are we already at the peak of the "bullish" phase of the cycle? According to analysts at Citigroup, the prospects for gold are very favorable. As factors that will support the precious metal, analysts call the increasing risks of a global recession and the likelihood of the Fed cutting its rate to zero. Recall, September 18, the US Federal Reserve for the second time in a year lowered the interest rate by 0.25%, to 1.75–2%. At first glance, the regulator did not have to lower the rate: there has not yet been an economic downturn, and the stock market is at its peak. What circumstances force the Fed to cut rates? First of all, the slowdown in the global economy. Against this background, a high interest rate in the United States with falling rates in Europe and Asia leads to the flight of capital from around the world to America, which pushes the USD exchange rate upward, reducing the competitiveness of the US economy. This is the main reason why the head of the White House, Donald Trump, is constantly criticizing the Fed, urging him to lower the federal funds rate. However, what will need to be monitored in the coming years is not only the interest rate of the Federal Reserve (it is unlikely to be lowered below zero), but the size of its balance sheet, which is expected to grow many times over. According to the forecast of the Budget Office of the US Congress, in 2020 the country's state budget deficit will amount to $1 trillion, in another two years - $1.1 trillion, and by 2028 - $1.45 trillion. The US Ministry of Finance will cover it at the expense of debt, placing government securities and pulling dollar liquidity from the markets. In other words, the lack of dollars is not a random phenomenon, but a systemic problem that the Fed is unlikely to be able to solve by applying " temporary patches"," Goldman Sachs analysts said. According to them, the Fed will again have to start "printing money", increasing the balance sheet and buying up assets without the ability to stop at least until 2021. "We believe that the fourth round of quantitative easing will start in November. According to our estimates, the Fed will fill in the system at $15-20 billion per month. By mid-2021, the volume of operations could be reduced to about $10 billion. In just three years, $375 billion will enter the market through QE," Goldman Sachs said. Citigroup predicts that over the next two years, gold may rise in price up to $2000 per ounce. "We expect the precious metal rate to grow and possibly overcome the mark of $2,000 per ounce, updating record highs in the next two years," they said. The material has been provided by InstaForex Company - www.instaforex.com |
| Posted: 23 Sep 2019 04:33 PM PDT The economic calendar of the last full week of September can hardly be called saturated, so investors will be focused on events of a geopolitical nature. The trade war, the conflict in the Middle East and Brexit are forcing investors to pay attention to safe haven assets, all the more so since the yen, which has become pretty cheaper in the first half of the month, is starting to look like a tidbit. Over the past 3 weeks, USD/JPY quotes have grown by 4% amid closing short positions. De-escalation of the US-China trade conflict, lower Fed rates, revival of the European QE, a decrease in the probability of disorderly Brexit and strong macro statistics across the United States convinced investors that not everything was as bad as is commonly believed. Is it time to reduce the share of safe haven assets in portfolios? As a result, the yield on US treasury bonds began to grow, and the yen, franc and gold were in a black body. As subsequent events showed, not for long. The attacks on Saudi Arabia, the statement by Donald Trump that he did not need a temporary deal with China on the eve of the presidential election, as well as the refusal of the Chinese delegation to visit American farmers, were seen as a signal of worsening global risk appetite and relations between Washington and Beijing. Riyadh claims that the terrorist attack was certainly funded by Tehran, and Donald Trump sends troops to the Allied camps in the Middle East and imposes sanctions against the Iranian central bank. How not to buy bonds and other safe havens in such conditions? A deterioration in global risk appetite and a return to interest in the yen are making life difficult for the Bank of Japan. We watched the USD/JPY correction, realizing that devaluation would help accelerate inflation. Consumer prices in Japan slowed to 0.5% y/y in August, which is the worst trend since 2017. The dynamics of Japanese inflation Slowing inflation theoretically unties the hands of the central bank in easing monetary policy, but everything looks different in real life. Haruhiko Kuroda is confronted by the Fed's inability to weaken the US dollar even by lowering federal funds rates and EUR/USD growth in response to the revival of the ECB's quantitative easing program. It is obvious that a further drop in the overnight rate (-0.1%) in the red zone will only aggravate the problems of Japanese banks. In the current situation it is better to sit and see how events will develop. Perhaps negotiations between Washington and Beijing will result in a breakthrough and increase in global risk appetite ... On the contrary, the resumption of the rally in the oil market poses a threat to countries importing black gold and strengthens the demand for safe-haven assets. Technically, the bulls' inability to hold USD/JPY quotes above the upper limit of the downward trading channel is the first sign of their weakness. After reaching an intermediate target of 78.6% according to the Shark pattern, a logical pullback followed, which risks continuing in the direction of 106.9 and 106.25. The main task of the bears is to keep the pair below 107.5. The material has been provided by InstaForex Company - www.instaforex.com |
| EUR/USD. ECB Head Mario Draghi: Show Must Go On Posted: 23 Sep 2019 04:21 PM PDT The euro-dollar pair again entered the ninth figure today, reacting to extremely weak PMI data in the manufacturing sector in Germany. Similar indices of Italy, France and the entire eurozone also appeared in the red zone, not significantly reaching the forecast values. But, despite the downward impulse, the EUR/USD bears could not overcome the resistance level of 1.0950. Having pushed off from the bottom line of the Bollinger Bands indicator (on the daily chart), the pair again got bogged down in a flat. Even the "dovish" rhetoric of the head of the ECB, Mario Draghi, who spoke today in the European Parliament, could not support the bears - while maintaining a weak state, the pair still did not dare to break through the price barrier. On the one hand, the head of the European Central Bank did not say anything new today - many of his theses have already been voiced following the results of the September meeting. On the other hand, he extremely negatively assessed the prospects for economic growth in Europe and allowed the continuation of monetary easing. In particular, he said that key European indicators slowed down "more than expected", and this is mainly due to the influence of external fundamental factors (ie, the trade war). Draghi also added that the dynamics of the most important indicators imply that the EU economy will not recover in the near future - and the manufacturing sector is particularly alarming in this context (the ECB president made a statement after the release of PMI data). In addition, Draghi again focused on the extremely weak growth in core inflation and the export sector. Summing up the above, the head of the central bank repeated his already familiar phrase that monetary policy should be "accommodative for a long period". As for further possible solutions, here Draghi said a vague, but quite unambiguous phrase that "We stand ready to adjust all of our instruments, as appropriate, to ensure that inflation moves towards our aim in a sustained manner,". In other words, the head of the European Central Bank did not surprise traders with any new "revelations", although his rhetoric was extremely mild. Assuming further easing of monetary policy, he put pressure on the euro, although, on the other hand, a different position could not be expected from him. Firstly, he leaves his post in a month, so any long-term forecasts in his mouth would have sounded inappropriate. Secondly, the head of the ECB throughout his cadence always left a gap for a possible maneuver. Nevertheless, the very fact that the head of the ECB voiced readiness for further actions unpleasantly surprised many traders, because of which the pair showed a downward direction all day. After the September meeting, most analysts expressed confidence that by the end of the year the regulator is unlikely to decide on the next steps in this direction. The decision to resume QE was too hard for them. But after the corresponding remark by Draghi, one can no longer be certain that the central bank will maintain a wait-and-see attitude "against all odds". It is worth noting here that macroeconomic reports today showed a very weak result, as if confirming Draghi's words. Germany's manufacturing PMI fell to a record low of 41 points. In the eurozone as a whole, the index was also lower than forecast, recording a slowdown in production. Industrial PMI has been declining for almost the entire year, and since February it has been below the key level of 50 points, indicating a decline in industry. Similar dynamics were recorded in France and Italy. The PMI in the service sector also ended up in the red zone, complementing the overall negative picture. On the contrary, the US index of business activity in the manufacturing sector showed a positive trend. For the first time since May of this year, the indicator moved away from the boundaries of 50 points, exceeding forecast values. This factor provided additional support to the dollar, which is growing mainly on optimism regarding the resolution of the trade war. Last Friday, Washington temporarily exempted more than 400 Chinese goods from duties, and this reversal to Beijing was another step towards de-escalating the conflict. Prior to this, China resumed purchases of American agricultural products. And although now there is only a preparatory process for the meeting "at a high level", such steps demonstrate the intentions of the parties to come to a compromise. Moreover, according to the American press, this time Donald Trump will take a softer position in the negotiations, because on the eve of the presidential campaign he needs a victory over China, albeit of a nominal nature. These are just rumors, but such a scenario is likely, given the fact that Democrat Joe Biden is still 7-9% ahead of Trump. Thus, the fundamental background for the EUR/USD pair today has formed against the European currency, while the dollar is confidently afloat. The prospects for easing the monetary policy of the ECB have again loomed on the horizon, and European macroeconomic reports continue to disappoint investors. While US indicators provide background support for the dollar, which is waiting for the next round of talks between the US and China (in early October). But for the development of the downward trend, the bears need to overcome and gain a foothold below the 1.0950 mark (the lower line of the Bollinger Bands indicator on the daily chart). Since the end of August, sellers have several times made similar attempts, but in vain. But for the bulls of the pair, the task is more complicated - for the development of a large-scale correction, they need to break the upper line of the above indicator on the same timeframe, which corresponds to the price of 1.1100. The material has been provided by InstaForex Company - www.instaforex.com |
| Posted: 23 Sep 2019 03:59 PM PDT 4-hour timeframe Amplitude of the last 5 days (high-low): 104p - 134p - 73p - 122p - 124p. Average volatility over the past 5 days: 111p (high). Recently, amid all the statements of Boris Johnson and the leaders involved in Brexit, from the EU, two interesting questions have emerged at once. First: both sides of the negotiation process trying to agree on a "deal" or to dissuade each other in the advisability of signing it? Second: why does the rhetoric of all the actors change so often and why does it often not coincide? These two questions lead to the conclusion that there is a kind of game between the EU and Great Britain, and both sides do not know what they can come to in the end. The European Union takes the position of "no concessions and, if possible, retain Britain as part of the EU," the UK takes the position of "we don't know what we want." The prime minister wants to leave the EU and he doesn't care about the disastrous consequences of the "hard" Brexit. Parliament cannot decide how it wants to implement Brexit; Queen Elizabeth II does not take part in resolving such issues. In both ruling parties there is no unity of opinion. MPs continue to be on vacation, the Supreme Court continues to consider the case of illegal corruption of Johnson's parliament, UK citizens stock up on goods that could be in short supply if Brexit is sold without a "deal". Such chaos reigns in the United Kingdom. The EU's chief negotiator for Brexit said today that the UK's position does not give any reason and hopes to conclude an agreement. In turn, Prime Minister Boris Johnson said that the upcoming negotiations on an agreement on Brexit in New York are unlikely to end successfully or at least with some progress. The British prime minister also notes that the parties are very far apart. Johnson said last week that the deal could still be signed, and there was tangible progress in negotiations with Jean-Claude Juncker. In a similar situation, when it seems that the leaders of the EU and the UK themselves do not know how and how it will all end and which option should be implemented at all, traders can only stock up on patience. The next deadline is scheduled not on October 31, but on October 17-18, when the EU summit will take place, during which Boris Johnson must either sign the "deal" or ask for a postponement of Brexit, as the Parliament decided. No one knows what Johnson will do. Accordingly, it makes no sense to predict anything on this issue. It remains only to respond to incoming news. Any news that reduces the chances of a "hard" Brexit is to buy the pound, any news that removes the parties from signing the "deal" and brings the disordered Brexit closer is to sell the pound. The technical picture shows a very likely change in the direction of the trend from upward to downward. Thus, in the coming days, the downward movement may continue, especially if the nature of the news continues to be negative for the British pound. No important macroeconomic publications are planned for tomorrow in the United States or the United Kingdom, but we recommend that you continue to monitor any messages from top officials of the European Union and the United Kingdom. Trading recommendations: The GBP/USD currency pair has started a downward movement at the moment. Thus, small sales of the pair with targets 1.2382 and 1.2303 are now recommended. Small - because the signal to sell the "dead cross" has not yet been formed, there is only overcoming the critical line Kijun-sen. Again, it is recommended to buy the pair no earlier than when the bulls consolidate above the Kijun-sen line. In addition to the technical picture, fundamental data and the time of their release should also be taken into account. Explanation of the illustration: Ichimoku indicator: Tenkan-sen is the red line. Kijun-sen is the blue line. Senkou Span A - light brown dotted line. Senkou Span B - light purple dashed line. Chikou Span - green line. Bollinger Bands Indicator: 3 yellow lines. MACD indicator: Red line and bar graph with white bars in the indicator window. The material has been provided by InstaForex Company - www.instaforex.com |
| EUR/USD. September 23. Results of the day. Euro currency: entry into a new downward trend Posted: 23 Sep 2019 03:46 PM PDT 4-hour timeframe Amplitude of the last 5 days (high-low): 94p - 85p - 62p - 51p - 72p. Average volatility over the past 5 days: 73p (average). The first trading day of the week for the European currency ends "smartly." For several days in a row, we wrote that the EUR/USD pair is in a flat, that traders will need good fundamental reasons for the formation of a new trend, especially if it will be a downward trend, since the pair is already trading around two-year lows. But we did not have to wait long for the fundamental foundations. Despite the fact that only preliminary values of business activity indices for September were published today, they were so inconsistent with forecasts that there was no longer any hope for the final data for September. Six out of six indices in Germany and the European Union were not just below the forecast values or values of the previous month, but simply failed. If earlier the questions were only about business activity in the manufacturing sector of both Germany and the EU, now business activity in the services sector has come close to critical values. The composite business activity index in Germany has already fallen below 50.0. In general, the euro currency sales on September 23 are quite logical, and it's good that the drop was only 45 points. Because at the US trading session, similar business activity indices for the USA were published, and all three indices turned out to be better than the values in August. All three indices were higher than 50.0, which indicates the absence of a decline in the areas of industry and services. Thus, in the afternoon, sales of the currency pair could well continue. The euro was saved from new losses only by the fact that the values in America are still not final, so it is quite possible that the final figures will be worse. Traders did not make hasty conclusions about business activity in the United States. What does this mean for the prospects of the EUR/USD pair? As usual, nothing good. First, once again we can make sure that the steps of the ECB to ease monetary policy are not just caution and reinsurance. These are forced measures, without which the EU's economy will slide into a recession very, very quickly. Secondly, current macroeconomic indicators may become the basis for Mario Draghi and the company, at his last meeting as the head of the ECB, to make another rate cut. Of course, there is no talk of expanding the quantitative stimulus program, since they just announced its revival that will begin in November. It would be strange if the regulator would expand it before the start of the program. However, it is already clear that stimulating measures will be needed very, very serious. This bloc has not yet encountered such a problem as a trade war with America, rumors of the beginning of which have been in the air for several months. We are more and more inclined to believe that Donald Trump will unleash a trade war with the EU. A factor that may deter him from this step is the falling rating of his popularity and approval of his actions among the population. Most of the electorate is unhappy with the trade war with China, as it negatively affects the prices of consumer goods. US citizens also fear recession due to the trade wars of their president. Trump understands the mood among the population now, as well as the fact that waging a war on two fronts is very difficult. And this may restrain his impulses to introduce trade duties on imports from the European Union. This is the euro's chance. However, if macroeconomic statistics from the European Union continues to be a failure, then the absence of a trade war with the United States will not save the single European currency. The technical picture shows that the pair is leaning towards the formation of a new downward trend. At the moment, the first support level of 1.0976 has been worked out and the drop has stopped. But overcoming this level will open the way for the bears to the levels of 1.0934 and 1.0914. Trading recommendations: The EUR/USD pair started a new downward movement, but today an upward correction may begin, as it was not possible to overcome the level of 1.0976 in the first attempt. Therefore, it is recommended to sell the euro if the level of 1.0976 is overcome or after the completion of the current round of correction. In addition to the technical picture, fundamental data and the time of their release should also be taken into account. Explanation of the illustration: Ichimoku indicator: Tenkan-sen is the red line. Kijun-sen is the blue line. Senkou Span A - light brown dotted line. Senkou Span B - light purple dashed line. Chikou Span - green line. Bollinger Bands Indicator: 3 yellow lines. MACD indicator: Red line and bar graph with white bars in the indicator window. The material has been provided by InstaForex Company - www.instaforex.com |
| EURUSD: Horrible manufacturing activity in the eurozone is another sign of economic recession Posted: 23 Sep 2019 03:43 PM PDT Data on a decrease in manufacturing activity in France, Germany and the eurozone led to a sharp decline in risky assets in the morning against the US dollar. Even despite the fact that the report is still preliminary, it is obvious that the eurozone economy continues to gradually slide into recession, and the measures of the European Central Bank, announced two weeks earlier, will clearly not be enough to return to a gradual recovery. According to the report, the preliminary index of PMI purchasing managers for the manufacturing sector in France in September this year fell to 50.3 points after rising to 51.1 points in August this year. Economists had forecast a growth of 51.2 points. The preliminary index of PMI procurement managers for the French services sector also fell in September, to 51.6 points, against 53.4 points in August, with a forecast of 53.2 points. No matter how the German Bundesbank thinks about the fact that the recession is not a cause for concern, the data indicate the exact opposite. In today's report by Markit, it is clearly indicated that the manufacturing sector is in a deplorable state, and the deterioration of trade relations with the United States can lead to very serious consequences due to reduced exports, since one domestic market is clearly not enough. The German Bundesbank believes that the economy in the third quarter probably entered into a small technical recession, but this does not mean the inevitable cessation of the country's economic growth. According to the data, the preliminary index of PMI for the manufacturing sector in Germany in September this year fell to 41.4 points after a slight recovery in August to the level of 43.5 points. Economists had forecast growth to 44.0 points. It is important to note the decrease in the index for the service sector. Thus, the preliminary index of PMI for the German services sector dropped to 52.5 points in September against 54.8 points in September and a forecast of 54.2 points. The decline in company activity in Germany was the largest in almost seven years. This once again confirms the fact that the country's economy is on the verge of a recession. Uncertainty surrounding Britain's exit from the EU is also negatively affecting the industry, primarily the automotive industry. As a result, the preliminary index of PMI for the manufacturing sector of the eurozone in September fell to 45.6 points against 47.0 points in August. Economists had forecast the index at 47.2 points. The eurozone services sector in September fell to 52.0 points against 53.5 points in August with a forecast of 53.3 points. The composite index of purchasing managers in September again approached a critical point of 50 points and amounted to 50.4 points, while in August it was at 51.9 points. This once again suggests that the European Central Bank will have to think about new measures and, most likely, maintain a soft approach to monetary policy in the near future. Here we are talking about lowering the key interest rate, which at the last meeting in September, the ECB has not yet resorted to, limiting itself to lowering the deposit rate and launching the asset purchase program. As for the current technical picture of the EURUSD pair, the direction of the market remains bearish, and given the worsening prospects for the European economy, we can hardly expect risky assets to return to the buyers' market. A break of thelow of 1.0970 will increase pressure on the trading instrument, which will lead to large support located at the low of this month in the area of 1.0920. The material has been provided by InstaForex Company - www.instaforex.com |
| BTC 09.23.2019 -First objective has been met, more downside on break Posted: 23 Sep 2019 09:20 AM PDT BTC has been trading downwards as I expected. The first downward target from previous forecast has been met at the price of $9,610. If the price breaks the level of $9.610, next support will be set at the price of $9.265
Blue horizontal lines – Support levels based on the price action Blue rectangle – Major resistance level MACD oscillator is trying to establish new momentum low, which is sign that buying looks risky at this stage. Watch for potential breakout of the $9,610 to confirm further downside continuation and potential test of $9,265. Based on the 4H time-frame, I found series of the lower lows and lower highs, which is sign of the bearish trend.I don't see any reversal yet. The material has been provided by InstaForex Company - www.instaforex.com |
| September 23, 2019 : GBP/USD Intraday technical analysis and trade recommendations. Posted: 23 Sep 2019 09:13 AM PDT
On July 26, Bearish breakdown below 1.2385 (Wedge-Pattern Key-Level) facilitated further bearish decline towards 1.2210 and 1.2100 which corresponded to significant key-levels on the Weekly chart. In Early August, another consolidation-range was temporarily established between the price levels of (1.2100 - 1.2220) except on August 9 when temporary bearish decline below 1.2100 was executed towards 1.2025 (Previous Weekly-Bottom). Since then, the GBP/USD pair has been trending-up within the depicted bullish channel except on September 3 when a temporary bearish decline was demonstrated towards 1.1960. Around the price level of 1.1960, early signs of bullish recovery (Bullish Engulfing candlesticks) brought the GBPUSD back above 1.2230 where the pair looked overbought. However, further bullish momentum was demonstrated towards 1.2320 maintaining the bullish movement inside the depicted movement channel. As Expected, Temporary bullish advancement was demonstrated towards 1.2500 where the upper limit of the current movement channel has been applying considerable bearish rejection since September 13. Last week, recent bullish trials were expressed towards 1.2500 - 1.2550 where bearish rejection and a reversal wedge pattern was established there. The Long-term outlook remains bearish as long as the upper limit of the current movement channel around 1.2500 - 1.2550 remains defended by the GBP/USD bears. On the other hand, Bearish Breakout below 1.2440-1.2400 (Reversal-Pattern Neckline) can turn the short-term outlook into bearish, thus allowing more bearish decline to occur towards the lower limit of the movement channel around 1.2330. Trade Recommendations: Conservative traders can look for a bullish pullback towards the price levels of 1.2500-1.2550 for a valid SELL entry. T/P level to be placed around 1.2330, 1.2280 and 1.2220 while S/L should be set as a H4 candlestick closure above 1.2550. The material has been provided by InstaForex Company - www.instaforex.com |
| Posted: 23 Sep 2019 08:48 AM PDT EUR has been trading downwards in the past 24hours. The price tested the level of 1.0968 and then got rejected but in my opinion only temporally. I still see potential for more downside and the recent rally looks just corrective to me.
Orange rectangle – Broken support now became resistance PInk rectangle - major support area Orange falling line – Expected path MACD oscillator is showing good new momentum down in the background and I do expect at least another move lower. Support levels are seen at the price of 1.0967and 1.0927and resistance at 1.1000. Bulls need to be very cautious as there is strong downward momentum in the background and most recently there is the breakout of the 5-day balance, which confirms further downward pressure. The material has been provided by InstaForex Company - www.instaforex.com |
| September 23, 2019 : EUR/USD Intraday technical analysis and trade recommendations. Posted: 23 Sep 2019 08:29 AM PDT
Few weeks ago, a quick bearish decline was demonstrated towards 1.0965 - 1.0950 where the backside of the broken channel came to meet the EURUSD pair again. Intraday traders were advised to search for a valid BUY entry anywhere around the price levels of 1.0950. Target levels were successfully reached within the recent bullish movement during last weeks' consolidations. Shortly After, the EUR/USD pair was testing the backside of both broken trends around 1.1060-1.1080 where significant bearish pressure pushed the pair directly towards 1.0940 (Prominent Weekly Bottom). Bearish Breakout below the price level of 1.0940 was needed to enhance further bearish decline towards 1.0900 and 1.0840 (Fibonacci Expansion Key-Levels). However, considerable bullish rejection was demonstrated as a quick bullish spike towards 1.1100 where a recent episode of bearish rejection was expressed. Currently, the EUR/USD is trapped within a narrow consolidation range extending between (1.0990 - 1.1090) until breakout occurs in either directions. By the end of last week's consolidations, Bearish Breakout below 1.1025 was demonstrated. This renders the recent bullish spike as a bullish trap. That's why, initial bearish decline was expected towards 1.0940-1.0920 while the price levels around 1.1030 remain significant supply levels to be watched for bearish rejection. Any bullish pullback towards the price level of 1.1030 should be considered as a valid SELL entry. On the other hand, Any Bullish breakout above 1.1080 gives an early signal of short-term bullish reversal possibility as a bullish double-bottom pattern with a projected target towards 1.1175 (Low probability scenario. Trade recommendations : Intraday traders are advised to wait for a bullish pullback towards the price level of 1.1030 for a valid SELL entry. S/L should placed above 1.1090. Initial Target levels should be located at 1.0965 and 1.0930. The material has been provided by InstaForex Company - www.instaforex.com |
| Gold 09.23.2019 - Breakout of the symmetrical triangle, up trend continues Posted: 23 Sep 2019 08:01 AM PDT Gold price had a nice push higher and I found the breakout of the symmetrical triangle together with failed HSS pattern, which is indication for the further upward prices. Watch for buying opportunities with the target at $1,551
Red horizontal line – Important resistance and upward objective Yellow rectangle - major support area Purple rising line – Expected path MACD oscillator is showing good new momentum up in the background and I do expect at least another push higher. Key support is at $1,486 and resistance at $1,551. Bears need to be very cautious as there is strong upward momentum in the background and the breakout of the symmetrical triangle pattern. As long as the Gold is holding above $1,482 there is a chance for potential test of $1,551.The material has been provided by InstaForex Company - www.instaforex.com |
| Trading recommendations for the EURUSD currency pair – placement of trade orders (September 23) Posted: 23 Sep 2019 07:27 AM PDT By the end of the last trading week, the euro/dollar currency pair showed high volatility of 71 points, as a result of which the quote rushed to the limits of psychological value. From technical analysis, we see that the conditional horizontal movement remains in the market, where the quote was concentrated within the upper limit of 1.1080 (1.1115), but then the price returned to the psychological level of 1.1000 again, thus completing the trading week. As discussed in the previous review, the recommendation in terms of work on the breakdown of the cluster of 1.1030/1.1080 worked by 100%, and traders managed to enter short positions, taking profits from the market, though not for long. Looking at the trading chart in general terms (daily period), we see that the quote is trying hard to restore the downward interest, but the fulcrum still holds in the area of 1.0927, and the conditional horizontal movement can still be held in the market. Thus, constant monitoring of the mark of 1.0927 is performed in order not to miss the main move and to understand the further movement of the quote. Last Friday's news background didn't have statistics on Europe and the United States, but a kind of information background, as always, was present and supported the interest of speculators. So, the single currency has been burdened with ambiguity about the conflict in the Middle East, in particular, we are talking about possible full-scale sanctions on Iran, which may affect the EU oil companies operating in this country. The next factor follows from the beloved Brexit divorce proceedings, where, it seems, everyone comforts each other with pseudo-hopes, and the result is zero. So, the recent meeting of the British Minister for Brexit, Stephen Barkley, and the EU's chief negotiator Michel Barnier did not give any result. The only thing that was indicated was that the parties agreed to continue negotiations. In turn, European Commission President Jean-Claude Juncker said that Britain's exit from the EU without an agreement will lead to a hard border between Northern Ireland and Ireland. Juncker also added that he did not like the idea of a hard exit, as the consequences could be catastrophic. The consequences were probably about Britain since, at the end of last week, Jean-Claude Juncker once again indicated that the European Union was ready for any outcome and, for example, the Netherlands would only be happy with a deplorable development. Today, in terms of the economic calendar, we have already seen a deplorable package of European PMI statistics. So, preliminary data say that the index of business activity in the manufacturing sector is reduced from 47.0 to 45.6 with a growth forecast of 47.3, and the index of business activity in the services sector fell from 53.5 to 52.0. Naturally, this kind of data dramatically affected the single currency, and, as a fact, almost a lightning decline. To find the synchronicity, take the German PMI data and match it to the trading chart, everything will fall into place. In the second half of the day, similar indicators will be released for the United States, where the index of business activity in the manufacturing sector should remain unchanged, but the index of business activity in the service sector will grow from 50.7 to 51.5. Actual statistics may support the US currency. Further development Analyzing the current trading chart, we see that after the morning rally, the market came back, and here the question arises whether the bulls will be able to drag us to the previously passed level of 1.1000 or stagnation will come much earlier. Speculators, in turn, have already made money on the recent jump, where the tactic was known last week: the flight below the level of 1.1000, a priori gives a signal to sell. It is likely to assume that the rollback phase will temporarily lead to a slight accumulation in the form of fluctuations of 20-30 points. After that, it is necessary to closely monitor the behavior of the quotes, as fixing the price relative to the values of 1.0966/1.1000 will make it clear about further intentions in terms of movement. Based on the above information, we will derive trading recommendations:
Technical analysis Analyzing different sector timeframes (TF), we see that the indicators on intraday and medium-term periods tend to decline against the backdrop of recovery quotes. The short-term perspective works on the rollback phase, a variable indicator. Volatility per week / Measurement of volatility: Month; Quarter; Year. Measurement of volatility reflects the average daily fluctuation, calculated for the Month / Quarter / Year. (September 23 was built taking into account the time of publication of the article) The volatility of the current time is 59 points, which is almost equal to the daily average. If the inertial course continues and there is no slowdown, as mentioned above, then theoretically volatility may still grow. Key levels Resistance zones: 1.1000***; 1.1100**; 1.1180* ; 1.1300**; 1.1450; 1.1550; 1.1650*; 1.1720**; 1.1850**; 1.2100 Support zones: 1.0926*; 1.0850**; 1.0500***; 1.0350**; 1.0000***. * Periodic level ** Range level *** Psychological level **** The article is based on the principle of conducting transactions, with daily adjustments. The material has been provided by InstaForex Company - www.instaforex.com |
| Trading recommendations for the GBP/USD currency pair on September 23: placement of trade orders Posted: 23 Sep 2019 06:45 AM PDT The Pound/Dollar currency pair showed high volatility of 121 points by the end of the last trading week. As a result, the quote returned to the limits of the previously formed accumulation. From a technical point of view, we can see that a recent surge has led the quotation to around 1.2580, which reflects the local peak of the correctional course on July 12th. Hence, the pound inflated on nothing and began to lose its position. In fact, it returned to the quotation of the framework in the recent accumulation at 1.2430/1.2500. As discussed in the previous review, traders have already managed to earn on the initial price spike in the period of September 19-20, where partial and full fixation of transactions was made in the area of 1.2550-2580 with the stop-loss moving to breakeven. it was possible to go into profit even taking into account the fact that the quote eventually returned back. Considering the trading chart in general terms (the daily period), we see that the oblong correction is steadily maintained in the market. Relatively speaking, the range of 1.2500 (1.2500/1.2550) plays a variable resistance, restraining the unjustified inflation of the pound. Last Friday's news background did not have any intact statistics for Britain and the United States. Thereby, all the interaction of the quote went through the information background along with the emotional component of the market. So what was in the margins of the information flow? A meeting between the two chief negotiators of Brexit, represented by British Minister Stephen Barclay and the EU representative Michel Barnier. The purpose of the meeting was to discuss a document previously submitted by the British authorities concerning the terms of the exit, but as we can see from the results, the talks were fruitless. The two sides agreed to continue the talks, according to the statement of the European Commission. In principle, we already expected this outcome when we heard the news that London had provided Brussels with unofficial documents with ideas on Brexit as if they were behind. European Commission head Jean-Claude Juncker, for his part, said on Sunday (September 22) that Britain's tough exit from the EU would create a hard border between Northern Ireland and Ireland. As we can see, the play on the words of the representatives of the European Union leads to the spontaneous growth of the British currency, while at the same time the pound returns to its starting points while touching the real problems of Britain. At the same time, while touching the real problems Britain pound, the pound returns to its starting points. Statements of the EU about readiness to consider any proposals for "backstop" ending on the word "consider", and it is unlikely to go further. Today, in terms of the economic calendar, preliminary data for the United States, particularly the index of business activity in the service sector, grew from 50.7 to 51.5, whereas the index of business activity in the manufacturing sector should remain unchanged. Actual statistics may support the US currency. Further development Analyzing the current trading chart, we see that the quote is trying to storm the lower border of savings of 1.2430/1.2500 that is already trying to break it. There are assumptions that reflect the EURUSD currency pair in this situation, where at the current moment there was a sharp drain of the euro against the background of bad PMI data in Europe. In turn, speculators monitor the behavior of quotes relative to the lower border of 1.2430 since there are prerequisites for the emergence of short positions. It is likely that there are prerequisites for the descent to 1.2400-1.2350 amid recovery and clear price fixation lower than 1.2430. A counter judgment reflects the opposite picture, where the bearish interest is waning and the quotation continues to chatter again within 1.2430/1.2500. Based on the above information, we derive trading recommendations: -If the price fixes higher than 1.2500, buy positions are considered with the prospect of a move to 1.2575. In the case of descent, we are looking for points of support, possibly around 1.2350. - Sell positions should be analyzed with respect to current points and quotation behavior. It is possible to enter the incomplete trading volume, subsequently topped up. Do not forget about the restrictive stop loss. - Sell positions should be analyzed with respect to current points and quotation behavior. It is possible to enter the incomplete trading volume, subsequently top-up. Do not forget about the restrictive stop-loss. Indicator analysis Analyzing a different sector of timeframes (TF), we see that indicators' indicators in the short-term and intraday periods signal a downward interest due to the current recovery. The medium-term outlook holds upward interest due to an oblong correction. Volatility per week / Measurement of volatility: Month; Quarter; Year Measurement of volatility reflects the average daily fluctuation, calculated for the Month / Quarter / Year. (September 23 was built taking into account the time of publication of the article) The volatility of the current time is 68 points, which is already a lot for this time section. If the accumulation nevertheless falls and the quotation manages to go into the recovery phase, then the volatility can significantly increase, exceeding the average daily indicator. Key levels Resistance zones: 1.2500 **; 1.2620; 1.2770 **; 1.2880 (1.2865-1.2880) **. Support areas: 1.2350 **; 1.2150 **; 1,2000 ***; 1.1700; 1.1475 **. * Periodic level ** Range Level *** The article is built on the principle of conducting a transaction with daily adjustment The material has been provided by InstaForex Company - www.instaforex.com |
| Swiss Franc Special Path: Strengthening and Rallying Posted: 23 Sep 2019 06:33 AM PDT The country's leading bank, the Swiss National Bank (SNB), has chosen a different way of forming monetary policy. He did not join other regulators and cut interest rates. In this regard, we can expect the strengthening of the franc, experts assured. The Swiss Central Bank gave currency traders a "green light" to further strengthen the national currency, ignoring the reduction in interest rates and further easing of monetary policy accordingly. According to SNB forecasts, the Swiss economy expects a slowdown in inflation and economic growth, but this did not affect the decision of the regulator to leave the key rate unchanged. At the beginning of this month, the franc reached a two-year high against the European currency. The reasons for this were concerns about European economic prospects, the situation around Brexit and trade disputes between the US and China. Meanwhile, the reason for the further growth of the Swiss franc was the high demand of investors for safe-haven currencies. However, this is news with a minus sign for SNB since the appreciation of the franc prevents the growth of the competitiveness of national exports. At the same time, many analysts believe that the strengthening of the Swiss currency is inevitable since the regulator is no longer able to restrain its growth. According to Jane Foley, Head of Currency Research at Rabobank, two important factors could weaken the franc: increased activity on the part of investors who prefer risky assets, and increased economic growth in the eurozone. She is sure that the attempts of the Central Bank of Switzerland to resist the strengthening of the franc will lead to nothing due to the increase in demand for the assets of the "safe haven". According to analysts, the Swiss currency has appreciated by more than 3% against the euro since the beginning of this year. Last Friday, the EUR/CHF pair ended the trading session at 1.0921. In early September, the quotations of the pair fell to a minimum since mid-2017, when the 1.0811 mark was reached. According to experts, the rally of the franc, which lasted from April to September 2019, could push the Central Bank of Switzerland to decide on interventions. Rabobank believes that the EUR/CHF rate will drop to 1.0800 by the end of this year. Experts of the Toronto Dominion Bank do not agree with this forecast. They are sure that the franc will meet the end of the year, having strengthened to 1,0500. However, the last time this happened in 2015 was when the SNB headed for the weakening of the national currency. At the moment, the situation is different because of the widespread decline in risk appetite by investors, making it impossible to set the Swiss franc. Rabobank analysts believe that SNB will try not to repeat past mistakes. They include the regulator's previous monetary policy and some of the measures that have had a negative impact on the market. Recall that for several years the Central Bank of Switzerland did not allow the strengthening of the franc, setting the lower border of the EUR/CHF pair at 1.2000. However, in January 2015, SNB abruptly abolished this restriction, which provoked a rapid strengthening of the Swiss currency by 30%. This decision caused a shock in the market and led to the bankruptcies of banks and traders. This has long undermined the credibility of SNB, so the regulator will try to prevent such miscalculations, Rabobank believes. Rabobank analysts believe that SNB will try not to repeat past mistakes. Experts refer to them as the former monetary policy of the regulator and some measures that had negative consequences for the market. |
| Posted: 23 Sep 2019 04:50 AM PDT To open long positions on EURUSD, you need: In my morning review, I focused on the data on the index of production activity in the eurozone countries, which led to the decline of the euro in the morning. The report pointed to the continued decline in activity, which once again confirms the fact of the slowdown of the European economy. Today, buyers only have to rely on a false breakdown in the support area of 1.0960, and to open long positions immediately on the rebound is recommended at the low of the month in the area of 1.0927. A more important task of the bulls, for breaking the current short-term downward trend, is to return consolidation above the resistance of 1.0997, which may lead to an upward correction to the maximum area of 1.1034, where I recommend taking the profit. To open short positions on EURUSD, you need: Sellers of the euro will have a good report on manufacturing activity in the US, which will keep the downward potential in EUR/USD, and a breakthrough of the support of 1.0960 will only increase the pressure on the pair, which will lead to an update of the minimum around 1.0927, where I recommend taking the profits. If the data on activity in the production sector in the United States will be worse than economists' forecasts, bulls can take advantage of this and return to the resistance of 1.0997, from where I recommend opening short positions provided that a false breakdown is formed. Selling the euro for a rebound is best from a larger resistance of 1.1034. Signals: Moving Averages Trading is below 30 and 50 moving averages, which indicates the continuation of the downward correction. Bollinger Bands In the case of an upward correction in the second half of the day, the resistance will be the average border of the indicator in the area of 1.1010.
Description of indicators
|
| Posted: 23 Sep 2019 04:50 AM PDT To open long positions on GBP/USD, you need: Bears coped with the task for the first half of the day, and buyers failed to protect the support level of 1.2460. Given the lack of news on Brexit and the lack of important fundamental statistics, bulls are acting cautiously. Their task for the second half of the day is to return to the resistance of 1.2460, from which we can again expect a second jump to the maximum area of 1.2522, where I recommend taking the profit. If the pressure on the pound continues in the second half of the day, for example, after the data on good production activity in the US, I advise you to return to long positions only on the rebound from the large support of 1.2393, which kept the pair from falling last week. To open short positions on GBP/USD, you need: Bears are left to defend the level of 1.2460, which now acts as a resistance. A good report on the composite PMI and the formation of a false breakdown in this range will be a clear signal to open new short positions based on the update of a large support of 1.2393, where today I recommend taking the profits. A further target for sellers this week will be a minimum of 1.2323. If the bulls return to the market and "win back" the level of 1.2460, it is best to consider new short positions by a rebound from the maximum of 1.2522. Signals: Moving Averages Trading is below the moving ones, and 30-day crosses from top to bottom the 50-day average, which is a bearish signal. Bollinger Bands If the pair grows in the second half of the day, the upper limit of the indicator around 1.2515 will act as a resistance level.
Description of indicators
|
| Posted: 23 Sep 2019 04:31 AM PDT Observing everything that is happening, we can say that the markets actually took a wait and see attitude. This is caused, as if by accident, in the abandoned words of the head of the Federal Reserve J. Powell, who made it clear that the regulator may consider in the coming days the possibility of resuming an increase in the balance. Immediately after that, the markets began to exaggerate the topic of the beginning of the next economic support program (QE4). An important signal that the Fed will have something on this issue in October was the liquidity crisis in the local financial system. The Central Bank had to carry out REPO traces to pay off the failure of a lack of dollars in the banking system, which brought to life the subject of the need for incentive measures. It is estimated that an order worth $400 billion is needed to normalize the spread ratio of FF-IOER. In fact, the liquidity crisis in the financial system, as well as noticeable disagreements in the Fed regarding the assessment of the state of the American economy and its prospects, can indeed become a catalyst for QE4. Also, the fact that the US is gradually starting to enter the recession, we pointed out this summer. Our expectations are already confirmed by the statements of some representatives of the Federal Reserve. Thus, the President of the Federal Reserve Bank of St. Louis J. Bullard said in his speech last week that he considered it necessary to cut interest rates at the last meeting immediately by 0.50%. He substantiated this opinion with expectations of a noticeable slowdown in the growth of the American economy and its entry into a recession in the near future. In general, assessing the emerging economic situation in the United States, as well as liquidity problems in the local financial system, it can be assumed that the high probability of the announcement of new stimulus measures will have a wide negative impact on the dollar; which, on the one hand, is justified. Yet, at the same time, one more important point that should be taken into account is that the largest world banks will not sit still. They will continue or begin to cut interest rates in order to compensate for the loss of exports from their countries to the world market. So, before the likely start of QE4 by the end of this year, the dollar will be traded as a whole in the lateral range to the basket of major currencies. Forecast of the day: The GBPUSD pair began to adjust after reaching a local maximum of 1.2580 as it is fully playing out the topic of upcoming talks between Britain and the EU on the topic of the country's withdrawal from this organization. We believe that the uncertainty of their outcome may have a negative impact on the sterling rate. Given this, we believe that fixing the pair below 1.2500 may lead to a continued decline to 1.2285. The AUD/USD pair is trading below the level of 0.6785. The expectation of a decrease in RBA interest rates in October will pull the pair further down. Fixing the price below the level of 0.6785 will lead to a fall in the pair to 0.6700. |
| Review of EUR/USD and GBP/USD pairs on 09/23/2019: Confused who has a recession Posted: 23 Sep 2019 04:02 AM PDT When the macroeconomic calendar is empty, politicians resort to help traders. This is exactly what happened on Friday. Instead of boring statistics, investors were invited to contemplate the next adventures of Saudi Arabia and the United States in search of evidence of Iran's guilt in attacking the Sheikhs oil fields. And although they have not yet achieved success in this extremely difficult and dangerous event, they have already threatened the Islamic Republic with new heavenly punishments. Apparently, the fact is that they can't find any evidence of the involvement of the Persians in such a daring attack. It got to the point that the Pentagon outlined several targets for targeted attacks on Iran from resentment. Although few doubted that things will not go beyond words and threats, it is obvious that the result of all these movements will be the tightening of sanctions against the Islamic Republic. Well, this will inevitably lead to financial losses of European oil companies that are actively working in Iran. Moreover, the case may even turn into a local shortage of black gold in the Old World. Hence, it is not surprising that the single European currency was a little feverish and was thrown from side to side after the next statements by representatives of the United States. Today, geopolitics and the appointment of the guilty have already faded into the background since preliminary data on business activity indexes in Europe have been published, from which the hairs on my head stand on end. Hence, the index of business activity in the service sector collapsed to 52.0, instead of declining from 53.5 to 53.3 as expected. But things are even worse with the index of business activity in the manufacturing sector, which fell from 47.0 to 45.6, although it was supposed to grow to 47.3. Looking at it, one gets the feeling that everyone who is screaming about the recession in the United States does not trite know where the Old World is on the globe since the economic downturn threatens Europe. A decrease in both business activity indices led to a reduction in the composite index from 51.9 to 50.4. Composite business activity index in Europe: But this is not the end of today's adventures, all the fun is just beginning. The fact is that preliminary data on business activity indices are published in the United States, and forecasts for them are much better than in Europe. Hence, the index of business activity in the manufacturing sector should remain unchanged at around 50.3 points. This seriously casts doubt on the cries of the inevitable recession in the United States. Rather, it will begin in Europe and alarmists just heard the word recession from someone but did not listen to where exactly. In addition, the index of business activity in the services sector may increase from 50.7 to 51.5, which ultimately will give an increase in the composite index of business activity from 50.7 to 51.2. Composite business activity index in the United States: It turns out that not only European statistics but also American ones will put pressure on the single European currency. Therefore, there is a high probability of its decline as much as 1.0925. The pound is pressed not only by weak data on business activity indexes in Europe but also by expectations on similar data in the United States. The situation is exacerbated by the bankruptcy of one of the largest British travel companies and the need to urgently take out thousands of subjects Her Majesty from various resorts, which will cost not a small amount of money. So, the pound may well finish the day at 1.2350. |
| Saudi Arabia sets the tone -a year without cheap oil? Posted: 23 Sep 2019 04:02 AM PDT Saudi Arabia's plans to quickly launch oil infrastructure were not destined to come true after attacks on the king's refineries. According to preliminary estimates, the restoration of oil refineries will take several months or even a year. In the event of such protracted restoration work, the market should not rely on cheap oil, analysts are sure. In such a situation, the price of black gold will rise. Saudi Arabia is a key player in the oil market, so the forced shortage of raw materials arising from the recent incident will seriously affect oil quotes. Earlier, the leadership of the largest state-owned company Saudi Aramco planned to restore damaged oil facilities in a few weeks but a more realistic scenario involves working for months or even close to a year. Now, Saudi Aramco is in urgent negotiations with equipment manufacturers and service providers, offering any price in order to start production as soon as possible. Recall that as a result of the attack of drones at the refineries of the kingdom, a hundred sides of the Houthi Yemeni rebels more than doubled production in Saudi Arabia. It fell by almost 6 million barrels per day, experts say. However, the country's energy minister said that production levels have been restored at the moment by almost 50% due to the use of reserves. He also emphasized that oil supplies returned to their previous levels. Nevertheless, there are no positive trends in the black gold market. At the opening of trading on Monday, September 23, a quotation rise of about half a percent was recorded. A barrel of North Sea Brent mixture cost about $65. In the future, correction began and almost all of the growth was leveled. Temporary retirement of the largest player in the oil market was a kind of shock for the market. Many leading market players cannot decide yet in which direction will the quotes move. According to analysts, oil has been trading sideways for several days. It is possible that market participants are waiting for new signals or important news that will help in making decisions. The difficult situation with the restoration of oil infrastructure casts doubt on the feasibility of Saudi Aramco's plans for an initial public offering (IPO). Earlier, the Saudi oil giant was considered as one of the most profitable enterprises in the world. However, the authorities of the kingdom do not lose optimism in this case. According to Mohammed Al-Jadaan, the country's finance minister, Saudi Arabia still plans to conduct an IPO of the oil giant. The kingdom noted that assuming this will happen within the next 12 months. The material has been provided by InstaForex Company - www.instaforex.com |
| Technical analysis of EUR/USD for September 23, 2019 Posted: 23 Sep 2019 03:58 AM PDT The EUR/USD pair faced resistance at the level of 1.1019, because the trend of EUR/USD pair movement was controversial as it took place in the downtrend channel. Major resistance is seen at 1.1019. The EUR/USD pair is still moving around the key level at 1.1019, which represents a daily pivot in the H4 time frame at the moment. Due to the previous events, the price is still traded between the levels of 1.1019 and 1.0927. So it is recommended to be careful while making deals in these levels because the prices of 1.1019 and 1.0927 are representing the resistance and support respectively. The RSI indicator is still calling for a strong bearish market as well as the current price is also below the moving average 100 and 50. The trend is still calling for a strong bearish market from the spot of 1.1019. Sell deals are recommended below the level of 1.1019 with the first target at 1.0927. If the trend breaks the support level of 1.0927, the pair is likely to move downwards continuing the development of a bearish trend to the level 1.0885 in order to test the daily support 2. Stop loss should always be taken into account, accordingly, it will be of beneficial to set the stop loss above the last top at 1.1070. The material has been provided by InstaForex Company - www.instaforex.com |
| Posted: 23 Sep 2019 01:44 AM PDT GBP/USD – 4H.
The British pound performed consolidation above the correction level of 38.2% (1.2501), but as it turned out later, the breakdown was false, and traders could not hold the British pound above this level on Friday, September 20. The pound/dollar pair closed at the Fibo level of 38.2% and reversed in favor of the US currency. An upward channel is also formed, which shows the trend of the last days. Already today, the pound can leave this channel through its lower line, which will mean the desire of traders to move to sales. The crisis of a political nature is increasingly engulfing the UK. This is the conclusion that can be drawn from recent events. A week ago, the leader of the Labor Party and the opposition of Boris Johnson, Jeremy Corbyn, looked like a man capable of stopping Brexit "No Deal" and enjoying the support of most parliamentarians. Boris Johnson did not enjoy 100% support even within his party. But as it turned out, everything was not as smooth as it should be in the Labor camp. We can say with confidence that Brexit introduced a split not only in the political sphere of the United Kingdom but also in each party. Andrew Fisher, the closest adviser to Jeremy Corbyn, resigned on Saturday, September 21. This is due to the position of Corbyn on Brexit, or rather the lack thereof. Fisher accused Corbyn of "lack of competence, professionalism, and human decency." These are beautiful words that do not clarify the essence of Fisher's displeasure with the leader of the Labor Party. More precisely: Jeremy Corbyn, who has led the party since before Brexit, does not have a clear position on this issue. That is, Corbyn has repeatedly stated that the situation requires a second referendum. However, as it turned out, a certain part of the party does not like this formulation. Deputies want to clearly understand and realize in what direction their party is moving, what Brexit they want to achieve. Corbyn does not give such a position, believing that it is the people who must once again decide the fate of the state. Thus, the fact is obvious: in both main parties of the country, there is a split. Many conservatives do not support the position of their leader Johnson, and 20 members of the party had to leave its ranks. The Labor Party is displeased with the absence of Corbyn's position. This is another bad news for the UK. In the period when the deputies must unite to finally decide how to implement Brexit, in practice, it turns out that more parties and individual deputies profess different political views, and the majority opinion does not need the same opinion. It turns out that the parliament unanimously blocks the deal by Teresa May, Johnson's Brexit "No Deal", but cannot propose an alternative (by majority vote). Brexit runs the risk of drag on for years to come. What to expect from the pound/dollar currency pair today? The pound/dollar currency pair has completed the closing under the level of 38.2% (1.2501). Thus, today I expect a close under the upward channel and a further fall in the direction of the correction level of 23.6% (1.2293). The pound is at risk of falling back although deputies managed to push the Brexit "No Deal" a bit. The Fibo grid is based on the extremes of March 13, 2019, and September 3, 2019. Forecast for GBP/USD and trading recommendations: I recommend buying the pair with the target of 1.2668 and a stop-loss under the level of 1.2501 if a new close is performed above the Fibo level of 38.2%. I recommend selling the pair with a target of 1.2308 after closing after the upward channel, with the stop-loss order above the Fibo level of 38.2%. The material has been provided by InstaForex Company - www.instaforex.com |
| Trading strategy for EUR/USD on September 23rd. Business activity in Germany knocked out euro Posted: 23 Sep 2019 01:20 AM PDT EUR/USD – 4H. As seen on the 4-hour chart, the EUR/USD pair performed two rebounds from the upper line of the downward trend channel, showing its unpreparedness for growth. Those rebounds led to a reversal of the pair in favor of the US dollar and the resumption of the fall in the direction of the corrective level of 161.8% (1.0918). A signal for sales was also received – "closing below the Fibo level of 127.2% (1.1024)". Formally, there is also a signal for bulls – bullish divergence of the CCI indicator, but at the moment its low is already broken. Thus, the euro/dollar remains within the downward channel, which continues to determine the mood of traders. There was no information background on Friday; there were no interesting economic reports or speeches by senior US and EU officials. Bulls are still "on the fence" and continue to wait for the necessary information background. What will be interesting this trading week? The week will begin without many revelations. Today, on Monday, business activity indices in services, production, and composite indices will be released in Germany, the European Union, and America. The values of these indices will be only preliminary, so the reaction of traders to them can be restrained. Nevertheless, close attention will be paid to business activity in the manufacturing sector of each of the above-mentioned countries. The reason is banal. It is a business activity in the industry that causes the greatest fears in terms of recession in both countries and the eurozone. In the European Union, everything has been bad for quite some time. Business activity in Germany and the EU is at very low levels, indicating a serious slowdown. In America, the situation is slightly better, but even there, business activity in industry threatens to fall under the "red line". So far, these indices put pressure only on the euro, but if America "follows the path" of the European Union, then the US dollar may begin to fall in price. Just half an hour ago, the indices of business activity in Germany were released. As it turned out, traders took a very negative view of the fact that all three indices were much worse than expected. As for business activity in the manufacturing sector, it fell from 43.5 to 41.4. Disastrous value. Now, traders have to make sure that the situation in the European Union is no better since the locomotive of the European economy is experiencing such serious problems, and resume selling the euro. Also today, Mario Draghi is scheduled to address the Committee on Economic and Monetary Issues of the European Parliament. The rhetoric of the ECB Chairman no longer falls under the definition of "hawkish", so the only question this time is whether it will be completely "dovish" or Draghi will try not to disappoint traders once again? Given the decline in rates at the last meeting of the ECB, there is no reason to count on anything optimistic. Thus, the euro on the first day of the week risks falling very much paired with the US dollar. What to expect today from the euro/dollar currency pair? On September 23, I expect the euro/dollar pair to continue falling in the direction of the correction level of 161.8% (1.0918). The information background from Germany has already harmed the euro, and news from the eurozone can finish off the euro, as well as Mario Draghi's speech in the afternoon. Also, indices of business activity in the United States will be released today, which may also decrease compared to the previous month. But for the euro, this is little consolation. The Fibo grid is based on the extremes of May 23, 2019, and June 25, 2019. Forecast for EUR/USD and trading recommendations: I recommend selling the pair today with the target of 1.0927, as a new consolidation was made under the level of 1.1024. A stop-loss order above the level of 1.1029. It will be possible to buy a pair after closing above a downward trend channel, but it is better to wait until it also consolidates above the correction level of 100.0% (1.1106). The material has been provided by InstaForex Company - www.instaforex.com |
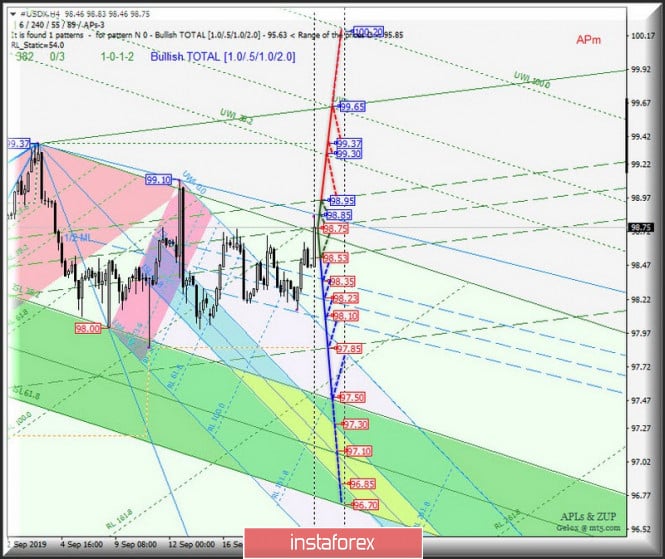
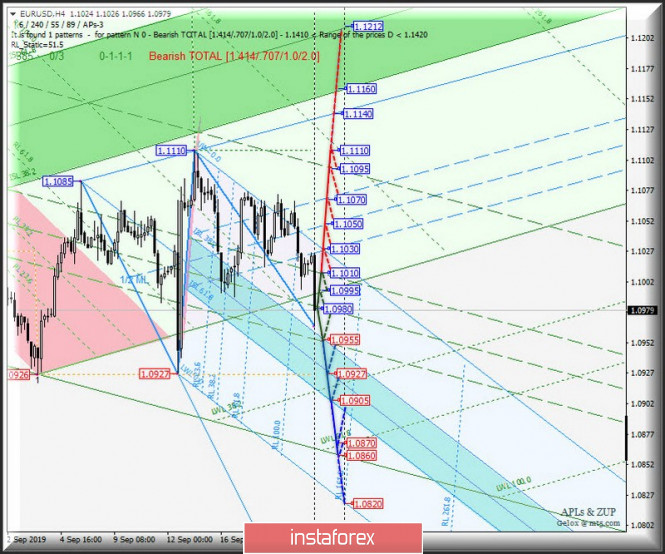
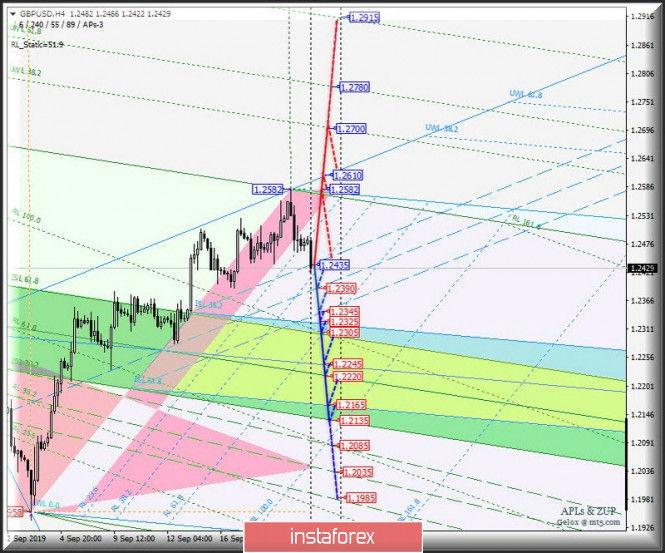
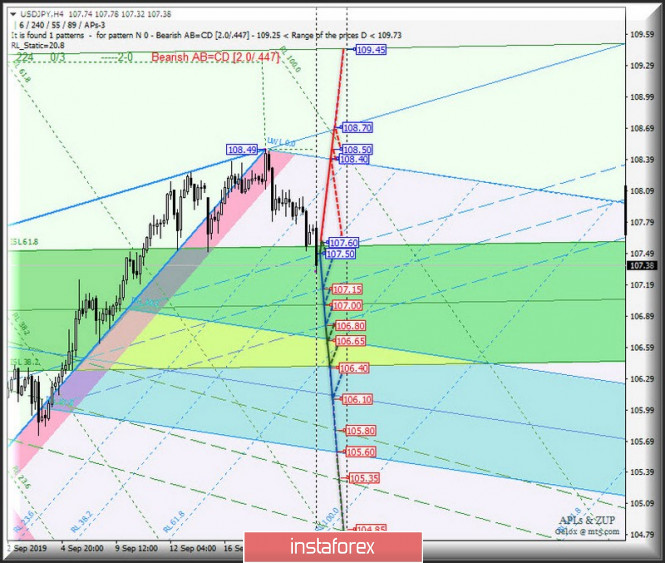


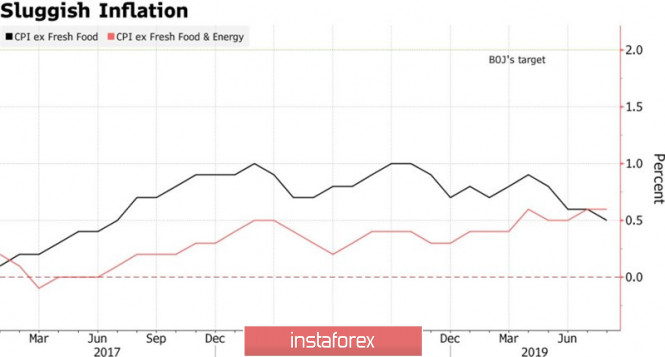
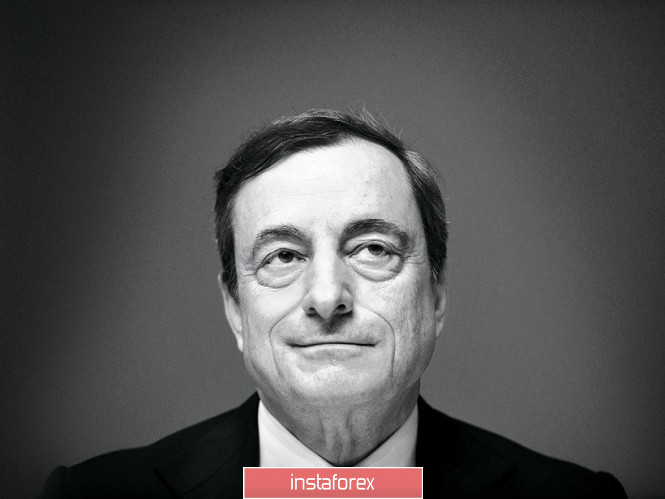
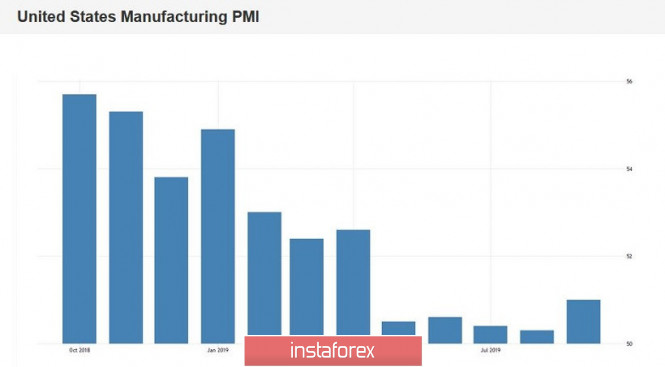
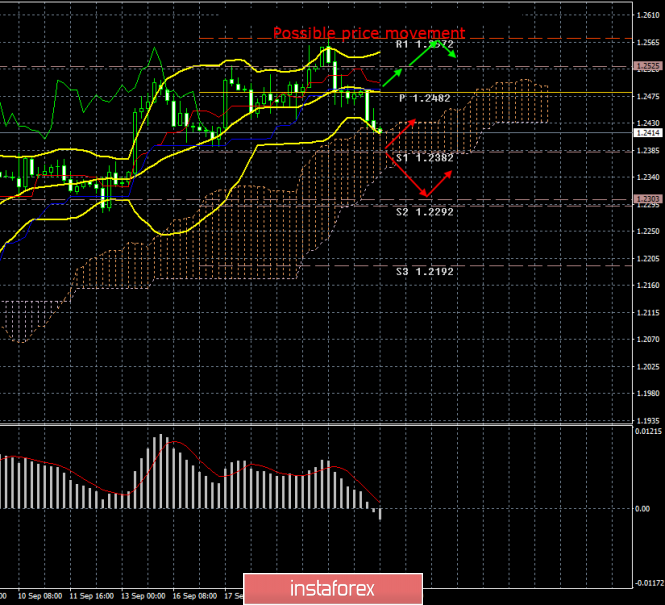
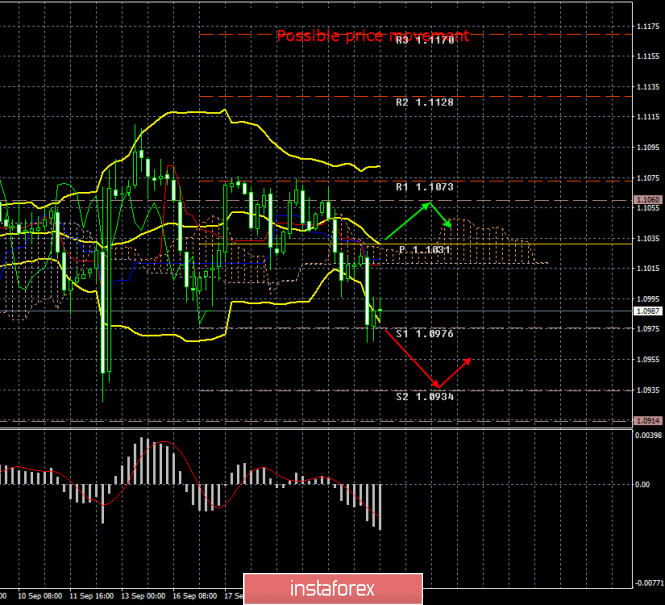
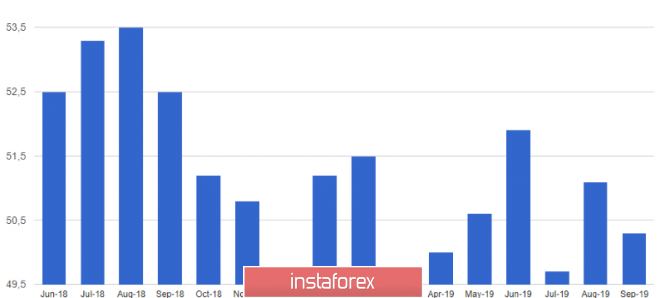
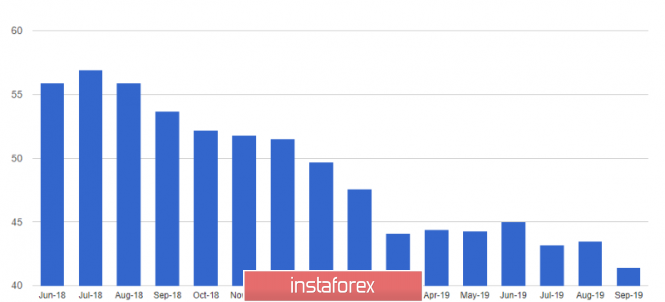
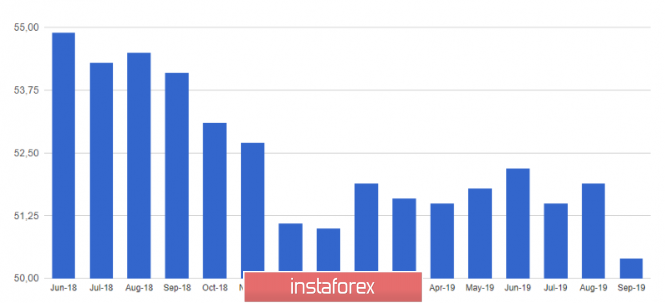
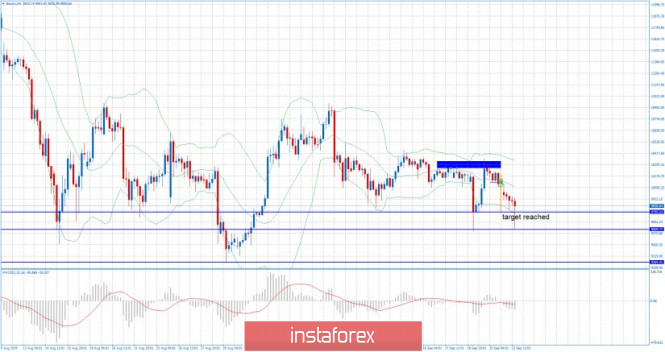
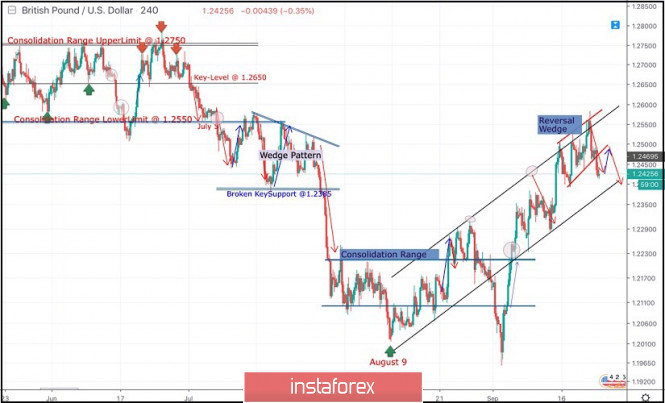
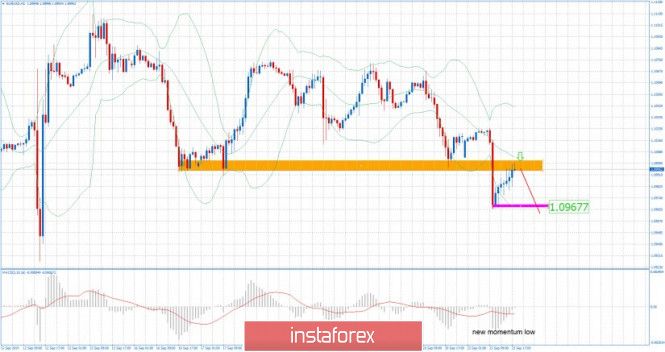
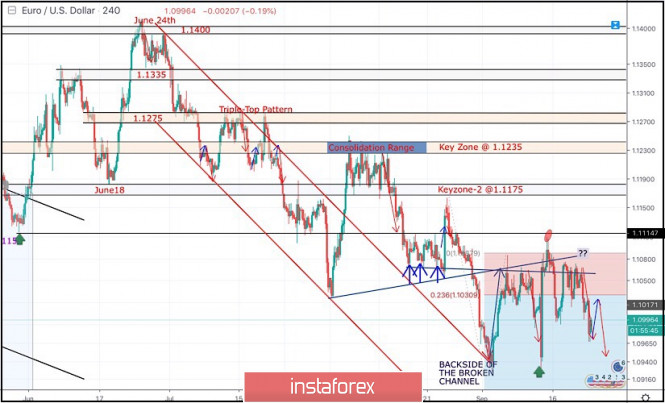
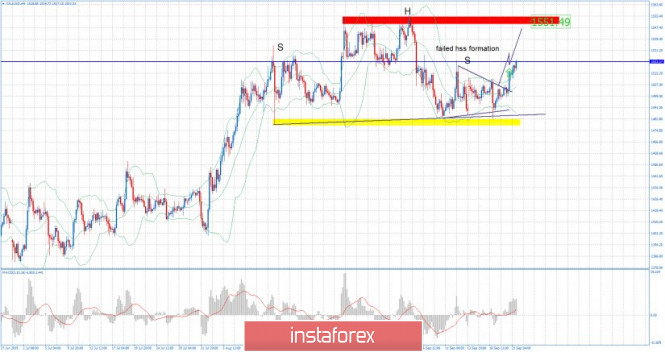

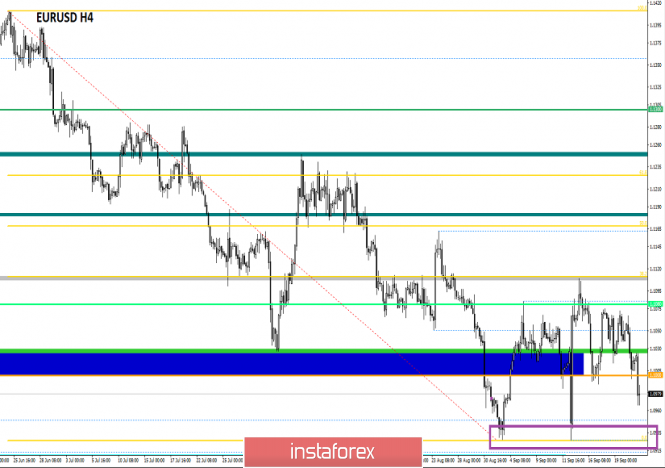
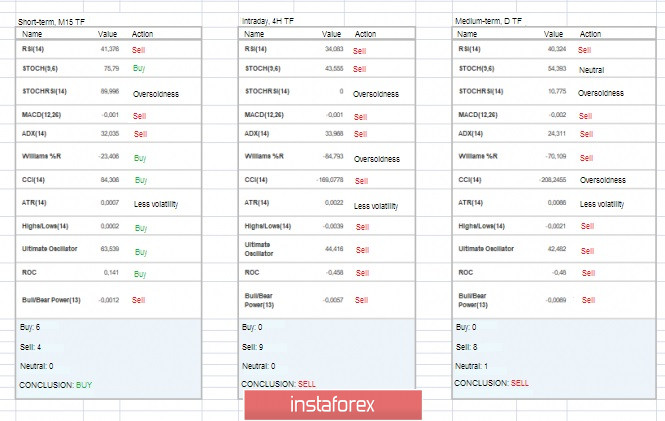
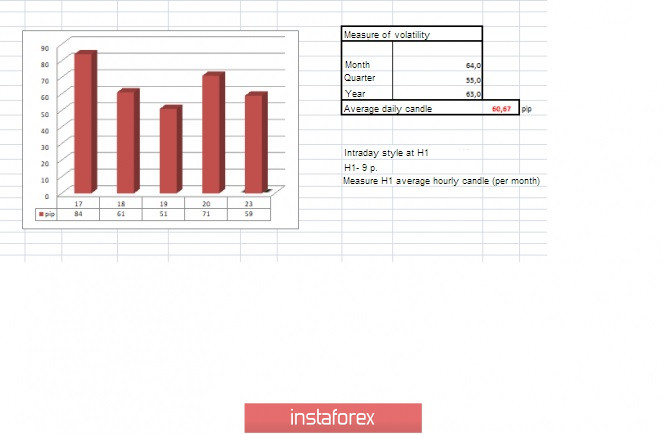
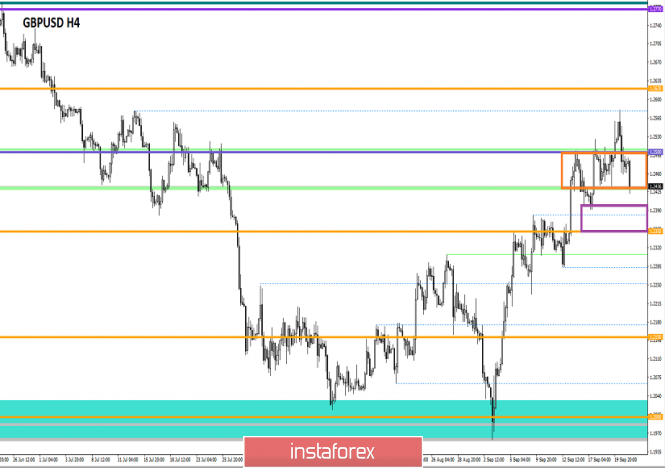
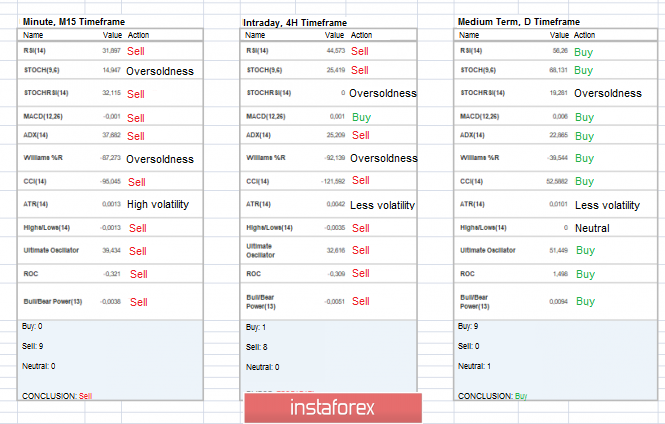
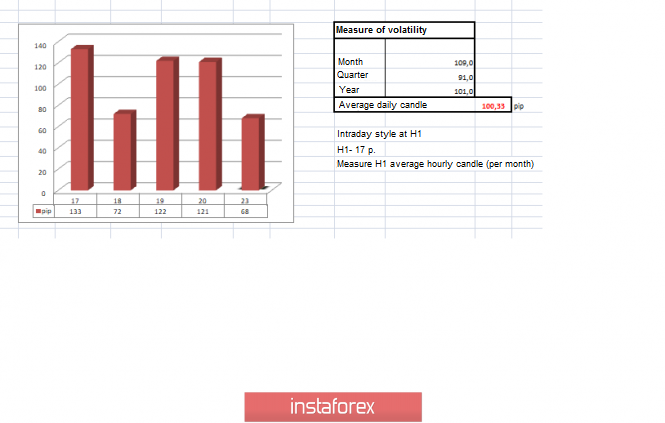
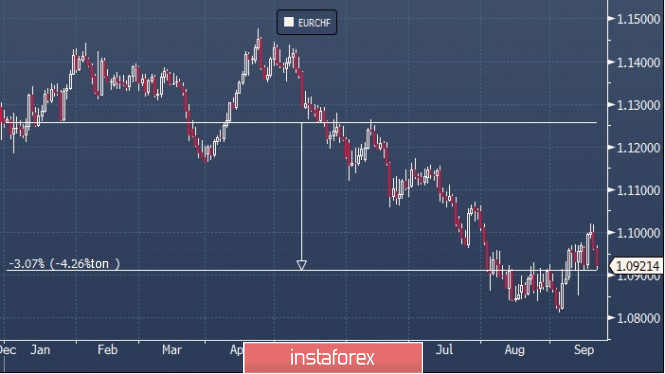
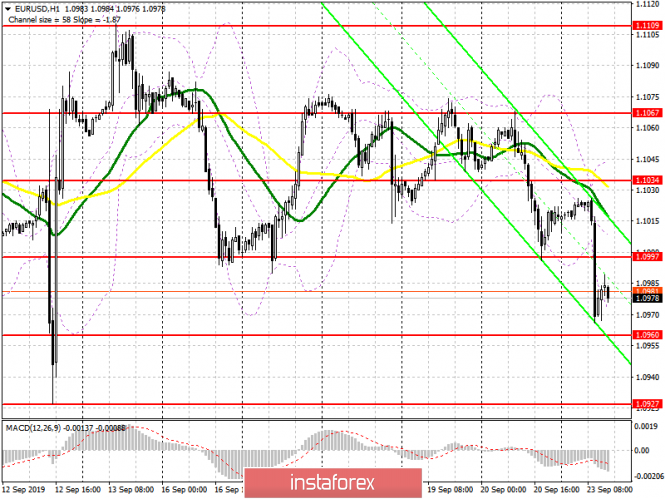
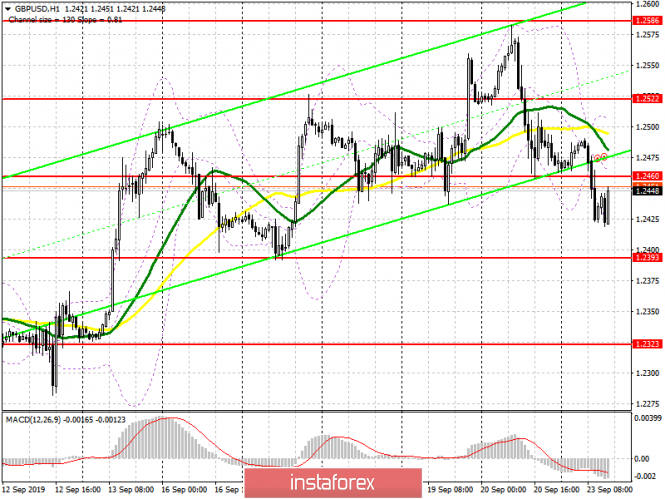
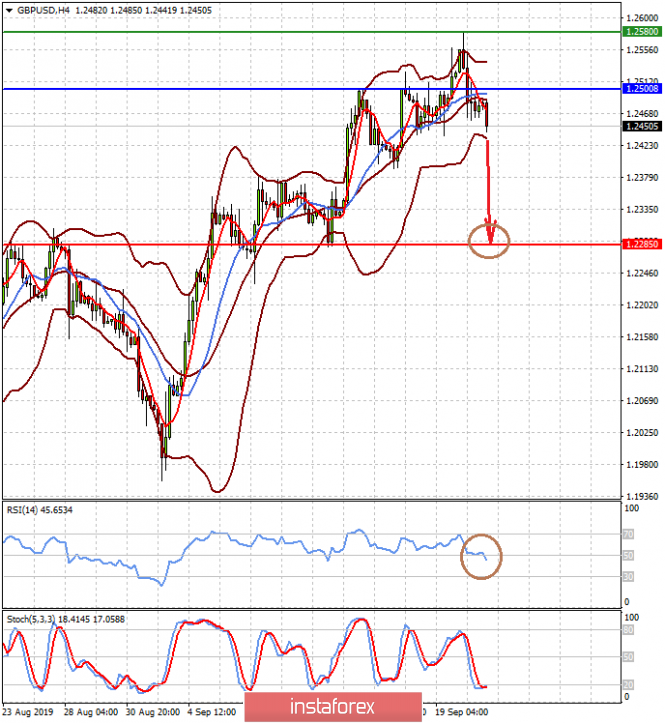
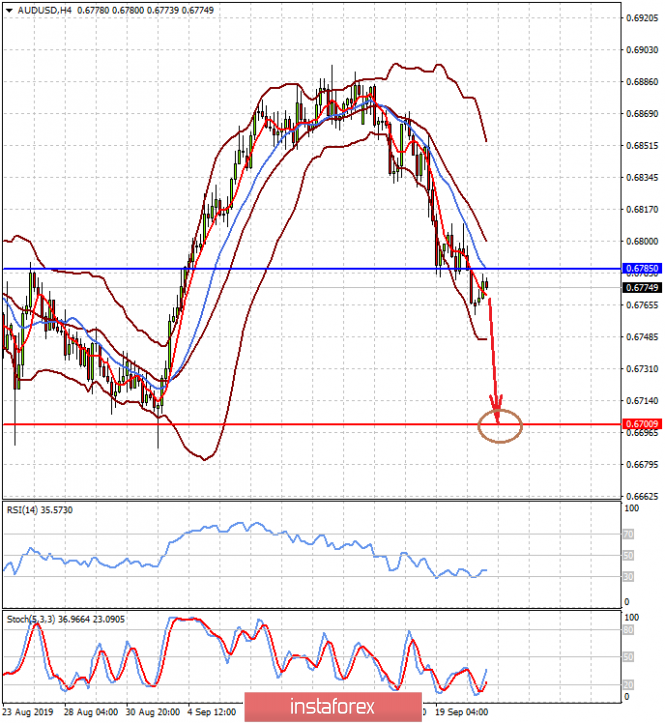

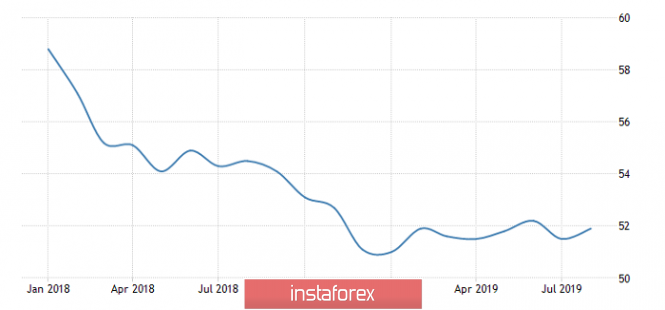
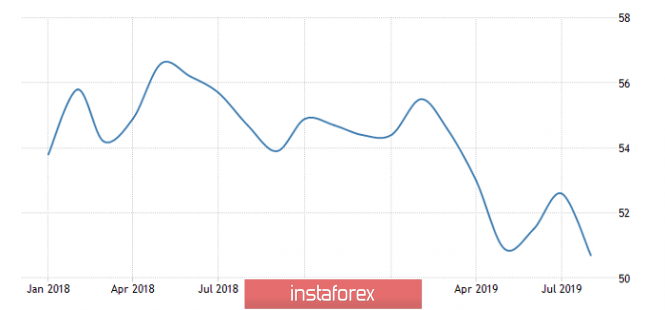
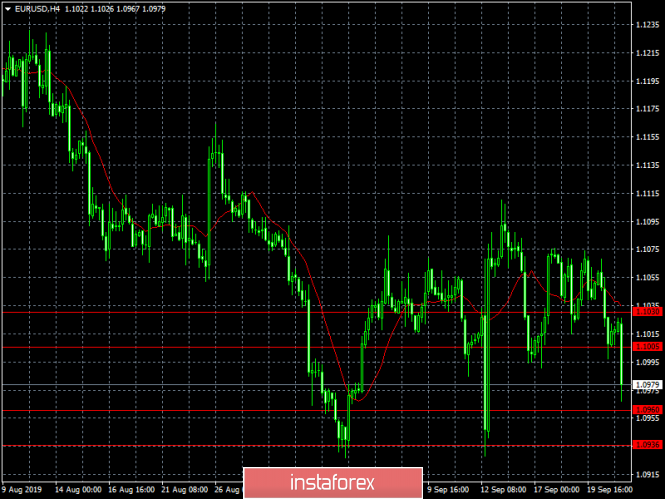
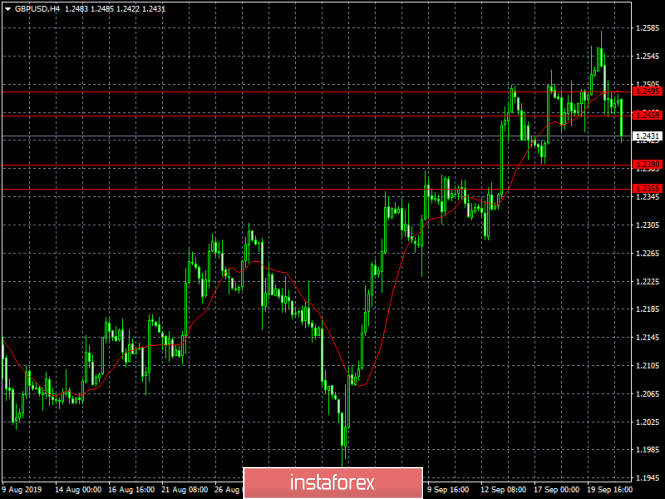

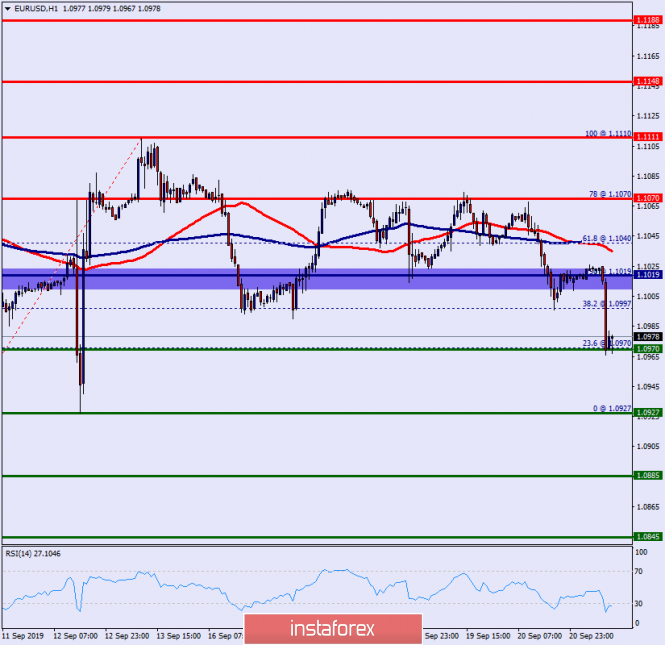
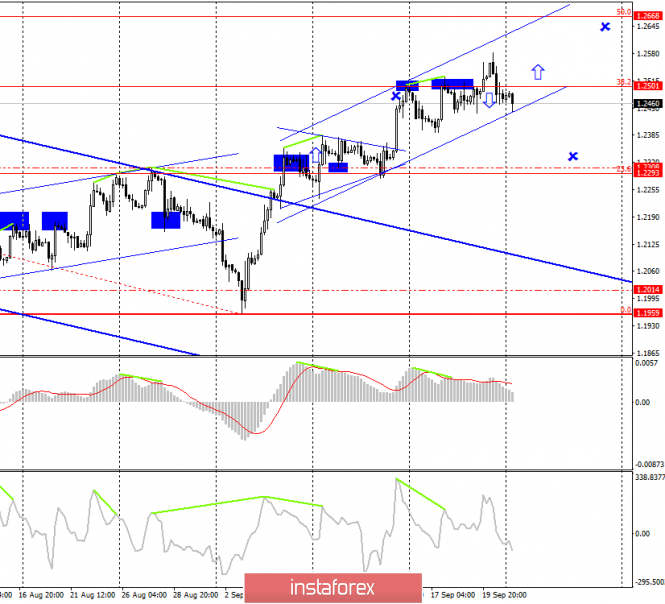
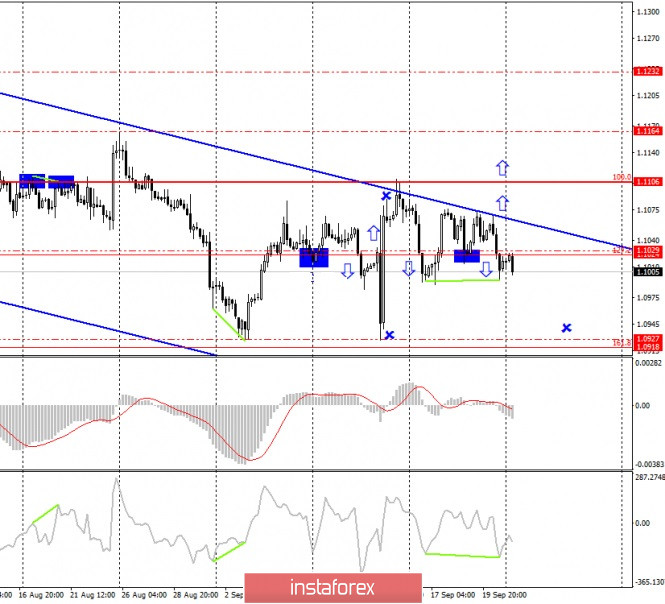
| You are subscribed to email updates from Forex analysis review. To stop receiving these emails, you may unsubscribe now. | Email delivery powered by Google |
| Google, 1600 Amphitheatre Parkway, Mountain View, CA 94043, United States | |
No comments:
Post a Comment