
Forex analysis review |
- Fractal analysis of the main currency pairs as of September 30
- GBP/USD. Results of the month and previews of the new week. The historic and unprecedented victory of the Parliament over
- EUR/USD. Results of the month and previous of the new week. Will inflation slow down in the European Union?
- Ichimoku cloud indicator short-term analysis of EURUSD for September 30, 2019
- Weekly Gold analysis
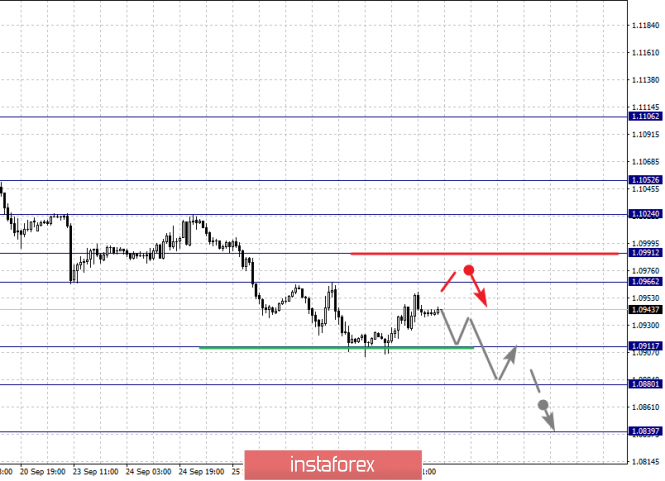
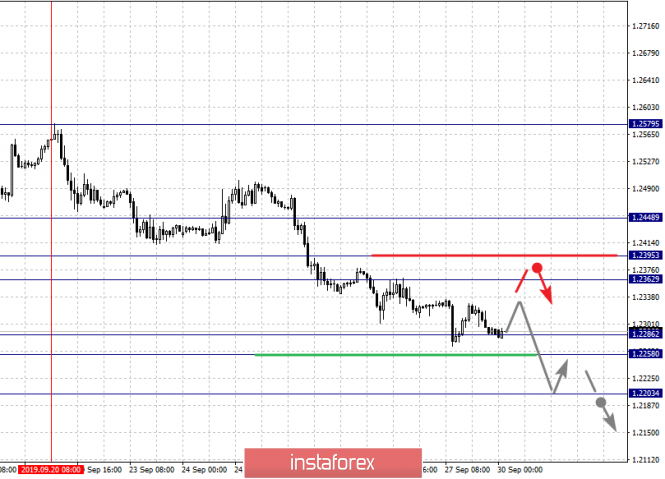
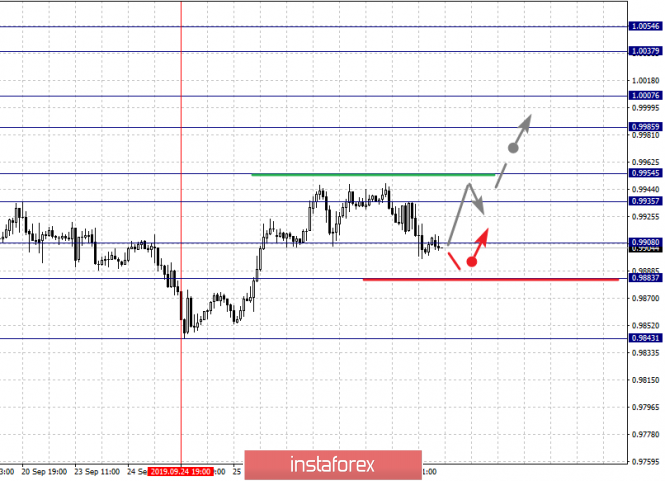
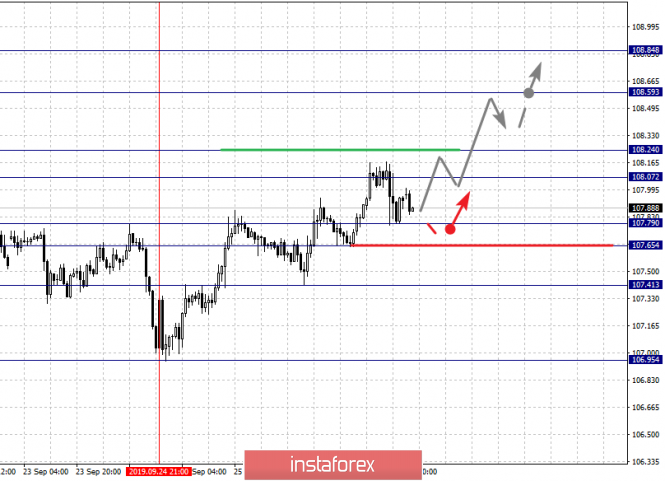
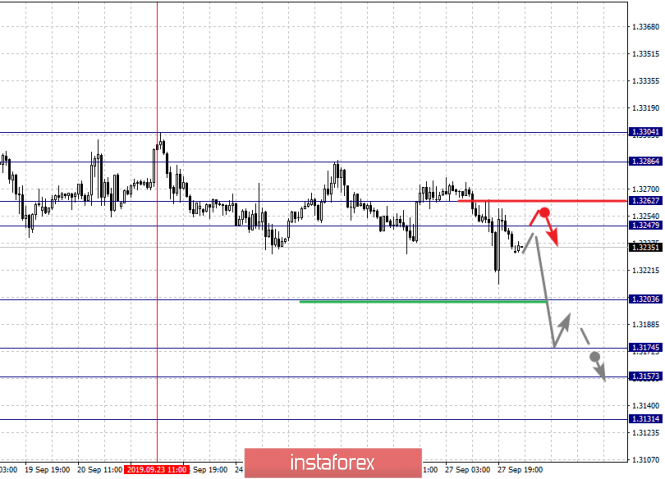
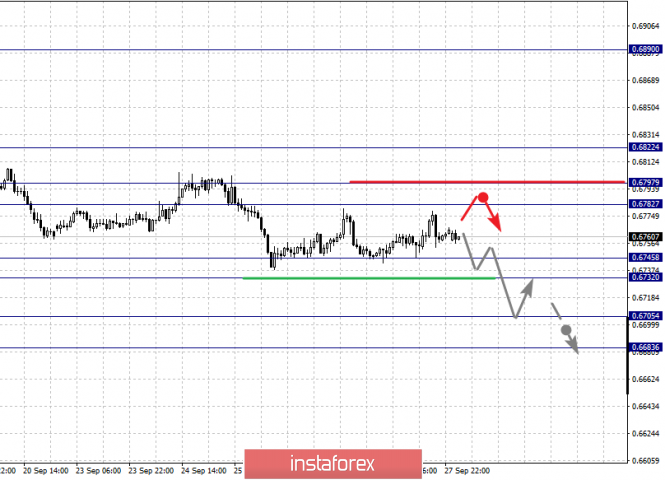
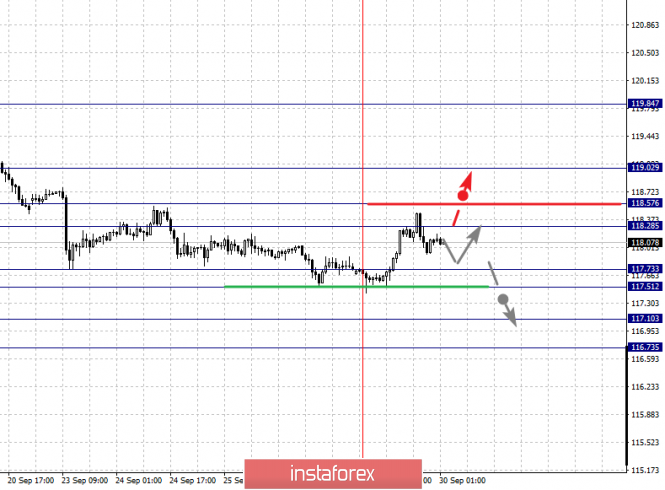
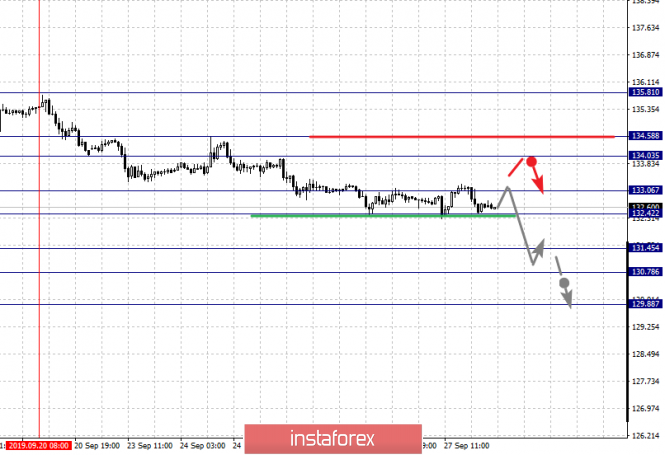
| Fractal analysis of the main currency pairs as of September 30 Posted: 29 Sep 2019 05:37 PM PDT Forecast for September 30 : Analytical review of currency pairs on the scale of H1: For the euro / dollar pair, the key levels on the H1 scale are: 1.1052, 1.1024, 1.0991, 1.0966, 1.0911, 1.0880 and 1.0839. Here, we continue to monitor the development of the descending structure of September 13. Short-term downward movement is expected in the range 1.0911 - 1.0880. The breakdown of the last value will lead to a movement to a potential target - 1.0839. When this level is reached, we expect a pullback to the top. Short-term upward movement is possibly in the range of 1.0966 - 1..0991. The breakdown of the last value will lead to an in-depth correction. Here, the target is 1.1024. This level is a key support for the bottom. Its breakdown will allow you to count on movement to a potential target - 1.1052. We are waiting for the initial conditions for the top to this level. The main trend is the descending structure of September 13. Trading recommendations: Buy: 1.0966 Take profit: 1.0990 Buy 1.0993 Take profit: 1.1024 Sell: 1.0910 Take profit: 1.0882 Sell: 1.0878 Take profit: 1.0840 For the pound / dollar pair, the key levels on the H1 scale are: 1.2448, 1.2395, 1.2362, 1.2362, 1.2286, 1.2258 and 1.2203. Here, we are following the development of the descending structure of September 20. Short-term downward movement is expected in the range 1.2286 - 1.2258. The breakdown of the last value will lead to movement to a potential target - 1.2203. When this level is reached, we expect a pullback to the top. Short-term upward movement is expected in the range 1.2362 - 1.2395. The breakdown of the latter value will lead to an in-depth correction. Here, the target is 1.2448. This level is a key support for the downward structure. The main trend is the descending structure of September 20. Trading recommendations: Buy: 1.2362 Take profit: 1.2395 Buy: 1.2397 Take profit: 1.2446 Sell: 1.2286 Take profit: 1.2260 Sell: 1.2256 Take profit: 1.2204 For the dollar / franc pair, the key levels on the H1 scale are: 1.0054, 1.0037, 1.0007, 0.9985, 0.9954, 0.9935, 0.9908 and 0.9883. Here, the price is in the initial conditions for the upward cycle of September 24. The continuation of movement to the top is possibly after the breakdown of the level of 0.9935. In this case, the first target is 0.9935. The breakdown of which, in turn, will lead to movement to the level of 0.9985. Short-term upward movement, as well as consolidation is in the range of 0.9985 - 1.0007. We consider the level of 1.0037 to be a potential value for the top. Upon reaching which, we expect consolidated movement in the range of 1.0037 - 1.0054. Short-term downward movement is possibly in the range of 0.9908 - 0.9883. The breakdown of the latter value will lead to the cancellation of the upward structure. Here, we expect movement to a potential target - 0.9843. The main trend is the initial conditions for the top of September 24. Trading recommendations: Buy : 0.9935 Take profit: 0.9952 Buy : 0.9955 Take profit: 0.9985 Sell: 0.9906 Take profit: 0.9888 Sell: 0.9880 Take profit: 0.9845 For the dollar / yen pair, the key levels on the scale are : 108.84, 108.59, 108.24, 108.07, 107.79, 107.65 and 107.41. Here, we are following the development of the ascending structure of September 24. Short-term upward movement is expected in the range 108.07 - 108.24. The breakdown of the last value should be accompanied by a pronounced upward movement. Here, the target is 108.59. Price consolidation is near this level. For the potential value for the top, we consider the level of 108.84. Upon reaching this value, we expect a pullback to the bottom. Short-term downward movement is expected after the breakdown of the last value in the range of 107.79 - 107.65, which will lead to an in-depth correction. Here, the goal is 107.41. This level is a key support for the top. The main trend: the rising structure of September 24. Trading recommendations: Buy: 108.08 Take profit: 108.24 Buy : 108.26 Take profit: 108.57 Sell: 107.79 Take profit: 107.66 Sell: 107.63 Take profit: 107.44 For the Canadian dollar / US dollar pair, the key levels on the H1 scale are: 1.3304, 1.3286, 1.3262, 1.3247, 1.3203, 1.3174, 1.3157 and 1.3131. Here, we are following the development of the descending structure of September 23. The continuation of the movement to the bottom is expected after the breakdown of the level of 1.3203. In this case, the target is 1.3174. Price consolidation is in the range of 1.3174 - 1.3157. For the potential value for the bottom, we consider the level of 1.3131. Upon reaching this level, we expect a pullback to the top. Short-term upward movement is possibly in the range of 1.3247 - 1.3262. The breakdown of the last value will lead to an in-depth correction. Here, the target is 1.3286. This level is a key support for the top. Its breakdown will lead to the development of an upward structure. In this case, the potential target is 1.3304. The main trend is the descending structure of September 23. Trading recommendations: Buy: 1.3247 Take profit: 1.3260 Buy : 1.3264 Take profit: 1.3286 Sell: 1.3203 Take profit: 1.3175 Sell: 1.3173 Take profit: 1.3158 For the Australian dollar / US dollar pair, the key levels on the H1 scale are : 0.6822, 0.6797, 0.6782, 0.6745, 0.6732, 0.6705 and 0.6683. Here, we are following the development of the downward cycle of September 13. Short-term downward movement is possibly in the range 0.6745 - 0.6732. The breakdown of the last value should be accompanied by a pronounced downward movement. Here, the target is 0.6705. Price consolidation is near this value. For the potential value for the bottom, we consider the level of 0.6683. Upon reaching which, we expect a departure in the correction. Short-term upward movement is possibly in the range of 0.6782 - 0.6797. The breakdown of the last value will lead to a long correction. Here, the potential target is 0.6822. This level is a key support for the downward structure. The main trend is the downward cycle of September 13. Trading recommendations: Buy: 0.6782 Take profit: 0.6795 Buy: 0.6797 Take profit: 0.6820 Sell : 0.6745 Take profit : 0.6734 Sell: 0.6730 Take profit: 0.6707 For the euro / yen pair, the key levels on the H1 scale are: 119.02, 118.57, 118.28, 117.73, 117.51, 117.10 and 116.73. Here, the price is in correction from the upward trend of September 18 and forms a small potential for the top of September 27. The continuation of the movement to the bottom is expected after the price passes the noise range 117.73 - 117.51. In this case, the target is 117.10. For the potential value for the bottom, we consider the level of 116.73. Upon reaching this value, we expect a rollback to the top. Short-term upward movement is possibly in the range 118.28 - 118.57. The breakdown of the latter value will lead to in-depth movement. Here, the goal is 119.02. This level is a key support for the downward structure. The main trend is the descending structure of September 18, the correction stage. Trading recommendations: Buy: 118.28 Take profit: 118.55 Buy: 118.60 Take profit: 119.00 Sell: 117.50 Take profit: 117.10 Sell: 117.08 Take profit: 116.73 For the pound / yen pair, the key levels on the H1 scale are : 135.81, 134.58, 134.03, 133.06, 132.42, 131.45, 130.78 and 129.88. Here, we are following the development of the descending structure of September 20. Short-term movement to the bottom is expected in the range 133.06 - 132.42. The breakdown of the latter value should be accompanied by a pronounced downward movement. In this case, the target is 131.45. Price consolidation is in the range of 131.45 - 130.78. We consider the level of 129.88 to be a potential value for the downward movement. Upon reaching this level, we expect a pullback to the top. Short-term upward movement is possibly in the range of 134.03 - 134.58. The breakdown of the latter value will lead to the formation of an upward structure. In this case, the potential target is 135.81. The main trend is the formation of the downward structure of September 20. Trading recommendations: Buy: 134.03 Take profit: 134.55 Buy: 134.60 Take profit: 135.80 Sell: 132.40 Take profit: 131.45 Sell: 131.43 Take profit: 130.80 The material has been provided by InstaForex Company - www.instaforex.com |
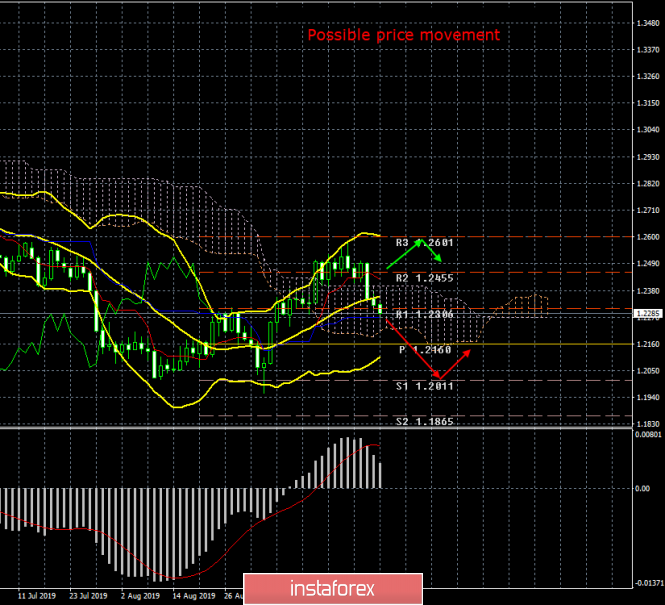
| Posted: 29 Sep 2019 03:41 PM PDT 24-hour timeframe There is opposition in any government in any country at all times. Sometimes this opposition simply expresses its opinion, sometimes it is required to adjust the decisions of the government, but in the case of Britain in the last three years, the opposition is needed in order to fight with the prime ministers. Moreover, in the confrontations between Parliament - Theresa May and Parliament - Boris Johnson, most of the neutral public and analysts choose the side of the Parliament, that is, the opposition. What Johnson and May have in common is that they, as leaders of the country, decided that they should, by all means and by any means possible, withdraw the country from the EU, that is, realize the will of citizens expressed in the 2016 referendum. In principle, this is absolutely logical. But the fact that it is necessary to leave the European Union as gently as possible, that is, with a minimum of negative consequences, has always been a concern for the deputies of the Parliament. Moreover, from different parties, and not just Labour, as the main opposition of the Conservatives. Many conservatives did not agree with the policies of both Theresa May and Boris Johnson. Those who were not afraid to express their opinion have already left this party and their posts in Parliament, voluntarily or forcibly. The main problem in the current situation, which does not even allow us to say with certainty which option is the most preferable and safe for the UK, is that the British people actually made the decision, but since the victory of supporters of the EU exit was minimal (52% out of 100%) , then at least 48% of the UK's population will be dissatisfied in any case. If Brexit gives rise to many problems of an economic plan, worsens the lives of citizens, creates problems at the borders and a shortage of goods, then all the bumps will fall right on the government. Therefore, most deputies regularly reject government attempts to withdraw the country from the EU as quickly as possible. If there was a "soft" war with Theresa May, then there is a "war without rules" with Boris Johnson. This is because Johnson immediately took a "hard" position under the title "I don't care what the Parliament believes, I will do what I want." The prime minister has a lot of power, so the Parliament went to rest. But since the British MPs have been fighting for several years for the most "soft" Brexit, Johnson's plan was quickly realized. The Supreme Court ruled that the suspension of the work of deputies is illegal and canceled it. And now Boris Johnson, who couldn't agree with the European Union, couldn't agree with the Parliament, couldn't offer an alternative to the "backstop", does not want to postpone Brexit, will have three weeks to do at least something that will be regarded as a constructive action. But it's hard to say what it will be and whether there will be one at all. The fact remains: on October 17/18, at the EU summit, Johnson must either sign a "deal" with Brussels, either ask for Brexit postponement, or commit a direct violation of the law and withdraw the country from the EU without a "deal". At the moment, there is no construct with the first option, so the question is: is Johnson ready to put an end to his career, but to withdraw Britain from the European Union against the will of deputies? After all, such an option can then also be challenged and canceled in the courts. The reason is simple: the prime minister violated the law of the country whose head he is ... The pound sterling feels that the clouds are gathering again and so the currency started to fall in price. In October, at least another interim decision on Brexit should be made. In principle, any option except the implementation of the hard Brexit on October 31 is positive for the British currency. Trading recommendations: On the 24-hour timeframe, the pound/dollar pair has started a correction against the upward trend, but if it overcomes the Kijun-sen line, then the downward movement will continue with the target of 1,2011 (near multi-year lows of the pair), which can be traded off by traders. In addition to the technical picture, fundamental data and the time of their release should also be taken into account. Explanation of the illustration: Ichimoku indicator: Tenkan-sen is the red line. Kijun-sen is the blue line. Senkou Span A - light brown dotted line. Senkou Span B - light purple dashed line. Chikou Span - green line. Bollinger Bands Indicator: 3 yellow lines. MACD indicator: Red line and bar graph with white bars in the indicator window. The material has been provided by InstaForex Company - www.instaforex.com |
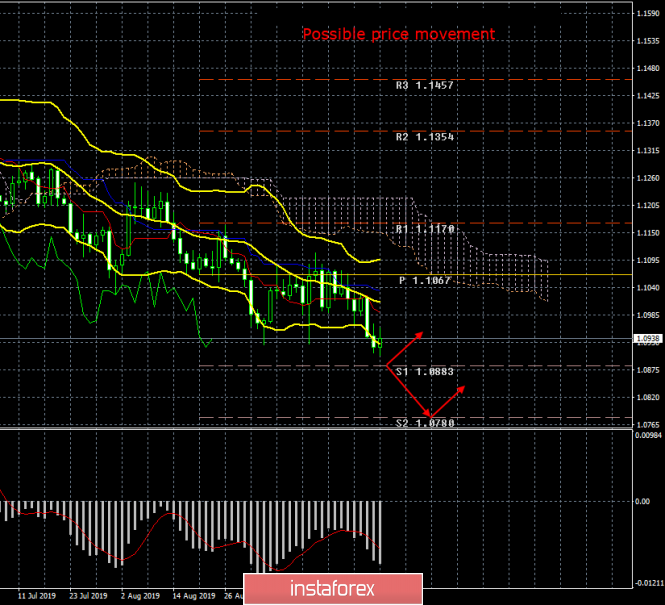
| Posted: 29 Sep 2019 03:41 PM PDT 24-hour timeframe Another month ends on the forex market and today we can sum up some results. The situation has not changed much for the euro over the past month. The downward trend remains. The correction ended near the critical Kijun-sen line. The fundamental background both local and long-term has not changed. Thus, traders may well expect a continuation of the downward movement of the EUR/USD pair in October. Just based on the fact that nothing has changed in the balance of power between the euro and the dollar. Both the Federal Reserve and the European Central Bank lowered their rates, but the European regulator also announced the revival of the quantitative stimulus program. Moreover, at the end of the month Mario Draghi will officially resign, and Christine Lagarde will take his place. The new head of the central bank - it is always suspense and uncertainty, and the foreign exchange markets do not like her, often preferring not to risk "dangerous" events. Thus, the situation for the euro has even slightly worsened and in October the bears can continue to dominate the market. Two important macroeconomic reports will be published next week. The first is a report on inflation in the European Union. Here traders can hardly hope for anything positive. Again, simply because no structural changes are taking place in the EU economy. Yes, the rate on deposits was lowered, but it took too little time for this factor to spur inflation. As for the QE program, it starts only in November. That is, it turns out that, purely theoretically, inflation in the EU may slightly accelerate, for example, by 0.1%. This may be an accident, or due to some seasonal product groups. But in general, inflation will remain unchanged at 1.0% or continue to decline further. In any case, the inflation report is unlikely to support the euro. The second important report of the week is NonFarm Payrolls in the US. This report is important because it reflects the number of new jobs created in the country over the past month. One of the main engines of the US economy is precisely the constant development and growth of the labor market. The past value of the indicator was 130,000, the previous two months were a little more positive. In September, there are expectations from +140,000 to +175,000 new jobs outside the agricultural sector, according to various forecasts. But we would like to immediately note that, as in the case of European inflation, even if the real growth in September is below 140,000, this is unlikely to cause strong sales of the US dollar, as market participants are well aware that a monthly increase in the growth rate is impossible basically. Unemployment in the United States is at a very low level, so the overall labor market is in excellent condition. NonFarm growth is several thousand less than forecasted - this is not a big problem for the American economy. The peak that threatens the dollar is a local fall within the day. So it turns out that there are no obstacles to the euro's decline. Of course, in any case, everything will depend on the mood of traders who may decide that buying the US dollar is more inappropriate, which will strengthen the pair, without visible fundamental reasons. But the likelihood of such an option is no more than 10%. A 90% probability that the pair will continue to move according to the main trend direction. Trading recommendations: The trend for the euro/dollar pair remains downward. Bears have updated two-year lows and are ready to continue to sell the pair with targets at 1.0883 and 1.0780. Thus, traders are encouraged to continue to stay in trend. It is not advisable to consider purchasing the euro yet. In addition to the technical picture, fundamental data and the time of their release should also be taken into account. Explanation of the illustration: Ichimoku indicator: Tenkan-sen is the red line. Kijun-sen is the blue line. Senkou Span A - light brown dotted line. Senkou Span B - light purple dashed line. Chikou Span - green line. Bollinger Bands Indicator: 3 yellow lines. MACD indicator: Red line and bar graph with white bars in the indicator window. The material has been provided by InstaForex Company - www.instaforex.com |
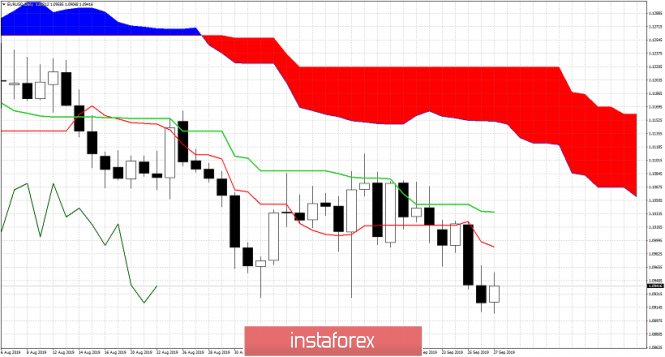
| Ichimoku cloud indicator short-term analysis of EURUSD for September 30, 2019 Posted: 29 Sep 2019 03:10 AM PDT EURUSD remains in a bearish trend making new 2019 lows after getting rejected once again at the short-term resistance of 1.1050-1.11. As long as price is below 1.1030 short-term trend remains bearish.
|
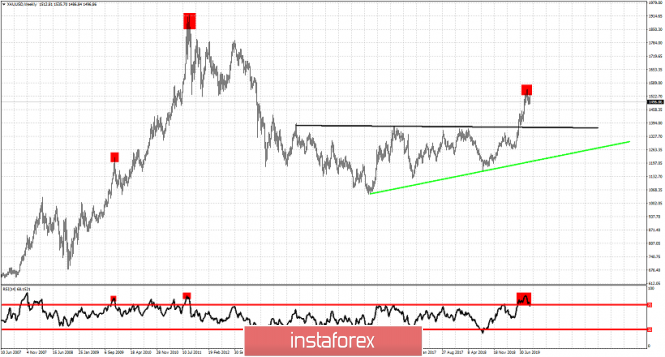
| Posted: 29 Sep 2019 03:05 AM PDT The weekly chart in Gold is givings us bearish signs. Gold might be in the process of making a major top and a bearish reversal, but we at least expect Gold to make a considerable pull back over the coming weeks specially if we see a weekly close below $1,488.
Black rectangle- major resistance broken now support Green line - upward sloping trend line support Gold price has made an impressive move higher from April when it was trading around $1.280. The RSI has now reached overbought levels only seen back at the 2011 all time highs and at the 2009 high. In both cases Gold price made a considerable at least pull back. So this time I do not expect it to be any different. A back test or a move close the the broken resistance now support black trend line is expected. Bulls do not want to see price break below the long-term green trend line support as this would imply new multi year lows are coming. However it is too early to talk about such a scenario. For now we focus on the high chances of a pull back at least towards $1,450-$1,400 which will be confirmed on a weekly close below $1,488. The material has been provided by InstaForex Company - www.instaforex.com |
| You are subscribed to email updates from Forex analysis review. To stop receiving these emails, you may unsubscribe now. | Email delivery powered by Google |
| Google, 1600 Amphitheatre Parkway, Mountain View, CA 94043, United States | |
No comments:
Post a Comment