
Forex analysis review |
- Fractal analysis of the main currency pairs for September 4
- USD / JPY vs EUR / JPY vs GBP / JPY. Comprehensive analysis of movement options from September 04, 2019 APLs & ZUP analysis
- How autumn can inspire crypto traders and give confidence to the crypto market, Bitcoin (September 3)
- AUD/CAD. The most promising cross of the week!
- US Manufacturing PMI drops to three-year low, awaiting EUR/USD pair
- Will USD growth stop soon?
- AUD/USD: which is more important - the RBA decision or US PMI data?
- Gold holds steady despite dollar strength
- Fears of Brexit lead the pound to $1.10
- EUR/USD. September 3rd. Results of the day. ISM business activity index gave the euro a little rest from its fall
- September 3, 2019 : EUR/USD Intraday technical analysis and trade recommendations.
- September 3, 2019 : GBP/USD Intraday technical analysis and trade recommendations.
- BTC 09.03.2019 -Major resistnace on the test
- EURUSD Daily candlestick is forming a bullish reversal hammer pattern
- Gold price is being bid continuing its up trend
- EUR/USD for September 03,2019 - Sell zone on EUR
- Gold 09.03.2019 - One step closer to our upward target at $1,550
- Technical analysis of EUR/USD for September 03, 2019
- AUD/USD. Caution, false price growth: Aussie adjusts based on RBA meeting
- Oil and the battle of the titans
- GBP/USD: plan for the American session on September 3. On September 4, the Board of the European Commission will consider
- EUR/USD: plan for the American session on September 3. Bulls are desperately fighting for the level of 1.0927 amid weak inflation
- Fractal analysis on major currency pairs as of September 3
- Trading strategy for Bitcoin on September 3rd. Above $11000, it will be hard to leave bitcoin
- Trading plan for EUR / USD and GBP / USD pairs on 09/03/2019
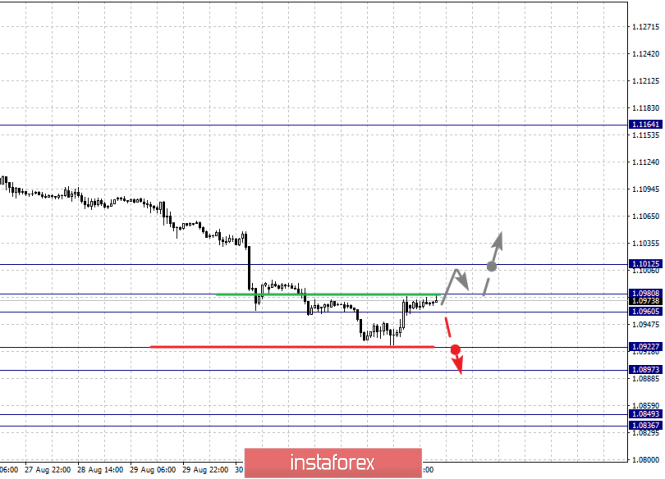
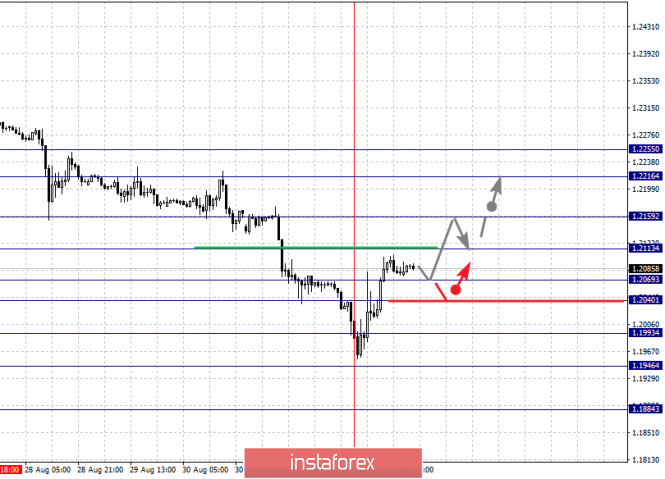
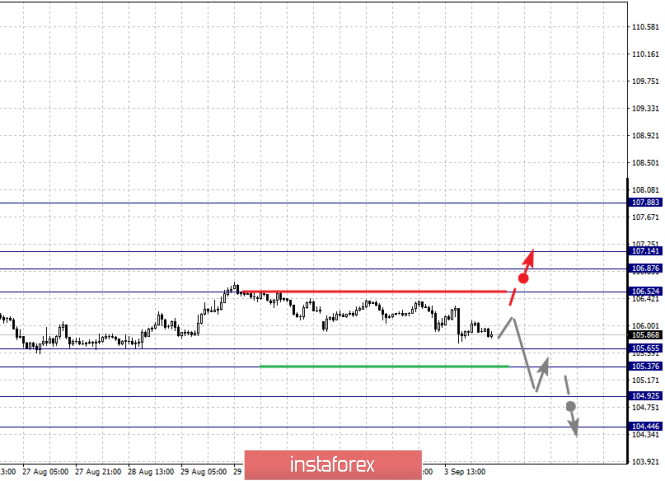
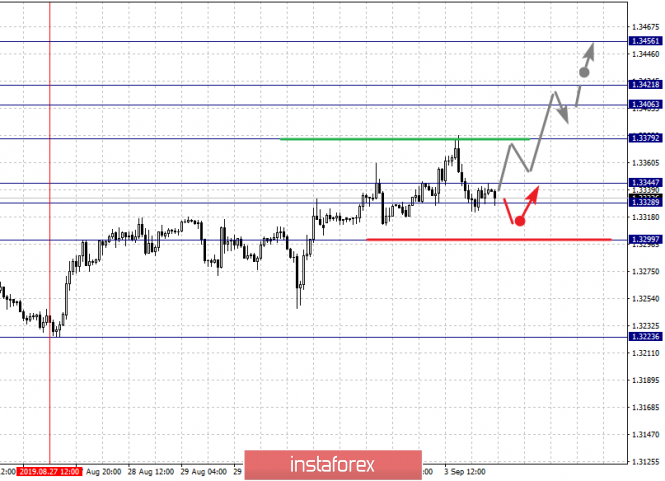
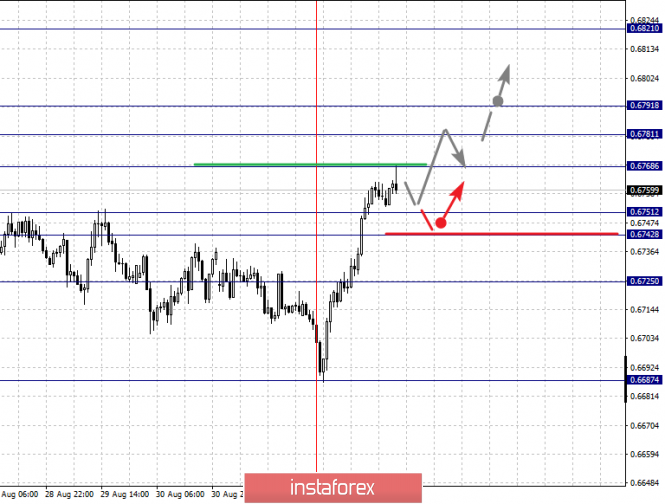
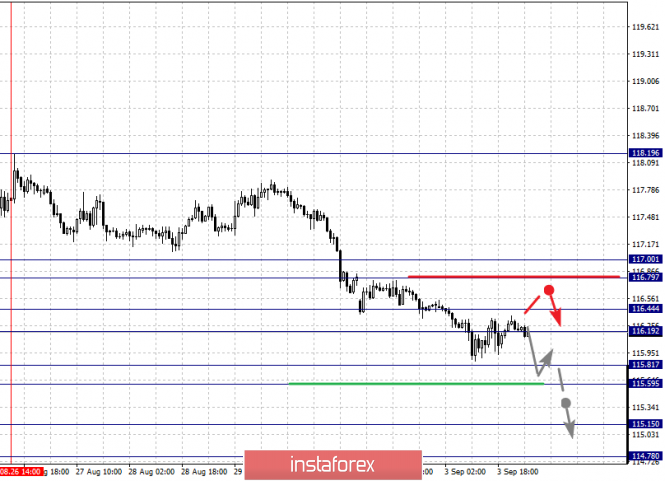
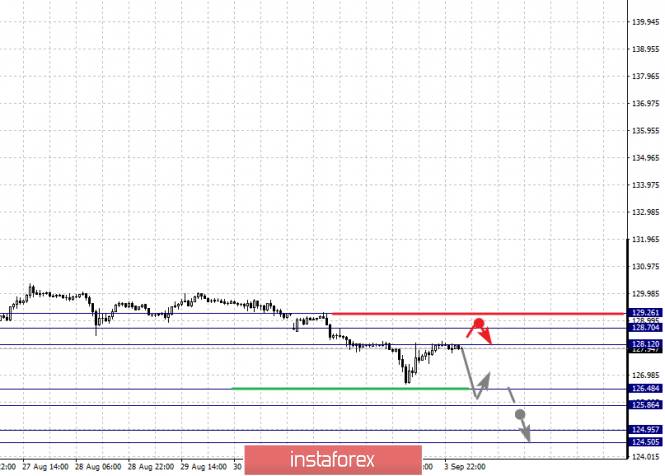
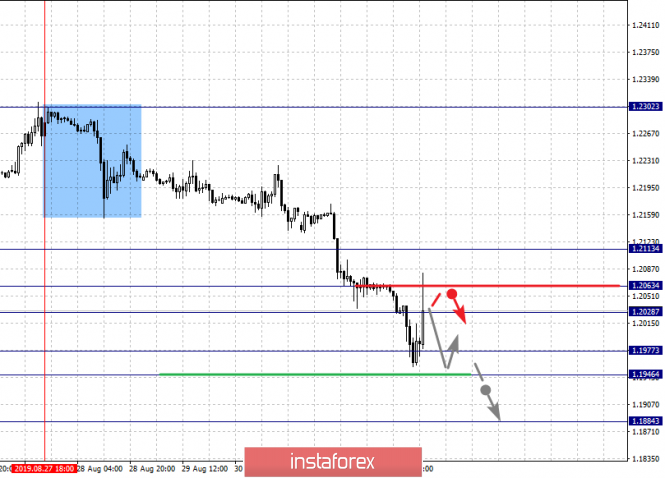
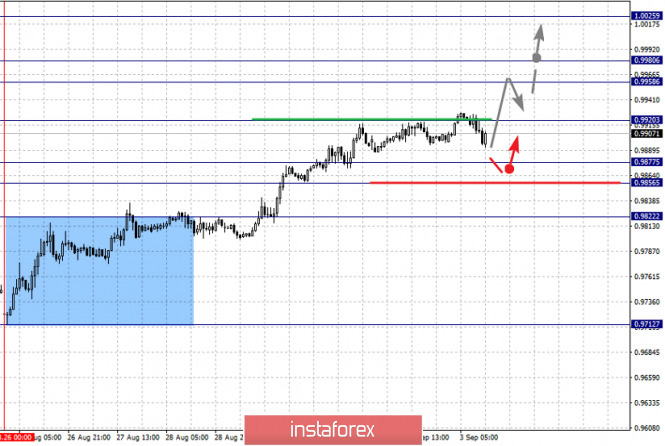
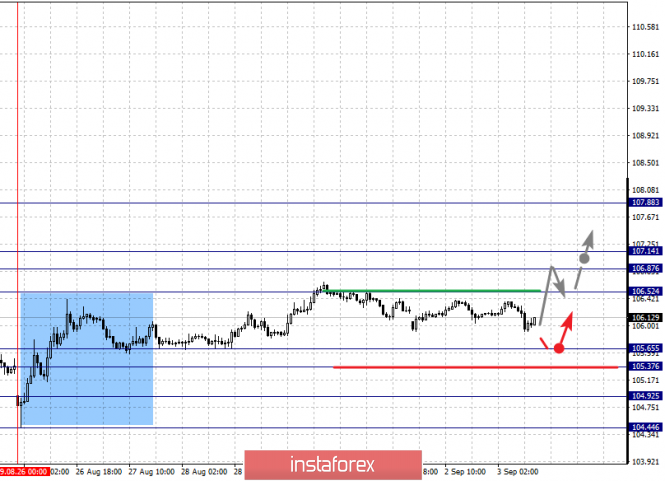
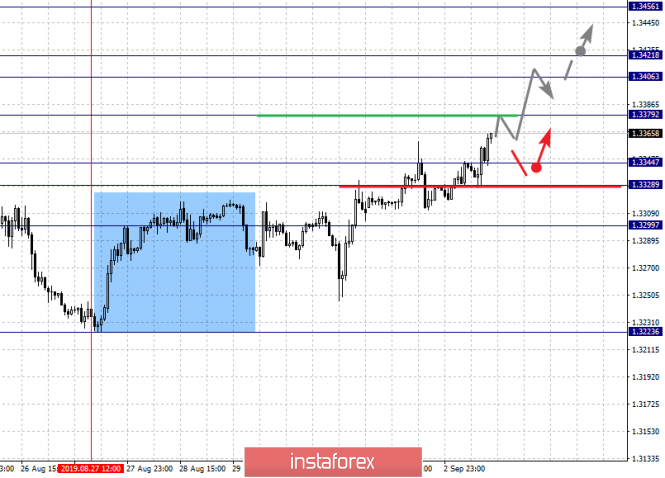
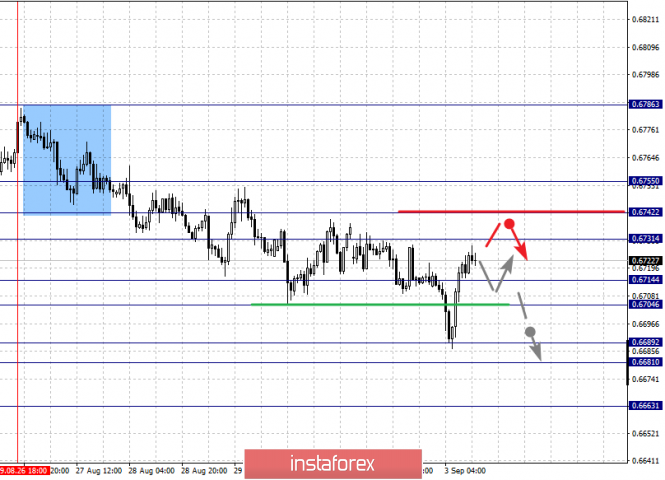
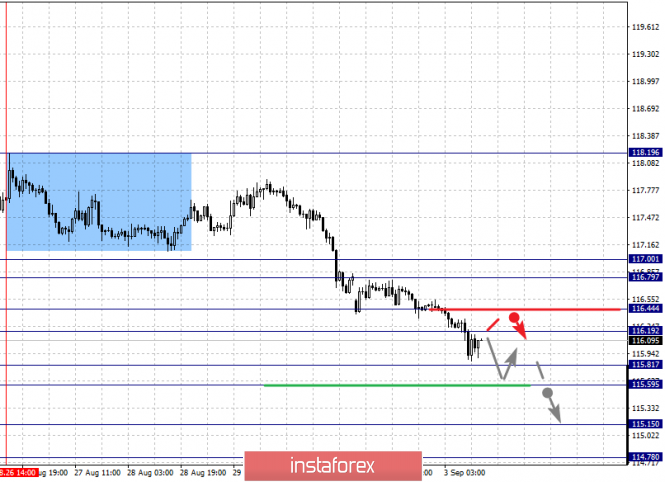
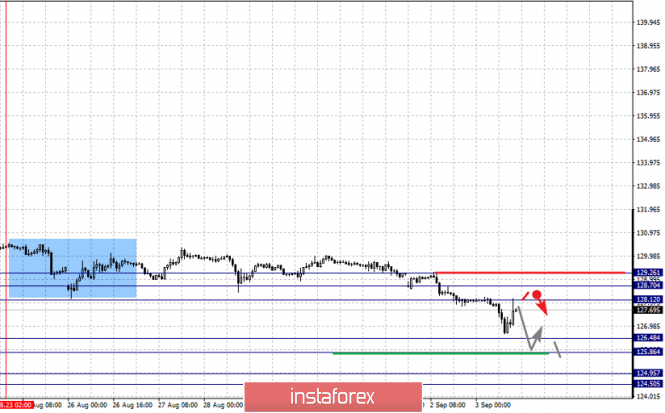
| Fractal analysis of the main currency pairs for September 4 Posted: 03 Sep 2019 06:09 PM PDT Forecast for September 4: Analytical review of currency pairs on the scale of H1: For the euro / dollar pair, the key levels on the H1 scale are: 1.1025, 1.0980, 1.0960, 1.0922, 1.0897 and 1.0849. Here, we continue to monitor the downward structure from August 26. At the moment, the price is in correction. Short-term downward movement is expected in the range 1.0922 - 1.0897. Hence, there is a high probability of a reversal in the correction zone. The breakdown of the level of 1.0897 will be accompanied by an unstable movement towards a potential descending target - 1.0849. Consolidated movement is expected in the range of 1.0960 - 1.0980. The breakdown of the last value will lead to an in-depth correction. Here, the goal is 1.1012. This level is a key support for the downward structure. The main trend is the downward cycle of August 26, the correction stage. Trading recommendations: Buy 1.0982 Take profit: 1.1012 Sell: 1.0922 Take profit: 1.0902 For the pound / dollar pair, the key levels on the H1 scale are: 1.2255, 1.2216, 1.2159, 1.2113, 1.2069, 1.2040, 1.1993, 1.1946 and 1.1884. Here, the price forms a pronounced potential for the top of September 3 in the correction of the downward cycle. The continuation of the movement to the top is expected after the breakdown of the level of 1.2113. In this case, the target is 1.2159, and near this level is a price consolidation. The breakdown of the level of 1.2160 should be accompanied by a pronounced upward movement. Here, the target is 1.2216. For the potential value for the top, we consider the level of 1.2255. Upon reaching which, we expect a pullback to the bottom. Short-term downward movement is expected in the range of 1.2069 - 1.2040. The breakdown of the last value will lead to an in-depth correction. Here, the target is 1.1993. This level is a key support for the upward potential. Its passage will allow us to expect further development of the downward trend. In this case, the first goal is 1.1946 . The main trend is the descending structure of August 27, the correction stage. Trading recommendations: Buy: 1.2113 Take profit: 1.2157 Buy: 1.2161 Take profit: 1.2216 Sell: 1.2069 Take profit: 1.2040 Sell: 1.2038 Take profit: 1.1995 For the dollar / franc pair, the key levels on the H1 scale are: 1.0025, 0.9980, 0.9958, 0.9920, 0.9877, 0.9856 and 0.9822. Here, we continue to monitor the ascending structure of August 26. At the moment, the price is in correction. The continuation of the movement to the top is expected after the breakdown of the level of 0.9920. In this case, the target is 0.9958. Price consolidation is in the range of 0.9958 - 0.9980. For the potential value for the top, we consider the level of 1.0025. Upon reaching this level, we expect a pullback to the bottom. Consolidated movement is possibly in the range of 0.9877 - 0.9856. The breakdown of the latter value will lead to in-depth movement. Here, the target is 0.9822. This level is a key support for the top. The main trend is the ascending structure of August 26. Trading recommendations: Buy : 0.9920 Take profit: 0.9958 Buy : 0.9980 Take profit: 1.0025 Sell: 0.9854 Take profit: 0.9822 For the dollar / yen pair, the key levels on the scale are : 107.88, 107.14, 106.87, 106.52, 105.65, 105.37, 104.92 and 104.44. Here, the situation is in equilibrium. The continuation of the movement to the top is expected after the breakdown of the level of 106.52. In this case, the target is 106.87. Price consolidation is near this level. The passage at the price of the noise range 106.87 - 107.14 should be accompanied by a pronounced upward movement. Here, the potential target is 107.88. Consolidation is near this level. Short-term downward movement is possibly in the range of 105.65 - 105.37. The breakdown of the latter value will lead to the development of a downward structure. In this case, the first goal is 104.92. For the potential value for the bottom, we consider the level of 104.44. Consolidation is near this level. The main trend: the equilibrium state. Trading recommendations: Buy: 106.52 Take profit: 106.85 Buy : 107.15 Take profit: 107.88 Sell: 105.35 Take profit: 104.94 Sell: 104.90 Take profit: 104.46 For the Canadian dollar / US dollar pair, the key levels on the H1 scale are: 1.3456, 1.3421, 1.3406, 1.3379, 1.3344, 1.3328 and 1.3299. Here, we are following the development of the upward cycle of August 27. The continuation of the development of the upward trend is expected after the breakdown of the level of 1.3379. In this case, the target is 1.3406. Price consolidation is in the range of 1.3406 - 1.3421. For the potential value for the top, we consider the level of 1.3456. Upon reaching this level, we expect a pullback to the bottom. Consolidated movement is possibly in the range of 1.3344 - 1.3328. The breakdown of the last value will lead to a long correction. Here, the target is 1.3299. This level is a key support for the ascending structure. The main trend is the rising structure of August 27. Trading recommendations: Buy: 1.3380 Take profit: 1.3404 Buy : 1.3422 Take profit: 1.3455 Sell: 1.3326 Take profit: 1.3300 For the Australian dollar / US dollar pair, the key levels on the H1 scale are : 0.6821, 0.6791, 0.6781, 0.6768, 0.6751, 0.6742 and 0.6725. Here, the price forms a pronounced upward structure from September 3. The continuation of the movement to the top is expected after the breakdown of the level of 0.6768. In this case, the target is 0.6781. Short-term upward movement is in the range of 0.6781 - 0.6791. The breakdown of the level of 0.6791 should be accompanied by a pronounced upward movement. Here, the potential target is 0.6821. Short-term downward movement is possibly in the range of 0.6751 - 0.6742. The breakdown of the last value will lead to a long correction. Here, the potential target is 0.6725. This level is a key support for the top. The main trend is the formation of the ascending structure of September 3. Trading recommendations: Buy: 0.6768 Take profit: 0.6780 Buy: 0.6792 Take profit: 0.6820 Sell : 0.6750 Take profit : 0.6742 Sell: 0.6740 Take profit: 0.6730 For the euro / yen pair, the key levels on the H1 scale are: 117.00, 116.79, 116.44, 116.19, 115.81, 115.59, 115.15 and 114.78. Here, we continue to monitor the development of the descending structure of August 26. The continuation of the movement to the bottom is expected after the price passes the noise range 115.81 - 115.59. In this case, the target is 115.15. Price consolidation is near this value and from here, a rollback to correction is also possible. For the potential value for the top, we consider the level of 114.78. Upon reaching which, we expect a pullback to the top. Short-term upward movement is expected in the range of 116.19 - 116.44. The breakdown of the last value will lead to an in-depth correction. Here, the target is 116.79. The range of 116.79 - 117.00 is the key support for the bottom. The main trend is the downward cycle of August 26. Trading recommendations: Buy: 116.19 Take profit: 116.43 Buy: 116.45 Take profit: 116.79 Sell: 115.81 Take profit: 115.60 Sell: 115.57 Take profit: 115.15 For the pound / yen pair, the key levels on the H1 scale are : 129.26, 128.70, 128.12, 126.48, 125.86, 124.95 and 124.50. Here, we determined the subsequent targets for the downward movement from the descending structure on August 23. Short-term downward movement is expected in the range of 126.48 - 125.86. The breakdown of the last value should be accompanied by a pronounced downward movement. Here, the target is 124.95. Price consolidation is in the range of 124.95 - 124.50 and from here, we expect a key reversal to the top. Short-term upward movement is possibly in the range of 128.12 - 128.70. The breakdown of the last value will lead to an in-depth correction. Here, the goal is 129.26. This level is a key support for the downward structure. The main trend is the descending structure of August 23. Trading recommendations: Buy: 128.12 Take profit: 128.70 Buy: 128.72 Take profit: 129.26 Sell: 126.48 Take profit: 125.87 Sell: 125.83 Take profit: 124.95 The material has been provided by InstaForex Company - www.instaforex.com |
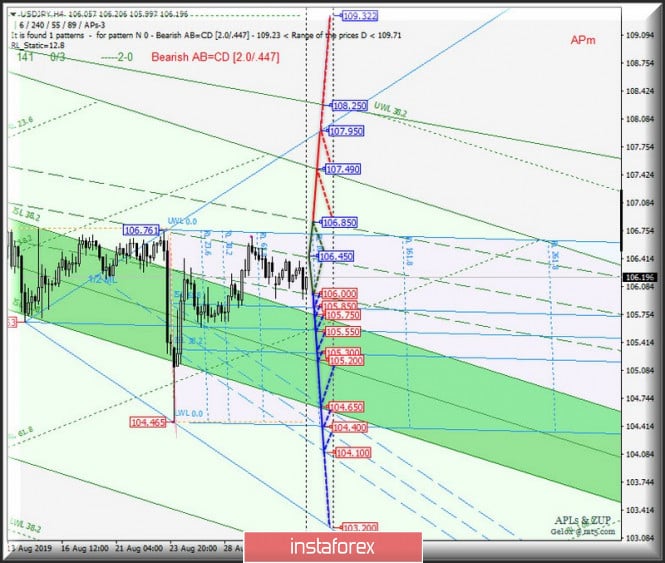
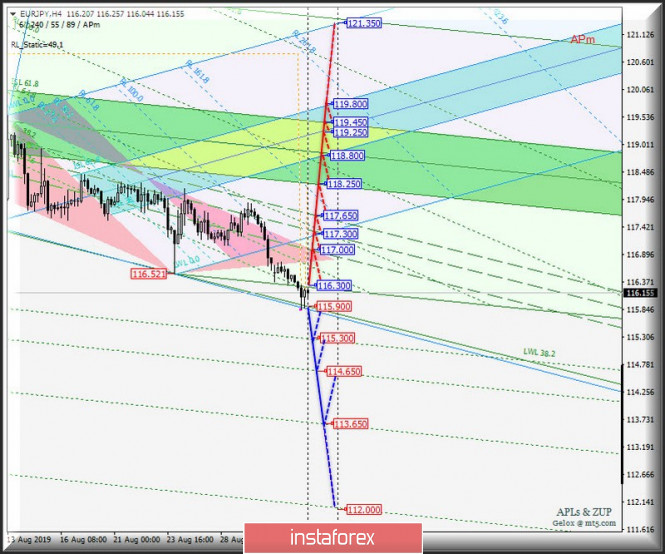
| Posted: 03 Sep 2019 05:49 PM PDT Let me bring to your attention a comprehensive analysis of the development options for the currency movement of the "country of the rising sun" USD / JPY and its cross-instruments EUR / JPY and GBP / JPY from September 04, 2019. Minuette operational scale (H4 timeframe) ____________________ US dollar vs Japanese yen On September 4, 2019, the development of the USD / JPY currency movement of the "country of the rising sun" will be determined by the development and direction of the breakdown of the boundaries of 1/2 Median Line channel (105.85 - 105.60 - 105.30) of the Minuette operational scale fork. The movement markings inside this channel are shown in the animated chart. The breakdown of the lower boundary of the 1/2 Median Line channel (support level of 106.000) of the Minuette operational scale fork will make it possible for the currency of the country of the rising sun to reach the boundaries of the equilibrium zones of the Minuette operational scale fork - Minuette (105.850 - 105.550 - 105.300) and Minuette (105.750 - 105.200 - 104.650), as well as the 1/2 Median Line Minuette channel (104.650 - 104.400 - 104.100). On the other hand, in case of breakdown of the upper boundary of the 1/2 Median Line channel (resistance level of 106.850) of the Minuette operational scale fork, the upward movement of USD / JPY can be continued to the goals - the initial SSL Minuette line (107.490) - the UTL control line (107.950) of the Minuette operational scale fork. The details of the USD / JPY movement, depending on the breakdown direction of the 1 / 2 Median Line Minuette channel mentioned above, are shown in the animated chart. Euro vs Japanese Yyen On September 4, 2019, the development of the cross-instrument EUR / JPY movement will be determined by working out and the direction of the breakdown of the range :
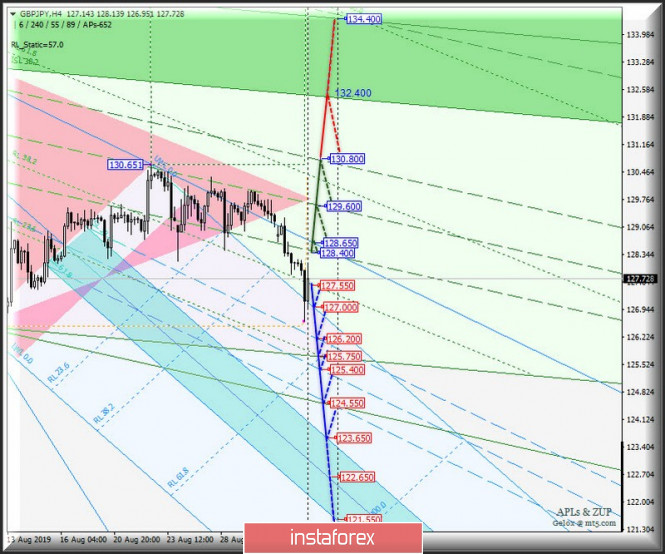
The breakdown of the SSL Minuette start line (resistance level of 116.300) will direct the development of the movement of this cross-instrument to the boundaries of the 1/2 Median Line Minuette channel (117.00 - 117.300 - 117.650), and if the upper boundary (117.650) of this channel breakdown, the upward movement of EUR / JPY may be continued to the boundaries of the equilibrium zones of the Minuette operational scale fork (118.250 - 118.800 - 119.450) and Minuette (118.800 - 119.250 - 119.800). In case of breakdown of the LTL control line (support level of 115.900) of the Minuette operational scale fork, the downward movement of EUR / JPY will continue to the warning lines - LWL38.2 (115.300) - LWL61.8 (114.650) - LWL100.0 (113.650) of the Minuette operational scale fork. The details of the movement of EUR / JPY depending on the development of the boundaries of this range are presented in the animated chart. ____________________ Great Britain pound vs Japanese yen On September 4, 2019, the development of the cross-instrument movement GBP / JPY will also be determined by the direction of the breakdown of the range :
A combined breakdown of the resistance level of 128.400 and the UTL control line (resistance level of 128.650) of the Minuette operational scale forks will determine the development of the movement of this cross-instrument in the 1/2 Median Line Minuette channel (128.400 - 129.600 - 130.800) with the prospect that the price GBP / JPY reaches the lower boundary of ISL38 .2 (132.400) equilibrium zones of the Minuette operational scale fork. The breakdown of the RL38.2 reaction line (support level of 127.550) of the Minuette operational scale fork will direct the development of GBP / JPY movement towards the goals - the initial SSL Minuette line (127.000) - the 1/2 Median Line Minuette channel (126.200 - 125.400 - 124.500) with the prospect of reaching the upper boundaries of ISL38.2 (123.650) of the Minuette operational scale fork. We look at the animated chart for the GBP / JPY movement options, depending on the breakdown direction of the above range. ____________________ The review is made without taking into account the news background. The opening of trading sessions of the main financial centers does not serve as a guide to action (placing orders "sell" or "buy"). The formula for calculating the dollar index: USDX = 50.14348112 * USDEUR0.576 * USDJPY0.136 * USDGBP0.119 * USDCAD0.091 * USDSEK0.042 * USDCHF0.036. where the power coefficients correspond to the weights of the currencies in the basket: Euro - 57.6%; Yen - 13.6% ; Pound Sterling - 11.9%; Canadian dollar - 9.1%; Swedish Krona - 4.2%; Swiss franc - 3.6%. The first coefficient in the formula leads the index to 100 at the start date of the countdown - March 1973, when the main currencies began to be freely quoted relative to each other. The material has been provided by InstaForex Company - www.instaforex.com |
| Posted: 03 Sep 2019 04:51 PM PDT The end of August was not the best period for cryptocurrency. So what are we waiting for in the new season, will Bitcoin grow? I welcome you, crypto enthusiasts and crypto-hamsters, it's been a week since our last review. So what has changed in the market? The remarkable $ 9800/10500 platform, to which many people paid attention, was broken in the downward direction by a massive red candle, of course, there was a foundation of information here. So, theories appeared that this platform and the subsequent descent were provoked by large players on the eve of the closing of futures on the CME exchange on August 30. The following theory, in principle, follows from the first, and it is associated with the celebration of Labor Day in the United States and Canada, September 2, where, according to this version, trading volumes could be reduced and operations began to close in advance. Although, the extreme theory does not follow from the first two. Here, the idea is a little different, and so, it is called "Summer 2018".Who worked on the stock market in the past year, remembers how great everything began increasing, and by August, the picture was radically changed, with the result a stunning decline up to $3156 BTC by the end of 2018. Thus, the theory stems from the fear of repetition, and when everyone can see that Bitcoin is going down, while the index of "Fear" storming new lows, somehow arbitrarily fixing is available. Digest of the past days:
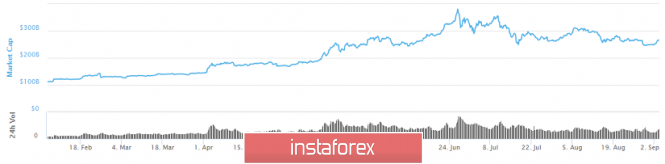
So autumn has come, and what should we expect from it? In the fall, we are waiting for stimulating factors in the form of launches of a number of crypto projects, which against their background can support the crypto industry and, as a fact, give optimism to traders. So, on September 23, the launch of the platform for institutional investors Bakkt will take place, where they can replenish their bitcoin deposits from September 6. Institutional investors have always been considered guides to market trends, so let's hope that they will bring us a new round in an upward trend. The next factor comes to us with the largest cryptocurrency exchange Binance, which plans to launch trading in futures contracts with 20x leverage in September, which will certainly increase trading volumes and can help provide an incentive for the growth of the cryptocurrency market. The last factor in this review is the long-awaited TON token from the well-known Pavel Durov. There is information that the launch of the main TON network is scheduled before October 31. This factor can stimulate the crypto industry and give a new round of fresh capital to the cryptocurrency market, which will directly affect the course of the leading cryptocurrency BTC. What we have now is that the first BTC crypto-currency grows by more than 12% in five days, where the main move occurred just after the onset of autumn (September 1). There are a number of assumptions regarding the continuation of Bitcoin growth, and so, one of the most interesting theories is the news that the BTC growth coincided with the announcement of restrictions on the purchase of foreign currency in Argentina. According to the document, large exporters will need permission from the Central Bank of Argentina to purchase foreign currency and transfer it abroad. Individuals, in turn, will not be able to buy more than $ 10,000 per month. Such measures will be valid until December 31, 2019. What are the assumptions for further development? The first thing that catches the eye is that the quote has returned back to the framework of the recent platform 9800/10500, concentrating at the upper border. So, in the case of a clear breakdown ($ 10,500) while maintaining the inertial course, there are real chances for further growth in the direction of $ 11,000 - $ 12,330. Yet, it's too early to talk about this, since the freezing within the cluster has considerable chances. We are waiting for confirmation so that we don't run into a false puncture. In any case, the breakthrough price (September 1-3) encouraged crypto-traders and, possibly, cryptozyme will still be postponed for a longer period. Key coordinates for the upward stroke: 12330; 13130; 13970. Key coordinates for the downward stroke: 10000; 9400; 8500; 7500. The general background of the cryptocurrency market Analyzing the total market capitalization, we see that the market volume for a short period of time collapsed to a critical level of $ 245 billion, which reflects the indicators of the beginning of summer 2019, after which the volumes recovered, but still are in the same lateral fluctuation. Compared with the previous article, capitalization increased by $ 5.8 billion and currently amounts to $ 267.8 billion. If we consider the volume chart in general terms, then the current ceilings are 272 ---> 281 ---> 320 ---> 356 ---> $ 385 billion. The index of emotions, which is the same fear and euphoria of the crypto market, has grown from 30p. up to 41p., which is already not bad. Let me remind you that in August, we will observe twice the catastrophic index indicator with minimum 5p. Indicator analysis Analyzing a different sector of timeframes (TF), we see that indicators on all the main time periods signal an upward trend, which reflects the current course. It is worth taking into account such a moment that, in the event of freezing within the framework of accumulation 9800/10500, indicators will take their previous positions - a versatile signal. |
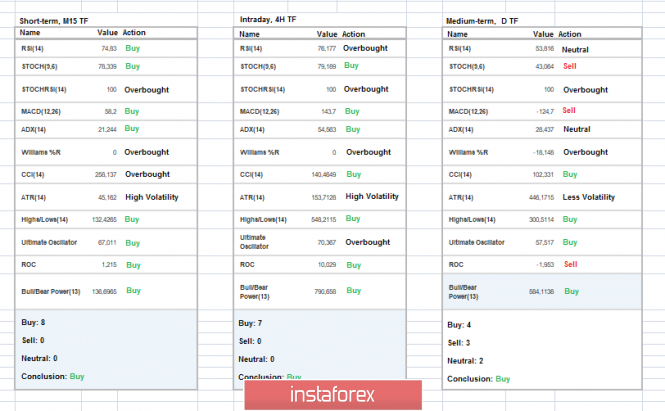
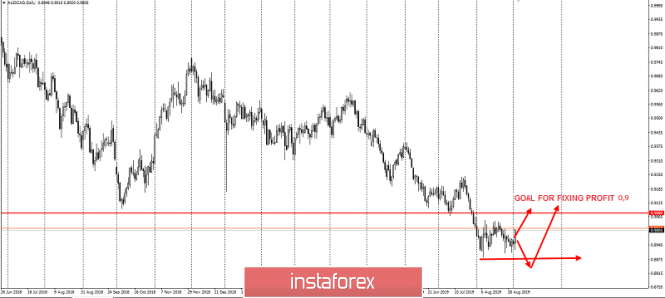
| AUD/CAD. The most promising cross of the week! Posted: 03 Sep 2019 04:51 PM PDT I present to you once again the "workhorses" in the cross-rate segment – a pair of AUD/CAD. This is a unique cross in its medium clear passages. I started working with this instrument thanks to an acquaintance with a rank of grid traders with a turnover of millions of dollars. Good evening, dear traders! I present to you once again the "workhorses" in the cross-rate segment – a pair of AUD/CAD. This is a unique cross in its medium clear passages. I started working with this instrument thanks to an acquaintance with a rank of grid traders with a turnover of millions of dollars. This cross would not be their last place. Similarly to the NZD/CHF pair, this cross has a specific characteristic - any strong movement in the 700p range of 4 gives a pullback of at least a half. And just right now, the AUD/CAD has passed the value of the average regression value of 700p laid to it. From the point of view of fundamental analysis for Australia this night – there will be a decision on the interest rate by 1.30 Universal time, and on Friday, across Canada, a change in employment at 12.30. All these events will lead to increased volatility of a clearly overbought instrument, and we can count on correction from a decline of 100-200p by 4 characters. The nearest resistance level behind which sellers are standing is a round level 0.9, and at least a false breakdown is most likely in these conditions. Also amid declining interest rates on the New Zealand dollar, the Australian dollar could also take that step. However, our plan will not change. For this, it is necessary to place a limit purchase order at a minimum of the current year below the quote 0.8888 and take profit at the level of 0.9. Good luck in trading, and follow the rules of currency management! The material has been provided by InstaForex Company - www.instaforex.com |
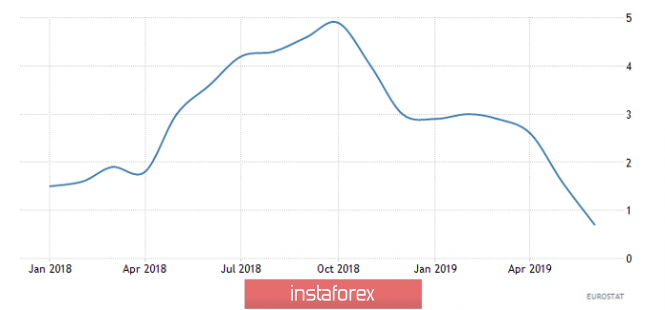
| US Manufacturing PMI drops to three-year low, awaiting EUR/USD pair Posted: 03 Sep 2019 04:16 PM PDT Data published by the Institute for Supply Management (ISM) showed that business activity in the US manufacturing sector declined in August, and the general PMI index fell to its lowest level in three years at 49.1 points and did not meet market expectations - 51.1. The initial reaction of the dollar was a recession. The greenback was under pressure in the EUR/USD pair while the euro recovered to 1.0950 dollars. The report reflects a significant decline in business sentiment. PMI has been steadily declining over the past four months. Demand declined, the index of new orders fell, the inventory index of customers recovered slightly compared to previous months, the index of outstanding orders dropped for the fourth consecutive month. On the other hand, ECB officials tend to lower rates. Referring immediately to five sources familiar with this issue, Reuters reports that the ECB is inclined to launch a large-scale stimulus package, which will include lower rates and a promise to keep them low for longer. "Many also support QE, but the opposition is complicating the discussion so far," the sources said. Sources also explained that the leadership of the ECB will announce the conditions necessary to reduce the rate, but there will be no emphasis on the date component. EUR/USD is likely to continue to retreat from daily lows. The material has been provided by InstaForex Company - www.instaforex.com |
| Posted: 03 Sep 2019 04:08 PM PDT The US dollar strengthens due to weak competitors. Its growth is also fostered by strong macro statistics and hopes that the US economy will be much more resistant to trade wars than others. Business activity in the non-manufacturing sector from the Institute for Supply Management in August should remain unchanged, according to a forecast from Bloomberg. The economic surprise index is steadily going up, and its divergence with the dynamics of rates on US state funds suggests that the main reason for the monetary expansion of the Fed is not the state of the US economy, but international risks. Data on the labor market will be released on Friday, from which market participants are likely to find out that in August 175 thousand jobs were created outside the agricultural sector in the United States. As noted in the CIBC, the formation of vacancies has been declining since the second half of last year, while the pace remains above long-term trend values. The initial jobless claims rate is in the area of cyclical lows. The Conference Board in its report on consumer confidence reports on the availability of a large number of available seats. Based on their forecasts, wages increased last month by 3.4% in annual terms. All of this indicates that the US labor market remains healthy. The slow pace of creating new vacancies will be offset by rising wages, lower interest rates and savings that will allow consumer spending to remain up to standard. According to CIBC experts, the US labor market data will exceed expectations at the end of the week, and this will trigger further growth in the dollar. Since last Friday, the greenback has grown quite strongly in price, including the euro, sending the main currency pair to the levels of spring 2017. Although there are plenty of reasons to pull down the single currency, inaction by the United States looks very strange. The growth of the dollar further slows down the country's economy and weighs on Donald Trump as the current president and his candidacy for the next term. It is worth noting that on Tuesday, September 3, Americans are coming out after a long weekend. It is very interesting what the owner of the White House will do in this situation. It is noteworthy that all this is happening against the backdrop of attempts by British MPs to block the "hard" Brexit. The material has been provided by InstaForex Company - www.instaforex.com |
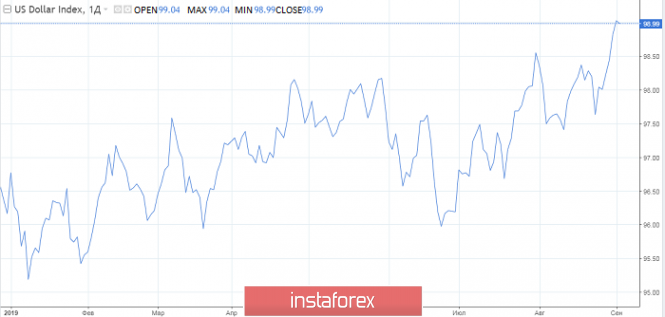
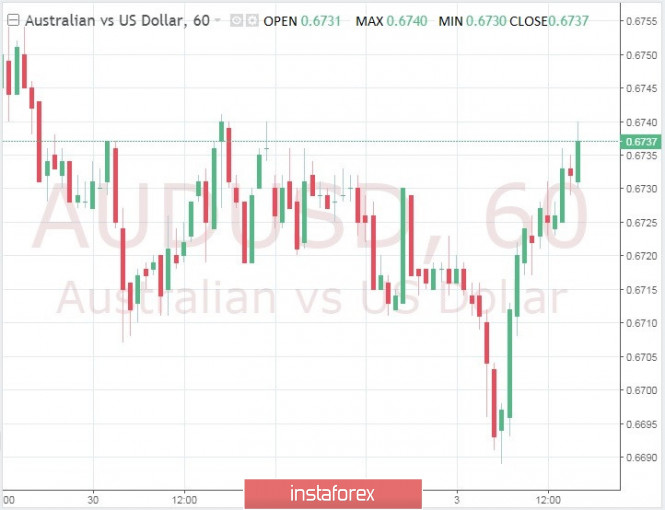
| AUD/USD: which is more important - the RBA decision or US PMI data? Posted: 03 Sep 2019 04:00 PM PDT Markit is expected to remain below 50 points in the US business activity index in the industry. In turn, the optimistic tone of the Reserve Bank of Australia strengthens the AUD. The AUD/USD pair fell below 0.67 in the early trading sessions, but then decisively compensated for losses against the optimistic tone of the Reserve Bank of Australia - + 0.27% to 0.6730. As expected, the RBA kept monetary policy unchanged, but the regulator is ready to soften the policy if it is necessary to support sustainable economic growth. In addition, the bank voiced an optimistic forecast, saying that it expects a gradual increase in Australia's economic growth in the future. "The forecast is supported by low interest rates, tax cuts, rising infrastructure costs, a revival in the residential real estate market and a strong resource sector," the RBA said. At the same time, analysts, having studied the minutes of the meeting of bank officials, believe that the regulator did not say anything new. "The general comment in the statement following the meeting is very similar to the August report. The most important changes were not as large as we would like, the situation on the housing markets is unstable, it is also worth paying attention to the fact that construction activity has weakened," Westpac analysts said. At the same time, the US dollar index, which tracks its value against a basket of six major currencies, is at the highest level since May 2017, about 98.30 points, and this inhibits the growth of the pair. The material has been provided by InstaForex Company - www.instaforex.com |
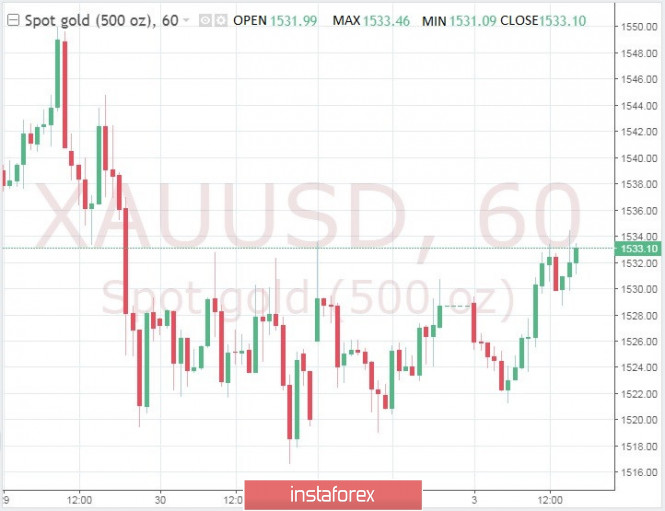
| Gold holds steady despite dollar strength Posted: 03 Sep 2019 03:53 PM PDT Gold is showing a modest but growth despite the strength of the dollar, as the atmosphere of risk aversion increases the demand for precious metals. In the first half of the trading session, gold went up by more than $2 to $1,533. Trade tensions between the US and China have again escalated. Additional import tariffs from China entered into force on Sunday, and Beijing filed a complaint with the World Trade Organization. However, as US markets enjoyed the weekend on Labor Day, market reactions remained relatively muffled. Today, when the markets reopened, the yield on 10-year US Treasury bonds fell by more than 1%, indicating that the new tariffs had a moderately negative effect on market sentiment. Reflecting an atmosphere of risk aversion, major European stock indexes record losses, while the S&P 500 futures fell 0.75%, suggesting that Wall Street is likely to start the day in negative territory. On the other hand, strong pressure caused by sales of major European currencies continues to support the dollar. This is the only thing that prevents gold from rising even higher. At the moment, the US dollar index remains at the highest level over the past two years at 98.30 points. To understand further dynamics, you need to wait for the IHS Markit and ISM Manufacturing PMI reports from the US, as well as carefully monitor the performance of the main Wall Street indices. The material has been provided by InstaForex Company - www.instaforex.com |
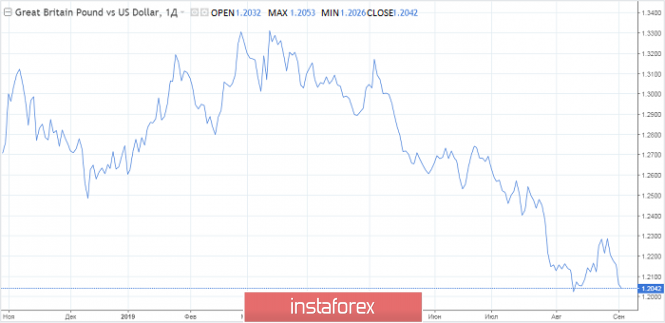
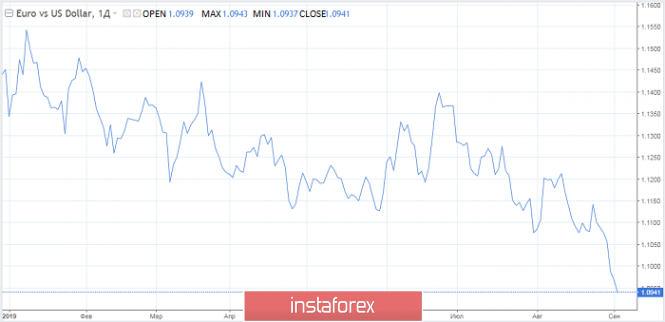
| Fears of Brexit lead the pound to $1.10 Posted: 03 Sep 2019 03:39 PM PDT The British currency falls for the fifth consecutive trading session. Another wave of fears about the consequences of Brexit returned the pound to the area of 36-year lows. This morning, the GBP/USD pair fell below $1.20. A vote should be held on holding early elections and the possibility of blocking exit from the European Union without a deal should occur later on. It is worth noting that the chances of this kind of scenario are slim, since the majority of the votes are with the ruling party. The foreign exchange and debt markets react negatively to such news. It seems that the sterling will have a hard time in the event of the failure of the above initiatives. Background British Prime Minister Boris Johnson plans to hold an early general election if his opponents can pass a bill blocking Brexit without a deal. No final decision has yet been made on this issue. Those who will impede exit from the EU at the end of October will lose their seats. Among the conservatives who advocate for the bill above are former Justice Minister David Gock. Meanwhile, the Conservative Party still have a confident chance of winning, according to the latest YouGov poll. About 33% of the British expressed their willingness to cast their votes for the Conservatives, whose leader is Johnson. Another 22% of respondents said they would side with the Labor Party, and 21% of respondents did not exclude the support of the Liberal Democrats Party. The MUFG believes that at first an extraordinary election will be perceived by the market as negative for the pound, given that the idea of a "hard" Brexit should win. The next stop for the GBP/USD pair after falling below $1.20 will be $1.10. This will happen if the government receives a simple majority and chooses to exit their EU without a deal, the bank said. It will be useful to look at the situation from a different angle. Market participants avoid situations without specifics, and the fact that all other possibilities are marked out narrows the range of uncertainty. This means that the first reaction may well be followed by the restoration of the British currency. A similar situation was in 2017. Then, finding the bottom near $1.20, the pound turned around. Quite interesting is the positioning of the stock market. Over the past five sessions, the FTSE100 index gained 3.1%, while the GBP/USD pair lost 2.1% of the value. This indirectly indicates that buyers consider the current pound to be too low to support the competitiveness of UK companies. This is happening despite the fear of the consequences of a random exit from the EU. The euro and the European stock market also show opposite movements. EUR/USD has gone beyond $1.09, updating lows since May 2017, and the DAX is rebounding after a recent decline. For four sessions, the euro slumped against the dollar by 1.3%, while German bonds rose 2.7%. Demand for German shares strengthened just as the euro fell below August lows, pointing to a shift from consolidation to decline. It seems that the stock markets are positive about the weakening of the euro and the pound, considering it a measure that can restore economic growth. The material has been provided by InstaForex Company - www.instaforex.com |
| Posted: 03 Sep 2019 03:26 PM PDT 4-hour timeframe Amplitude of the last 5 days (high-low): 30p - 25p - 51p - 98p - 39p. Average volatility over the past 5 days: 49p (average). The EUR/USD currency pair began to adjust during the US trading session on the second trading day of the week on September 3. The beginning of the correction completely coincided with the publication of business activity indices in the manufacturing sector of America, each of which could be better than it turned out in the end. The less significant Markit index even exceeded the forecast value and left the "red zone" below 50.0, amounting to 50.3 in August. But, unfortunately, the more important ISM index turned out to be much worse than the expectations of traders and fell into the "red zone", which indicates a decline, reaching 49.1 with a forecast of 51.0. It was the ISM index that disappointed the bears, who began to simply reduce their dollar position, which led to a slight strengthening of the euro. At the moment, the euro has managed to rise in price by 30 points, which is very little compared to the losses that the EU currency suffered only in recent days. More interesting news from the United States and the European Union has not been received today. Speech by Christine Lagarde to the EU Committee on Economic and Monetary Affairs will take place on September 4, and not today, as previously reported. Since the European currency, with a grief in half, has begun an upward correction, I propose to reflect on the prospects for this correction. To do this, we will have to pay attention to the calendar of macroeconomic events for the next two to three days. As it turns out, there is plenty of news this week. Here are the total values of business activity indices in the service sector and composite indices for the EU and the US, retail sales in the European Union, a speech by Christine Lagarde, a report on the level of employment in the private sector, ADP, EU GDP for the second quarter, NonFarm Payrolls, changes in wages and unemployment in America, as well as a performance by Jerome Powell. Thus, if all this package of macroeconomic statistics and the speeches of the first EU and the US will not be in favor of a single currency, then this week traders can very often change their direction of trade, which can cause multidirectional movements. Multidirectional movements will remove the phrase "only sell" from the mood of traders and could contribute to the euro currency's further restoration. Although in a longer term than three days perspective, the euro's position remains unenviable due to the ECB's plans for a large-scale easing of monetary policy and a whole bunch of stimulus measures that Mario Draghi and later Christine Lagarde want to apply. However, this week we can still expect the euro to recover. From a technical point of view, the euro/dollar pair has a corrective goal – the Kijun-sen line. Further recovery will depend on the ability and strength of the bulls to overcome the critical line. Trading recommendations: EUR/USD started the long-awaited correction. Thus, it is recommended to wait for the correction to be completed, for example, the rebound from the Kijun-sen line, and the resumption of sales of euro while aiming for 1,0912, not forgetting the fundamental background that may interfere with this week unconditional strengthening of the euro. In addition to the technical picture, fundamental data and the time of their release should also be considered. Explanation of the illustration: Ichimoku indicator: Tenkan-sen is the red line. Kijun-sen is the blue line. Senkou Span A - light brown dotted line. Senkou Span B - light purple dashed line. Chikou Span - green line. Bollinger Bands Indicator: 3 yellow lines. MACD indicator: Red line and bar graph with white bars in the indicator window. The material has been provided by InstaForex Company - www.instaforex.com |
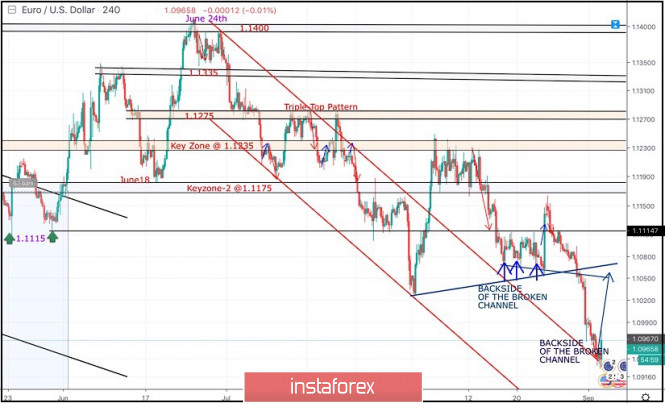
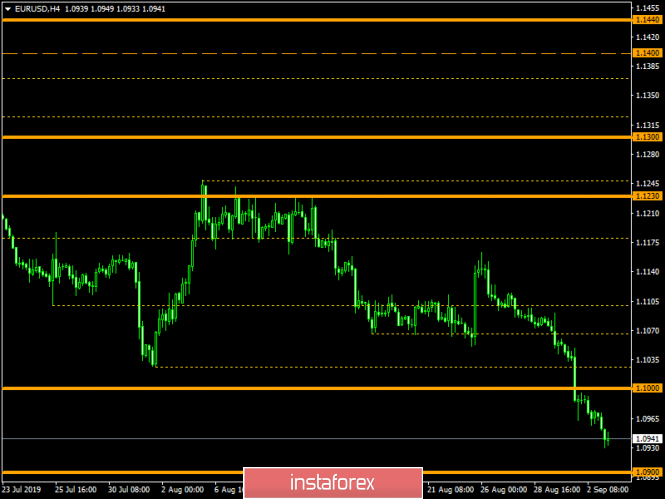
| September 3, 2019 : EUR/USD Intraday technical analysis and trade recommendations. Posted: 03 Sep 2019 09:11 AM PDT
Back in June 24, the EURUSD looked overbought around 1.1400 facing a confluence of supply levels which generated significant bearish pressure over the pair. Shortly after, In the period between 8 - 22 July, a sideway consolidation-range was established between 1.1200 - 1.1275 until a triple-top reversal pattern was demonstrated around the upper limit. Then, Evident bearish momentum (bearish engulfing H4 candlestick) could bring the EURUSD below 1.1175. This facilitated further bearish decline towards 1.1115 (Previous Weekly Low) then 1.1025 (the lower limit of the depicted recent bearish channel) where significant signs of bullish recovery were demonstrated. Shortly-After in Mid-August, the EUR/USD has been trapped between 1.1235-1.1175 for a few trading sessions until bearish breakout below 1.1175 occurred on August 14. Bearish breakout below 1.1175 promoted further bearish decline towards 1.1075 where the backside of the broken bearish channel has provided temporary bullish demand for sometime (Bullish Triple-Bottom pattern). Bullish persistence above 1.1115 was needed to confirm the short-term trend reversal into bullish. However, the depicted Triple-Bottom pattern was invalidated especially after the EURUSD pair bulls have failed to establish Bullish persistence above 1.1115. Moreover, the recently established short-term uptrend line has been invalidated as well. This turned the short-term outlook as bearish. By the end of last week's consolidations, a quick bearish decline was demonstrated towards 1.0980-1.0965 where the backside of the broken channel comes to meet the EURUSD pair again. Trade recommendations : Risky traders were advised to look for a valid BUY entry anywhere around the current price levels of 1.0950. T/p levels to be located around 1.1015 and 1.1050. Conservative traders should wait for bullish pullback towards 1.1050-1.1070 for a valid SELL entry. S/L should be placed just above 1.1095 while target levels can be determined later based on upcoming price action. The material has been provided by InstaForex Company - www.instaforex.com |
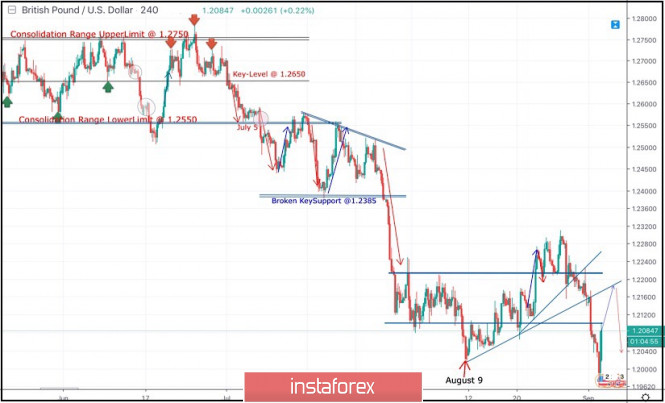
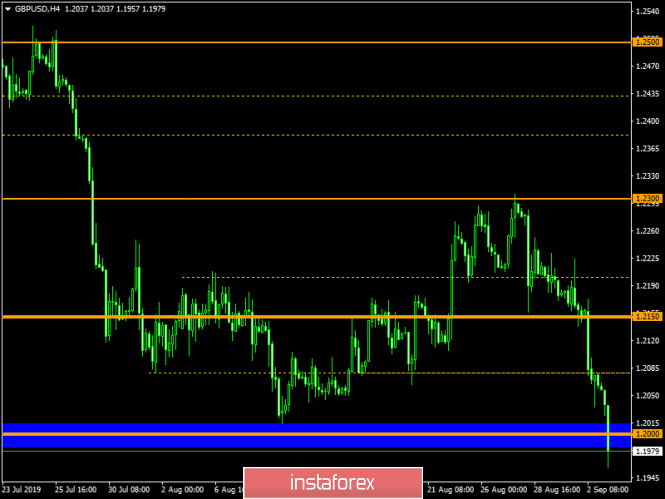
| September 3, 2019 : GBP/USD Intraday technical analysis and trade recommendations. Posted: 03 Sep 2019 09:00 AM PDT
On July 5, a consolidation range bearish breakout was demonstrated below 1.2550 corresponding to the lower limit of the depicted consolidation range. Moreover, Bearish breakdown below 1.2385 (Broken Key-Support) facilitated further bearish decline towards 1.2320, 1.2210 and 1.2100 which corresponded to significant key-levels on the Weekly chart. In Early August, another consolidation-range was temporarily established above 1.2100 before August 9 when temporary bearish movement was executed towards 1.2025. Recent bullish recovery was demonstrated off the recent bottom (1.2025). This brought the GBP/USD pair back above 1.2100 (Lower limit of the recently established consolidation-zone). As expected, further bullish advancement was demonstrated towards 1.2230 then 1.2280 where recent bearish rejection was demonstrated. Bullish persistence above 1.2160 (the recent consolidation range pivot-point) was needed to enhance further bullish advancement towards 1.2320 then 1.2380. However, recent bearish rejection was demonstrated around 1.2215 (backside of the depicted broken uptrend line). That's why, another quick bearish decline took place towards 1.2100 then 1.2000 (corresponding to a prominent bottom established on August 9). Today, early signs of bullish recovery (Bullish Engulfing candlesticks) were manifested around 1.1960 bringing the GBPUSD back towards 1.2100. Trade Recommendations: Conservative traders are advised to wait for the current bullish pullback to pursue towards 1.2160 (backside of the depicted broken uptrend) for a valid SELL entry. T/P level to be placed around 1.2100 and 1.2020, while S/L should be placed above 1.2220. The material has been provided by InstaForex Company - www.instaforex.com |
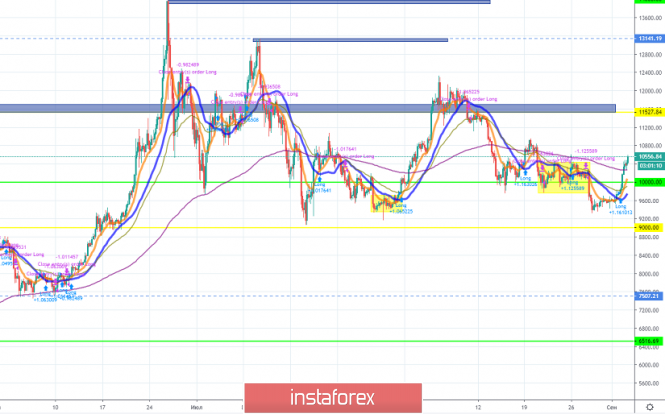
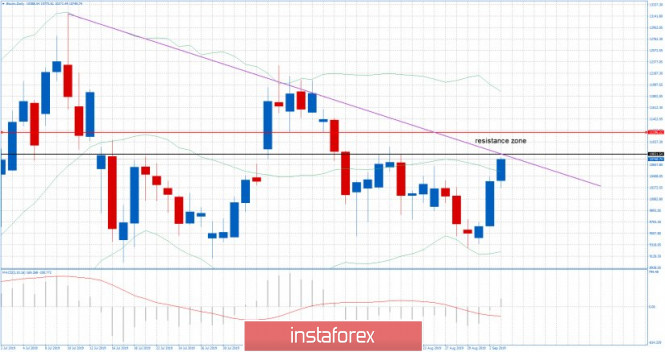
| BTC 09.03.2019 -Major resistnace on the test Posted: 03 Sep 2019 07:58 AM PDT Bitcoin Daily:
According to the daily time-frame I found that BTC is approaching strong resistance zone at $10.800-$11.200. I would be very careful going long near the critical resistance. I would watch for selling opportunities near these levels and potential downward reaction. Black horizontal line – important resistance level Red horizontal line – Resistance 2 Purple downward sloping line – Moving resistance My advice is to watch for potential bear divergence on 4H time-frame and try to sell near the critical resistance zone $10.800-$11.200. Only in case of the strong upward break I would watch for long positions. The level at $10.300 looks decent for first downward target and then $9.950. The material has been provided by InstaForex Company - www.instaforex.com |
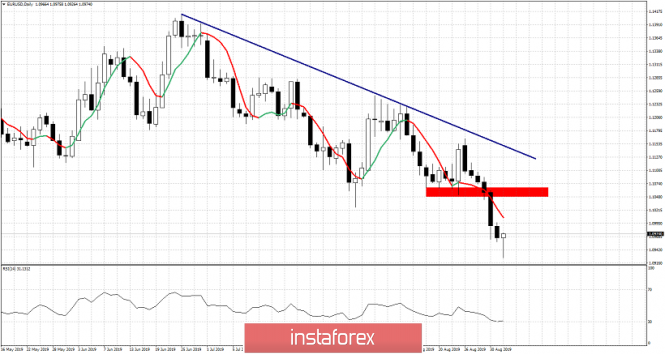
| EURUSD Daily candlestick is forming a bullish reversal hammer pattern Posted: 03 Sep 2019 07:56 AM PDT EURUSD has made a low at 1.0926 while it opened today around 1.0966. Now price is at 0.978 and it is very probable that a bullish hammer pattern to be formed. This would be a reversal signal. At least for the short-term.
Red rectangle - bounce target and short-term resistance (previous support) EURUSD is bouncing. Price is expected to move higher above 1.1015 over the coming hours and if the reversal is confirmed, we should see a move towards the previous support now resistance area marked as red. EURUSD should bounce towards 1.1050 if not towards the blue downward sloping resistance trend line. Medium and long-term trend remain bearish. Oscillators are oversold. This is not the time to be bearish EURUSD. The chances of a bounce are high. The material has been provided by InstaForex Company - www.instaforex.com |
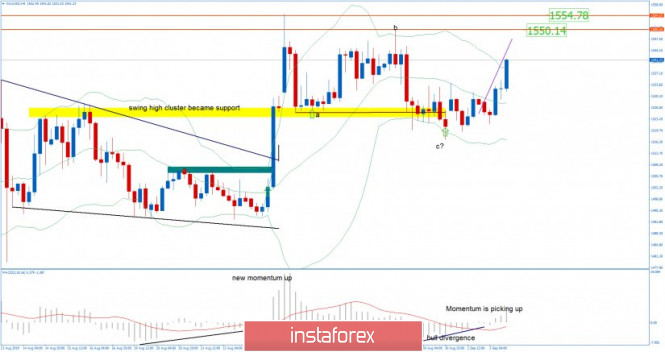
| Gold price is being bid continuing its up trend Posted: 03 Sep 2019 07:51 AM PDT Gold price has broken above the $1,533 resistance we mentioned yesterday that was key for a move to recent highs. Trend remains bullish and the $1,570 target remains feasible. Bulls could raise their stops now to $1.516.
Green rectangle - support Gold price is challenging recent 2019 highs. Price remains in a bullish momentum and our target of 161.8% extension of the August 2018-February 2019 rise is still feasible. Breaking above $1,555 will increase the chances of seeing $1,570 this week. Support is key at $1,516. Breaking below this level will cancel the bullish scenario of seeing any time soon a move to $1,570. Instead breaking below support would open the way for a move at least towards $1,475. The material has been provided by InstaForex Company - www.instaforex.com |
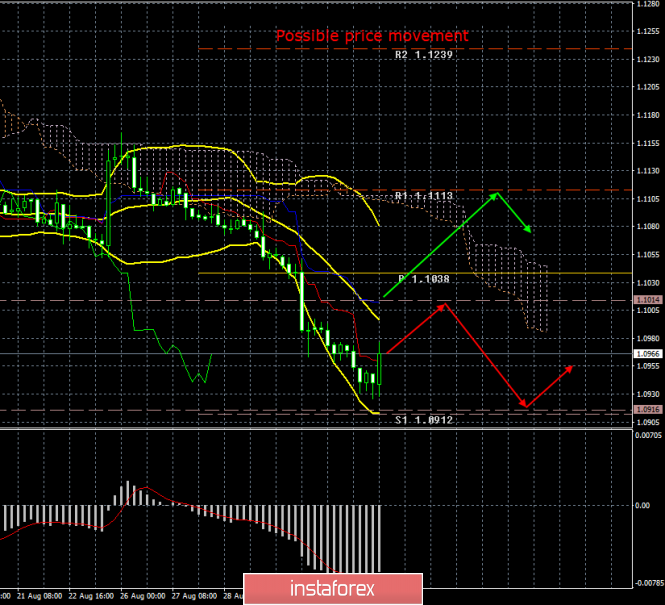
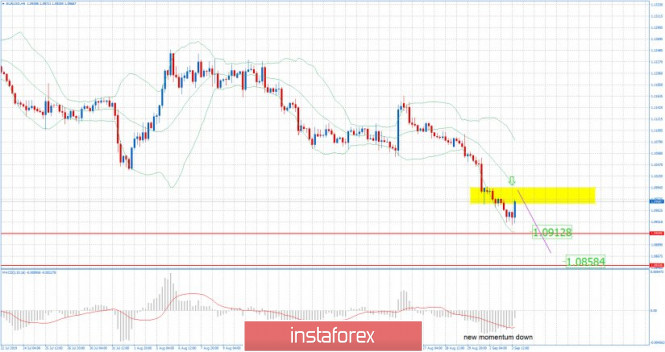
| EUR/USD for September 03,2019 - Sell zone on EUR Posted: 03 Sep 2019 07:27 AM PDT EUR/USD has been trading downwards. The price tested the level of 1.0925 but most recently it recovered. Anyhow, the selling pressure is still present on the larger time-frames and I would watch for selling opportunities on the rallies.
Yellow rectangle – important resistance levels Red horizontal lines – Support levels and downward objectives Purple rising line – Expected path MACD oscillator is showing new momentum down and there is chance for more downside. Resistance is at 1.0970-1.1000 and support levels at 1.10920 and 1.0840. Bulls need to be very cautious as there is strong downward momentum in the background and potential selling the rally type of feeling. Short-term trend is on the downside and my advice is to watch for trading opportunities within the trend. The material has been provided by InstaForex Company - www.instaforex.com |
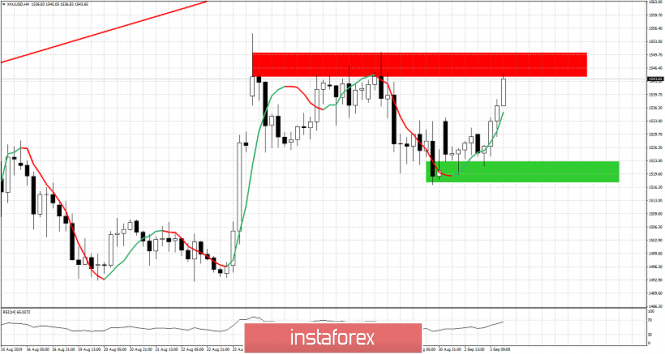
| Gold 09.03.2019 - One step closer to our upward target at $1,550 Posted: 03 Sep 2019 07:09 AM PDT Gold price had a nice push higher after the Manufacturing PMI came out and we are closer to our main upward target at $1,550-$1,554. The downward correction is finished and upside momentum is present.
Red horizontal lines – Important resistance and upward objective Yellow rectangle - major support area Purple rising line – Expected path MACD oscillator is picking momentum up and I do expect at least another push higher. Key support is at $1,525 and resistance at $1,554. Bears need to be very cautious as there is strong upward momentum in the background and potential buying the deep type of feeling. As long as the Gold is holding above $1,525 there is a chance for potential test of $1,554. I moved my stop to breakeven and I wait for potential $1,550-$1,554 to be on the test. Bull divergence in the background did play big part for this rally. Short and Mid term trends are bullis. The material has been provided by InstaForex Company - www.instaforex.com |
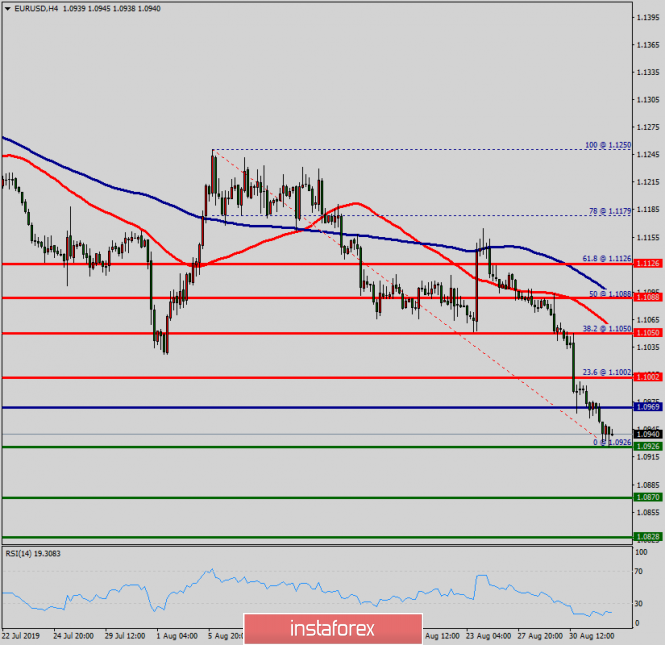
| Technical analysis of EUR/USD for September 03, 2019 Posted: 03 Sep 2019 06:27 AM PDT Overview: The EUR/USD pair continues to move downwards from the level of 1.1050. Yesterday, the pair dropped from the level of 1.1050 to the bottom around 1.0926. The first resistance level is seen at 1.1002 followed by 1.1050, while daily support 1 is seen at 1.0870. The RSI starts signaling a downward trend, as the trend is still showing strength above the moving average (100) and (50). Thus, the market is indicating a bearish opportunity below 1.1002. The price is in a bearish channel now. Amid the previous events, the pair is still in a downtrend Because the price spot of 1.1002 remains a significant resistance zone. Therefore, a possibility that the EUR/USD pair will have downside momentum is rather convincing and the structure of a fall does not look corrective. In order to indicate a bearish opportunity below 1.1002, sell below 1.1002 with the first targets at 1.0870 and 1.0828 However, the stop loss should be located above the level of 1.1050. The material has been provided by InstaForex Company - www.instaforex.com |
| AUD/USD. Caution, false price growth: Aussie adjusts based on RBA meeting Posted: 03 Sep 2019 06:23 AM PDT The results of the September meeting of the Reserve Bank of Australia had a weak impact on the AUD/USD pair. The regulator continues to gently prepare traders for the next round of interest rate cuts, although this step is largely taken into account in the current quotes. Of course, another reminder that the central bank is ready to follow the path of easing monetary policy exerted great pressure on the Australian dollar – "Aussie" fell to the level of 0.6689, updating the three-week low. But at the start of the European session, the pair returned to its previous positions, as if today's meeting did not exist. Moreover, the AUD/USD bulls even show character, taking the pair to the middle of the 67th figure. But by and large, these price fluctuations are comparable to market noise – the pair is still trading within a wide-range flat in anticipation of powerful information drivers.
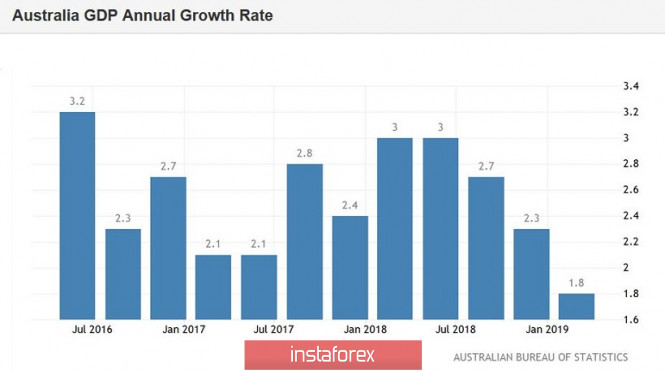
After the July meeting of the Reserve Bank of New Zealand, at which the regulator lowered the interest rate by 50 basis points at once, the traders of the AUD/USD pair received a kind of "vaccination" against shocks. Indeed, in the first days after this meeting, there were rumors on the market that the members of the RBA will follow the example of their New Zealand counterparts, resorting to aggressive measures to ease monetary policy. Therefore, when the Australian Central Bank announces its intention to reduce the rate by 25 points, and even then – under certain conditions, the market calmly perceives this information. A similar situation exists today. According to the text of the accompanying statement, the RBA "if necessary" will resort to reducing the interest rate – "to maintain sustainable economic growth." It is worth noting that in the context of this formulation, key macroeconomic releases will play a particularly important role for the pair in the near future. If data on inflation, the labor market (and especially the level of wages) and the economy as a whole will come out in the "green zone", the probability of a wait-and-see position will grow. Conversely, if the main indicators show a slowdown, the Australian regulator is almost 100 percent likely to resort to a third rate cut for the current year. That is why tomorrow's data on the growth of Australia's GDP may cause a stronger market reaction to today's price fluctuations. The September meeting of the RBA was, in fact, a passing one, but at the same time the regulator voiced a fairly clear message: "there will be no improvements – we will take measures." So tomorrow's numbers may support the Aussie, or, conversely, send it down to the middle of the 66th figure. According to preliminary forecasts, the data on the growth of the Australian economy will disappoint investors. Let me remind you that for the past four quarters, GDP has been declining – if in the first quarter of last year, this figure came out at the level of 3.2%, in the first quarter of this year, the indicator grew by only 1.8%. Tomorrow, we will learn the data on the growth of the country's economy for the second quarter of 2019. Experts believe that the key indicator will continue its downward trend, falling to the level of 1.4%. If these forecasts are justified, the Australian will be under strong pressure, because in this case, the Australian economy will beat the long-term anti-record.
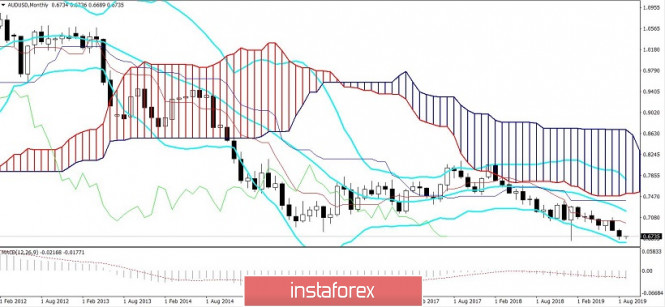
Thus, today's price correction should be treated with caution. The Australian is still vulnerable and tomorrow's data could easily send the AUD/USD pair to weekly lows. From the external fundamental background, one should not wait for support. Recent rumors about the prospects for talks between the US and China are grim. At the moment, the parties cannot even agree and organize another meeting, not to mention the resolution of more complex issues. Donald Trump's indicative optimism is not substantiated by anything: Beijing and Washington are still on opposite sides of the barricades, and the latest mutual tariff "strikes" eloquently confirms this fact. In other words, "Aussie" may receive temporary support from statistics tomorrow (if only the GDP growth rate will be better than the forecast values), but it is unlikely that this fact will be able to reverse the southern trend. This means that after the completion of the (possible) correction of AUD/USD, it is advisable to consider short positions for the pair, with the main price target of 0.6620. From the technical point of view, the pair is under significant pressure, and on all "higher" timeframes. On H4, D1, W1, and MN, the pair is between the middle and lower lines of the Bollinger Bands indicator, which also indicates the priority of the southern movement. The pair shows a bright bearish trend, which is confirmed by the main trend indicators – Bollinger Bands and Ichimoku. Thus, the Ichimoku indicator on the daily chart formed its strongest bearish signal "Parade of Lines", in which all the lines of the indicator are above the price chart, thereby demonstrating the pressure on the pair.
In turn, the lines of the Bollinger Bands indicator show a narrowed channel – this is also a strong signal for the southern direction. Additional confirmation of the bearish scenario is the oversold MACD and Stochastic oscillators. To determine the main goal of the southern movement, let's move to the monthly timeframe: here we focus on the bottom line of the Bollinger Bands – the price is 0.6620. The material has been provided by InstaForex Company - www.instaforex.com |
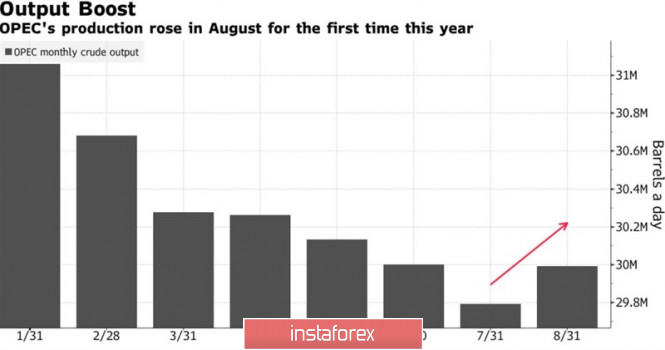
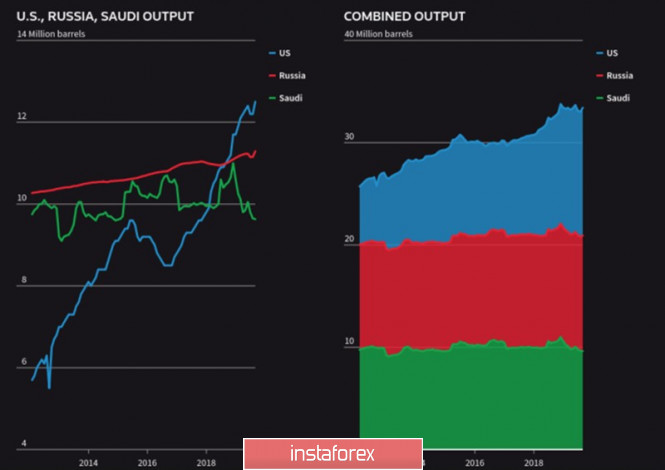
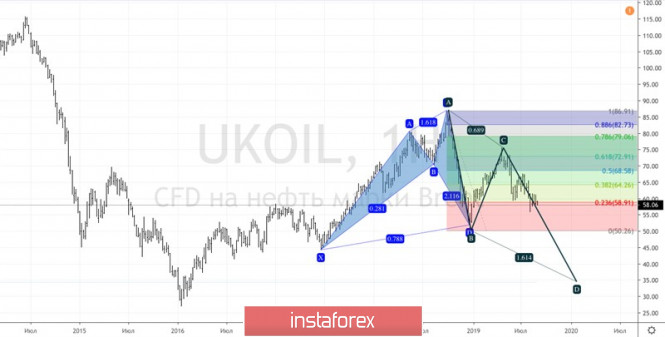
| Oil and the battle of the titans Posted: 03 Sep 2019 05:41 AM PDT The Brent and WTI markets are designed in such a way that each army of opponents has its own titanium behind it. The Bears rely on the United States with its accelerated production growth and Donald Trump arguing that lower prices are good for the American consumer. The bulls are for Saudi Arabia, which requires $80 per barrel of North Korean for a balanced budget. There is no black or white in the oil market, similar in life. here are others. Which direction the largest consumers - China and another titan, Russia - moves to depends on which opponent will control the situation. While in terms of production, the oil market seemed balanced most of August (US supplies were blocked by the OPEC production cut agreement), a nearly 6% drop in prices was due to lower global demand. Since September 1, China and the US have increased trade duties on imports, which could slow down the Chinese economy by 0.8 pp in 2020. Oxford Economics estimates that economic growth will fall to 5.7% in the fourth quarter and remain so throughout the next year. The problems of the largest oil consumer make Brent and WTI bulls retreat. The situation is beginning to look awful given the first increase in OPEC production in August. Bloomberg experts estimate the figure to be 29.99million b/s. While Saudi Arabia is cutting production, other countries including Iran, Nigeria, and Russia are stepping up. In particular, the Russian Federation downloaded 11,294 million b/s at the end of the summer, which is the highest number since March. OPEC Oil Production Dynamics Dynamics of oil production by the largest producers. Thus, both Beijing and Moscow do not support the efforts of Riyadh and the weakness of titanium, which stands behind the buyers that lead to the fact that the market is controlled by "bears". According to the consensus forecast of the Wall Street Journal experts, Saudi Arabia's GDP will grow by 1.4% in 2019, and at the end of last year, their figure was + 2.2%. Capital Economics so far say that the economy of OPEC's largest member will expand by a modest 0.3% under the influence of low prices for black gold. Pressure on oil is also exerted by the growth of the USD index. Brent and WTI are traded in dollars, hence, the strengthening of the American currency is always considered a "bearish" factor for both grades. Strong US statistics, confidence in their victory in the trade war with China, as well as precarious positions in the European economy pushes the USD index to the north. The proponents of the US dollar are not embarrassed by the Fed's desire to loosen monetary policy, or by Donald Trump's verbal interventions, which have long criticized the Fed's monetary policy and too strong US currency. Technically, if the Brent bears manage to hold $58.9 per barrel (23.6% of the CD wave of the "Shark" blue pattern) and rewrite the December low, activating the AB = CD model will increase the risks of achieving its target by 161.8%. It corresponds around USD 34.5. Brent daily chart |
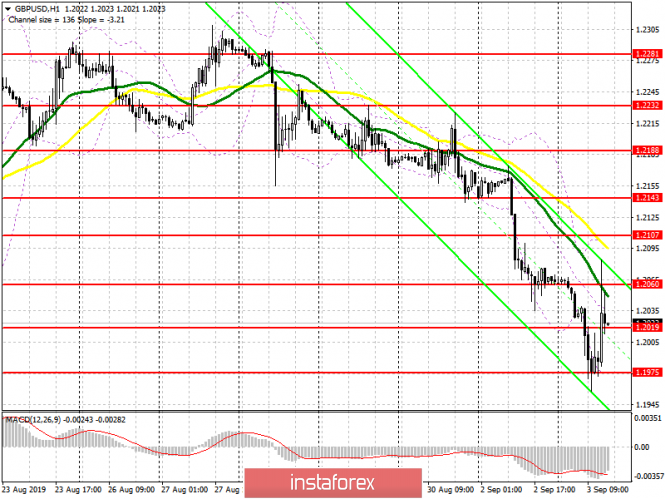
| Posted: 03 Sep 2019 05:32 AM PDT To open long positions on GBP/USD, you need: The British pound rebounded from annual lows after the news appeared in the media that the Board of the European Commission, led by Jean-Claude Juncker and EU negotiator for Brexit Michel Barnier will consider the situation around the UK's exit from the EU on September 4. Given that the pound was artificially driven to such lows after a rebound to the upside, buyers need to keep the level of 1.2020, which can lead to a larger upward correction in the area of highs of 1.2060 and 1.2107, where I recommend taking the profit. If there is negative news from the British Parliament and the pair returns to support 1.2020, it is best to look at long positions from a minimum of 1.1975 or a rebound from the new support of 1.1935. To open short positions on GBP/USD, you need: Any negative news from the UK Parliament and the failure of the opposition's attempts to prevent Brexit without an agreement will return the pound sellers to the market even though the pair has fallen to annual lows. Bears need a breakdown of the support of 1.20199, which will collapse the GBP/USD to the support of 1.1975, from which an upward correction took place today. A breakthrough at this level will lead to an update of the new annual minimum in the area of 1.1935, where I recommend fixing the profits. If the bulls manage to gain a foothold above the resistance of 1.2060 in the second half of the day, it is best to sell for a rebound from the highs of 1.2107 and 1.2143. Signals of indicators: Moving Averages Trading is below 30 and 50 moving averages, indicating a predominance of sellers in the market. Bollinger Bands In the case of the pound growth, the upper limit of the indicator in the area of 1.2107 will limit the upward potential.
Description of indicators
|
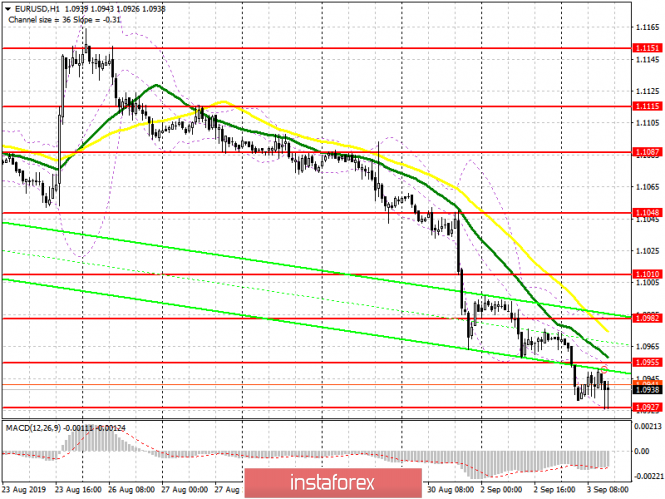
| Posted: 03 Sep 2019 05:32 AM PDT To open long positions on EURUSD, you need: The situation has not changed compared to the morning forecast, and euro buyers continue to fight desperately for the support level of 1.0927, the formation of a false breakdown on which in the morning still retains hope for an upward correction of the euro. A report on moderate growth in eurozone producer prices prevented bears from resuming the downward trend, even though they tried to break below the weekly low. As long as the trade is above this support, we can expect the recovery of EUR/USD in the maximum area of 1.0955 and its breakdown, which will lead to a test of the level of 1.0982, where I recommend fixing the profits. If the pressure on EUR/USD continues, it is best to count on new long positions after updating the lows around 1.0900 and 1.0873. To open short positions on EURUSD, you need: Sellers of the euro took advantage of the expected weak inflation report, which was worse than economists' forecasts, but it was not possible to break below the support of 1.0927. The focus will be shifted more to the afternoon when reports on production activity in the United States will be released. Only if the good indicators, we expect the further movement of the euro down with the updating of the lows in the areas of 1.0900 and 1.0873, where I recommend taking the profits. In an upward correction scenario, I recommend counting on short positions in EUR/USD only after a false breakdown in the resistance area of 1.0955, however, the best option for sales is to update the maximum of 1.0982. Signals of indicators: Moving Averages Trading is below 30 and 50 moving averages, indicating a bearish market. Bollinger Bands In the case of euro growth, the upper limit of the indicator around 1.0982 will limit the upward potential.
Description of indicators
|
| Fractal analysis on major currency pairs as of September 3 Posted: 03 Sep 2019 04:44 AM PDT Hello, dear colleagues. For the Euro/Dollar pair, a key upward reversal is expected from the range of 1.0922 – 1.0897. For the Pound/Dollar pair, the continuation of the downward movement is possible after the passage of the range of 1.1977 – 1.1946. For the Dollar/Franc pair, we expect the upward movement to continue after the breakdown of the level of 0.9920 and the level of 0.9856 is the key support. For the Dollar/Yen pair, we are following the development of the upward structure from August 26 and the further upward movement is expected after the breakdown of 106.52 and the level of 105.37 is the key support. For the Euro/Yen pair, we expect the continuation of the downward trend from August 26 after the price passes the range of 115.81 – 115.59. For the Pound/Yen pair, the price for subsequent targets for the bottom was determined from the downward structure on August 23. Forecast for September 3: Analytical review of currency pairs on the H1 scale:
For the Euro/Dollar pair, the key levels in the H1 scale are 1.1025, 1.0980, 1.0960, 1.0922, 1.0897 and 1.0849. We continue to follow the downward structure of August 26. The short-term downward movement is expected in the range of 1.0922 – 1.0897, hence there is a high probability of a reversal in the correction zone. The breakdown of the level of 1.0897 will be accompanied by a volatile downward movement to the potential target – 1.0849. The short-term upward movement is expected in the area of 1.0960 – 1.0980 and the breakdown of the last value will lead to an in-depth correction. The target is 1.1012 and this level is the key support for the downward structure. The main trend is the downward cycle of August 26. Trading recommendations: Buy 1.0960 Take profit: 1.0980 Buy 1.0982 Take profit: 1.1012 Sell: 1.0922 Take profit: 1.0902 Sell: Take profit:
For the Pound/Dollar pair, the key levels in the H1 scale are 1.2113, 1.2063, 1.2028, 1.1977, 1.1946 and 1.1884. We follow the development of the downward structure of August 27. A short-term downward movement is expected in the range of 1.1977 – 1.1946 and the breakdown of the latter value will allow us to count on movement to a potential target – 1.1884, upon reaching this level, we expect a pullback upward. The consolidated upward movement is expected in the range of 1.2028 – 1.2063 and the breakdown of the last value will lead to an in-depth correction. The target is 1.2113 and this level is the key support for the downward structure. The main trend is the downward structure from August 27. Trading recommendations: Buy: Take profit 1.2030: 1.2060 Buy: 1.2065 Take profit: 1.2110 Sell: 1.1977 Take profit: 1.1948 Sell: 1.1944 Take profit: 1.1886
For the Dollar/Franc pair, the key levels in the H1 scale are 1.0025, 0.9980, 0.9958, 0.9920, 0.9877, 0.9856 and 0.9822. We continue to follow the upward structure of August 26. The continuation of the upward movement is expected after the breakdown of the level of 0.9920. In this case, the target is 0.9958 and in the area of 0.9958 – 0.9980 is the price consolidation. The potential value for the top is level 1.0025, after reaching this value, we expect a rollback downwards. The short-term downward movement is possible in the area of 0.9877 – 0.9856 and the breakdown of the last value will lead to an in-depth movement. The target is 0.9822 and this level is the key support for the top. The main trend is the upward structure of August 26. Trading recommendations: Buy: 0.9920 Take profit: 0.9958 Buy: 0.9980 Take profit: 1.0025 Sell: 0.9877 Take profit: 0.9857 Sell: 0.9854 Take profit: 0.9822
For the Dollar/Yen pair, the key levels in the H1 scale are 107.88, 107.14, 106.87, 106.52, 105.65, 105.37, 104.92 and 104.44. We follow the development of the upward structure of August 26. The continuation of the upward movement is expected after the breakdown of 106.52. In this case, the target is 106.87 and near this level is the consolidation. The passage at the price of the range of 106.87 – 107.14 shall be accompanied by a strong upward movement. The potential target – 107.88 and consolidation is near this level. The short-term downward movement is possible in the area of 105.65 – 105.37 and the breakdown of the last value will lead to the development of a downward structure. In this case, the first target is 104.92. The potential value for the bottom is the level of 104.44 and consolidation is near this level. The main trend: the upward structure of August 26. Trading recommendations: Buy: 106.52 Take profit: 106.85 Buy: 107.15 Take profit: 107.88 Sell: 105.35 Take profit: 104.94 Sell: 104.90 Take profit: 104.46
For the Canadian dollar/Dollar pair, the key levels in the H1 scale are 1.3456, 1.3421, 1.3406, 1.3379, 1.3344, 1.3328 and 1.3299. We follow the development of the upward cycle of August 27. The continuation of the upward trend development is expected after the breakdown of the level of 1.3379. In this case, the target is 1.3406 and in the area of 1.3406 – 1.3421 is the price consolidation. The potential value for the top is level 1.3456, after reaching this value, we expect a rollback downwards. The short-term downward movement is possible in the area of 1.3344 – 1.3328 and the breakdown of the last value will lead to a protracted correction. The target is 1.3299 and this level is the key support for the upward structure. The main trend is the upward structure of August 27. Trading recommendations: Buy: 1.3380 Take profit: 1.3404 Buy: 1.3422 Take profit: 1.3455 Sell: 1.3344 Take profit: 1.3328 Sell: 1.3326 Take profit: 1.3300
For the Australian dollar/Dollar pair, the key levels in the H1 scale are 0.6755, 0.6742, 0.6731, 0.6714, 0.6704, 0.6689, 0.6681 and 0.6663. We follow the development of the downward cycle of August 26. At the moment, the price is in the correction zone. The short-term downward movement is expected in the range of 0.6714 – 0.6704 and the breakdown of the latter value will lead to a pronounced movement. The target is 0.6689 and in the area of 0.6689 – 0.6681 is the price consolidation. The potential value for the bottom is level 0.6663, after which we expect a rollback up. The short-term upward movement is possible in the area of 0.6731 – 0.6742 and the breakdown of the last value will lead to a protracted correction. The potential target is 0.6755, up to this level, we expect the formation of pronounced initial conditions for the upward cycle. The main trend is the downward structure of August 26, the stage of correction. Trading recommendations: Buy: 0.6732 Take profit: 0.6742 Buy: 0.6742 Take profit: 0.6755 Sell: 0.6704 Take profit: 0.6690 Sell: 0.6680 Take profit: 0.6664
For the Euro/Yen pair, the key levels in the H1 scale are 117.00, 116.79, 116.44, 116.19, 115.81, 115.59, 115.15 and 114.78. We continue to follow the development of the downward structure of August 26. We expect further downward movement after the price passes the range of 115.81 – 115.59. In this case, the target is 115.15 and the price consolidation is near this value and hence a rollback to correction is also possible. The potential value for the top is considered to be the level of 114.78, upon reaching which, we expect a rollback up. The short-term upward movement is expected in the range of 116.19 – 116.44 and the breakdown of the last value will lead to an in-depth correction. The target is 116.79 and the range of 116.79 – 117.00 is the key support for the bottom. The main trend is the downward cycle of August 26. Trading recommendations: Buy: 116.19 Take profit: 116.43 Buy: 116.45 Take profit: 116.79 Sell: 115.81 Take profit: 115.60 Sell: 115.57 Take profit: 115.15
For the Pound/Yen pair, key levels in the H1 scale are 129.26, 128.70, 128.12, 126.48, 125.86, 124.95 and 124.50. We determined the subsequent targets for the downward movement from the descending structure on August 23. We expect a short-term downward movement in the range of 126.48 – 125.86 and the breakdown of the last value should be accompanied by a pronounced downward movement. The target is 124.95 and in the area of 124.95 – 124.50 is the price consolidation and hence the expected key reversal up. The short-term upward movement is possible in the range of 128.12 – 128.70 and the breakdown of the last value will lead to an in-depth correction. The target is 129.26 and this level is the key support for the downward structure. The main trend is the downward structure from August 23. Trading recommendations: Buy: 128.12 Take profit: 128.70 Buy: 128.72 Take profit: 129.26 Sell: 126.48 Take profit: 125.87 Sell: 125.83 Take profit: 124.95 The material has been provided by InstaForex Company - www.instaforex.com |
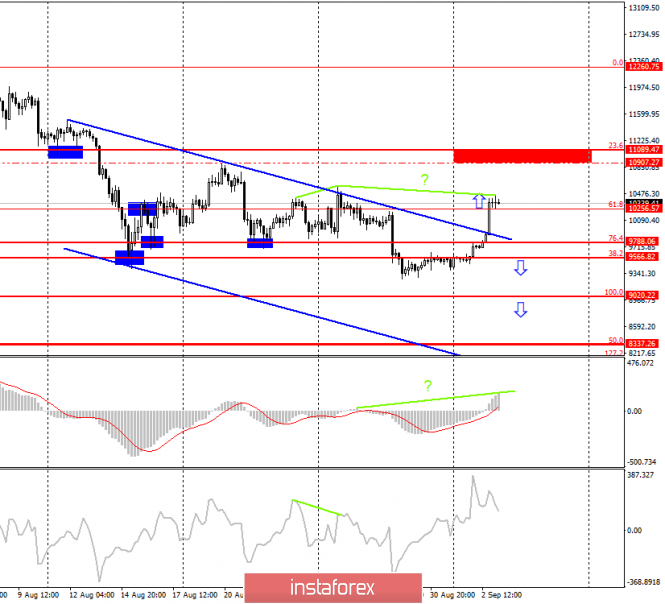
| Trading strategy for Bitcoin on September 3rd. Above $11000, it will be hard to leave bitcoin Posted: 03 Sep 2019 03:51 AM PDT Bitcoin – 4H.
Yesterday, Bitcoin was completely not part of the planned scenario. The brewing bearish divergence was canceled, the rebound from the correction level of 76.4% ($9788) did not happen, but the closure over the upper line of the downward channel was performed. One good thing is that there was no signal in the form of a rebound from the Fibo level of 76.4%, therefore, Bitcoin should not be sold. At the moment, the quotes of "cue" have consolidated above the level of correction 61.8% ($10256), which allows traders to expect continued growth in the direction of the level range of $10907 - $11089. However, there is also a new bearish divergence (brewing) in the MACD indicator, which allows you to expect a reversal down and some fall in the direction of the correction level of 76.4%. Based on this, buying bitcoin right now is not recommended. Yesterday, I talked about the opinion of John Bollinger, who believes that there is a high probability of the beginning of a long-term downward trend in bitcoin. However, the creator of the well-known indicator of technical analysis also admitted that if the bulls show their pressure this week, then the fall in BTC will be postponed indefinitely. Now, Peter Brandt, a well-known trader and technical analyst, expressed his opinion on the prospects of the "cue ball". In his Twitter, he said that there are grounds to claim that the price has entered the fourth cycle of parabolic growth, and now is the last days to buy BTC at a low price. Brandt immediately issued another super-optimistic forecast, stating that the ultimate goal of parabolic growth is $100,000. A few years ago, no one could have imagined that "bitcoin" will reach the level of almost $20000. So the long-term forecast of $100,000 may come true someday. I still believe that the analysis of bitcoin should primarily use technical indicators. And they do not yet give reason to assume such strong growth. Though, maybe, in the next few days, the situation will change. The Fibo grid is based on the extremes of July 17, 2019, and August 6, 2019. Forecast Bitcoin and trading recommendations: Bitcoin performed a consolidation at the Fibo level of 61.8%, but bearish divergence casts doubt on further growth. I recommend selling cryptocurrency if it closes at 61.8% ($ 10,256), and the bearish divergence is not canceled, with the target of $9788 (76.4% of Fibonacci). I recommend buying bitcoin with the target area of $10907 - $11089, and with a stop-loss level of $10256, if MACD closes above the bearish divergence peak. The material has been provided by InstaForex Company - www.instaforex.com |
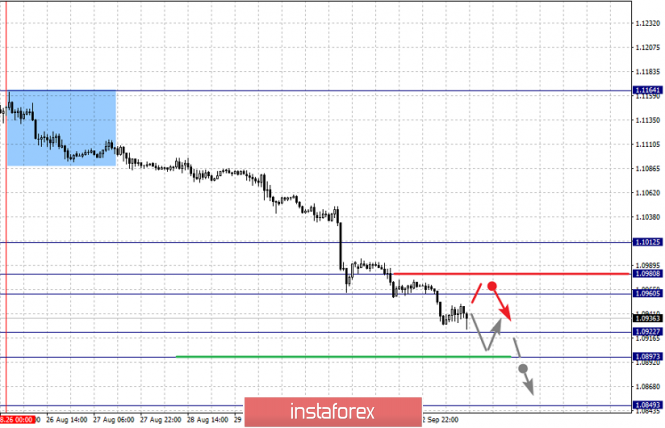
| Trading plan for EUR / USD and GBP / USD pairs on 09/03/2019 Posted: 03 Sep 2019 02:55 AM PDT The pound was in the undivided power of British politicians, whose hands seem to grow out of the wrong place, because they only send him all to new historical lows with their actions. Also, given the fact that the House of Commons has only four days before the suspension of the parliament, we have a fun week. The British parliament clearly opens the "crazy hands" artel for urgent drafting and adoption of legislative initiatives designed to tie Boris Johnson hand and foot. But in any case, all of these only adds to the uncertainty because no one understands at all what will happen now. So investors hastened to start getting rid of pounds in advance. Even though everyone will closely monitor what is happening in the United Kingdom today, who clearly intends to set a new historical low, it is unlikely that this will somehow help the unfortunate pound. The only question is how many times he will execute it this week. Moreover, Boris Johnson has already made another contribution to achieving the goals, announcing the possibility of early elections. In turn, the Labor Party has already published a bill banning Brexit without an agreement with the European Union. Only a small formality remained like the adoption of it by parliament. Here, Boris Johnson threatens with the dissolution of parliament in order to prevent such a development of events. Hence, the series called this week will break all records. What happens with the single European currency will not cause so many emotions and will not lead to a local shortage of popcorn. Although the mass media of agitation and misinformation tried to make Christine Lagarde as the main event from today's speech, the future head of the European Central Bank herself greatly disappointed them. In fact, she said nothing but words may be redundant as today's data on producer prices may show a slowdown in growth from 0.7% to 0.2%. Well, this indicates a serious slowdown in inflation, and the European Central Bank needs to use all its intellectual abilities to consider easing monetary policy. Dynamics of producer prices in Europe: The Pound/Dollar currency pair overcome the psychological level of 1.2000 in one breath and rushed to a further decline. It is likely to assume that a sequential descent will hold us for more than one day. Now, we are considering points 1.1950-1.1900 in the form of the primary move. The Euro/Dollar currency pair did not lag behind its counterpart and likewise showed an intense downward move, overcoming the psychological level of 1.1000. It is likely to suggest that a slowdown is possible around 1.1900, where it is worth analyzing fixation points for further trading deals. |


| You are subscribed to email updates from Forex analysis review. To stop receiving these emails, you may unsubscribe now. | Email delivery powered by Google |
| Google, 1600 Amphitheatre Parkway, Mountain View, CA 94043, United States | |
No comments:
Post a Comment