
Forex analysis review |
- Fractal analysis of the main currency pairs on October 1
- DAILY - #USDX vs EUR / USD vs GBP / USD vs USD / JPY. Comprehensive analysis of movement options on October 2019. Analysis
- DAILY - AUD / USD vs USD / CAD vs NZD / USD vs #USDX. Comprehensive analysis of movement options on October 2019. Analysis
- GBP/USD. September 30. Results of the day. Pound ignores second quarter GDP drop in UK
- EUR/USD. September 30. Results of the day. Background reports from the eurozone pulled down the euro
- EUR/USD. Germany disappointed: welcome to the eighth figure?
- The dilemma for gold: deep drawdown or chatter in the range?
- GBPUSD and EURUSD: A false break of the low of 1.0900 will be a strong bullish signal for the euro. Pound ignores weak economic
- September 30, 2019 : EUR/USD Intraday technical analysis and trade recommendations.
- September 30, 2019 : GBP/USD Intraday technical analysis and trade recommendations.
- Trading plan for GBP/USD for September 30, 2019
- EURUSD approaching major wedge support
- Gold starts the week with new lows eyeing $1,460
- Trading plan for Gold for September 30, 2019
- Trading recommendations for the EUR/USD currency pair on September 30: Placement of trade orders
- Trading plan for EUR/USD for September 30, 2019
- BTC 09.30.2019 - Possible rally before new down leg
- Gold 09.30.2019 - Downside breakout of the key suupport
- Pound did not wait for resignation
- GBP/USD 09.30.2019 - Pennant pattern for more downside
- EUR / USD: "bears" rely on the strength of the American economy and "bulls" are in no hurry to throw a white flag
- GBP/USD: plan for the American session on September 30th. Sellers ignored the weak report on the UK economy, indicating a
- EUR/USD: plan for the American session on September 30th. Bulls ignored labor market reports in Germany and the eurozone
- Technical analysis of GBP/USD for September 30, 2019
- Pound: October is favorable for growth and purchase
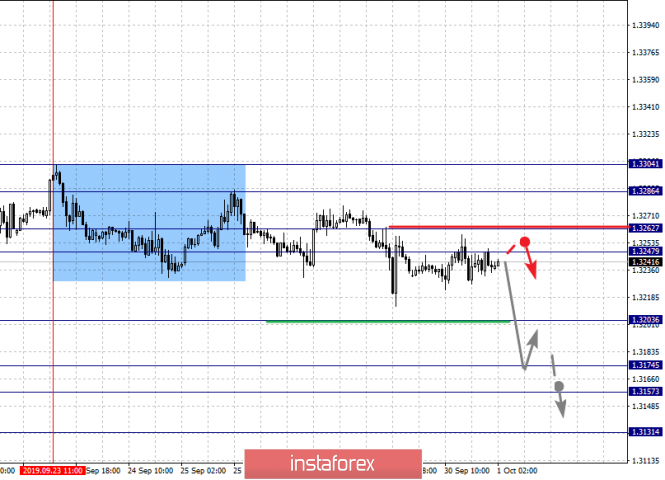
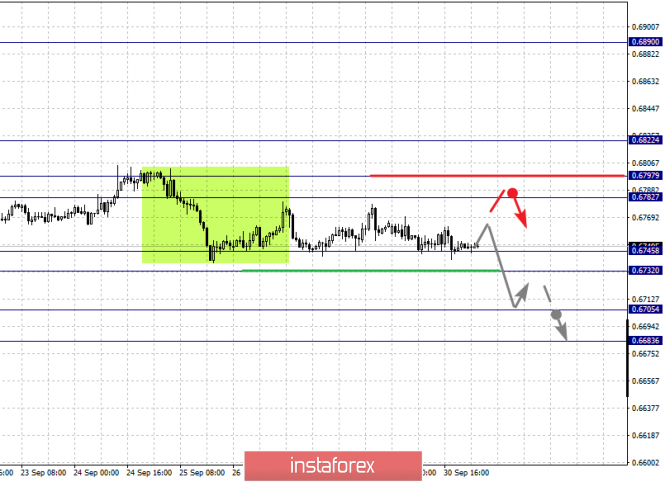
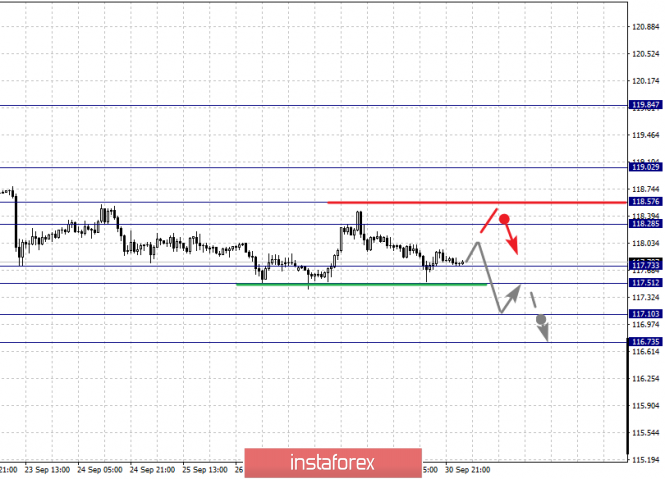
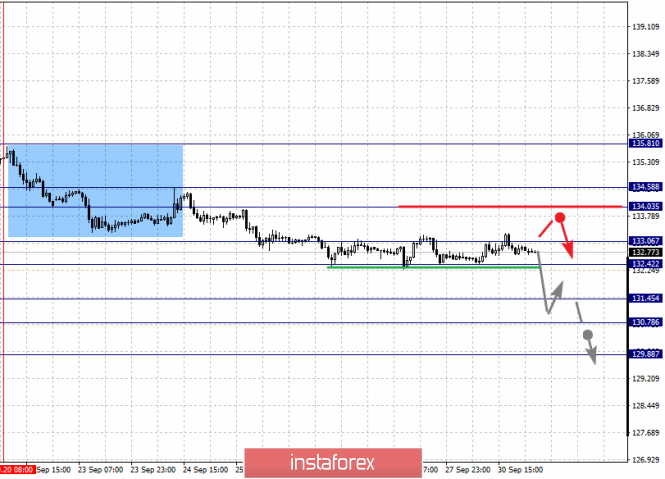
| Fractal analysis of the main currency pairs on October 1 Posted: 30 Sep 2019 05:38 PM PDT Forecast for October 1: Analytical review of currency pairs on the scale of H1: For the euro / dollar pair, the key levels on the H1 scale are: 1.0966, 1.0940, 1.0918, 1.0880, 1.0839, 1.0811 and 1.0761. Here, we continue to monitor the development of the descending structure of September 13. The continuation of the movement to the bottom is expected after the breakdown of the level of 1.0880. In this case, the target is 1.0839. Short-term downward movement, as well as consolidation is in the range of 1.0839 - 1.0811. For the potential value for the bottom, we consider the level of 1.0761. Upon reaching this level, we expect a rollback to the top. Short-term upward movement is possibly in the range of 1.0918 - 1.0940. The breakdown of the last value will lead to an in-depth correction. Here, the target is 1.0966. This level is a key support for the bottom. The main trend is the descending structure of September 13. Trading recommendations: Buy: 1.0918 Take profit: 1.0940 Buy 1.0941 Take profit: 1.0965 Sell: 1.0880 Take profit: 1.0840 Sell: 1.0837 Take profit: 1.0813 For the pound / dollar pair, the key levels on the H1 scale are: 1.2448, 1.2395, 1.2362, 1.2362, 1.2286, 1.2258 and 1.2203. Here, we are following the development of the descending structure of September 20. Short-term downward movement is expected in the range 1.2286 - 1.2258. The breakdown of the last value will lead to movement to a potential target - 1.2203. When this level is reached, we expect a pullback to the top. Short-term upward movement is expected in the range 1.2362 - 1.2395. The breakdown of the latter value will lead to an in-depth correction. Here, the target is 1.2448. This level is a key support for the downward structure. The main trend is the descending structure of September 20. Trading recommendations: Buy: 1.2362 Take profit: 1.2395 Buy: 1.2397 Take profit: 1.2446 Sell: 1.2286 Take profit: 1.2260 Sell: 1.2256 Take profit: 1.2204 For the dollar / franc pair, the key levels on the H1 scale are: 1.0054, 1.0037, 1.0007, 0.9985, 0.9954, 0.9935 and 0.9908. Here, we continue to monitor the development of the ascending structure of September 24. Short-term upward movement is expected in the range of 0.9985 - 1.0007. The breakdown of the last value should be accompanied by a pronounced upward movement. Here, the target is 1.0037. For the potential value for the top, we consider the level of 1.0054. Upon reaching which, we expect consolidation, as well as a pullback to the bottom. Short-term downward movement is possibly in the range of 0.9954 - 0.9935. The breakdown of the last value will lead to an in-depth correction. Here, the goal is 0.9908. This level is a key support for the top. The main trend is the ascending structure of September 24. Trading recommendations: Buy : 0.9985 Take profit: 1.0005 Buy : 1.0009 Take profit: 1.0035 Sell: 0.9954 Take profit: 0.9937 Sell: 0.9933 Take profit: 0.9910 For the dollar / yen pair, the key levels on the scale are : 108.84, 108.59, 108.24, 108.07, 107.79, 107.65 and 107.41. Here, we are following the development of the ascending structure of September 24. Short-term upward movement is expected in the range 108.07 - 108.24. The breakdown of the last value should be accompanied by a pronounced upward movement. Here, the target is 108.59. Price consolidation is near this level. For the potential value for the top, we consider the level of 108.84. Upon reaching this value, we expect a pullback to the bottom. Short-term downward movement is expected after the breakdown of the last value in the range of 107.79 - 107.65, which will lead to an in-depth correction. Here, the goal is 107.41. This level is the key support for the top. The main trend: the ascending structure of September 24. Trading recommendations: Buy: 108.08 Take profit: 108.24 Buy : 108.26 Take profit: 108.57 Sell: 107.79 Take profit: 107.66 Sell: 107.63 Take profit: 107.44 For the Canadian dollar / US dollar pair, the key levels on the H1 scale are: 1.3304, 1.3286, 1.3262, 1.3247, 1.3203, 1.3174, 1.3157 and 1.3131. Here, we are following the development of the descending structure of September 23. The continuation of the movement to the bottom is expected after the breakdown of the level of 1.3203. In this case, the target is 1.3174. Price consolidation is in the range of 1.3174 - 1.3157. For the potential value for the bottom, we consider the level of 1.3131. Upon reaching this level, we expect a pullback to the top. Short-term upward movement is possibly in the range of 1.3247 - 1.3262. The breakdown of the last value will lead to an in-depth correction. Here, the target is 1.3286. This level is a key support for the top. Its breakdown will lead to the development of an upward structure. In this case, the potential target is 1.3304. The main trend is the descending structure of September 23. Trading recommendations: Buy: 1.3247 Take profit: 1.3260 Buy : 1.3264 Take profit: 1.3286 Sell: 1.3203 Take profit: 1.3175 Sell: 1.3173 Take profit: 1.3158 For the Australian dollar / US dollar pair, the key levels on the H1 scale are : 0.6822, 0.6797, 0.6782, 0.6745, 0.6732, 0.6705 and 0.6683. Here, we are following the development of the downward cycle of September 13. Short-term downward movement is possibly in the range 0.6745 - 0.6732. The breakdown of the last value should be accompanied by a pronounced downward movement. Here, the target is 0.6705. Price consolidation is near this value. For the potential value for the bottom, we consider the level of 0.6683. Upon reaching which, we expect a departure in the correction. Short-term upward movement is possibly in the rangge of 0.6782 - 0.6797. The breakdown of the last value will lead to a long correction. Here, the potential target is 0.6822. This level is a key support for the downward structure. The main trend is the downward cycle of September 13. Trading recommendations: Buy: 0.6782 Take profit: 0.6795 Buy: 0.6797 Take profit: 0.6820 Sell : 0.6745 Take profit : 0.6734 Sell: 0.6730 Take profit: 0.6707 For the euro / yen pair, the key levels on the H1 scale are: 119.02, 118.57, 118.28, 117.73, 117.51, 117.10 and 116.73. Here, the price canceled the formation of the potential for the top. As a result, we expect the development of the downward structure of September 18. The continuation of the movement to the bottom is expected after the price passes the noise range 117.73 - 117.51. In this case, the target is 117.10. For the potential value for the bottom, we consider the level of 116.73. Upon reaching this value, we expect a rollback to the top. Short-term upward movement is possibly in the range 118.28 - 118.57. The breakdown of the latter value will lead to in-depth movement. Here, the goal is 119.02. This level is a key support for the downward structure. The main trend is the descending structure of September 18. Trading recommendations: Buy: 118.28 Take profit: 118.55 Buy: 118.60 Take profit: 119.00 Sell: 117.50 Take profit: 117.10 Sell: 117.08 Take profit: 116.73 For the pound / yen pair, the key levels on the H1 scale are : 135.81, 134.58, 134.03, 133.06, 132.42, 131.45, 130.78 and 129.88. Here, we are following the development of the descending structure of September 20. Short-term movement to the bottom is expected in the range 133.06 - 132.42. The breakdown of the latter value should be accompanied by a pronounced downward movement. In this case, the target is 131.45. Price consolidation is in the range of 131.45 - 130.78. We consider the level of 129.88 to be a potential value for the downward movement. Upon reaching this level, we expect a pullback to the top. Short-term upward movement is possibly in the range of 134.03 - 134.58. The breakdown of the latter value will lead to the formation of an upward structure. In this case, the potential target is 135.81. The main trend is the formation of the downward structure of September 20. Trading recommendations: Buy: 134.03 Take profit: 134.55 Buy: 134.60 Take profit: 135.80 Sell: 132.40 Take profit: 131.45 Sell: 131.43 Take profit: 130.80 The material has been provided by InstaForex Company - www.instaforex.com |
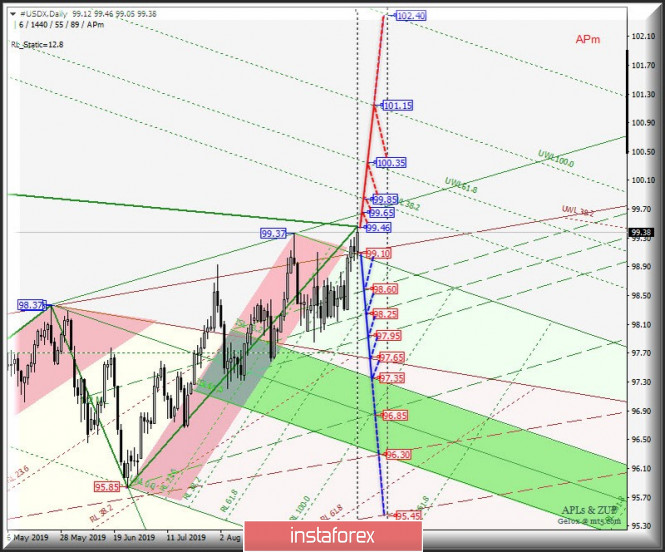
| Posted: 30 Sep 2019 05:11 PM PDT In anticipation of Brexit - what could be on October 2019 with the movement #USDX , EUR / USD, GBP / USD and USD / JPY s - a comprehensive analysis (the proportion of these instruments in calculating the dollar index is 83.1%) Minor operational scale (Daily time frame) ____________________ US dollar Index On October 2019, the development of the movement of the dollar index #USDX will be determined by the direction of the breakdown of the range :
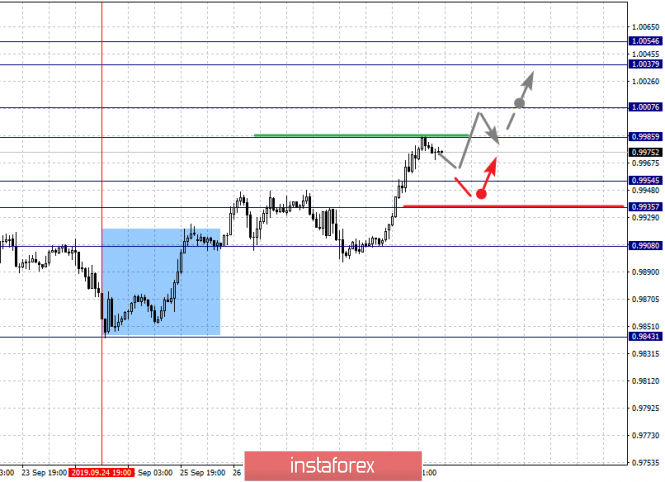
In case of updating the local maximum 99.46, the upward movement of the dollar index can continue to the goals - control line UTL Minuette (99.65) - warning lines - UWL38.2 (99.85) - UWL61.8 (100.35) - UWL100.0 (101.15) of the Minuette operational scale fork. If #USDX would be below the reference line UTL (support level of 99.10) Minor operational scale fork, then it will be possible to develop a downward movement of the instrument to the boundaries of the 1/2 Median Line Minuette channel (98.60 - 98.25 - 97.95) with a view to achieving SSL Minor initial line (97.65) and the upper boundary of ISL38.2 (97.35) of the equilibrium zone of the Minuette operational scale fork. The markup of #USDX motion options on October 2019 is shown in the animated chart. ____________________ Euro vs US dollar The development of the movement of the single European currency EUR / USD on October 2019 will also be determined by the direction of the breakdown of the range :
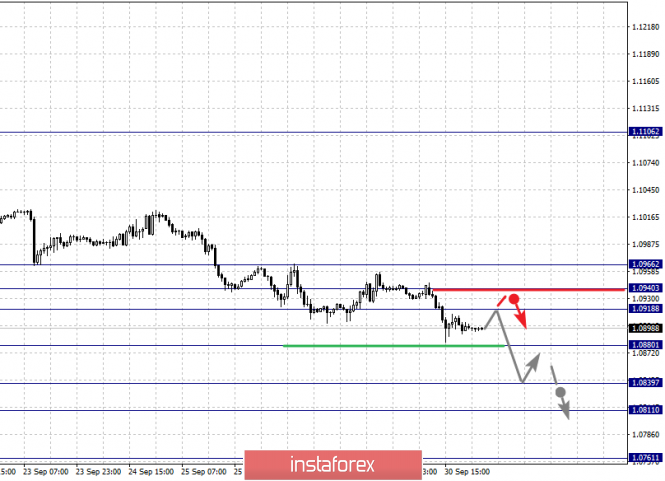
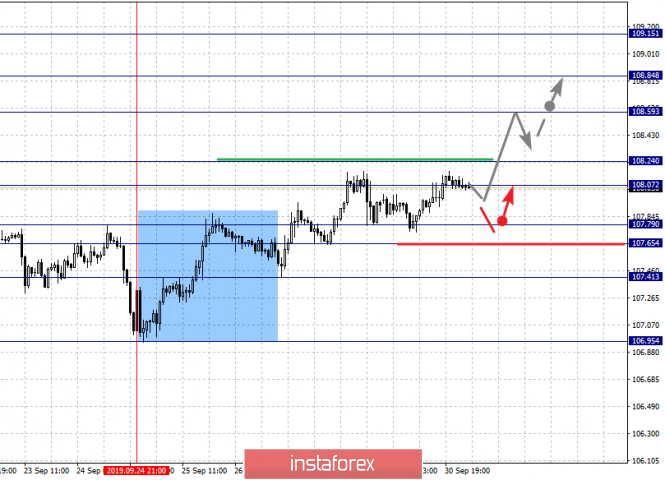
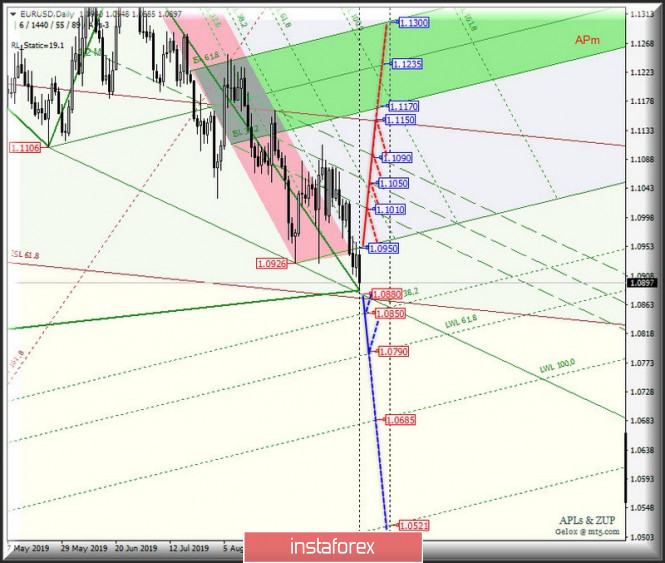
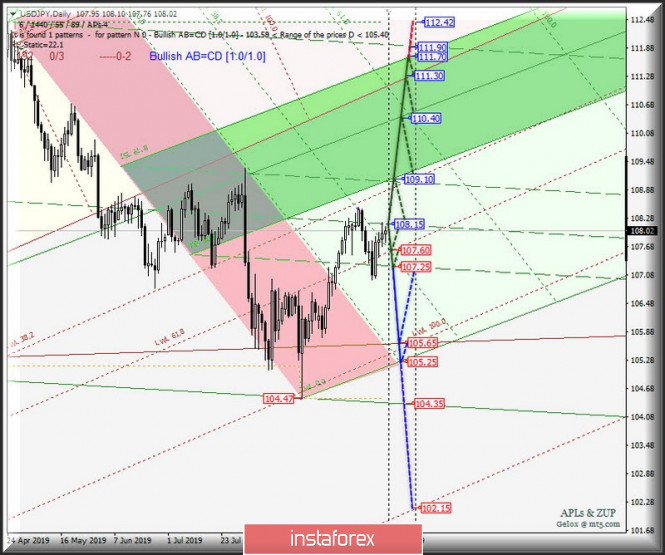
In case of breakdown of the LTL Minuette control line (support level of 1.0880), the downward movement of the single European currency will continue to the warning lines UWL38.2 (1.0850) and UWL61.8 (1.0790) of the Minuette operational scale fork. If EUR / USD returns above the initial SSL line (resistance level of 1.0950) of the Minuette operational scale, the upward movement of this currency instrument can continue to the boundaries of the 1/2 Median Line channel (1.1010 - 1.1050 - 1.1090) of the Minuette operational scale fork with the prospect of reaching the Median Line (1.1150) of the Minor operating scale fork. The details of the EUR / USD movement options for October 2019 are shown in the animated chart. ____________________ Great Britain pound vs US dollar The development of Her Majesty's currency movement GBP / USD in October 2019 will also be determined by the direction of the breakdown of the range :
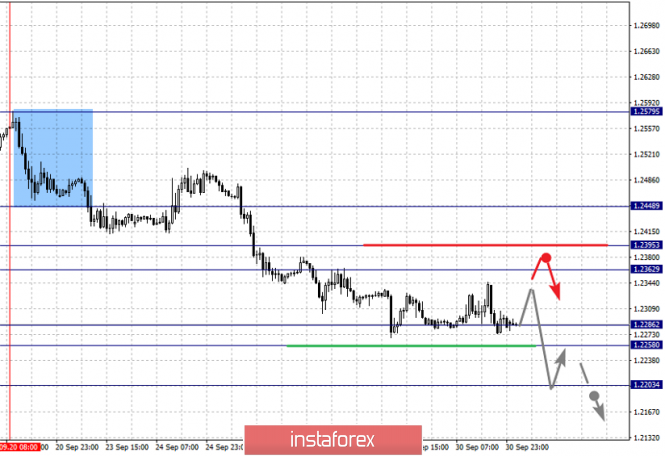
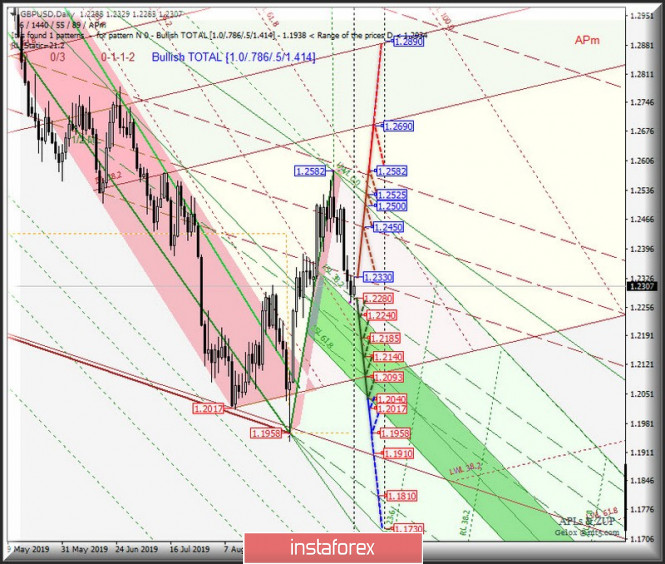
In case of breakdown of the support level of 1.2280, the development of Her Majesty's currency movement will continue within the boundaries of the 1/2 Median Line channel (1.2280 - 1.2185 - 1.2093) and the equilibrium zone (1.2240 - 1.2140 - 1.2040) of the Minuette operational scale forks with the prospect of updating the minimums (1.2017 - 1.1958) If a breakdown of the resistance level of 1.2330 takes place, then the development of the GBP / USD movement will begin to occur in the 1/2 Median Line channel of the Minor (1.2330 - 1.2450 - 1.2582) with the prospect of reaching the lower boundary of the ISL38.2 (1.2690) equilibrium zone of the Minor operational scale fork. The details of the GBP / USD movement on October 2019 can be seen in the animated chart. ____________________ US dollar vs Japanese yen Meanwhile, the development of the currency movement of the "country of the rising sun" USD / JPY on October 2019 will continue to be determined by the development and the direction of the breakdown of the boundaries of the 1/2 Median Line channel (107.25 - 108.15 - 109.10) of Minuette operational scale fork. The details of the movement inside this channel are presented in the animated chart. The breakdown of the resistance level of 109.10 on the upper boundary of the 1/2 Median Line channel of Minuette operational scale will confirm that further the movement of the currency of the "country of the rising sun", which will continue in the 1/2 Median Line channel (109.10 - 110.40 - 111.70) of the Minuette operational scale fork. In case of breakdown of the lower boundary of the 1/2 Median Line Minuette channel (support level of 109.10), the downward movement of USD / JPY will be directed to the control line LTL (105.65) of the Minor operational scale fork and the start line SSL (105.25) of the Minuette operational scale fork. We look at the details of the USD / JPY movement on October 2019 in the animated chart. ____________________ The review is made without taking into account the news background. Thus, the opening of trading sessions of the main financial centers does not serve as a guide to action (placing orders "sell" or "buy"). The formula for calculating the dollar index : USDX = 50.14348112 * USDEUR0.576 * USDJPY0.136 * USDGBP0.119 * USDCAD0.091 * USDSEK0.042 * USDCHF0.036. where the power coefficients correspond to the weights of the currencies in the basket: Euro - 57.6% ; Yen - 13.6% ; Pound Sterling - 11.9% ; Canadian dollar - 9.1%; Swedish Krona - 4.2%; Swiss franc - 3.6%. The first coefficient in the formula leads the index to 100 at the start date of the countdown - March 1973, when the main currencies began to be freely quoted relative to each other. The material has been provided by InstaForex Company - www.instaforex.com |
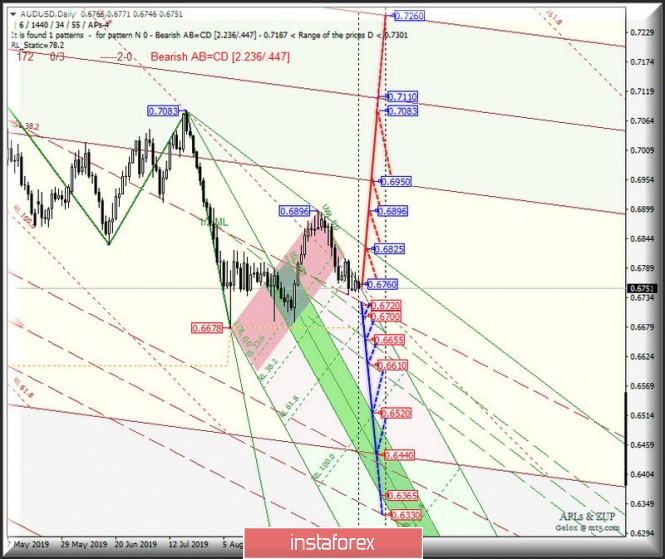
| Posted: 30 Sep 2019 05:04 PM PDT Minor operational scale (H4) What is October preparing for us? A comprehensive analysis of the development of the movement AUD / USD vs USD / CAD vs NZD / USD vs #USDX on October 2019 at the Minor operational scale ( Daily timeframe ). ____________________ US dollar Index On October 2019, the development of the movement of the dollar index #USDX will be determined by the direction of the breakdown of the range :
In case of updating the local maximum 99.46, the upward movement of the dollar index can continue to the goals - control line UTL Minuette (99.65) - warning lines - UWL38.2 (99.85) - UWL61.8 (100.35) - UWL100.0 (101.15) of the Minuette operational scale fork. On the contrary, if #USDX would be below the reference line UTL (support level of 99.10) Minor operational scale fork, then it will be possible to develop a downward movement of the instrument to the boundaries of the 1/2 Median Line Minuette channel (98.60 - 98.25 - 97.95) with a view to achieving SSL Minor initial line (97.65) and the upper boundary of ISL38.2 (97.35) of the equilibrium zone of the Minuette operational scale fork. The markup of #USDX movement options on October 2019 is shown in the animated chart. ____________________ Australian dollar vs US dollar The development of the movement of the Australian dollar AUD / USD on October 2019 will also be determined by the direction of the breakdown of the range :
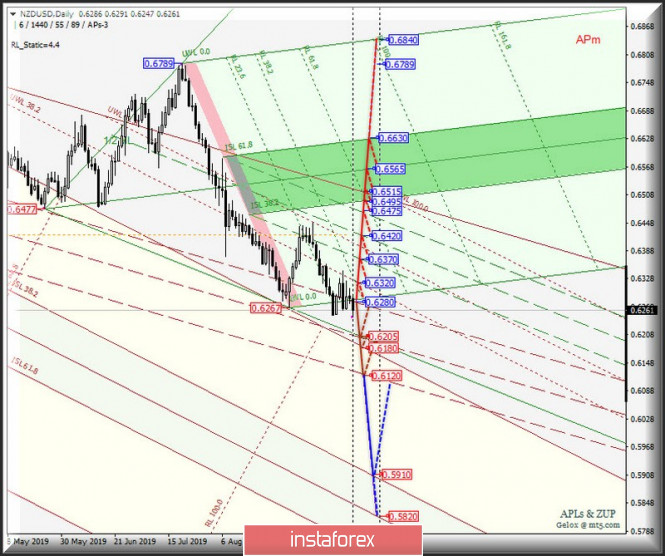
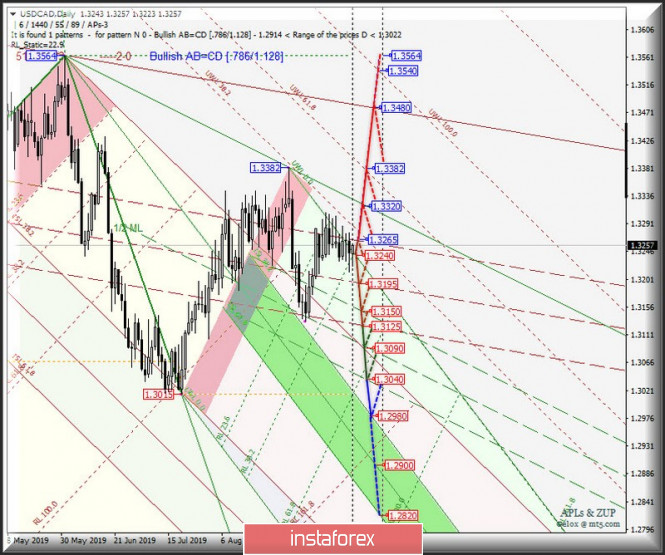
The breakdown of the final Shiff Line Minor (support level of 0.6720) - continued development of the downward movement of AUD / USD to the boundaries of the 1/2 Median Line Minuette channel (0.6700 - 0.6655 - 0.6610) with the prospect of reaching the boundaries of the equilibrium zone (0.6520 - 0.6440 - 0.6335) of the Minuette operational scale fork. On the contrary, the breakdown of the resistance level of 0.6760 (the initial SSL line of the Minuette operational scale fork) - an option for the development of the upward movement of the Australian dollar to the targets - the control line UTL Minuette (0.6825) - local maximum 0.6896 - the lower boundary of the ISL38.2 (0.6950) equilibrium zone of the Minor operational scale fork - local maximum 0.7083. We look at the layout of the AUD / USD movement options on October 2019 in the animated chart. ____________________ New Zealand dollar vs US dollar However, the development of the movement of the New Zealand dollar NZD / USD on October 2019 will be determined by the development and direction of the breakdown of the boundaries of the 1/2 Median Line channel (0.6280 - 0.6205 - 0.6120) of the Minor operational scale fork. We look at the animated chart for details of the movement inside this channel. The breakdown of the lower boundary of the 1/2 Median Line Minor channel (support level of 0.6120) will direct the movement of NZD / USD to the upper boundary of ISL38.2 (0.5910) of the equilibrium zone of the Minor operational scale fork. If the New Zealand dollar returns above the upper boundary of the 1/2 Median Line Minor channel (resistance level of 0.6280) and the breakdown of the warning line UWL38.2 (0.6320) of the Minor operational scale fork, it will be possible for the NZD / USD to reach the boundaries of the 1/2 Median Line channel (0.6370 - 0.6420 - 0.6475) and equilibrium zones (0.6495 - 0.6565 - 0.6630) of the Minuette operational scale fork. We look at the layout of the NZD / USD movement options on October 2019 in the animated chart. ____________________ US dollar vs Canadian dollar Similarly, the development of the movement of the Canadian dollar USD / CAD on October 2019 will be due to the development and direction of the breakdown of the boundaries of the 1/2 Median Line channel (1.3265 - 1.3195 - 1.3125) of the Minor operational scale fork. The movement markings inside this channel are presented in the animated chart. If the upper boundary of the 1/2 Median Line channel (resistance level of 1.3265) is broken, the upward movement of the Canadian dollar can be continued towards the targets - control line UTL (1.3320) of the Minuette operational scale fork - warning line UWL61.8 Minor (1.3382) - control line UTL Minor (1.3480). In case of breakdown of the lower boundary of the 1/2 Median Line channel (1.3125) of the Minor operational scale fork, the development of the USD / CAD movement will continue in the 1/2 Median Line Minuette channel (1.3150 - 1.3090 - 1.3040) with the prospect of reaching the upper boundary of ISL38.2 (1.2980) of the Minuette operational scale fork. We look at the layout of the USD / CAD movement options on October 2019 in the animated chart. ____________________ The review is made without taking into account the news background. Thus, the opening of trading sessions of the main financial centers does not serve as a guide to action (placing orders "sell" or "buy"). The formula for calculating the dollar index: USDX = 50.14348112 * USDEUR0.576 * USDJPY0.136 * USDGBP0.119 * USDCAD0.091 * USDSEK0.042 * USDCHF0.036. where the power coefficients correspond to the weights of the currencies in the basket: Euro - 57.6%; Yen - 13.6%; Pound Sterling - 11.9%; Canadian dollar - 9.1%; Swedish Krona - 4.2%; Swiss franc - 3.6%. The first coefficient in the formula leads the index to 100 at the start date of the countdown - March 1973, when the main currencies began to be freely quoted relative to each other. The material has been provided by InstaForex Company - www.instaforex.com |
| GBP/USD. September 30. Results of the day. Pound ignores second quarter GDP drop in UK Posted: 30 Sep 2019 03:45 PM PDT 4-hour timeframe Amplitude of the last 5 days (high-low): 78p - 88p - 150p - 78p - 66p. Average volatility over the past 5 days: 92p (high). At first glance, GDP in the UK showed a positive trend in the second quarter of 2019, as the annual rate was +1.3% with a forecast value of +1.2% and the same value in the first quarter. However, a quarterly decrease was recorded by 0.2%. Thus, in comparison with the first quarter of 2019, we have precisely a decline in GDP. Accordingly, this is a bearish factor for the pound/dollar pair. However, traders refrained from new sales of the currency pair today. Throughout the day there was a slight upward correction, which is purely technical in nature. No important macroeconomic information has come from the United States today. Meanwhile, Boris Johnson apologized to Queen Elizabeth II, who approved his request to suspend Parliament. In fact, this is an absolutely unprecedented case when the Supreme Court repeals the decision of the Queen of Great Britain. However, a lot of unprecedented things are happening in the United Kingdom, and how much more can happen ... Let's start with the fact that Boris Johnson can still become the prime minister who will rule the country at the shortest time. Since his assumption of office, a little more than 2 months have passed, and all these two months, Johnson "walks along the edge of a knife." He completely ruined relations with Parliament, and negotiations with the European Union are at an impasse. Now on the agenda are questions of a vote of no confidence in Johnson, or even impeachment. The prime minister himself sees this as an opportunity to hold early parliamentary elections, in which he hopes to win, which will allow him to form the necessary majority in order to adopt a hard Brexit. But we believe that the deputies also understand this very well and will not initiate procedures that will threaten the holding of early elections. At the same time, impeachment is not a vote of no confidence. It is impeachment, which can be imposed on the basis of a Court order on the illegality of Johnson's decision to suspend the work of Parliament, that will lead to a judicial investigation against the prime minister, and in this case, the main opposition Jeremy Corbin may take his place. We believe that today or tomorrow this issue will be raised in the Parliament, and then everything will depend on how many deputies will support the beginning of this procedure. Given Johnson's sharp dissatisfaction with the work outside his own party, one can expect that all but conservatives will vote "for" impeachment. A new dilemma arises for the pound. Is Boris Johnson's resignation good or bad for the UK and the pound? From our point of view - good. Currency traders understand that under Boris Johnson there is no agreement with the European Union, Brexit will be implemented according to a hard scenario, and severe shocks await the country's economy. Thus, his resignation and the coming to power of a more loyal leader will significantly reduce the likelihood of a hard Brexit, which is what the pound needs to get back to growth against the US dollar. The technical picture of the pair is now showing an upward correction while maintaining a downward trend. We are waiting for the completion of a round of corrective movement and news from Parliament. Trading recommendations: The pound/dollar currency pair has now begun to adjust. Thus, we recommend waiting for the correction to complete, after which we again consider the sale of the pound with targets near the levels of 1.2228 and 1.2203. Buying is not recommended yet. In addition to the technical picture, fundamental data and the time of their release should also be taken into account. Explanation of the illustration: Ichimoku indicator: Tenkan-sen is the red line. Kijun-sen is the blue line. Senkou Span A - light brown dotted line. Senkou Span B - light purple dashed line. Chikou Span - green line. Bollinger Bands Indicator: 3 yellow lines. MACD indicator: Red line and bar graph with white bars in the indicator window. The material has been provided by InstaForex Company - www.instaforex.com |
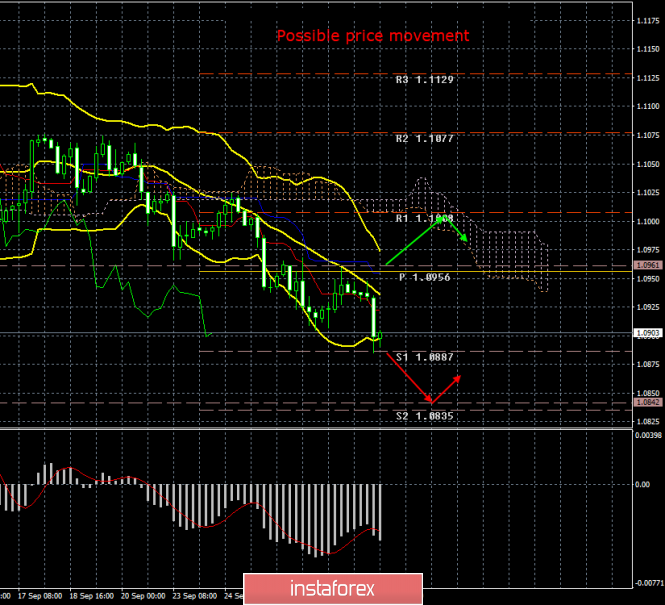
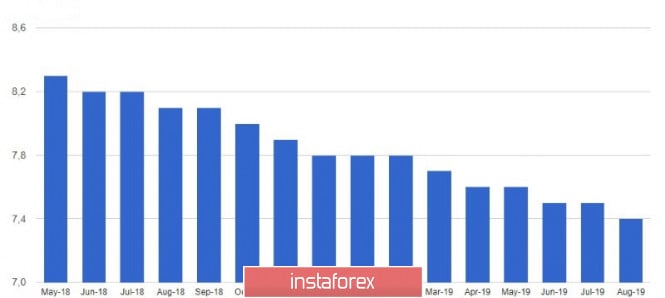
| EUR/USD. September 30. Results of the day. Background reports from the eurozone pulled down the euro Posted: 30 Sep 2019 03:45 PM PDT 4-hour timeframe Amplitude of the last 5 days (high-low): 60p - 40p - 84p - 59p - 54p. Average volatility over the past 5 days: 59p (average). The skepticism of traders regarding the prospects for the European currency rolls over. During the first trading day of the new week and the last day of September, not a single truly important macroeconomic report was published either in Europe or in the US. It is unlikely that the preliminary value of inflation for September in Germany can be regarded as an important report. Nevertheless, traders drew attention to inflation slowing down to 1.2% in Germany, did not pay attention to the declining unemployment rate in the eurozone in August to 7.4%, and considered the report on retail sales in Germany to be important, showing an increase in August of +3 , 2% y/y, with a forecast of +3.3% and a past value of +4.4%. As we have repeatedly said, inflation in Germany is most interesting only as a more accurate forecast of inflation in the European Union. If the CPI of the largest economy of the eurozone slows down, then there is every reason to assume a slowdown and the CPI throughout the eurozone. In general, this is in any case negative data for the European currency, which today again updated two-year lows and is not going to stop there. As we have already said, price parity with the US currency does not look like something unrealistic now. It should also be noted that traders are now completely not interested in a number of topics that should seem to put pressure on the US dollar. Starting with the topic of a possible impeachment to Donald Trump, ending with the same trade wars. We will not dwell on these topics in detail, since they have been examined a thousand times already. More important now is the macroeconomic statistics from the United States and the European Union, the balance between the monetary policies of the ECB and the Federal Reserve. These factors definitely work in favor of the US dollar. A number of important macroeconomic indicators will be published tomorrow, starting with the preliminary EU inflation in September and ending with the equally important ISM business activity index in the US manufacturing sector, which amounted to 49.1 last month, indicating a decline in the industry. Markit PMI will also be released, which balances "on the edge" - 51.0 in August. These two indicators are the possible rescue of the euro from a new fall tomorrow. If business activity in the industry falls/stays below 50.0, this will be a bullish factor for the EUR/USD currency pair. In fact, the US economy has long been showing signs of a slowdown, however, it does not play a special role in the context of the euro/dollar currency pair, as things are much worse in the European Union. So it turns out that the US economy seems to be trying to catch up with the European one, but it is slowing at a faster pace. Investors therefore calmly continue to buy the dollar, and Donald Trump has no choice but to criticize the Fed again for the too slow lowering of the key rate, which does not give the US currency a reason to fall. The technical picture of the pair is unambiguous. On Monday, September 30, the support level of 1.0887 was worked out. A rebound from it is very likely. If inflation in the European Union does not slow down even more tomorrow, and business activity indices in the US industry disappoint, then we can count on a more or less serious correction. However, below the critical line of Kijun-sen, a downward mood in the Forex market is still preserved. Trading recommendations: EUR/USD continues to move down. Thus, we recommend taking profits near the level of 1.0887, and open new sales no earlier than overcoming this target with the target level of 1.0842. It's still impractical to buy the euro/dollar pair. In addition to the technical picture, fundamental data and the time of their release should also be taken into account. Explanation of the illustration: Ichimoku indicator: Tenkan-sen is the red line. Kijun-sen is the blue line. Senkou Span A - light brown dotted line. Senkou Span B - light purple dashed line. Chikou Span - green line. Bollinger Bands Indicator: 3 yellow lines. MACD indicator: Red line and bar graph with white bars in the indicator window. The material has been provided by InstaForex Company - www.instaforex.com |
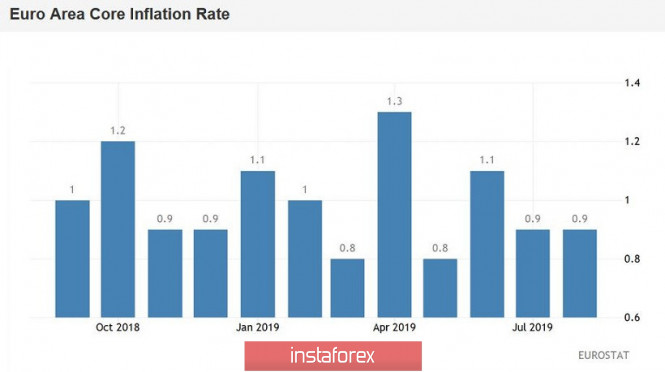
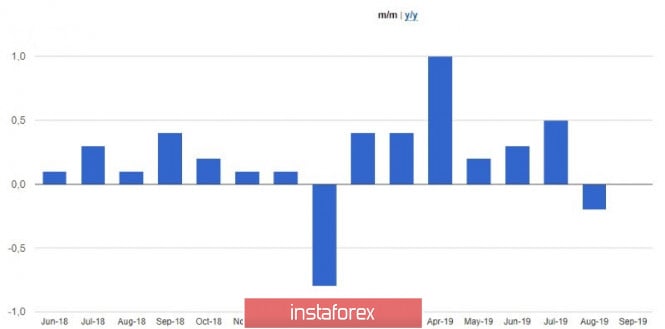
| EUR/USD. Germany disappointed: welcome to the eighth figure? Posted: 30 Sep 2019 03:45 PM PDT The euro-dollar pair today resumed the downward movement and for the first time since 2017 tested the eighth figure. And although on Friday, the EUR/USD bulls were able to win a few dozen points from the bears, corrective growth did not continue today. Political events in the US continue to support the dollar, which is temporarily used by the market as a defensive tool. The European currency is also going through "troubled times" - in anticipation of the release of data on inflation growth in the eurozone, rather weak figures of German inflation were published today. This is a very "wake-up call", which portends the further easing of monetary policy by the ECB. Such a "black and white" fundamental background opens the way for the EUR/USD bears to the area of the eighth figure, and to be more precise, to the level of 1.0820 (the lower line of the Bollinger Bands indicator on the monthly chart). And although this is the lower limit of the new price range (after the bears overcome the support level of 1.0950), sellers can achieve it in the medium term, especially if fundamental factors resonate in one direction, that is, against the euro and in favor of the dollar. The immediate reason for today's downward impulse of the pair was the data on inflation growth in Germany. The annualized general consumer price index continued its downward movement, reaching 1.2% (with a forecast of growth to 1.3%). In monthly terms, the indicator came to zero, adding to the negative picture. The harmonized consumer price index also disappointed. In both monthly and annual terms, the indicator came out in the "red zone", not reaching the forecast values. It is worth recalling that German macroeconomic reports have recently shown extremely weak results. In particular, the September index of business activity in the manufacturing sector in Germany collapsed to a record low - to -41 points. On the whole, in the eurozone, this index also turned out to be lower than forecasted values, recording a slowdown in production. Industrial PMI has been declining for almost the entire year, and since February it has been below the key level of 50 points, indicating a decline in industry. Similar dynamics were recorded in France and Italy. The PMI in the service sector also ended up in the red zone, complementing the overall negative picture. All this suggests that further easing of the monetary policy parameters of the ECB will continue to be on the agenda. Despite a certain split in the camp of the European Central Bank, most traders are confident that the regulator will not be limited to the measures adopted in September. If tomorrow's release on the growth of pan-European inflation also comes out worse than expected, then the pressure on the euro will grow due to the increased likelihood of further steps by the ECB. By the way, today in the Financial Times publication an interview was published by Mario Draghi, who, among other things, specified that the European Central Bank "still has an arsenal that the regulator can use." At the same time, he clarified that we are talking about the size of the interest rate and the volume of QE. Add fuel to the fire and ECB chief economist Philip Lane. He stated that the European Central Bank has not yet approached the limit for reducing the deposit rate, that is, this indicator has not reached the level that would be harmful to lending. Lane said that in some other countries there are "lower negative rates" (apparently, he meant Switzerland), so the ECB has not yet reached the technical limit in this context. Such "dovish revelations" of the representatives of the European Central Bank's senior management put pressure on the euro as a whole, and on the EUR/USD pair in particular. Today's macroeconomic data only increased pressure on the single currency, especially on the eve of the publication of a common European CPI. According to preliminary forecasts, the overall index will remain at the level of the previous month, that is, at around one percent. Core inflation should show minimal growth, rising from 0.9% to 1%. If the real numbers fall below the predicted values, the EUR/USD bears will again have a chance to gain a foothold in the eighth figure. From a technical point of view, the situation is as follows. On all, without exception, higher timeframes (from H4 and above), the pair is on the lower line of the Bollinger Bands indicator under all lines of the Ichimoku indicator, which generated a strong bearish "Parade of Lines" signal. This indicates a clear advantage of the downward movement. The bearish momentum is so strong that it's too early to talk about a price correction: only if the data on the growth of European inflation comes out much better than expected tomorrow, the bulls of the pair can count on a price pullback. Otherwise, priority will remain downwards. The main target of the downward movement is located on the lower line of the Bollinger Bands indicator on the monthly chart, that is, at around 1.0820. The material has been provided by InstaForex Company - www.instaforex.com |
| The dilemma for gold: deep drawdown or chatter in the range? Posted: 30 Sep 2019 03:45 PM PDT Despite the fact that gold continues to recede from three-month highs amid weakening demand for safe haven assets, the long-term trend in precious metals is upward, as the world is entering a period of global instability. There are plenty of reasons for this; we will name some of them: 1. The long-term struggle for world leadership between the United States and China, due to the fact that the economic and financial potential of China is growing at a faster pace in relation to America. 2. Another exacerbation of geopolitical tensions in the Middle East, fraught with a major regional war. This scenario may come true in the coming years. 3. The huge volume of debt obligations (public and private), the size of which in relation to the size of the economies of leading countries makes it impossible to repay them in any future. Debts can only be discounted through devaluation and hyperinflation. Even these reasons may be enough to create a "perfect storm" on the gold market, which will result in a multiple increase in its value over the next 5-7 years. However, the current situation is such that, despite the long-term growth factors mentioned above, the gold market is "overheated" and has good chances to adjust downward. The end of September seems to be a good time to start such a correction, the goals of which can be seen in the area of $1,400-1,450 per ounce. However, it is not a fact that the correction will be just that. It is likely that quotes will continue to consolidate in the range of $1,480-1,560 for a couple of months. It is expected that in the near future gold will either break the level of $1,480 and rush down for a short time, or again go to test the highs in the area of $1,550. Specialists at TD Securities believe that increasing concerns about the prospects for the global economy will help investors continue to be interested in defensive assets in order to preserve their capital. The bank predicts that by the end of this year gold may rise in price up to $1,600 per ounce. According to experts, gold was shattered by the September decision of the Federal Reserve to lower the interest rate by 0.25%, which disappointed the bulls. Nevertheless, the precious metal may end the current year by $1,600 or higher if the US central bank continues to aggressively mitigate monetary policy in October and December. If this trend continues in 2020, then gold may even update the record highs of $1,900 achieved in 2011. The material has been provided by InstaForex Company - www.instaforex.com |
| Posted: 30 Sep 2019 03:44 PM PDT Today's data on a decrease in unemployment in the eurozone did not support the euro, while a report on a decrease in inflation in Italy and Germany disappointed investors. Weak inflation is another reason for the European Central Bank to think about lowering interest rates in the future. The British pound ignored data on a reduction in economic growth, which could lead to an upward correction of the pair in the near future, as there were clearly fewer people wishing to sell at current levels than in the middle of last week. According to the data, the preliminary harmonized by EU standards consumer price index in Spain in September this year grew by only 0.2% compared to September 2018 after rising by 0.4% in August this year. On a monthly basis, inflation showed a decline. Economists forecast that Spain's preliminary harmonized HCPI CPI in September was 0.3% per annum. As I noted above, Italy's consumer price index also put pressure on the euro, as it fell by 0.5% in September this year, after a seemingly convincing increase of 0.4% in August this year. On an annualized basis, the index showed an increase of only 0.4%. Economists had expected a decline of 0.3% compared to August and a growth of 0.6% compared to September 2018. German inflation data also disappointed. According to the report, in September inflation remained unchanged compared with August, and annual growth slowed to 1.2%, according to the forecast of economists, who expected a reduction to only 1.3%. But the number of applications for unemployment benefits in Germany has decreased, which is a good signal for an economy that is practically demonstrating a technical recession. According to the Federal Employment Agency, in September the number of unemployed fell by 10,000 after rising in 2000 in August. The data for the previous month were revised downward. Economists had expected an increase in the number of applications for unemployment benefits by 5,000. Unemployment remained unchanged at 5.0%. The number of registered vacancies in September fell by 47,000 to 787,000. Data on the unemployment rate in the eurozone, of course, are a small "outlet" for the European Central Bank, which is under pressure from all sides. According to a report by the EU Statistical Agency, unemployment in August 2019 fell to 7.4% from 7.5% in July. However, the eurozone economy continues to slow down, and counting on its larger growth this year will hardly be possible. Many analysts do predict a recession in the coming years. The problem remains the manufacturing sector, as well as a drop in external demand amid trade conflicts. The total number of unemployed in the eurozone in August of this year decreased by 115,000, which indicates the strength of the labor market. As for the technical picture of the EURUSD pair, a breakthrough of a large level of support at the annual low will necessarily lead to further sale of risky assets in the region of lows 1.0870 and 1.0830. However, to expect that the bearish trend observed since September 16 will continue without a significant upward correction will also be wrong. It is likely that large players will now collect stop orders of buyers below the low of the year, and then expand the market, forming a slight increase in the euro at the beginning of next month. Resistances found in 1.0930 and 1.0990. GBPUSD Pound sellers ignored evidence that the UK economy contracted slightly more than expected in the 2nd quarter of 2019. The decline was due to a weak manufacturing sector. There was also a serious decline in company investment amid a slowdown in global economic growth, as well as uncertainties around Brexit. According to the National Bureau of Statistics, in the 2nd quarter on an annualized basis, UK GDP fell by 0.9%, while, according to the first estimate, the decline was 0.8%. Compared to the previous quarter, GDP fell by 0.2%, which fully coincided with the forecasts of economists. Let me remind you that traders prefer short positions on the pound against the backdrop of uncertainty with Brexit, as the deadline for leaving the EU was postponed from March to October 31 this year. The likelihood of impeachment to British Prime Minister Boris Johnson leads the country into an even greater political crisis and does not bode well for future economic growth. Last Friday, opposition figures in Britain began talking about impeachment procedures for incumbent Prime Minister Boris Johnson. And it should be assumed that there is every reason for this after the Supreme Court of Great Britain declared Johnson's attempt to suspend the work of Parliament unlawful on September 24. As for the technical picture of the GBPUSD pair, the break of the 1.2280 support will lead to a further pound movement down to the 1.2230 and 1.2170 lows. The material has been provided by InstaForex Company - www.instaforex.com |
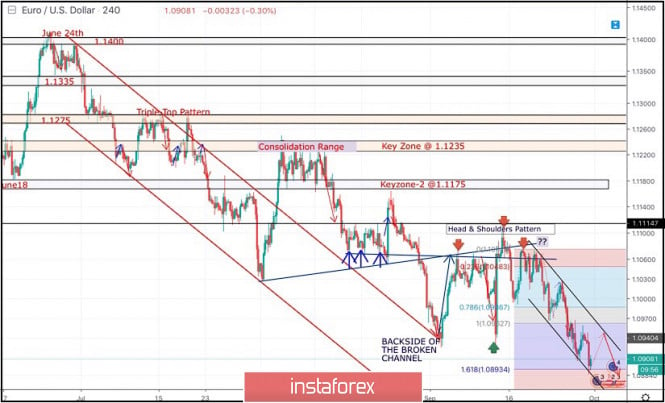
| September 30, 2019 : EUR/USD Intraday technical analysis and trade recommendations. Posted: 30 Sep 2019 10:10 AM PDT
On September 5, the EUR/USD pair was testing the backside of both broken trends around 1.1060-1.1080 where significant bearish pressure was demonstrated pushing the pair directly towards 1.0940 (Prominent Weekly Bottom). Bearish Breakout below the price level of 1.0940 was needed to enhance further bearish decline towards 1.0900 and 1.0840 (Fibonacci Expansion Key-Levels). However, considerable bullish rejection was demonstrated as a quick bullish spike towards 1.1100 where another episode of bearish pressure was expressed. Shortly-After, TWO DESCENDING-Tops were established around 1.1080 and 1.1050. This rendered the recent bullish spike as a bullish trap. Since then, the EURUSD has been trending-down within the depicted short-term bearish channel. On September 23, a recent bullish pullback towards the price level of 1.1020 was obviously rejected by the end of Tuesday's consolidations. Bearish persistence below 1.0965 (recent daily bottom) enhanced more bearish decline towards 1.0930 and 1.0890 (Fibonacci Expansion 161.8%) where recent signs of bullish recovery is being demonstrated Moreover, the EUR/USD is demonstrating a long-term Head & Shoulders continuation pattern extending between (1.0930 - 1.1080) with neckline located around 1.0940. As long as bearish persistence below 1.0940 (Neckline) is maintained, Pattern projection target would remain projected towards 1.0840. Trade recommendations : Conservative traders should look for a valid SELL entry anywhere around the price zone of 1.0940-1.0960 (upper limit of the depicted movement channel). Initial Target levels should be located at 1.0900, 1.0850 and 1.0840. The material has been provided by InstaForex Company - www.instaforex.com |
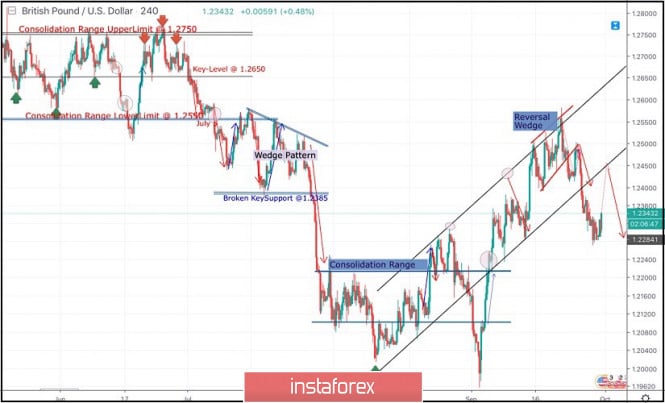
| September 30, 2019 : GBP/USD Intraday technical analysis and trade recommendations. Posted: 30 Sep 2019 07:59 AM PDT
In Early August, another consolidation-range was temporarily established between the price levels of (1.2100 - 1.2220) except on August 9 when temporary bearish decline below 1.2100 was executed towards 1.2025 (Previous Weekly-Bottom). Since then, the GBP/USD pair has been trending-up within the depicted bullish channel except on September 3 when a temporary bearish breakout was demonstrated towards 1.1960. Around the price level of 1.1960, aggressive signs of bullish recovery (Bullish Engulfing candlesticks) brought the GBPUSD back above 1.2230 where the pair looked overbought. However, further bullish momentum was demonstrated towards 1.2320 maintaining the bullish movement inside the depicted movement channel. Moreover, Temporary bullish advancement was demonstrated towards 1.2550 where a reversal wedge pattern was established. As anticipated, the reversal wedge pattern was confirmed by the end of the previous Monday's consolidations supported by obvious bearish price action demonstrating a successful bearish closure below 1.2450. On Tuesday, the backside of the confirmed reversal wedge was successfully re-tested around 1.2500 where a new episode of bearish rejection was expressed. The Long-term outlook remains bearish as long as the most recent top established around 1.2500 remains defended by the GBP/USD bears. Bearish persistence below 1.2440-1.2400 (Reversal-Pattern Neckline) allowed more bearish decline to occur towards the price levels of 1.2300 where early signs of bullish rejection was demonstrated by the end of last week's consolidations. Trade Recommendations: Conservative traders can wait for bullish pullback towards the backside of the broken channel (Anywhere around 1.2400-1.2450) for another valid SELL entry. T/P level to be placed around 1.2360, 1.2330 and 1.2280 while S/L should be set as a H4 candlestick closure above 1.2450. The material has been provided by InstaForex Company - www.instaforex.com |
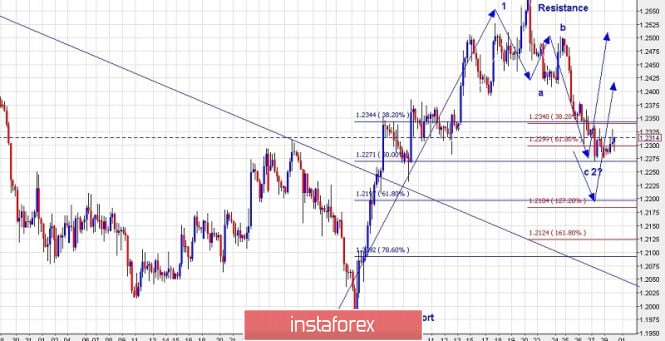
| Trading plan for GBP/USD for September 30, 2019 Posted: 30 Sep 2019 06:54 AM PDT
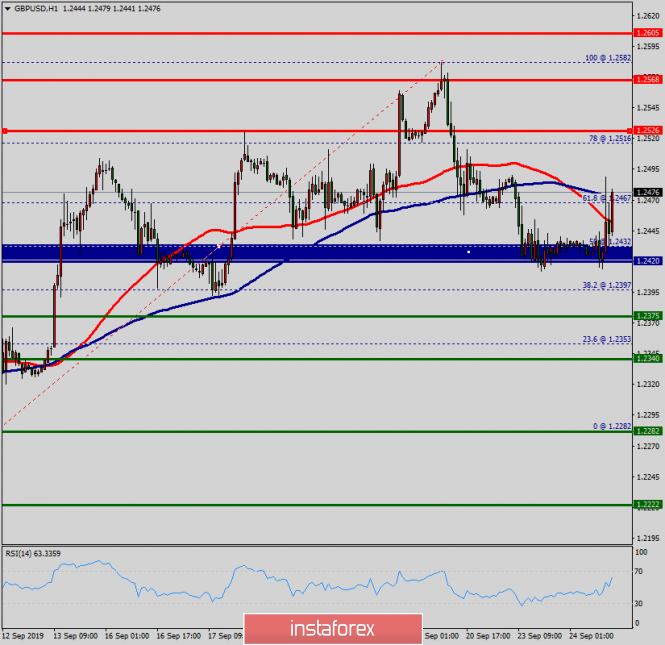
Technical outlook: The GBP/USD pair might have formed a meaningful bottom around 1.1950 levels earlier, or may print yet another low (the less likely scenario). The subsequent rally towards 1.2575 levels was an impulse labelled as 1 which has been followed by a 3-wave corrective drop a-b-c as seen above. Furthermore, the pair is seen to have retraced 50% of its previous rally as high as 1.2275. A push towards 1.2375 levels from here would confirm that wave 2 is in place and that GBP/USD is into its 3rd wave higher. So, please bear in mind that another low towards 1.2100/10 levels remains possible and it would be an ideal price to re-enter buying. Resistance is seen at 1.2500 while interim support comes in at the fibonacci 0.618 at 1.2100 respectively. Trading plan: Long 50% capacity now and remaining at 1.2100, stop below 1.1950, a target is open. Good luck! The material has been provided by InstaForex Company - www.instaforex.com |
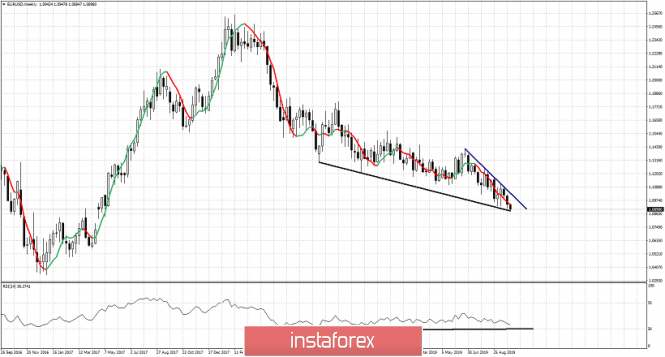
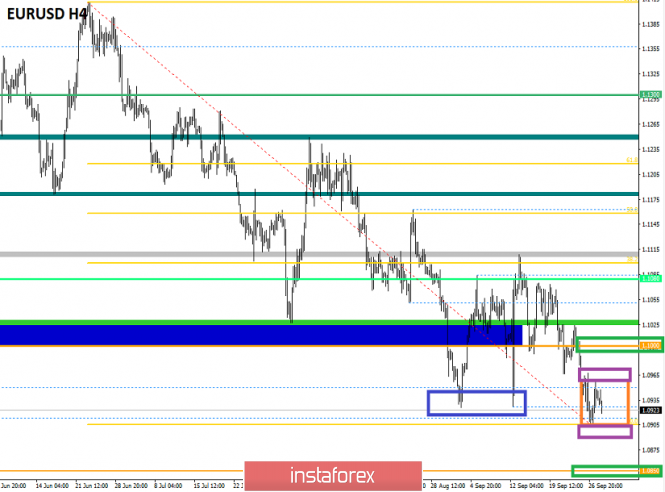
| EURUSD approaching major wedge support Posted: 30 Sep 2019 06:26 AM PDT EURUSD has started the week with new 2019 lows continuing its down trend. Price is now approaching the lower boundary of a downward sloping wedge pattern and bears should be very cautious as a bounce towards 1.10 is very possible.
Dark blue line - weekly resistance Weekly resistance is found at 1.1030. As long as price is below that level trend will remain bearish. In the short-term however price is making new lows but the RSI is not following. The 1.09-1.0880 area is important support and there are many chances for a bounce. 1.0980-1.10 is medium-term resistance and bounce target area. Bears should lower their stops to protect gains. Short-term resistance is found at 1.0920 and at 1,0950. Breaking above this level will push prices towards the medium-term resistance area. The material has been provided by InstaForex Company - www.instaforex.com |
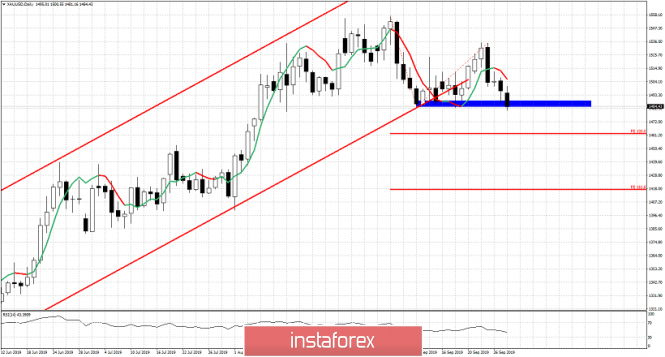
| Gold starts the week with new lows eyeing $1,460 Posted: 30 Sep 2019 06:21 AM PDT Gold price is challenging September lows after breaking below $1,500. Gold price has potential for at least a move towards $1,460 where we find equality in the current move lower relative to the first decline we saw in late August.
Red lines - bullish channel Blue rectangle - support Gold price has broken out of the bullish channel. In our weekly analysis we noted that Gold is expected to make a pull back lower towards $1,450-$1,400 at least. Gold is now challenging important horizontal support after exiting the bullish channel. First downside target is at $1,460 and next at $1,420. Short-term trend is bearish as long as price is below $1,536. A break above $1,536 will push price towards $1,600 and higher. But for now we focus on the bearish side as we see a potential for more downside. The material has been provided by InstaForex Company - www.instaforex.com |
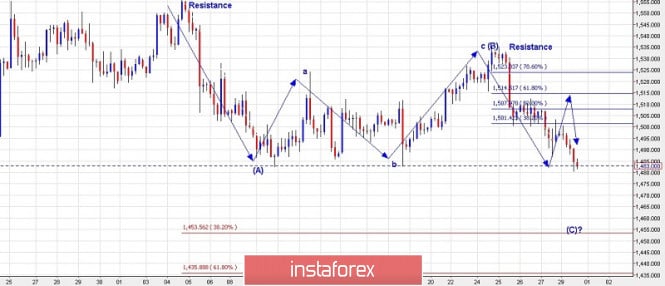
| Trading plan for Gold for September 30, 2019 Posted: 30 Sep 2019 06:16 AM PDT
Technical Outlook: Gold might be heading lower towards $1450 and below provided prices stay below $1523 and $1535 levels. A corrective drop might be unfolding (A)-(B)-(C) from $1557/58 levels before the rally could resume any further. Immediate price resistance is at $1523 followed by $1557/58 levels and if the above structure remains in effect, the metal should stay below those levels. For those traders who are already short, the risk can be reduced to $1523 levels, while those who are wanting to enter fresh positions could wait for a pullback towards at least $1514/15 levels which is also the Fibonacci resistance of the drop between $1535 through $1580 levels respectively. Moreover, a push above $1523 would confirm that the corrective drop might be over and that prices are expected to head north. In either case, selling on rallies remains a favored strategy for now. Trading plan: Remain flat for now. Look to sell again around $1515 levels, stop above $1535, target is $1450 Good luck! The material has been provided by InstaForex Company - www.instaforex.com |
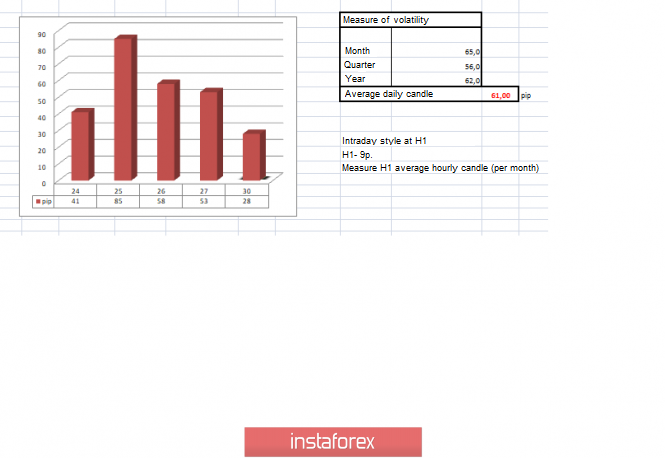
| Trading recommendations for the EUR/USD currency pair on September 30: Placement of trade orders Posted: 30 Sep 2019 06:03 AM PDT By the end of the last trading week, the Euro/Dollar currency pair showed volatility slightly below the average daily point of 53 points, as a result of which a pullback was formed. From the point of view of technical analysis, we see an interesting picture, and so, the ill-fated support in the form of a value of 1.0926 was locally broken but the inertial stroke at that moment subsided. This results in overheating of short positions and in fact, a rollback. I think it's too early to talk about 100% breakdown since the support of 1.0926 has transformed over time into a range level with approximate boundaries of 1.0900/1.0950. As discussed in the previous review, speculators assumed the development of the plot in terms of rollback/stagnation, where the interaction points were just around the boundaries of the level of 1.0900/1.0950, but clear price fixations did not happen. Thus, entering the market was not made. Considering the trading chart in general terms [the daily period], everything is much more interesting here. The global downtrend is on the verge of further development, where almost a month-long mixed stop played only for the benefit of the bears, who managed to strengthen their positions. In the case of coincidence of expectations, sellers can get new locations around the beginning of 2017. Last Friday's news background contained data on orders for durable goods in the United States, where they were expected to decline by 1.1%, but as a result, it increased by 0.2%. In the case of the EURUSD pair, the statistics for the States did not affect the trading chart in any way. In terms of informational background, we have statements by the chief economist of the European Central Bank, Philip Lane, regarding deposit rates. "We saw lower negative rates in other regions, so I personally do not think that there is already a technical limit," said Philip Lane And on Monday [September 30], the Financial Times published an interview with Mario Draghi, where the head of the regulator made it clear that the ECB was ready for anything. "All instruments, from interest rates to asset purchases to forecast rates, are ready to calibrate," said Mario Draghi. Returning to everyone's favorite Brexit divorce proceedings, we see Berlin's long-awaited response regarding a possible delay. So, the German government, unlike France, demonstrates its readiness to grant a deferment of Britain, of course, that is if England submits an appropriate request for an extension. However, German Foreign Minister Heiko Maas emphasized that an extension of the postponement period is only possible if there is a really good reason, such as a new election or a second referendum in the UK. Today, in terms of the economic calendar, we have seen data from Europe on unemployment, where we expected a 7.5% rate to be maintained. But as a result, we have seen a slight yet still a decrease to 7.4%. The euro's response to statistics was virtually non-existent as the euro losing value in the minute it was published. At 12:00 UTC, preliminary data on inflation in Germany should be released, where they expect a decrease from 1.4% to 1.3% that may put pressure on the single currency again. Further development Analyzing the current trading chart, we see an attempt to return quotes to the limit of the pivot point of last Friday, that is, to the area of 1.0900. The oscillation that we are observing is very similar to the common pattern of "Breakout-Rollback", where they are waiting for some gain in the direction of the main move. At the same time, the theory of the existing range level of 1.0900/1.0950 is still confidently held in the minds of traders. In turn, speculators are closely monitoring the behavior of quotes relative to existing boundaries at 1.0900/1.0950 since breakdown will bring a new round of fluctuations. It is likely to that the amplitude fluctuation of 1.0900/1.0950 will persist for some time, where you can closely monitor fixing points outside the previously established boundaries. In case that the expectations of traders and breakdown coincide as the fact of the lower border, we are waiting for the further formation of the initial trend towards the subsequent level of 1.0850 (1.0800). Based on the above information, we derive trading recommendations: - We consider the buy positions in terms of rebound and fixing of the price higher than 1.0950 with the prospect of a move towards the level of 1.1000. - Sell positions are considered in terms of restoring the initial trend and fixing the price lower than 1.0900. In this case, the target is in the region of 1.0850-1.0800. As we can see, the recommendations remain in the same plan, we closely monitor the borders as holding quotes in this area is expected to be short-lived. Indicator analysis Analyzing a different sector of timeframes (TF), we see that the indicators on all major time sections unanimously signal a further downward trend. It is worth taking into account that if amplitude fluctuations within the previously designated boundaries, indicators at minute intervals can become variable. Volatility per week / Measurement of volatility: Month; Quarter; Year Measurement of volatility reflects the average daily fluctuation, calculated for the Month / Quarter / Year. (September 30 was built taking into account the time of publication of the article) The current time volatility is 28 points, which is a low indicator for this timeframe. It is likely that in the event of a breakdown of one or another border [1.0900/1.0950] of the range level, volatility can significantly increase. Key levels Resistance zones: 1.0926 ** 1.1000 ***; 1,1100 **; 1,1180 *; 1.1300 **; 1.1450; 1.1550; 1.1650 *; 1.1720 **; 1.1850 **; 1,2100 Support areas: 1.0926 **; 1.0850 **; 1,0500 ***; 1.0350 **; 1,0000 ***. * Periodic level ** Range Level *** Psychological level **** The article is built on the principle of conducting a transaction, with daily adjustment The material has been provided by InstaForex Company - www.instaforex.com |
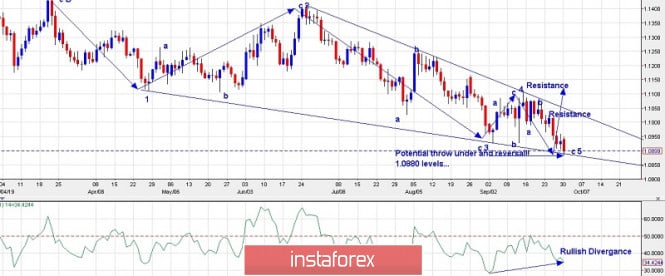
| Trading plan for EUR/USD for September 30, 2019 Posted: 30 Sep 2019 05:55 AM PDT
Technical outlook: The EUR/USD pair is nearing to a major low formation either today or tomorrow. A number of factors are signaling a potential bullish reversal from close to 1.0880 levels. The single currency pair has tested 1.0882 today and is now trading at 1.0898 at this point in writing. The ending diagonal structure is into its 5th wave and a test has been made of the diagonal trend line connecting waves 1 and 3. Furthermore, a bullish divergence on the daily RSI is also calling for a swift reversal ahead. Ideally, a rally breaking past 1.1110 should be on cards now. Trading point of view, an aggressive long position could be taken against 1.0800/20 levels. A break above immediate resistance at 1.0967 levels also confirms that a meaning low could be in place at 1.0882. Trading plan: Long against 1.0800/20, target is open. Good luck! The material has been provided by InstaForex Company - www.instaforex.com |
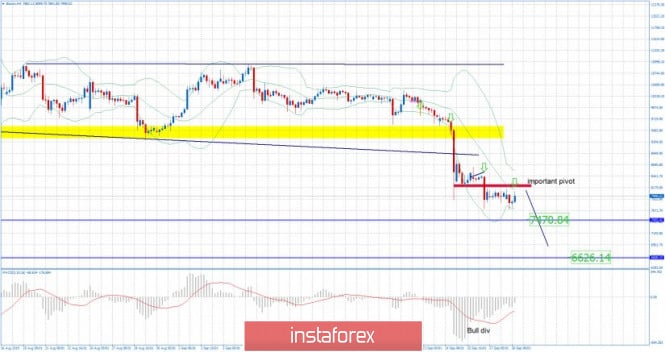
| BTC 09.30.2019 - Possible rally before new down leg Posted: 30 Sep 2019 05:44 AM PDT BTC has been trading in consolidation mode at the price of $8,000. BTC is still trading inside of the downward channel but with the bullish divergence on the MACD. Anyway, as long as the pivot resistance at $8,225 is holding, there is chance for more downside.
Blue horizontal lines – Support levels based on the price action Red rectangle – Major resistance level MACD oscillator is showing bullish divergence but caution must be alerted due to break out of the larger consolidation. The middle Bollinger band line is acting like resistance at $8,140. Potential rally is possible due to bull divergence but I would still prefer downside opportunities on the rallies due to strong downside condition. Downward targets are set at the price of $7,470 and $6,620. The material has been provided by InstaForex Company - www.instaforex.com |
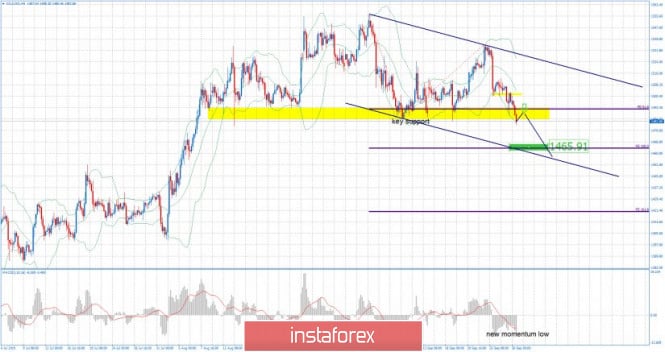
| Gold 09.30.2019 - Downside breakout of the key suupport Posted: 30 Sep 2019 05:33 AM PDT Gold has been trading downwards. Important support at the price of $1,483 is broken to the downside and I do expect more downside to come. Next good support and downward objective is set at $1,465.
Yellow rectangle – Support which became resistance Green rectangle – Support and objective Falling purple line – Expected path MACD oscillator is showing new momentum low, which is good indication for the further downside. I placed Fibonacci expansion to find potential downward target and I got FE 100% at $1,465. Watch for potential selling opportunities on the rallies on 5/15 to time your entries better. The material has been provided by InstaForex Company - www.instaforex.com |
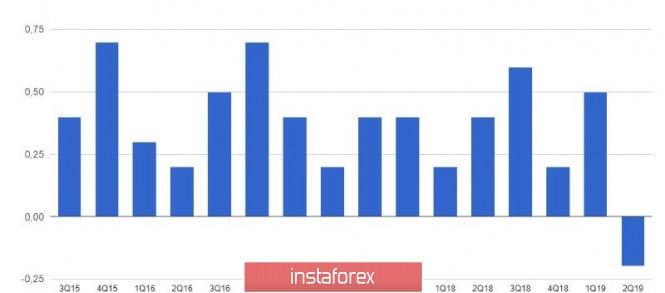
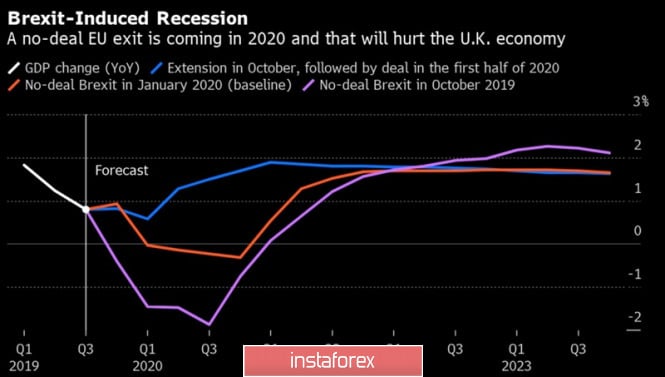
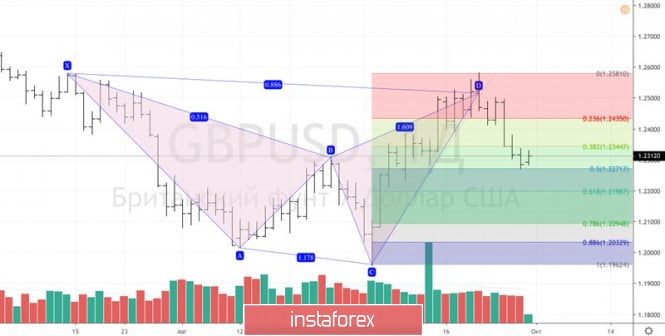
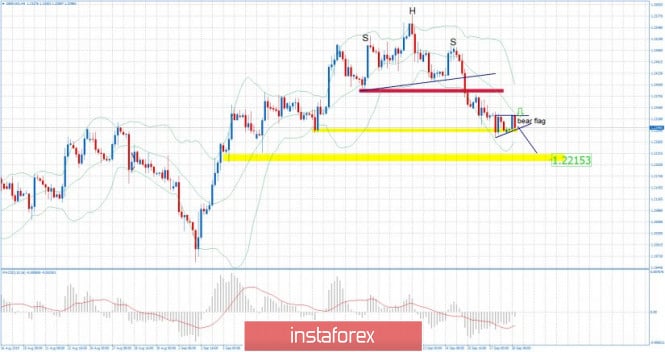
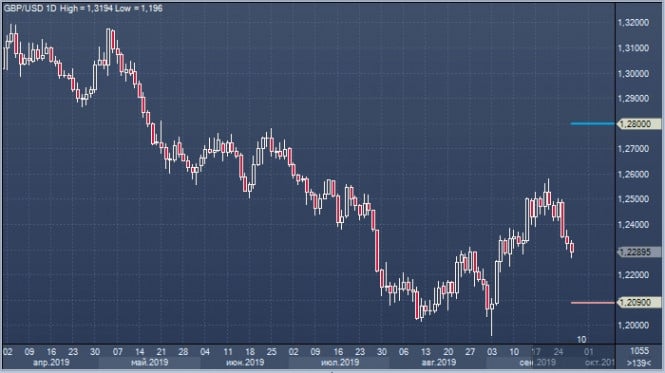
| Pound did not wait for resignation Posted: 30 Sep 2019 05:28 AM PDT This has the worst week for the British pound since early August after investors began to close long positions on GBP/USD pair because of the Supreme court verdict on the excess of Boris Johnson's powers and the "dovish" comments of the former "hawk" of the BoE monetary policy Committee. Michael Saunders said that even if London and Brussels agree on the terms of the Brexit deal, this does not preclude the possibility of lowering the repo rate. The uncertainty existing in the market for a long time leads to a slowdown in GDP and inflation that can force the regulator to intervene. Given the Prime Minister's illegality in dissolving the parliament, the general euphoria of the "bulls" has been replaced by disappointment. Johnson did not resign and still insists that Britain leave the EU without a deal after October 31. This statement goes against the legislators' demand for a letter to Brussels asking for a prolongation of the transition period. According to Betfair Exchange, the chances of the resignation of an ardent supporter of Brexit from the post of head of the Cabinet of Ministers decreased from 11/4 to 2/1, which became a catalyst for the GBP/USD pullback. As long as there are risks on Britain's exit from the EU without a divorce, the bulls must be extremely careful. According to Bloomberg Economics, if Misty Albion follows the path of parliamentary elections and is won by conservatives, the government will receive a mandate for a tough Brexit. In turn, this will lead to a recession. UK GDP Forecasts Pressure on the pound creates the rhetoric of representatives of the Bank of England. If yesterday's "hawks" start talking about a rate cut, what do the rest of the MPC members think? Releases of data on business activity, a leading indicator for GDP, can add fuel to the fire. Sluggish economic growth and a slowdown in inflation are strong arguments for a loosening of monetary policy and the exchange rate. Enough that BoE looks like a black sheep when most of the world's leading Central banks are set on monetary expansion. There is one more event that may be even more significant for sterling than statistics from purchasing managers. This is a conference of the Conservative Party in Manchester, where Johnson must confirm his authority as a leader. To do this after numerous defeats will not be easy. Most likely, one will have to resort to aggressive rhetoric, as a result of which the chances of reaching an agreement with the EU will fall even more. Betfair Exchange rates them as 5/1. At the beginning of the last decade of September, it was about 7/2. On the contrary, the Prime Minister's lack of previous support within the Tories can play into the hands of the pound. With a split within the party, it is not a fact that it will win early elections, which will reduce the likelihood of a disorderly Brexit. Technically, there is a transformation of the Shark pattern in 5-0 on the daily GBP/USD chart. Pullbacks to 38.2% and 50% of the CD wave are usually used to form long positions. In the case of the pound, you can consider buying when the quotes return to the level of 1.2435. GBP / USD daily chart |
| GBP/USD 09.30.2019 - Pennant pattern for more downside Posted: 30 Sep 2019 05:24 AM PDT GBP has been trading sideways at the price of 1.2300. I expect more downside yet to come cause it seems that the consolidation that GBP is facing now is only the consolidation before the new down continuation.
Yellow rectangle – Support and downward objective Purple lines – Pennant pattern Falling purple line – Expected path MACD oscillator did show bullish divergence last week but seems that the maximum that buyers could do is to rest the 20SMA on 4H time-frame. Watch for potential breakout of the pennant pattern for the more downside. Resistance level is found at 1.2330 and important support at 1.2215. The material has been provided by InstaForex Company - www.instaforex.com |
| Posted: 30 Sep 2019 05:06 AM PDT When the trade war between the United States and the Middle Kingdom was just beginning, there was an opinion that the head of the White House, Donald Trump, was a supporter of free trade. Say, he raises tariffs only so that his competitors cut them and then he does it himself. But, as time has shown, things have turned out differently. At the end of September, rumors about Chinese companies' delistings on US exchanges are circulating. g on the market. Although the US Treasury has already stated that it has not yet considered such measures, however, as you know, there is no smoke without fire. Given that Beijing is not afraid of duties, Washington could transfer "hostilities" to financial markets. While the United States is looking for ways to bite its rival more painfully, its economy is showing signs of cooling. In August, the index of expenditures on personal consumption grew at the slowest pace since January. In annual terms, the indicator increased by 1.44% and is still far from the 2% target of the Federal Reserve. Inflation is not accelerating even against the backdrop of the most rapid increase in average wages in June-August over the past ten years. Last month, consumer spending growth slowed from 0.5% in July to 0.1%. Therefore, the Capital Economics research company lowered its forecast for the US GDP for the third quarter from 2 to 1.5%. Obviously, the US economy slows down under the influence of headwinds, which forces the Fed to soften monetary policy for preventive purposes. A decrease in GDP growth rates and the expectation of monetary expansion are "bearish" factors for any currency, but the greenback is in no hurry to get cheaper. The revaluation of the dollar is primarily due to the weakness of its main competitors because the European and Chinese economies look much worse than the American one. The main question is who will be able to cope with difficulties faster. Obviously, monetary policy alone is clearly not enough. According to the president of the Federal Reserve Bank of Philadelphia, Patrick Harker, the American Central Bank can create conditions for economic growth, but the trends in this growth are determined by fiscal policy. After the tax reform, the United States seems to have exhausted its capabilities in this direction, but Germany has more than enough of them. However, it is not yet clear whether Berlin will want to respond to the calls of the ECB head Mario Draghi. The US economy is just beginning to react to the negative consequences of the trade wars, while the West and Germany are likely to have hit the bottom. In September, for example, business activity in China's manufacturing sector grew at its best since February 2018. Reports on purchasing managers' indexes from ISM and the American labor market are due to be released this week, which will give a hint about the sensitivity of the United States to headwinds. In the case of the release of weak data, conversations about the resuscitation of QE from the Fed may intensify. According to Bloomberg experts, the US Central Bank must buy government bonds for $ 200-500 billion in order to stabilize the money market. Thus, despite the generally unsuccessful third quarter, the EUR/USD bulls do not intend to give up and are in no hurry to throw a white flag. Their main task now is to cling to the support of 1.0925-1.093. The material has been provided by InstaForex Company - www.instaforex.com |
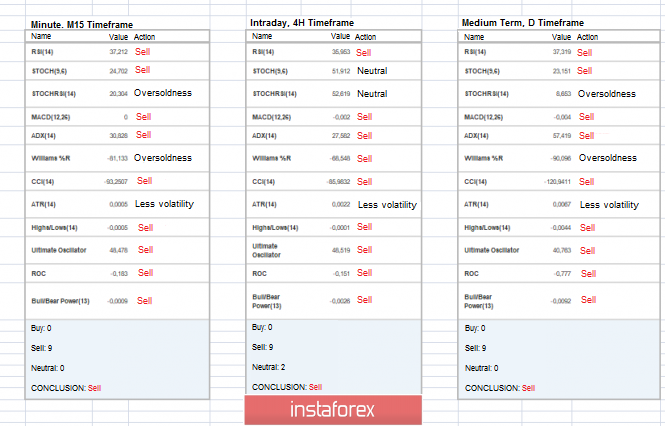
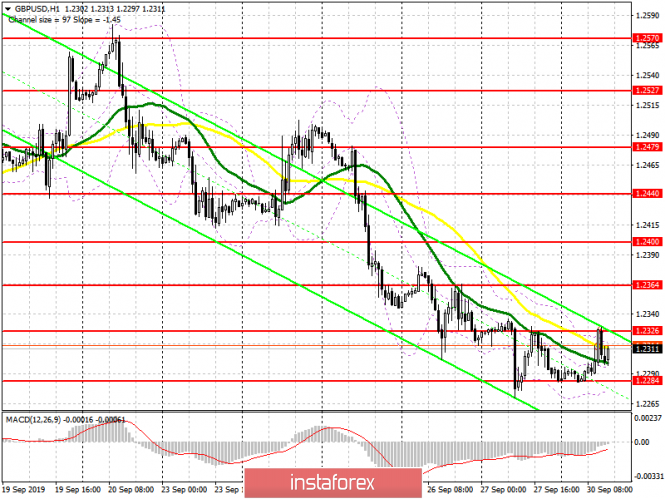
| Posted: 30 Sep 2019 04:57 AM PDT To open long positions on GBP/USD, you need: The decline in GDP, the decline in net loans and the growth of the negative balance – the result of the first half for the British pound, which ignored all these data, which may indicate the beginning of an upward correction, as there are no people willing to sell GBP/USD at the current lows. Technically, nothing has changed. Buyers of the pound made an unsuccessful attempt to break through the maximum of 1.2326, however, it was not yet possible to get beyond this range. Either the formation of another false breakdown in the support area of 1.284 or a breakthrough of the resistance at 1.2326, will lead to an upward correction of the pair to the area of a larger maximum of 1.2364, where I recommend taking the profit. If the level of 1.2284 is broken in the second half of the day, which will return to the market of large sellers, then it is best to consider new purchases in GBP/USD after updating the lows around 1.2238 and 1.2165. To open short positions on GBP/USD, you need: The bears managed to defend the level of 1.2323, which I paid attention to in the first half of the day. However, a larger downward correction from it was not formed even after the release of weak fundamental statistics on the state of the UK economy. Only the breakthrough of the minimum of 1.2284 can lead to a further decline in GBP/USD to the area of 1.2238, but the longer-term goal of the bears for the middle of this week will be the support of 1.2165, where I recommend fixing the profits. If the pressure on the pair weakens in the first half of the day, and the bulls take the level of 1.2326, it is best to sell the pound immediately on the rebound only after the test of the maximum of 1.2364, or even higher, from the resistance of 1.2400, as the market may begin a strong upward correction. Signals: Moving averages Trading is conducted in the area of 30 and 50 daily averages, which indicates a possible growth of the market in the short term. Bollinger Bands In the case of a decline in the afternoon, the lower border of the indicator in the area of 1.2270 will act as support. A break of the upper border in the area of 1.2325 will only increase demand for the pound.
Description of indicators
|
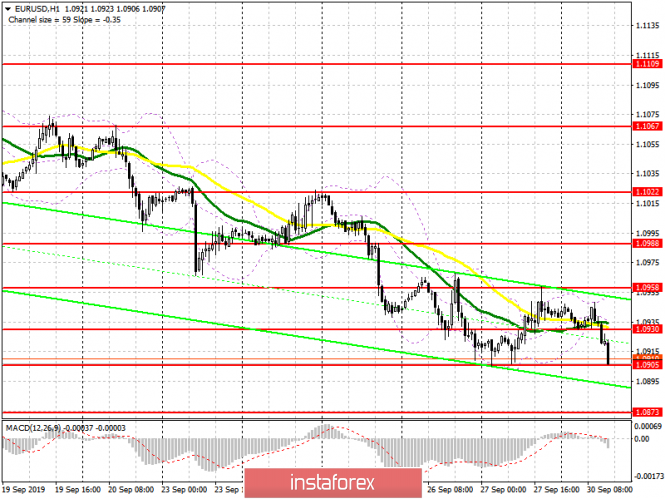
| Posted: 30 Sep 2019 04:57 AM PDT To open long positions on EURUSD, you need: Even despite the data on the decline in the unemployment rate in the eurozone and the reduction in the number of applications for unemployment benefits in Germany, buyers of the euro failed to keep the pair above the intermediate support of 1.0930, the breakdown of which led to a new downward wave. At this point, I paid more attention to my morning forecast. At the moment, the bulls are trying to protect the minimum of the year in the area of 1.0905, which is a good level to buy. In the scenario of a breakdown of this range, it is best to postpone long positions in EUR/USD until the support update in the area of 1.0873 or open long positions immediately to rebound from the low of 1.0840. The buyers' task for the second half of the day will be to return to the resistance of 1.0930 but there will be a lot of envy from the inflation data in Germany, as a similar report on the consumer price index in Italy disappointed traders. With growth above 1.0930, I recommend fixing the profit in the maximum area of 1.0958. To open short positions on EURUSD, you need: The bears coped with the morning task of the breakdown of 1.0930, and the consolidation below this level led to the renewal of the annual minimum in the area of 1.0905. The breakthrough of this level will depend entirely on the inflation data in Germany. A weak report will lead to a new wave of the sale of the euro to the lows of 1.0873 and 1.0840, where I recommend taking the profits. If the bulls manage to hold the support of 1.0905 in the second half of the day, it is best to look at short positions only after a false breakdown of the resistance of 1.0930 or sell EUR/USD immediately to rebound from the maximum of 1.0958. Signals: Moving Averages Trading is below 30 and 50 moving averages, which indicates the continuation of the bearish trend. Bollinger Bands The upper limit of the indicator near 1.0950 acts as a resistance, from where you can open short positions immediately on the rebound.
Description of indicators
|
| Technical analysis of GBP/USD for September 30, 2019 Posted: 30 Sep 2019 03:49 AM PDT The GBP/USD pair continues to move downwards from the level of 1.2329. Last week, the pair dropped from the level of 1.2329 to the bottom around 1.2270. But the pair has rebounded from the bottom of 1.2270 to close at 1.2306. Today, the first support level is seen at 1.2270, the price is moving in a bullish channel now. There is a possibility that the GBP/USD pair will move upside and the structure of a raise does not look corrective. The trend is still above the 100 EMA for that the bullish outlook remains the same as long as the 100 EMA is headed to the downside. The RSI (Relative Strength Index) is becoming to signal an upward trend. The RSI readings around 30 indicate that the pair is oversold. So, the areas that are potentially oversold at the 1.2270 price. It is possible that the pair will move upwards continuing the development of the bullish trend to the level 1.2329 in order to test the daily resistance 1. Amid the previous events, the price is still moving between the levels of 1.2270 and 1.2329. If the NZD/USD pair succeed to break through the resistance level of 1.2329, the market will rise further to 1.2344 as as the second target. However, stop-loss is to be placed below the price of 1.2270. The material has been provided by InstaForex Company - www.instaforex.com |
| Pound: October is favorable for growth and purchase Posted: 30 Sep 2019 03:13 AM PDT According to an analyst at the reputable Citigroup bank, the continuation of the golden Autumn may turn out to be the same golden time for the British pound. Experts are sure that the next month will be the most suitable for the purchase of the "British" against the US dollar. Citigroup estimates the potential growth of the GBP/USD pair in October to be very high. Currency strategists of the bank argue that the purchase of sterling against the US currency is the most preferable transaction. The GBP/USD pair completed the previous trading week at 1.2290. Currently, the pair is trading in the range of 1.2303–1.2308 that shows steady growth. Citigroup analysts recommend choosing long positions with the target of 1.2800 and a protective stop order to limit the potential loss at 1.2090. This Monday, September 30, will be the last trading day of this month and the third quarter of 2019. Closing the pair above 1.2310 will put an end to the "bullish" trend that persists for a month. A similar situation was recorded following the results of January of this year, Citigroup reminds. At the current moment, the GBP/USD pair has rebounded down from the level of 1.2320 and trades in the structure of a small wave of decline in the range 1.2313-1.2315. Experts admit the possibility of correction and return to the level of 1.2320. However, a fall to the level of 1.2242 is expected in the forecast. Currently, in the GBP/USD pair, the advantage remains for the greenback. The US currency, as well as the growth of the dollar index, is favored by the unstable dynamics of the pound. The precarious position of the British currency is due to the maximum dollar yield, as well as the problems of the eurozone and the high likelihood of a "hard" Brexit. The next month may bring surprises to the British currency, but Citigroup expects that they will mostly be with a plus sign. |


| You are subscribed to email updates from Forex analysis review. To stop receiving these emails, you may unsubscribe now. | Email delivery powered by Google |
| Google, 1600 Amphitheatre Parkway, Mountain View, CA 94043, United States | |
No comments:
Post a Comment