
Forex analysis review |
- Fractal analysis of the main currency pairs for September 5
- Golden cosmos
- GBPUSD: Speculators manipulate the market and buy the pound even on the verge of recession, which awaits the UK economy in
- EUR/USD. 4 September. Results of the day. Macroeconomic statistics supported the euro
- GBP/USD. 4 September. Results of the day. Scottish Supreme Court upholds Johnson's suspension of Parliament
- EUR/USD. Bulls of the pair counterattack: the Federal Reserve may reduce the rate by 50 points
- September 4, 2019 : EUR/USD Intraday technical analysis and trade recommendations.
- September 4, 2019 : GBP/USD Intraday technical analysis and trade recommendations.
- BTC 09.04.2019 -Major resistnace held successfully
- Confused oil market: optimism faded
- EUR/USD for September 04,2019 - Sell zone on EUR
- Gold 09.04.2019 - First upward target reached and potential for the second target
- EURUSD bounces as expected above 1.10
- Gold challenges resistance
- Technical analysis of AUD/USD for September 04, 2019
- GBP/USD: plan for the American session on September 4. Buyers of the pound reached a large resistance level of 1.2220, ignoring
- EUR/USD: plan for the American session on September 4. Traders are ignoring the weak retail sales data in the eurozone. Buyers
- Trading strategy for Bitcoin on September 4th. Bearish divergence stops the growth of bitcoin
- Trading strategy for EUR/USD and GBP/USD on September 4th. Both pairs went into a correction, with new sales
- Forgotten crosses in profit: AUD/CHF
- Gold pulled a Trump card from the deck
- Dollar interrupted flight
- The dollar decline is only corrective so far (We expect the continuation of a prospective fall of EUR/USD pairs and a local
- Trading recommendations for the EURUSD currency pair - placement of trade orders (September 4)
- Temporary correction (A review of EUR / USD and GBP / USD on 09/04/2019)
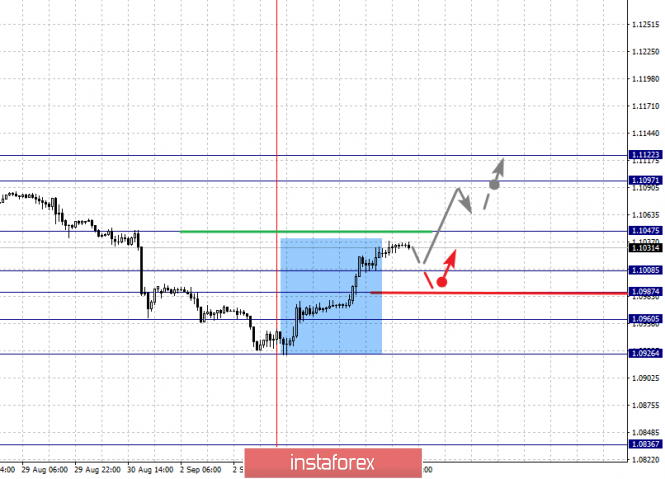
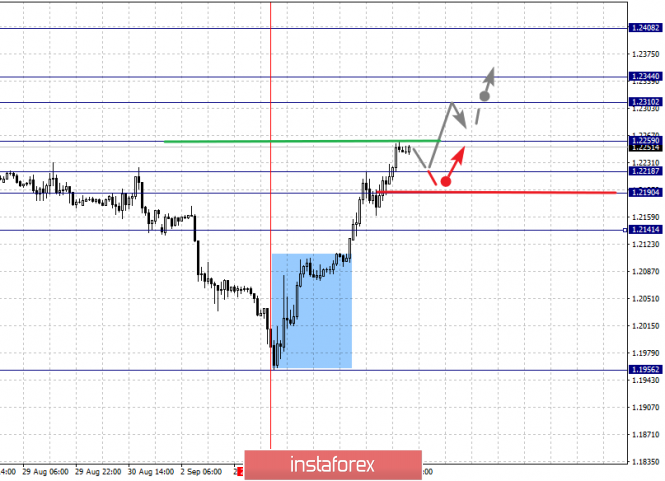
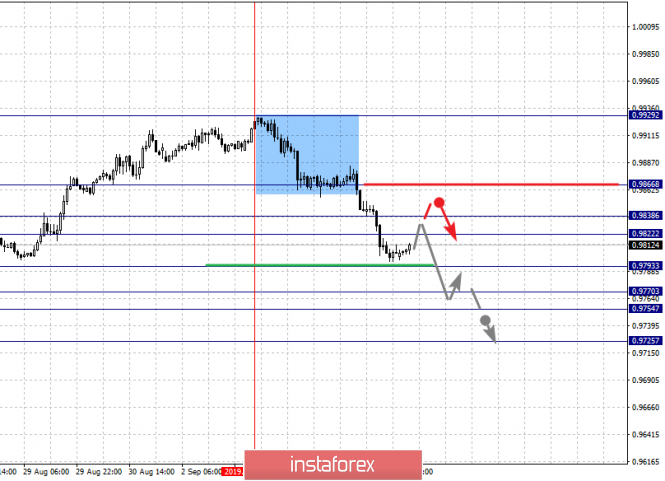
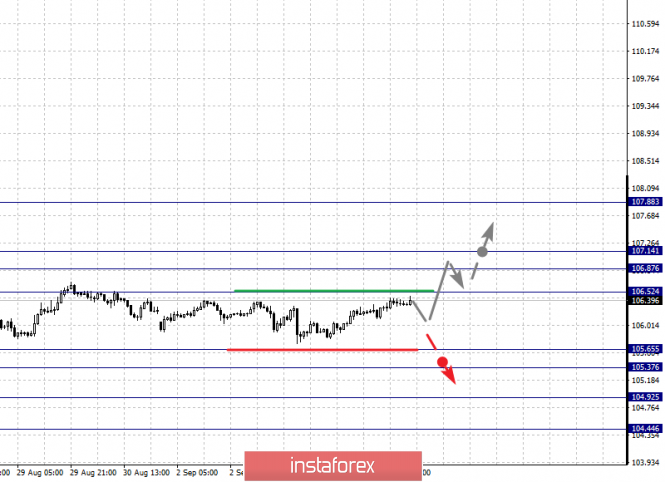
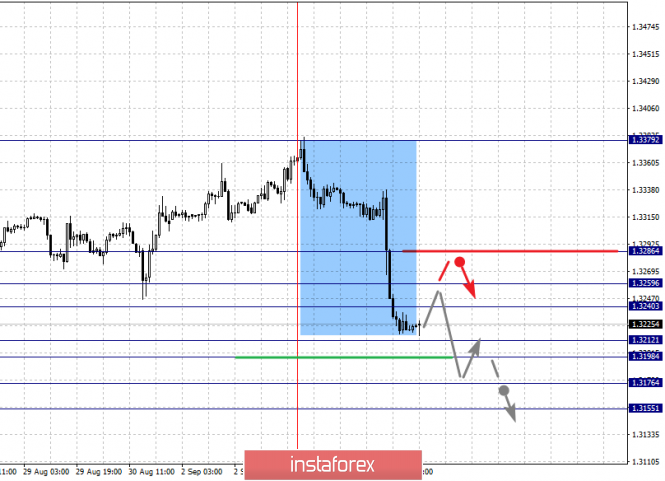
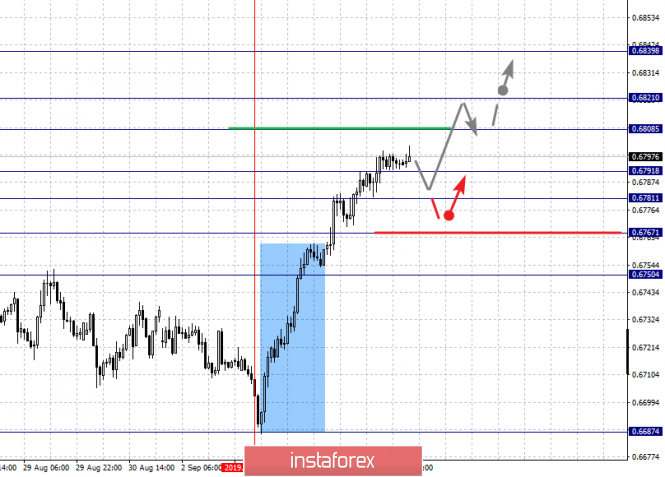
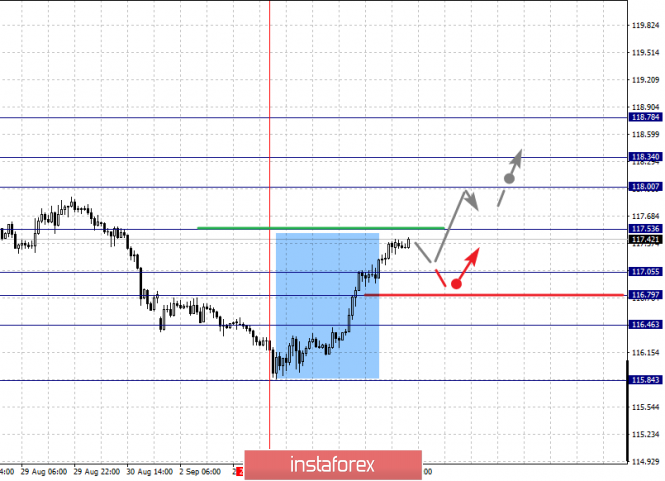
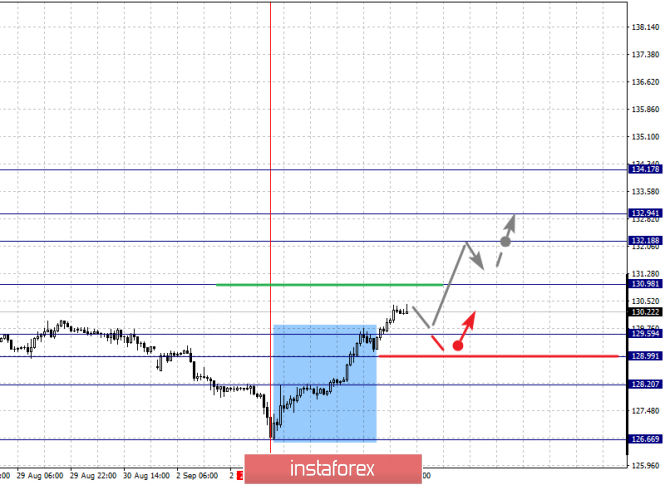
| Fractal analysis of the main currency pairs for September 5 Posted: 04 Sep 2019 06:38 PM PDT Forecast for September 5: Analytical review of currency pairs on the scale of H1: For the euro / dollar pair, the key levels on the H1 scale are: 1.1122, 1.1097, 1.1047, 1.1008, 1.0987, 1.0960 and 1.0926. Here, we follow the development of the ascending structure of September 3. The continuation of the movement to the top is expected after the breakdown of the level of 1.1047. In this case, the target is 1.1097. For the potential value for the upward trend, we consider the level of 1.1122. Upon reaching which, we expect consolidation, as well as a pullback to the bottom. We expect consolidated movement in the range of 1.1008 - 1.0987. The breakdown of the last value will lead to an in-depth correction. Here, the target is 1.0960. This level is a key support for the upward structure. Its passage at the price will lead to the formation of a local descending structure. In this case, the first target is 1.0926. The main trend is the formation of the upward potential of September 3. Trading recommendations: Buy: 1.1047 Take profit: 1.1095 Buy 1.1098 Take profit: 1.1120 Sell: 1.1008 Take profit: 1.0988 Sell: 1.0985 Take profit: 1.0960 For the pound / dollar pair, the key levels on the H1 scale are: 1.2408, 1.2344, 1.2310, 1.2259, 1.2218, 1.2190 and 1.2141. Here, we follow the development of the upward cycle of September 3. The continuation of the movement to the top is expected after the breakdown of the level of 1.2259. In this case, the target is 1.2310. Short-term upward movement, as well as consolidation is in the range of 1.2310 - 1.2344. For the potential value for the top, we consider the level of 1.2408. Upon reaching this value, we expect a pullback to the bottom. Short-term downward movement is expected in the range of 1.2218 - 1.2190. The breakdown of the last value will lead to an in-depth correction. Here, the target is 1.2141. This level is a key support for the upward cycle. The main trend is the upward cycle of September 3. Trading recommendations: Buy: 1.2260 Take profit: 1.2310 Buy: 1.2312 Take profit: 1.2344 Sell: 1.2218 Take profit: 1.2191 Sell: 1.2188 Take profit: 1.2142 For the dollar / franc pair, the key levels on the H1 scale are: 0.9866, 0.9838, 0.9822, 0.9793, 0.9770, 0.9754 and 0.9725. Here, we follow the development of the descending structure of September 3. The continuation of the movement to the bottom is expected after the breakdown of the level of 0.9793. In this case, the target is 0.9770. Price consolidation is in the range of 0.9770 - 0.9754. For the potential value for the bottom, we consider the level of 0.9725. The movement to which is expected after the breakdown of the level of 0.9754. Short-term upward movement is possibly in the range of 0.9822 - 0.9838. The breakdown of the latter value will lead to in-depth movement. Here, the target is 0.9866. This level is a key support for the bottom. The main trend is the descending structure of September 3. Trading recommendations: Buy : 0.9822 Take profit: 0.9836 Buy : 0.9839 Take profit: 0.9864 Sell: 0.9793 Take profit: 0.9770 Sell: 0.9754 Take profit: 0.9727 For the dollar / yen pair, the key levels on the scale are : 107.88, 107.14, 106.87, 106.52, 105.65, 105.37, 104.92 and 104.44. Here, the situation is in equilibrium. The continuation of the movement to the top is expected after the breakdown of the level of 106.52. In this case, the target is 106.87, where consolidation is near this level. The passage at the price of the noise range 106.87 - 107.14 should be accompanied by a pronounced upward movement. Here, the potential target is 107.88. Consolidation is near this level. Short-term downward movement is possibly in the range of 105.65 - 105.37. The breakdown of the latter value will lead to the development of a downward structure. In this case, the first goal is 104.92. For the potential value for the bottom, we consider the level of 104.44. Consolidation is near this level. The main trend: the equilibrium state. Trading recommendations: Buy: 106.52 Take profit: 106.85 Buy : 107.15 Take profit: 107.88 Sell: 105.35 Take profit: 104.94 Sell: 104.90 Take profit: 104.46 For the Canadian dollar / US dollar pair, the key levels on the H1 scale are: 1.3286, 1.3259, 1.3240, 1.3212, 1.3176 and 1.3155. Here, the price forms a pronounced medium-term downward structure from September 3. The continuation of the movement to the bottom is expected after the price passes the noise range 1.3212 - 1.3198. In this case, the target is 1.3176. For the potential value for the bottom, we consider the level of 1.3155. Before this value, we expect a pronounced structure of the initial conditions. Short-term upward movement is possibly in the range of 1.3240 - 1.3259. The breakdown of the last value will lead to a long correction. Here, the target is 1.3286. This level is a key support for the upward structure. The main trend is the formation of a medium-term downward structure from September 3. Trading recommendations: Buy: 1.3240 Take profit: 1.3257 Buy : 1.3261 Take profit: 1.3286 Sell: 1.3198 Take profit: 1.3176 Sell: 1.3174 Take profit: 1.3155 For the Australian dollar / US dollar pair, the key levels on the H1 scale are : 0.6839, 0.6821, 0.6808, 0.6791, 0.6781, 0.6767 and 0.6750. Here, we follow the development of the ascending structure of September 3. Short-term upward movement is expected in the range of 0.6808 - 0.6821. The breakdown of the latter value will allow us to expect movement to a potential target - 0.6839. We expect consolidation, as well as a pullback to the bottom near this level. Short-term downward movement is possibly in the range of 0.6791 - 0.6781. The breakdown of the last value will lead to a long correction. Here, the potential target is 0.6767. This level is a key support for the top. The main trend is the upward structure of September 3. Trading recommendations: Buy: 0.6808 Take profit: 0.6820 Buy: 0.6823 Take profit: 0.6839 Sell : 0.6790 Take profit : 0.6782 Sell: 0.6779 Take profit: 0.6768 For the euro / yen pair, the key levels on the H1 scale are: 118.78, 118.34, 118.00, 117.53, 117.05, 116.79 and 116.46. Here, the price forms the expressed initial conditions for the top of September 3. The continuation of the development of the upward cycle is expected after the breakdown of the level of 117.53. In this case, the goal is 118.00. Short-term upward movement, as well as consolidation is in the range of 118.00 - 118.34. For the potential value for the top, we consider the level of 118.78. Upon reaching which, we expect a pullback to the bottom. Short-term downward movement is expected in the range of 117.05 - 116.79. The breakdown of the latter value will lead to an in-depth correction. Here, the goal is 116.46. This level is a key support for the upward structure. The main trend is the formation of initial conditions for the top of September 3. Trading recommendations: Buy: 117.55 Take profit: 118.00 Buy: 118.02 Take profit: 118.33 Sell: 117.05 Take profit: 116.82 Sell: 116.77 Take profit: 116.48 For the pound / yen pair, the key levels on the H1 scale are : 134.17, 132.94, 132.18, 130.98, 129.59, 128.99 and 128.20. Here, we are following the formation of the initial conditions for the top of September 3. The continued development of the upward trend is expected after the breakdown of the level of 130.98. In this case, the target is 132.18. Short-term upward movement, as well as consolidation is in the range of 132.18 - 132.94. We consider the level of 134.17 to be a potential value for the top; upon reaching this level, we expect a pullback to the bottom. Short-term downward movement is possibly in the range of 129.59 - 128.99. The breakdown of the last value will lead to an in-depth correction. Here, the goal is 128.20. This level is a key support for the upward structure. The main trend is the formation of initial conditions for the top of September 3. Trading recommendations: Buy: 131.00 Take profit: 132.10 Buy: 132.20 Take profit: 132.90 Sell: 129.59 Take profit: 129.00 Sell: 128.90 Take profit: 128.20 The material has been provided by InstaForex Company - www.instaforex.com |
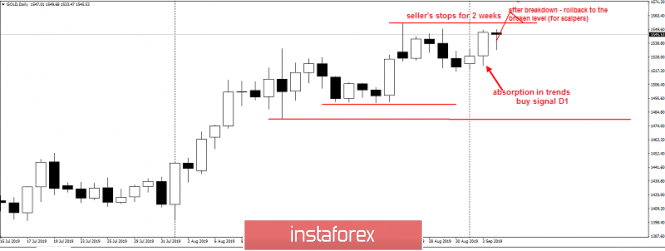
| Posted: 04 Sep 2019 04:37 PM PDT Good evening, dear traders. As promised, here's the evening forecast for gold. Sorry, was not able to publish it in the morning, because it has already started to work. The trade wars drove gold to an incredible $ 1,550 per troy ounce. This is the largest gold trend. for many years! Over the past year, gold has passed a record of 36,000p and continues to storm the high, knocking out the stops of medium-term sellers. And just yesterday, according to perhaps the most effective Price Action trading strategy, a pattern called "daily absorption in the trend" has appeared - which speaks of an ongoing trend and after which it is recommended to buy. Today, to the American session, there was a magnificent rollback, allowing you to go into longs at the best price. On the other hand, sellers who have been selling gold from highs for two weeks now have to hide their risks only for one single extreme - this year's high - quotation 1554. Although, gold has not yet risen above. This is a trap that will be slammed in the near future and trap sellers. I propose to take a closer look from the rollbacks to the longs - with a take on updating 1554 and higher. Often breakdowns of weekly extremes for gold are very volatile - and give a positive slippage, on which you can earn good profit. This is the first part of the plan. The second part is for those traders who are buying in a large amount (scalpers). The idea is very simple and is to work after the breakdown of 1554, which for example to 1560-1570, and then to return to the broken level of 1554. This is an old scalping technique in the overbought market to work on the consolidations of large buyers after the breakdown of key extremes. It is due to this that the price decline to a broken level, which becomes support. Be that as it may, you can earn in both cases. I wish you success in trading and follow the policy of money management! The material has been provided by InstaForex Company - www.instaforex.com |
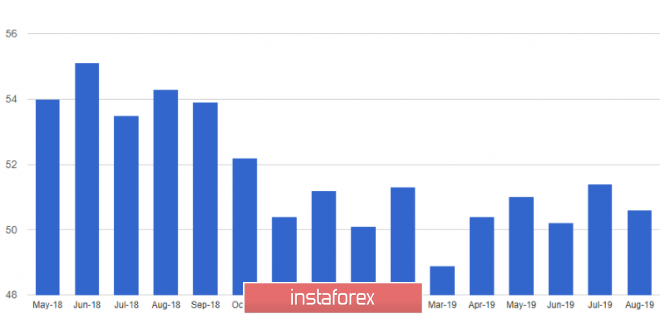
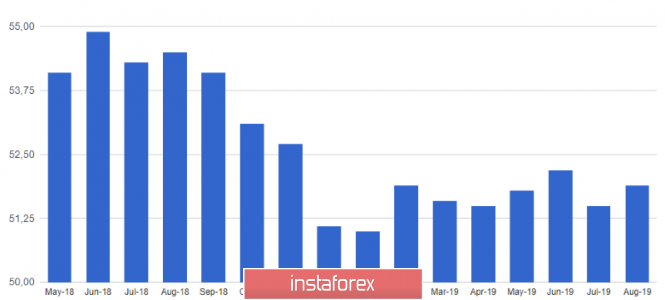
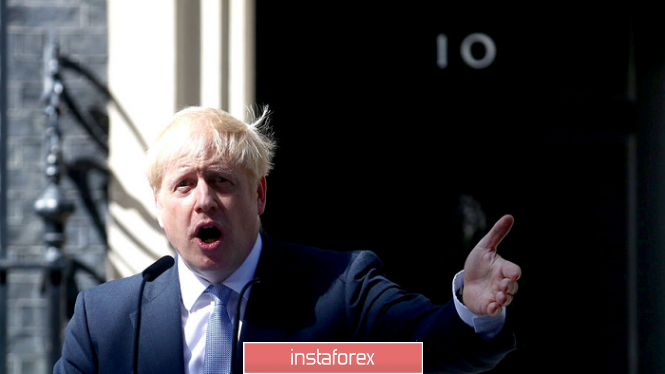
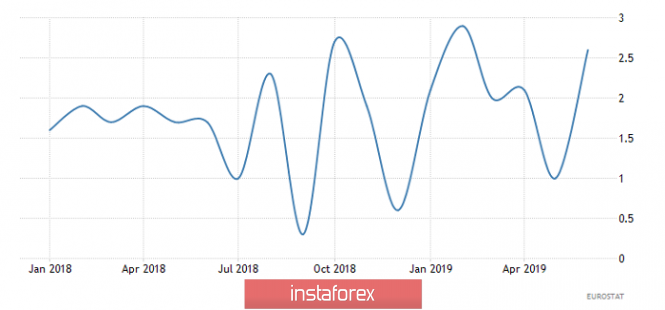
| Posted: 04 Sep 2019 03:35 PM PDT The British pound won back more than 250 points amid expectations that the bill, which does not allow Britain to leave the EU without a deal, will be approved today. Large purchases of the pound are also confirmed by the fact that traders completely ignored the report, which indicates that the UK economy in August 2019 came even closer to the recession. The contraction in economic growth and now even weaker growth in the service sector, which accounts for almost 80% of GDP in the UK, growing uncertainty around Brexit and the reduction in company investments mean a recession for the UK economy in the 3rd quarter of this year. According to IHS Markit, the PMI Procurement Managers Index for the UK services sector fell to 50.6 points in August from 51.4 points in July. Values above 50 indicate an increase in activity, while lower values indicate a decrease in activity. At the beginning of the week, data were released that indicated a decline in activity in the manufacturing sector, as well as in the construction sector. As a result, the UK composite PMI in August dropped to 49.7 points from 50.3 points in July. This suggests that in the 3rd quarter of this year, the UK economy may contract by 0.1%. Today, British Prime Minister Boris Johnson said that if the situation around Brexit leads to early elections, the date of their holding will be October 15. Johnson, meanwhile, once again called for a vote to be rejected in favor of a bill preventing Britain from leaving the EU without reaching an agreement. The bill is aimed at the inadmissibility of the toughest scenario that is likely to await Britain, since neither side is ready to make concessions to each other. Today, the European Commission published a report stating that residents and businesses of the European Union should not expect another Brexit delay and it is best to prepare for the toughest "divorce" of Britain and the EU. Meanwhile, the Treasury secretary of the UK said that everything was ready for the hard Brexit scenario. Next year it is planned to increase the additional costs of 2 billion pounds associated with Brexit. The Treasury will also coordinate its fiscal policy with the Bank of England under a tough scenario. As for the technical picture of the GBPUSD pair, the large support levels in the 1.2220 area have been updated, which limits the upward potential, the preservation of which will directly depend on the voting results. When the resistance breakthrough of 1.2220, the bulls will rush to new highs in the areas of 1.2340 and 1.2430. EURUSD The euro continued its upward correction against the US dollar, even against the backdrop of a weak report on a reduction in retail sales, which could seriously affect the eurozone economy. Most likely, ignoring the report was directly related to the fact that it completely coincided with the forecasts of economists. According to data, retail sales in the eurozone in July fell immediately by 0.6% compared with June and increased by 2.2% compared to the same period in 2018. June data was revised to + 1.2% m/m and + 2.8% y/y, respectively. The index of PMI procurement managers for the eurozone services sector rose slightly in August and amounted to 53.5 points compared to 53.2 points in July. Economists had expected growth to 53.4 points. Given the manufacturing PMI, the eurozone compound PMI also rose to 51.9 points in August against 51.5 points in July. As for the technical picture of the EURUSD pair, the further growth of risky assets will depend on whether the bulls manage to stay above the level of 1.1000 or not. If the trading instrument returns for this support, it is best to wait for a downward correction to lows of 1.0980 and 1.0950 and open long positions from there. The key target of the bulls today will be a high of 1.1050. The material has been provided by InstaForex Company - www.instaforex.com |
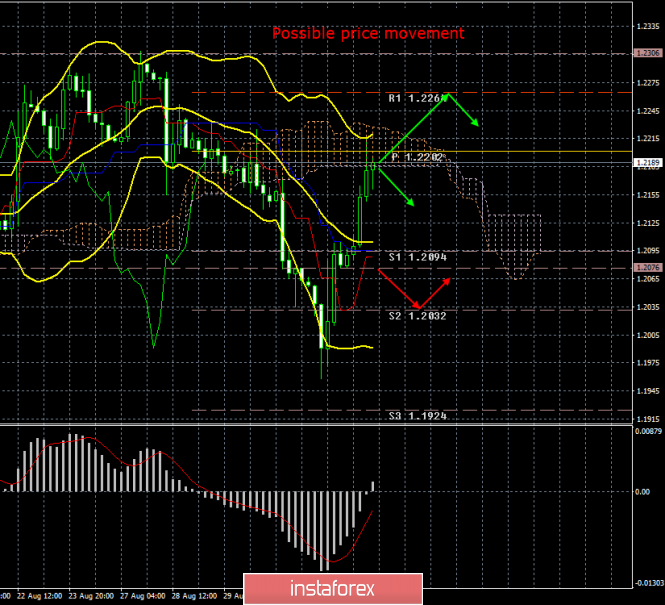
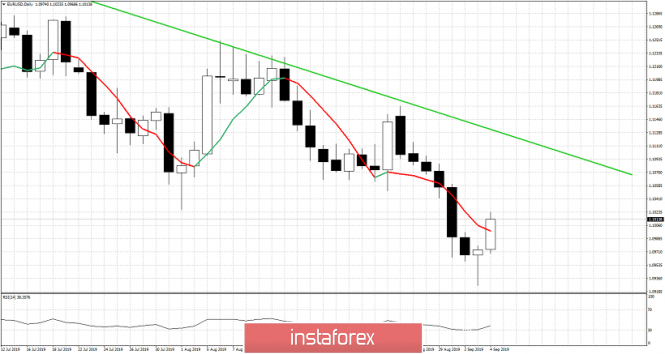
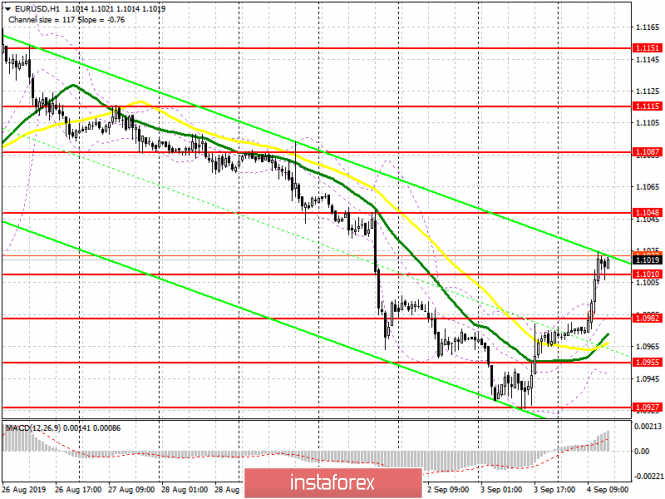
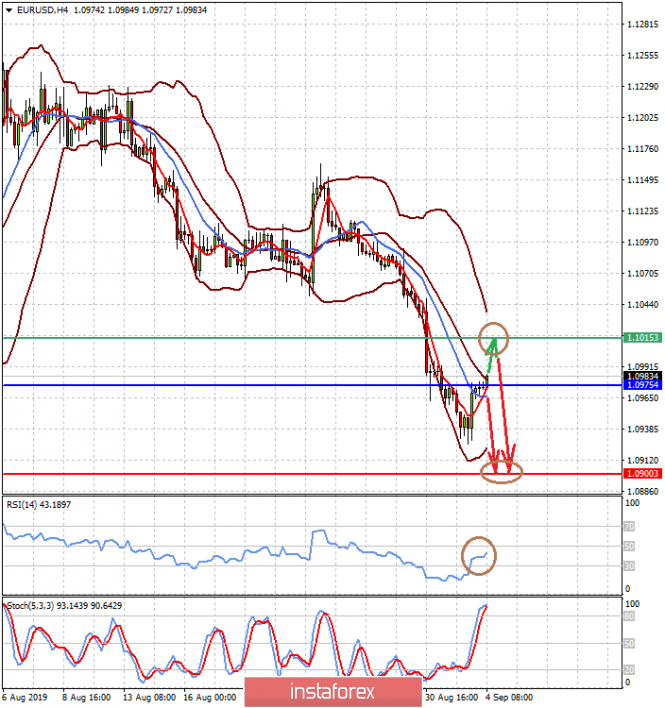
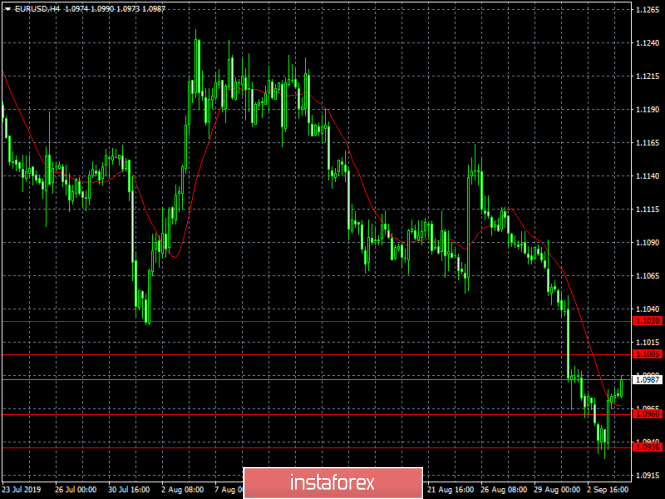
| EUR/USD. 4 September. Results of the day. Macroeconomic statistics supported the euro Posted: 04 Sep 2019 03:35 PM PDT 4-hour timeframe Amplitude of the last 5 days (high-low): 25p - 51p - 98p - 39p - 53p. Average volatility over the past 5 days: 53p (average). On Wednesday, September 4, the EUR/USD currency pair consolidated above the critical Kijun-sen line and as a whole continues the upward movement, which is now characterized precisely as a movement, and not as a correction. The first and most anticipated event of the day was a speech by Christine Lagarde to the Committee on Economic and Monetary Affairs of the European Parliament. Many traders feared that Lagarde's rhetoric would be similar to her speech last Friday, which brought the euro down. However, this time the fears were in vain. Christine Lagarde only stated that inflation in the EU will remain significantly below the target level in the near future, the eurozone economy may face new difficulties, and also said that it approves the actions of the ECB's board of governors, which maintain an accommodative monetary policy. Also, the future head of the ECB urged not to exert strong pressure on innovative tools, such as cryptocurrencies, in order to protect consumers as much as possible. In general, an interesting performance, but this time Lagarde did not report anything interesting, so traders ignored her performance. But macroeconomic reports from the eurozone unexpectedly supported the euro. The Markit services business activity index exceeded the forecast value of 53.5, while the composite index in August was 51.9, which is also better than market expectations.In addition, retail sales in the European Union turned out to be better than analysts expected in July - an increase of 2.2% instead of 2.0% y/y previously forecasted. In monthly terms, the indicator still showed a decline of 0.6%. Nevertheless, on the whole, the package of today's statistics can be characterized as positive for the euro, so it is not surprising that its growth continued today. As usual, the main question is how long will the strengthening of the European currency last this time? It is no secret that in the long run, an openly downward trend persists. The overall fundamental background also remains extremely negative for the euro. It was only in the last two days that at first the US statistics disappointed, and then the European pleased. In addition, the impossibility of a constant fall of one currency (the euro in our case) and the banal sell-off of the euro/dollar pair with the bears' desire to take part of the profit on short deals and we get the current correction. But the general situation has not changed. Moreover, tomorrow an important ISM index for the US services sector will be released, and after tomorrow GDP for the second quarter of the eurozone and NonFarm Payrolls in the United States, and Jerome Powell will make a statement to complete the week. With such a fundamental background, it is unlikely that a clear strengthening of the euro can be expected. The technical picture of the pair shows the willingness of the bulls to continue to gradually build up their positions. However, when the information that is negative for the euro is available to the traders, the bulls will immediately stop the attack and leave the market, and the euro will rush down again. Therefore, for buyers the pair is very important the next two days, strong macroeconomic statistics from overseas should not come. Trading recommendations: The EUR/USD pair continues the long-awaited correction. Thus, now long formally even long positions with goals 1.1076 and 1.1113, but small lots have become formally relevant. Tomorrow and the day after tomorrow it is recommended not to lose sight of all the important news, as the forex market could return to selling the euro/dollar currency pair. In addition to the technical picture, fundamental data and the time of their release should also be considered. Explanation of the illustration: Ichimoku indicator: Tenkan-sen is the red line. Kijun-sen is the blue line. Senkou Span A - light brown dotted line. Senkou Span B - light purple dashed line. Chinkou Span - green line. Bollinger Bands Indicator: 3 yellow lines. MACD indicator: Red line and bar graph with white bars in the indicator window. The material has been provided by InstaForex Company - www.instaforex.com |
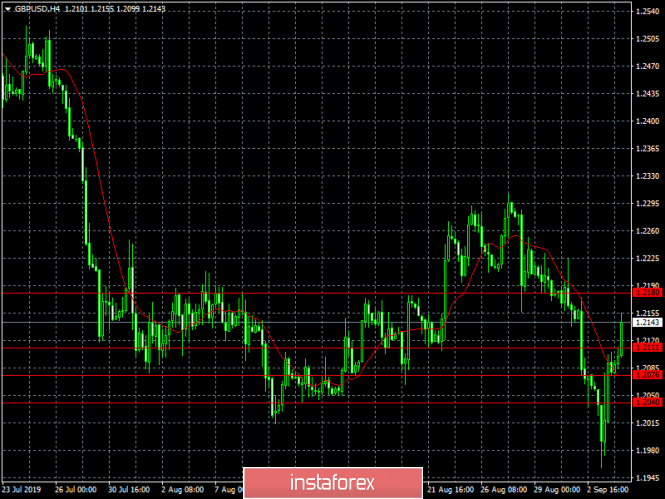
| Posted: 04 Sep 2019 03:35 PM PDT 4-hour timeframe Amplitude of the last 5 days (high-low): 134p - 60p - 86p - 139p - 147p. Average volatility over the past 5 days: 113p (high). Well, dear readers. I immediately want to clarify and inform you that the Supreme Court of Scotland, which considered the case on the legitimacy of the decision of Boris Johnson to stop the Parliament, has recently decided to uphold this decision. Thus, a group of 75 deputies failed to reverse the decision of the prime minister on forced vacations. However, battles for Brexit continue in the Parliament itself. Today's meeting began with a group of 20 Conservative deputies saying that they would vote against the current government and take the side of the opposition. Another minus 20 votes for Johnson. Further, the representative of the Labor Party, Keir Starmer, said that his party would not vote for Johnson's proposals and "dance to his tune". Boris Johnson, who appeared in Parliament later on, said he was ready to hold early parliamentary elections on October 15 if deputies approve another Brexit move. This will happen if deputies vote "for" the ban on leaving the EU without a "deal" tonight. That is, they will oblige Johnson to sit again at the negotiating table with EU leaders. However, such a bill must have a duration. Most likely, the new date for Britain to exit the EU in this case will be January 21, 2020. Johnson said that he wants to conclude a "deal" with the European Union, and then leave it. Of course, the prime minister does not specify whether there are at least low chances of concluding a "deal". Boris Johnson also accused Jeremy Corbyn of disrupting negotiations with the EU, to which the Opposition leader said that there were no negotiations, so there was nothing to undermine. Corbyn also states that if Johnson does what he has done with his party in the last 24 hours with the country, then many people have something to fear. It should be noted that Corbyn's arguments sound powerful and logical. The head of the Scottish National Party, Ian Blackford, said that Johnson "acts like a dictator." According to him, the people of Great Britain did not vote for Brexit without a deal. These arguments also look very strong. Philip Hammond, a former Tory, said Brexit without a "deal" would be a disaster for Britain. He also said that even if Johnson makes a "deal" with the EU, which he is talking about tomorrow, he still will not have enough time until October 31 to implement all the necessary aspects. Hammond also notes that in the European Union they do not know and have not seen any proposals from Johnson that could even be discussed. That is, what kind of deal the prime minister is counting on is not clear. At the moment, this is all the news from the British Parliament. Voting on a bill prohibiting a country's exit from the EU without an agreement will take place in a few hours. The British pound reacts very positively to reports from Parliament. Most likely, in the evening, British MPs will vote "for" the transfer of Brexit to a later date. Yes, it will look like a pun, but this is the only chance to save the country from a "catastrophe", according to most MPs. Since the probability of a Brexit delay is high, the likelihood of delaying the "hard" Brexit is also high, and this is exactly what the pound needs to gain confidence. Trading recommendations: The GBP/USD currency pair continues its strong upward movement. Buying the pair now is still dangerous since the situation is unstable. But still, if the pound overcomes the Senkou Span B line, then the longs can be opened in small lots with the target of 1.2264. At the same time, one should not forget about the correction, since the pound has been growing non-stop for two days now. In addition to the technical picture, fundamental data and the time of their release should also be considered. Explanation of the illustration: Ichimoku indicator: Tenkan-sen is the red line. Kijun-sen is the blue line. Senkou Span A - light brown dotted line. Senkou Span B - light purple dashed line. Chikou Span - green line. Bollinger Bands Indicator: 3 yellow lines. MACD indicator: Red line and bar graph with white bars in the indicator window. The material has been provided by InstaForex Company - www.instaforex.com |
| EUR/USD. Bulls of the pair counterattack: the Federal Reserve may reduce the rate by 50 points Posted: 04 Sep 2019 03:35 PM PDT The euro-dollar pair updated the annual (and at the same time two-year) price low yesterday, reaching 1.0926, but it is trying to gain a foothold in the 10th figure today. Although there is no talk of a turning point in the trend, the pair may develop a fairly large-scale correction if rumors about the aggressive easing of the monetary policy of the Fed continue to intensify. The dollar index, which recently was in the region of 99 points, is gradually "descending from heaven", reflecting the general negative dynamics. The European currency, in turn, shows character, although it itself is under the burden of fundamental problems. Given the contradictory fundamental background, the corrective growth of EUR/USD is given to bulls of the pair with great difficulty. Nevertheless, traders are clearly discouraged by the intentions of the Federal Reserve, while similar intentions of the European Central Bank have been discussed for a long time. However, it is too early to talk about any obvious intentions of the Federal Reserve. Only a few members of the Fed expressed their point of view, which, however, have the right to vote this year. Their position has significantly softened relative to previous speech. The same James Bullard, who has consistently advocated easing monetary policy, announced in early July that "rates are at an optimal level" and there is no need for their further reduction. But yesterday, he shocked the market with a proposal to reduce the rate immediately by 50 basis points. In this case, according to Bullard, the regulator will "adequately respond" to the current situation. According to him, the stakes are currently "too high", so the Fed should act decisively and not move "in small steps." Bullard's position was unexpectedly supported by the head of the Federal Reserve Bank of Boston, Eric Rosengren. He also has the right to vote on the Committee this year, so his comments caused no less excitement in the market. Rosengren expressed concern about the inversion of the yield curve and the weakness of the global economy. And although he did not voice any specific values in the context of the prospects for the interest rate, he also noted that the Federal Reserve should resort to "aggressive measures" if the voiced risks begin to materialize. In this context, tomorrow's US labor market data has gained particular importance for the US currency. Nonfarm data, as a rule, support dollar bulls, so if key indicators do not meet the expectations of traders, the greenback will continue to move downward, as the likelihood of a 50-point rate cut at the September meeting will increase. According to preliminary forecasts, data on the labor market will again support the US currency, but the optimism of traders may be restrained due to weak growth in the level of wages. Thus, the unemployment rate should remain at the lowest level of 3.7% with a sufficiently significant increase in the number of employees (+160 thousand). But here a separate line is worth noting the growth rate of the average hourly wage. Analysts expect the indicator to slow down - in annual terms, it should fall to a three percent mark (after reaching 3.2%). If the stated figures are confirmed, the dollar will receive some support, but at the same time, a weak increase in salaries can smear the overall positive picture. If the release as a whole comes out in the "red zone", then the panic regarding the possible results of the September meeting of the Federal Reserve will only intensify, which will undoubtedly affect the dynamics of the EUR/USD pair. By the way, the US currency fell yesterday not only because of the "dovish" comments of the Fed representatives. Traders reacted quite rapidly to the publication of the ISM manufacturing index, which plunged to three-year lows. This figure was below the 50th level, which indicates a slowdown in this sector of the economy. It sharply fell to 49.1 points in August, despite good forecasts by analysts. This fact put additional pressure on the US currency, fueling interest in buying the EUR/USD pair. The political events in Italy also indirectly supported the pair. In Rome, the two parties finally reached a coalition agreement, approving the composition of the new government, which will later be led by Giuseppe Conte. He was the prime minister even before the political crisis in the country, therefore this news was positively received by investors. The "coup" by Matteo Salvini ended in failure - although if he had achieved a re-election, he would surely have been at the helm of the government. The Brexit issue also contributed to the correctional recovery of the pair. At the moment, the British Parliament is still discussing a bill that will actually block the implementation of the "hard" scenario, at least by October 31. This solution, of course, will not solve the problem as a whole - but the foreign exchange market will still breathe a sigh of relief and stop counting the days until the "X-hour". Thus, tomorrow's Nonfarm data can either strengthen the correctional growth of the pair or return the price to the bottom of the 10th figure, followed by testing the 9th price level. To be more precise, now the question is as follows: either the bulls of the pair by the end of Friday will be able to "pull out" the price above the 11th figure (in the range of 1.1090-1.1210), or the downward trend will continue - to the middle of the seventh figure , where the most powerful support level is 1.0750 (the lower line of the Bollinger Bands indicator on the monthly chart). The material has been provided by InstaForex Company - www.instaforex.com |
| September 4, 2019 : EUR/USD Intraday technical analysis and trade recommendations. Posted: 04 Sep 2019 08:50 AM PDT
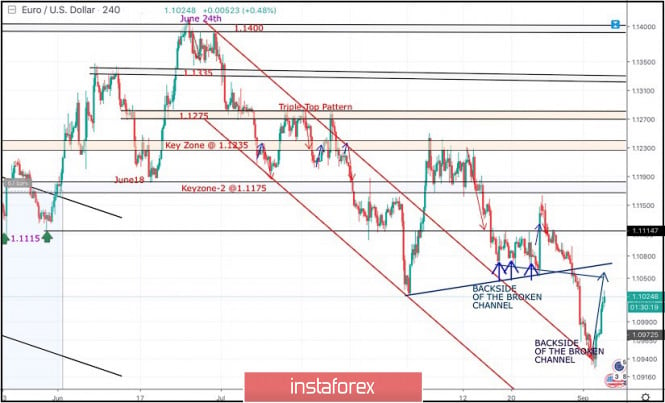
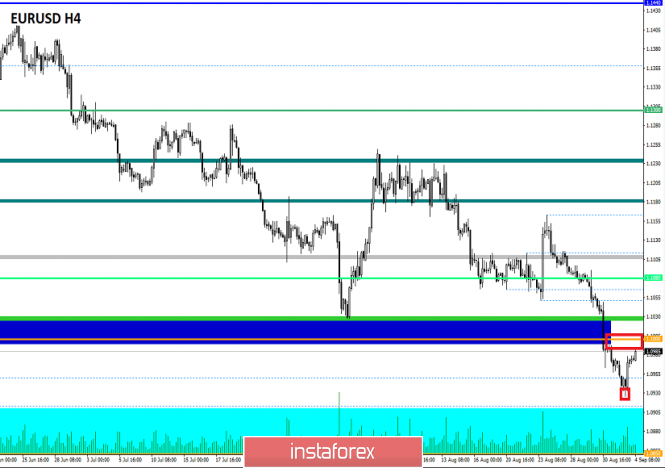
Back in June 24, the EURUSD looked overbought around 1.1400 facing a confluence of supply levels which generated significant bearish pressure over the pair. Shortly after, In the period between 8 - 22 July, a sideway consolidation-range was established between 1.1200 - 1.1275 until a triple-top reversal pattern was demonstrated around the upper limit. Then, Evident bearish momentum (bearish engulfing H4 candlestick) could bring the EURUSD below 1.1175. This facilitated further bearish decline towards 1.1115 (Previous Weekly Low) then 1.1025 (the lower limit of the depicted recent bearish channel) where significant signs of bullish recovery were demonstrated. Shortly-After in Mid-August, the EUR/USD has been trapped between 1.1235-1.1175 for a few trading sessions until bearish breakout below 1.1175 occurred on August 14. Bearish breakout below 1.1175 promoted further bearish decline towards 1.1075 where the backside of the broken bearish channel has provided temporary bullish demand for sometime (Bullish Triple-Bottom pattern). Bullish persistence above 1.1115 was needed to confirm the short-term trend reversal into bullish. However, the depicted Triple-Bottom pattern was invalidated especially after the EURUSD pair bulls have failed to establish Bullish persistence above 1.1115. Moreover, the recently established short-term uptrend line has been invalidated as well thus rendering the short-term outlook as bearish. By the end of last week's consolidations, a quick bearish decline was demonstrated towards 1.0965 - 1.0950 where the backside of the broken channel came to meet the EURUSD pair again. Risky traders were advised to look for a valid BUY entry anywhere around the price levels of 1.0950. It's already running in profits. Remaining T/p level to be located around 1.1050 and 1.1070. Trade recommendations : Conservative traders should wait for the current bullish pullback to pursue towards 1.1050-1.1070 for a valid SELL entry. S/L should be placed just above 1.1095 while target levels can be determined later based on upcoming price action. The material has been provided by InstaForex Company - www.instaforex.com |
| September 4, 2019 : GBP/USD Intraday technical analysis and trade recommendations. Posted: 04 Sep 2019 08:28 AM PDT
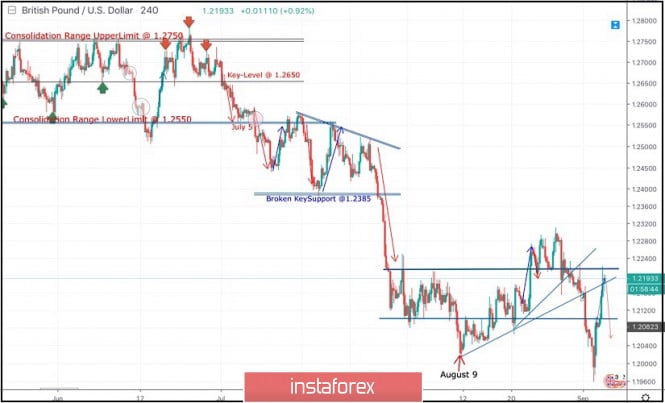
On July 5, a consolidation range bearish breakout was demonstrated below 1.2550 corresponding to the lower limit of the depicted consolidation range. Moreover, Bearish breakdown below 1.2385 (Broken Key-Support) facilitated further bearish decline towards 1.2320, 1.2210 and 1.2100 which corresponded to significant key-levels on the Weekly chart. In Early August, another consolidation-range was temporarily established above 1.2100 before August 9 when temporary bearish movement was executed towards 1.2025. Recent bullish recovery was demonstrated off the recent bottom (1.2025). This brought the GBP/USD pair back above 1.2100 (Lower limit of the recently established consolidation-zone). As expected, further bullish advancement was demonstrated towards 1.2230 then 1.2280 where recent bearish rejection was demonstrated. Bullish persistence above 1.2160 (the recent consolidation range pivot-point) was needed to enhance further bullish advancement towards 1.2320 then 1.2380. However, recent bearish rejection was demonstrated around 1.2215 (backside of the depicted broken uptrend line). That's why, another quick bearish decline took place towards 1.2100 then 1.2000 (corresponding to a prominent bottom established on August 9). Yesterday, early signs of bullish recovery (Bullish Engulfing candlesticks) were manifested around 1.1960 bringing the GBPUSD back above above 1.2100. As expected, further bullish advancement was demonstrated towards 1.2200. However, the GBPUSD pair looks overbought around the current price levels (1.2200) which constitute a prominent SUPPLY level to be watched for bearish rejection. Trade Recommendations: Conservative traders can have a valid SELL entry anywhere around the current price levels 1.2180-1.2200 (upper limit of the recent consolidation range & backside of the depicted broken uptrend). T/P level to be placed around 1.2100 and 1.2020, while S/L should be placed above 1.2250. The material has been provided by InstaForex Company - www.instaforex.com |
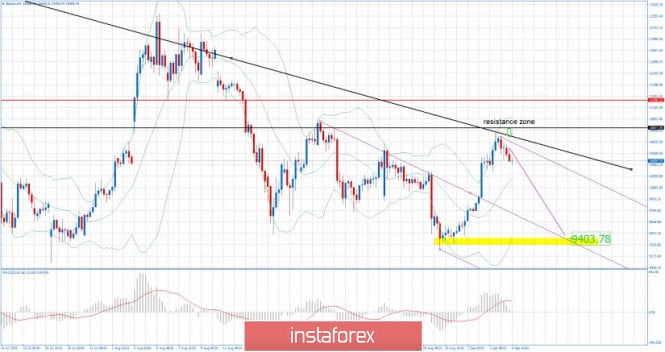
| BTC 09.04.2019 -Major resistnace held successfully Posted: 04 Sep 2019 08:01 AM PDT Bitcoin 1H time-frame:
Yellow rectangle – Downward objective Pink trendline – Expected path Black lines – Resistance levels Bitcoin on the 1-hour did exactly what I expected yesterday and that rejection of the strong resistance at $10.800, which is good sign for the further downside. I placed Pitchfork channel to find potential objective for the downward movement. There is a chance for the re-test of the $9.400. Still, investors are involved in Gold and Silver on the upside and I don't see any indication of any larger demand for the Bitcoin, which is sign that there is more potential downside. Bitcoin Forecast and recommendations for traders: Bitcoin is in overall consolidation phase but most recently I found test of the major resistance, which is sign that there is chance for more downside and potential test of $9.400. Thus, I recommend selling crypto currency with a target of $9,400, with a Stop Loss level of $11.000.The material has been provided by InstaForex Company - www.instaforex.com |
| Confused oil market: optimism faded Posted: 04 Sep 2019 08:01 AM PDT In the past few weeks, the black gold market is in a fever. He is under pressure from a number of factors, having difficulty maintaining balance. Many experts believe that oil has almost no reason for optimism. Analysts believe that the reasons for the imbalance in the black gold market are instability in the global financial sector, an increase in oil production by OPEC countries, as well as natural disasters, such as Hurricane Dorian. As for the countries of the cartel, oil production has increased significantly here at the moment. In August, OPEC + produced about 29.99 million barrels per day, which is 200 thousand more than the output in July this year. An increase in oil production was recorded in Russia, amounting to 134 thousand barrels. One of the key threats to the oil market remains the escalation of the US-China trade war. In the event of a worsening situation, the oil market expects strong price drops. As a result, investors will again begin to look for safe assets, which will upset the delicate balance in the black gold market. Market participants are also worried about the potential slowdown in the Chinese economy. If its growth slows, analysts are sure that oil demand will drop sharply. Recall that China is the world's largest consumer of raw materials. Last year, China acquired 461.9 million tons of Hydrocarbons. The black gold market is currently updating August lows. He is under pressure amid concerns over the overproduction of raw materials. Experts believe that oil is more likely to decrease than growth. In the short term, analysts are convinced that the bulls may lose. They predict a further drop in oil prices. If Brent crude oil exceeds $58, the new "bearish" target will be the line of $57.50. Note that at the moment it is trading in the range of $59.09– $59.15 per barrel. In the medium term, the situation is better: experts believe that quotes can be fixed in the range from $55 to $62 per barrel. Analysts rated the long-term outlook as minor with a high probability of decline to $50 per barrel. |
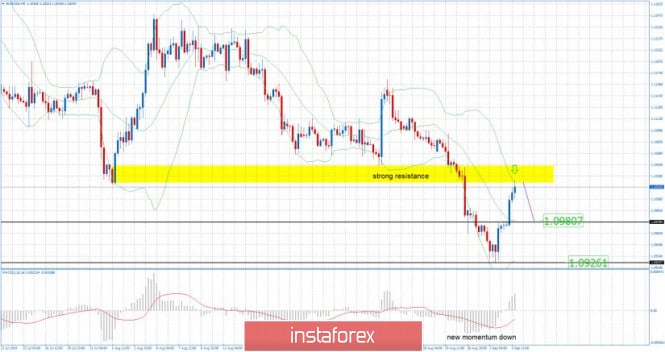
| EUR/USD for September 04,2019 - Sell zone on EUR Posted: 04 Sep 2019 07:43 AM PDT EUR/USD has been trading upwards in past 24 hours but the major resistance at the price of 1.1030-1.1053 is on the test. My advice is to watch for selling opportunities due to strong resistance on the test.
Yellow rectangle – Major resistance Black horizontal lines – Downward targets and support levels MACD oscillator did show new momentum down in the background and there chance for potential re-tests of the low at 1.0925. Resistance levels are found at$1.1030-1.1053 and support levels at 1.0980-1.0925. My advice is still to watch for selling opportunities and as long as the level of 1.1050 is holding and EUR don't trade above it, there is chance for more downside. There is no indication of any significant reversal for the upside, the trend is still down on the short-term prospective. The material has been provided by InstaForex Company - www.instaforex.com |
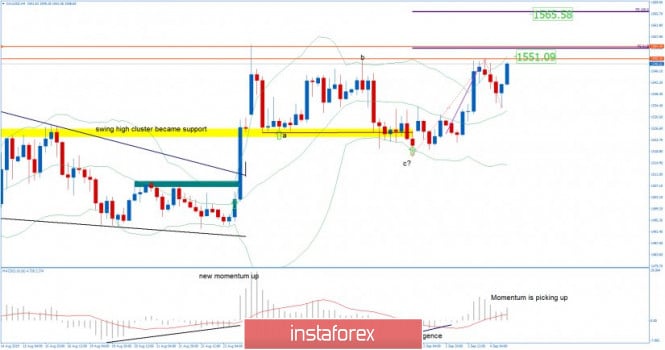
| Gold 09.04.2019 - First upward target reached and potential for the second target Posted: 04 Sep 2019 07:26 AM PDT Gold price had a nice push higher as I expected and our first upward target has been met at the price of $1,550. Anyway, there is still chance more upside and potential test of the second upward target at $1,565. You should watch for long positions on the pullbacks on lower frames 5/15 minutes.
Red horizontal line – First objective and resistance Purple horizontal line – Second upward target MACD oscillator is showing good new momentum up in the background and I do expect at least another push higher. Resistance levels are found at $1,551-$1,555 and support level at $1,533. My second upward target is set at the price of $1,565 (Fibonacci expansion 100%). The potential break with the new momentum up on the oscillator of the $1,555 may confirm further upside. I don't see any reversal and the bullish opportunities are preferable. The material has been provided by InstaForex Company - www.instaforex.com |
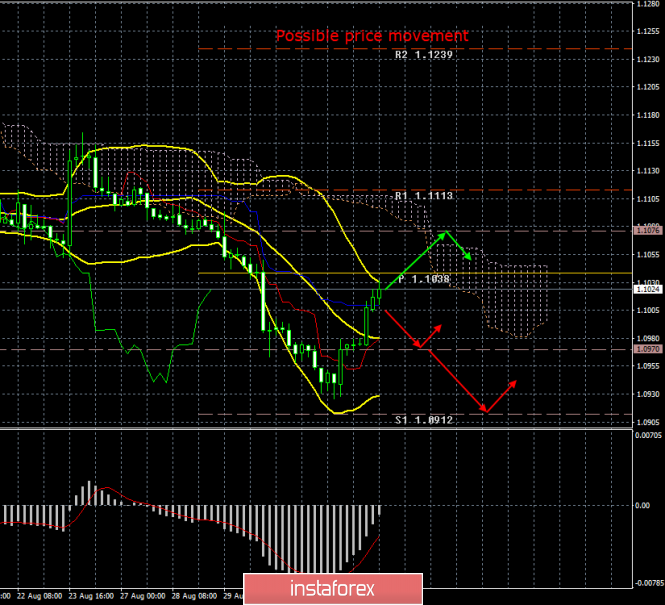
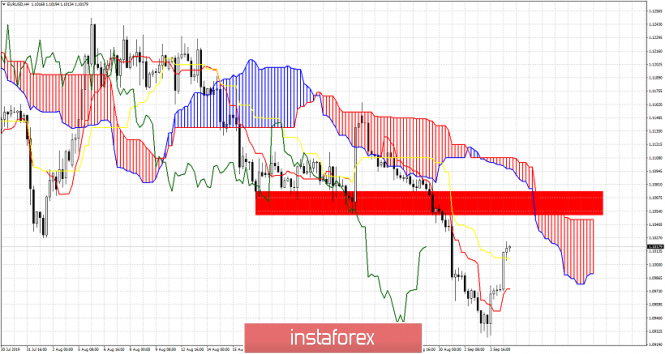
| EURUSD bounces as expected above 1.10 Posted: 04 Sep 2019 06:32 AM PDT EURUSD is at 1.1013. This bounce above 1.10 towards the resistance area of 1.1050 was expected as we noted in our latest analysis where we pointed out that the daily bullish reversal hammer pattern was a bullish sign.
EURUSD is bouncing above 1.10 as expected. Trend however remains bearish as price is still below the Kumo. Breaking above the tenkan- and kijun-sen (red and yellow lines) has confirmed our bullish short-term view of a bounce and we could soon see prices challenge the red rectangle and the Kumo. So far this bounce is considered as a selling opportunity and a relief bounce. Breaking above 1.11 would make us change how we see the bounce into maybe something bigger.
|
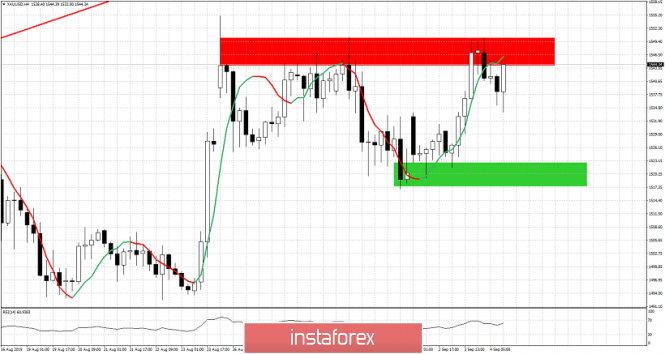
| Posted: 04 Sep 2019 06:22 AM PDT Gold price is challenging resistance and 2019 highs. After a rejection yesterday, price pulled back towards $1,533 which was resistance and now support. Gold bulls remain in control of the trend.
Green rectangle- support Gold price remains in a bullish trend. Price remains above key short-term support at $1,516. Price is now challenging resistance and if we see a break above $1,555 we expect a move towards $1,570. Breaking below support at $1,516 opens the way for a correction towards $1,500-$1,475. Gold bulls however need to be very cautious as Gold price has given several bearish divergence warnings. The material has been provided by InstaForex Company - www.instaforex.com |
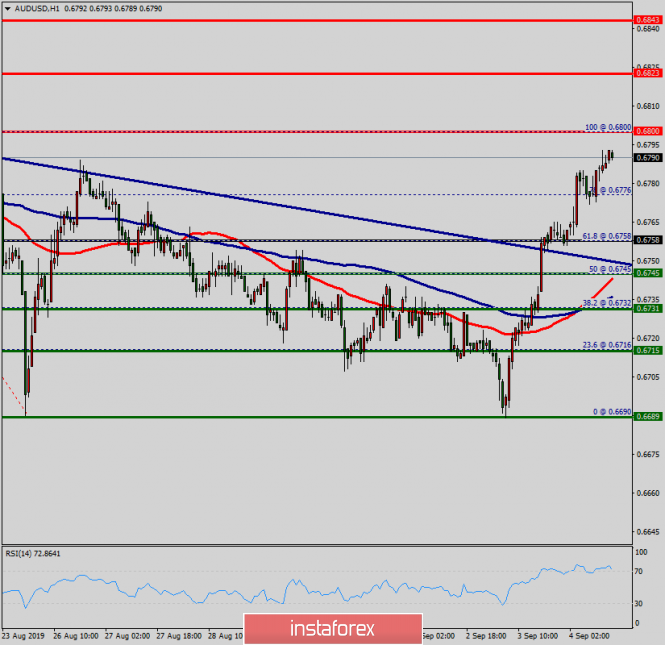
| Technical analysis of AUD/USD for September 04, 2019 Posted: 04 Sep 2019 05:53 AM PDT Overview: The AUD/USD pair continues to move in an uptrend from the level of 0.6758 since yesterday. Major support is seen at 0.6758, while immediate resistance is found at 0.6800. The market is still indicating a strong bullish trend from the area of 0.6758. Besides, it should be noted that the support coincides with the ratio of 61.8% Fibonacci. The bullish trend is still expected for the upcoming hours as long as the price is above 0.6758 levels. We confirm the bullish scenario in the 4-hour time frame. We guess that the pair will be traded higher in the early session and try to reach the first resistance at the level of 0.6800. The bias is neutral in the nearest term probably with a little bullish bias testing 0.6800 and 0.6823 area which needs to be clearly broken to the upside to keep the bullish scenario strong. A clear break above that area (0.6800) could lead the price to the neutral zone in the nearest term testing 0.6823 and 0.6848. Indicator:
|
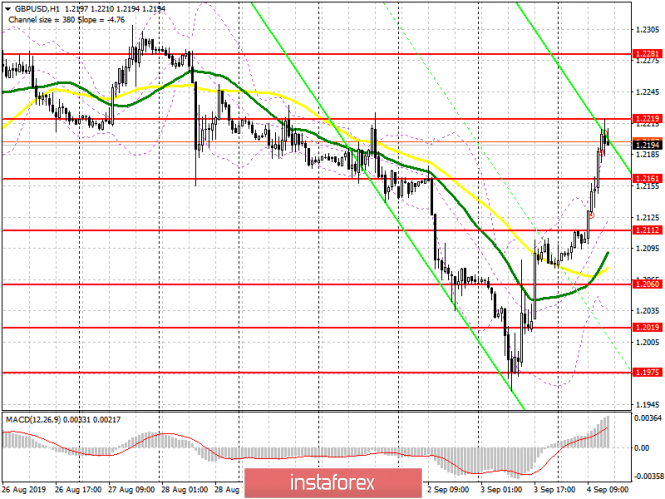
| Posted: 04 Sep 2019 05:46 AM PDT To open long positions on GBP/USD, you need: In the morning, I paid attention to the fact that buyers of the pound will seek to the resistance area of 1.2161 and 1.2220, which happened. The purchases are so strong that even a weak report on the service sector, which seriously affects the volatility of the pair, was completely ignored by the market. At the moment, there is a slight correction from the resistance of 1.2220, but a re-test of that level could lead to further breakdown and a rising trend in the area of highs of 1.2281 and 1.2343, however, much will depend on the results of the vote on the bill proposed by the opposition prohibiting Brexit to reach an agreement. In a downward correction scenario, it is best to look at long positions on a false breakdown from the support of 1.2161 or buy a pound for a rebound from a minimum of 1.2112. To open short positions on GBP/USD, you need: Boris Johnson called the probable date of early elections – October 15, but traders took it more as a positive signal. At the moment, the bears are trying to hold the level of 1.2220 and form a downward correction from it, which will be limited to the support of 1.2161. It will be possible to count on a larger movement of the pound down only after a failed vote on a bill that does not allow Brexit without an agreement. In this case, the target of the sellers will be the lows of 1.2112 and 1.2060, where I recommend taking the profit. In the scenario of further growth of GBP/USD, it is best to count on sales on a rebound from the highs of 1.2281 and 1.2343. Signals of indicators: Moving Averages Trading is above 30 and 50 moving averages, indicating the predominance of buyers in the market. Bollinger Bands In the case of a decrease in the pound, the average border of the indicator in the area of 1.2112 will limit the downward potential.
Description of indicators
|
| Posted: 04 Sep 2019 05:32 AM PDT To open long positions on EURUSD, you need: Weak data on the volume of retail sales in the eurozone did not lead to the formation of pressure on the euro, as it fully coincided with the forecasts of economists, which in the short term retained the bullish momentum formed yesterday. At the moment, the bulls need to protect the level of 1.1010, which is now a support. The formation of a false breakdown on it will be an additional signal to open long positions in the expectation of updating the maximum in the area of 1.1048, where I recommend fixing profits. If the bulls miss the support of 1.1010, then consider new long position after a test of the minimum of 1.0982. The Fed's statements in the afternoon may have a negative impact on the US dollar, due to the expectation of further cuts in US interest rates. To open short positions on EURUSD, you need: Sellers are not in a hurry to return to the market, and only a decrease in EUR/USD at the level of 1.1010 will increase the pressure on the pair and lead to an update of 1.0982, where I recommend fixing the profits. Important fundamental data are not expected to be released in the afternoon, so all the emphasis will be placed on the speeches of representatives of the Federal Reserve System. If the pair continues its strengthening along the trend, it is best to sell immediately on the rebound after the update of the maximum of 1.1048. Signals of indicators: Moving Averages Trading is above 30 and 50 moving averages, indicating a bullish market. Bollinger Bands In the case of a decline in the euro, the average border of the indicator around 1.0982 will limit the downward potential.
Description of indicators
|
| Trading strategy for Bitcoin on September 4th. Bearish divergence stops the growth of bitcoin Posted: 04 Sep 2019 05:09 AM PDT Bitcoin 4H.
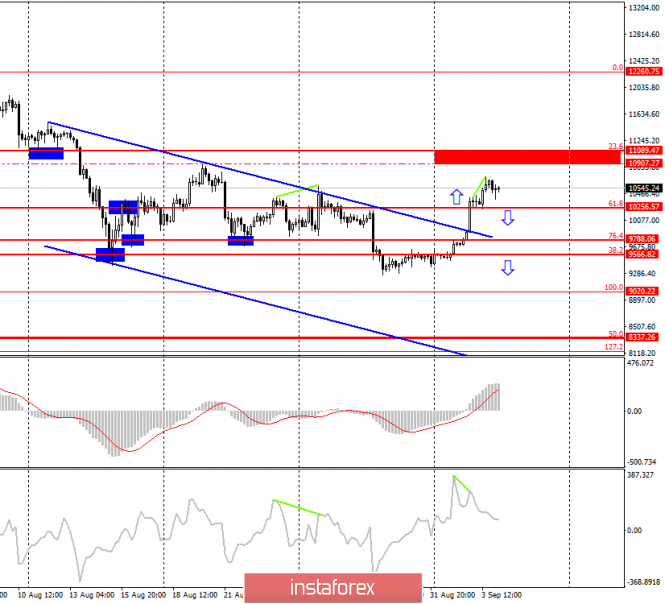
On Tuesday, Bitcoin tried to continue growth in the direction of the peak of August 20. But the resulting bearish divergence of the CCI indicator allowed the quotes of the "cue ball" to suspend its growth. Now, I expect a decline in the BTC rate to the correction level of 61.8% ($10,256), from which the growth began the day before. I still think that under the current conditions of fundamental factors, bitcoin's growth is small, despite all the stunning forecasts of crypto experts who predict an increase of almost up to $100,000 per coin. However, no news would cause additional demand for BTC or, conversely, the sale of "cue ball". Thus, I am more inclined towards the option with consolidation below the Fibo level of 61.8% and a further fall. However, this option, like any other, needs to find confirmation. Also, an important factor in the possible fall of bitcoin in the coming days and even weeks is the fact that trading volumes are not growing recently, respectively, the market does not have an influx of new investors. There are no "hamsters" or one-day investors. The last important technical factor: since August 6, each subsequent top of the quotes is lower than the previous one, which means the weakening of the bulls' positions in the market. Accordingly, much depends on the peak of August 20. Its breakthrough will give strength to the bulls, and then Bitcoin can soar to $12,260. The bitcoin information background is now empty. Yes, cryptocurrency can respond to the next Fed meeting, on which Powell may again lower its key rate. It can react to a new escalation of the trade conflict between the US and China, if it, of course, happens. It can respond to any geopolitical tension. But so far this is not all, and it is unlikely that the news about the theft of 200 BTC with the help of a modified bitcoin wallet interests traders. The Fibo grid is based on the extremes of July 17, 2019, and August 6, 2019. Forecast for Bitcoin and trading recommendations: Bitcoin performed a consolidation above the Fibo level of 61.8%, but bearish divergence casts doubt on further growth. I recommend selling cryptocurrency if it closes at 61.8% ($10256), and the bearish divergence does not cancel, with the target of $9788 (76.4% Fibo). I recommend buying bitcoin with the target area of $10907 - $11089, and with a stop-loss level of $10256 if the closing is performed above the peak of the bearish divergence at CCI. The material has been provided by InstaForex Company - www.instaforex.com |
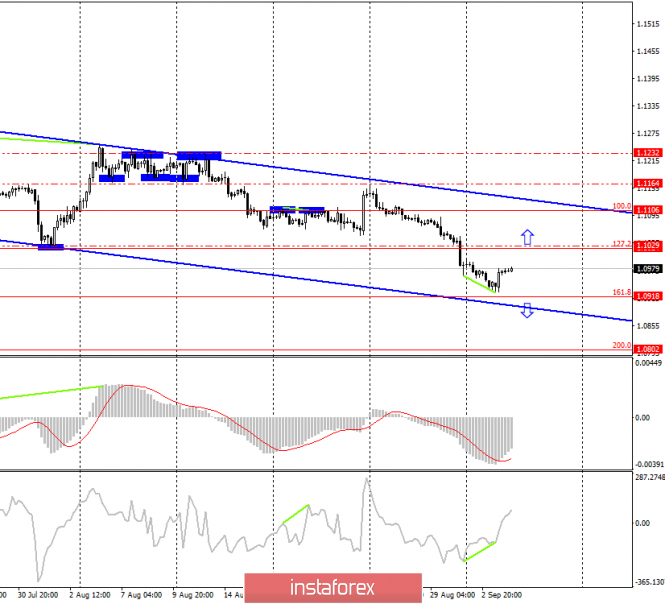
| Posted: 04 Sep 2019 05:09 AM PDT EUR/USD – 4H.
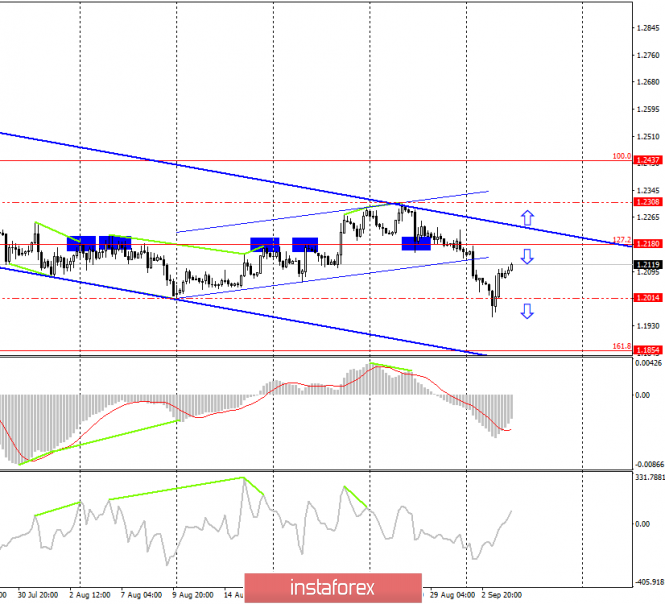
On September 4, the EUR/USD pair performed a reversal in favor of the European currency on the 4-hour chart after the formation of a small bullish divergence at the CCI indicator and began the growth process towards the correction level of 127.2% (1.1024). Thus, to the level of 161.8% (1.0918), which was designated as the target, for the last sell signal, there were not enough points. Yesterday, the most significant economic report was released in the United States, and it concerned business activity in the sphere of production. According to the ISM index, business activity in the US manufacturing sector began to slow down, as the value was 49.1. The second index of business activity, Markit, remained in the "positive zone". Nevertheless, the ISM index was enough for traders to stop buying the US dollar and take profits, not reaching the Fibonacci level of 161.8%. Based on this, traders can count on the corrective growth of the pound/dollar pair within the trend downward channel. What to expect from the euro/dollar currency pair on Wednesday? On September 4, I expect the pair to continue its corrective growth in the direction of the correction level of 127.2%. The rebound of quotations from this Fibo level will allow traders to expect a reversal in favor of the US currency and the resumption of the fall in the direction of the correction level of 161.8% (1.0918), according to the direction of the trend channel. If traders make a close above the Fibo level of 127.2%, then the growth of the pair can continue in the direction of the upper area of the channel and the correction level of 100.0% (1.1106). Further growth of the euro is not yet considered, as the information background for the euro as a whole remains negative. This is understood by traders and is in no hurry to buy the EU currency. Today in the morning, I recommend following the indices of business activity in the service sector, composite indices of Germany and the EU, as well as the report on retail sales in Europe. Strong data will support the demand for the euro. The Fibo grid is built on the extremes of May 23, 2019, and June 25, 2019. Forecast for EUR/USD and trading recommendations: I recommend selling the pair with a target of 1.0802 if fixing is performed under the correction level of 161.8%. Stop-loss order above the level of 1.0918. It is possible to buy the pair after closing above the level of 1.1029 with the target of 1.1108. In this case, the pair will remain inside the downward trend. GBP/USD – 4H. Yesterday was very eventful in the UK, and more specifically in the British Parliament. To begin with, the opposition movement led by Jeremy Corbyn once again criticized Prime Minister Boris Johnson, calling his actions absurd and illegitimate. This was followed by a vote for the initiation of a bill to block Brexit No Deal. If this bill is adopted, then Boris Johnson will have to look for workarounds to exit the European Union on October 31. In other words, the war with parliament will continue. Trumps of Boris Johnson are threats to party members about the deprivation of their deputy mandates if they support the laws on the ban on Brexit according to Johnson's plan, as well as the threat of re-election to parliament if the majority of deputies passes the No Deal ban on leaving the EU. Also, there is no unity of opinion even within the Conservative Party itself, which, according to many experts, is split into several camps. Thus, Boris Johnson has no corresponding support, and militant political forces may well provide him with fierce resistance, and not just formal. Do not forget that parliament will go on its second vacation on September 9, 2019, if the courts that are now considering claims regarding Johnson's decision to "pause" the parliament's work will not block this decision, having declared it illegal. Although there is little hope. There are more chances to succeed in parliament, and today traders will know the outcome of the first battle between deputies and the prime minister. What to expect from the pound/dollar currency pair on Tuesday? Now, the pound/dollar pair is in corrective growth to the upper area of the downward channel. The rebound from the correction level of 127.2% (1.2180), from which there were rebounds earlier, will work in favor of the US dollar and the resumption of the fall of the pair in the direction of levels 1.2014 and 1.1854. But in the case of a close above the level of 127.2%, the chances of a resumption of the downward trend in the coming days will decrease sharply, but it will still not be enough to buy the British pound, the purchases of which I recommend considering after leaving the downward channel and after the end of all wars in the British parliament. The Fibo grid is based on the extremes of January 3, 2019, and March 13, 2019. Forecast for GBP/USD and trading recommendations: I recommend buying the pair very cautiously (or not buying at all) with a target of 1.2437 if the closing above the top line of the trend channel (downward) is performed. I recommend selling the pair with a target of 1.2014, if the rebound from the level of 1.2180 is performed, with the stop-loss order above the correction level of 127.2%. The material has been provided by InstaForex Company - www.instaforex.com |
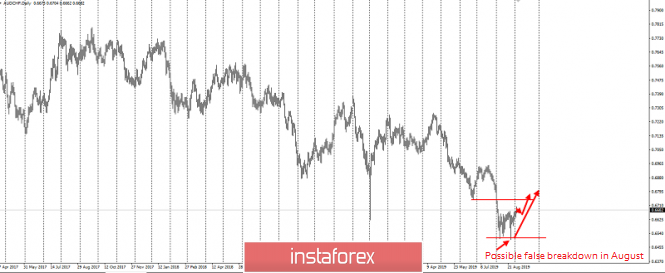
| Forgotten crosses in profit: AUD/CHF Posted: 04 Sep 2019 04:34 AM PDT Good afternoon, dear traders. I remind you that there will be news this week and the main news of the week on "US unemployment" will be announced on Friday. As practice shows, all pairs tied with the US dollar will behave relatively calm. I try not to trade in front of strong news, with the exception of holding medium-term positions to a greater extent on cross rates. This week I voiced trading ideas on AUD/CAD and NZD/CHF pairs. There are two more crosses on my trades, and one of them is the AUDCHF pair, which has already grown quite well. But in the case of corrections, it can be selected in longs with a potential of up to 100p (4 characters). I note that most of the tools that CHF includes are go quite noisy and low volatility. As you know, most traders trade EURUSD but the euro does not forgive mistakes, unlike the "stabilizing" franc. Even to the dollar, this pair has short moves and over the past 5-6 years does not go out of the range of 700-800p, and after passing every 500 it has quite significant kickbacks. In fact, this can be used very well but more about that will be on another time. Thus, the AUD/CHF pair, which is a favorite of net sellers through a magnificent false breakdown of 0.65, has every chance of growing at least to the nearest resistance with a mirror level of 0.6750. I have been holding it in longs since the beginning of August and I am building up a long position with a take on breakdown of 0.0650 during rollbacks. From current prices, the profit will be 70p and if it rolls back a little, then 100+p cross-profit will be yours. Wish you success in trading and control risks. See you in the evening on the gold trading idea. The material has been provided by InstaForex Company - www.instaforex.com |
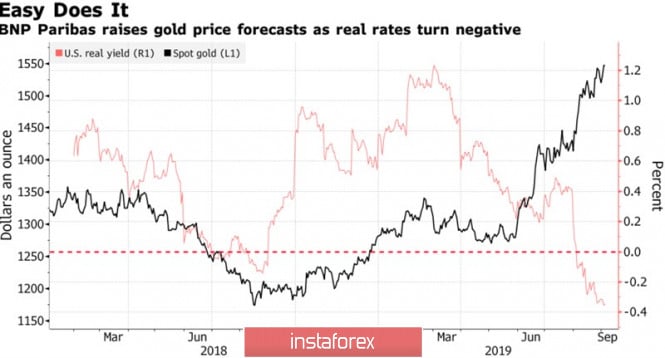
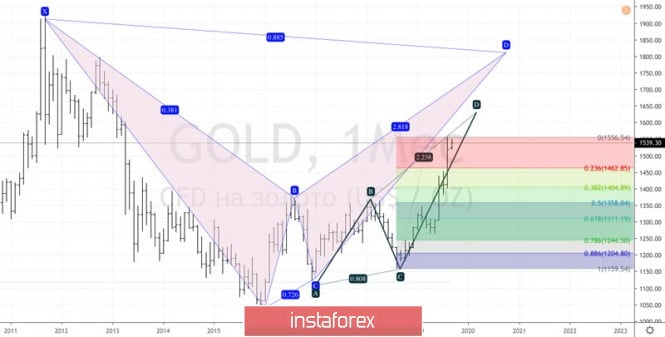
| Gold pulled a Trump card from the deck Posted: 04 Sep 2019 04:34 AM PDT Several events such as the first fall in business activity in the US manufacturing sector below the critical level of 50 since 2016, the escalation of the trade conflict in Washington and Beijing, the protests in Hong Kong, as well as the intensification of the political struggle in Britain, quickly returned gold quotes to 6-year highs. The weakness of the purchasing managers' index, paired with the growth of international risks, increased the likelihood of a weakening Fed monetary policy. According to BNP Paribas, the Fed will cut the rate by 25 bp four times before June 2020, which will drop the US dollar and allow the precious metal to soar above $1,600 an ounce. This forecast looks extremely conservative since only in August that XAU/USD quotes added 8%, and even 19% since the beginning of the year. Gold is one of the most highly effective instruments of both the commodity and financial markets as a whole. It reacts sharply to a decrease in the yield of US treasury bonds and to the correction of American stock indices. In turn, Treasuries and the S&P 500 showed increased sensitivity to news about the trade conflict in Washington and Beijing. Moreover, if the dollar grew in August due to the stability of the American economy, then a fall in business activity in the manufacturing sector below 50 seriously changed the situation. Also, if the dollar grew in August due to the stability of the American economy, then a fall in business activity in the manufacturing sector below 50 seriously changed the situation. The States are affected by Donald Trump's protectionist policies as other countries and if US macro statistics continue to deteriorate, the Fed will have to aggressively cut rates. The dynamics of gold and yield on US Treasury bonds This is supported by one of the main "hawks" FOMC, Boston Federal Reserve President Eric Rosengren. In his opinion, there is no sense in further weakening the monetary policy but if the state of the US economy worsens, the Central Bank may reduce the rate not by 25 but by 50 bp. It is possible that the first sign of the implementation of a pessimistic scenario was the release of data on business activity in the manufacturing sector. If the August labor market report for August disappoints, Jerome Powell's "dovish" rhetoric following the September FOMC meeting can be considered a fait accompli. A favorable external background allows ETF fans to increase stocks. The indicator in August rose by more than 100 tons and exceeded the mark of 2450 tons, which was the highest since the beginning of 2013. Given the combined 154 tons in June-July, we can say that gold scatters like hotcakes but it could have been otherwise if the scale of the negative debt global debt market is approaching $17 trillion. Also, there are risks of the S&P 500 correction due to the inversion of the recession yield curve are growing by leaps and bounds? It remains only for the US dollar to confidently go down and the BNP Paribas forecast of $1,600 per ounce will be realized before the end of autumn. Technically, the precious metal continues the victorious procession and approaches the target by 161.8% according to the AB = CD pattern. It corresponds to the mark of $ 1630 per ounce. In the long run, bulls are set to move higher by 88.6% towards the target, based on the Bat model. Gold monthly chart |
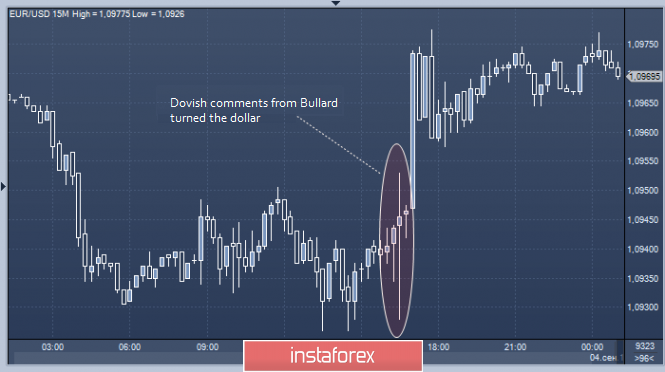
| Posted: 04 Sep 2019 04:34 AM PDT The end of the trading session on Tuesday, September 3, was marked by a sharp collapse of the US dollar. Meanwhile, the US currency interrupted a six-day growth after the Fed's comments about a possible rate cut of 0.50%. According to James Bullard, head of the Federal Reserve Bank (FRB) of St. Louis, the massive decline in treasury yields and the negative impact of the trade war on the US economy require decisive action by the Fed. According to the official, the current level of interest rates is unnecessarily high and needs to be adjusted. Bullard proposes not to move in small steps, but to immediately reduce the rate by 0.50%. The financier is confident that such a reduction in rates meets market expectations. Experts believe that such a decision was caused by concerns about higher risks for the US economy. The comments of Bullard and his colleagues, who supported the rate cut, brought down the dollar that has shown steady growth for six consecutive sessions. At the same time, the European currency began to rise in price relative to the American, which was previously declining. Many market participants believe that the regulator will reduce the rate by 50 basis points (bp) this month. This decrease is already included in the price of most financial instruments. The current situation also contributes to the weakening of the US currency. On Wednesday, September 4, the US dollar depreciated against the euro. The EUR/USD pair is in the range from 1.0986–1.0988. The European currency is gaining strength and strengthening. After the statements of J. Bullard, the American currency turned sharply in the direction of the fall and reached 1.0926. This has been the lowest result in recent years, experts emphasized. The previous peak that the dollar managed to conquer was at 1.0977. Nevertheless, analysts are counting on the restoration of the lost positions of the American currency. The solution proposed by the head of the Federal Reserve Bank is currently a wish, not a guide to action. The question of its implementation remains open, experts summarized. |
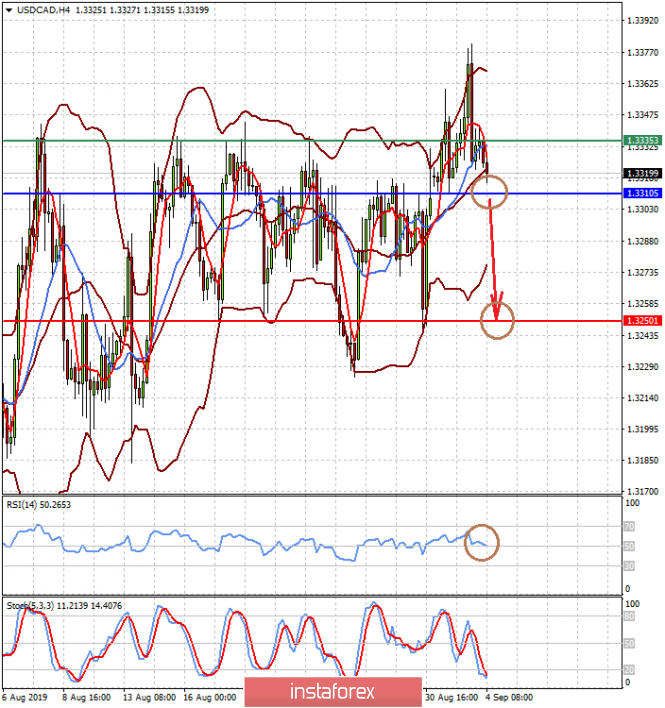
| Posted: 04 Sep 2019 04:34 AM PDT In spite of the risks of promising inflation growth due to higher customs tariffs, the Federal Reserve will not only have to lower interest rates once but proceed to a cycle of their reduction. The data on the index of production activity of the Institute for Supply Management (ISM) published on Tuesday showed a decrease in the indicator below the key mark of 50 points to 49.1 points in August from 51.2 points in July. This is a negative signal, which indicates that the troubled manufacturing sector in the United States is beginning to show full-fledged signs of a slide into recession. Moreover, interestingly, the value of the indicator is approaching the local minimum of August 2016, which was formed before the election of Donald Trump by 45 US Presidents. At that time, the situation in the economy stabilized at a positive level but gradually began to lose the momentum received by the three incentive programs called quantitative easing (QE). The picture began to improve after President Trump decided on a new incentive through tax cuts and government subsidies. But just as with the application of quantitative easing, the new support measures have actually fizzled out, and the United States trade war last year only intensified the weakening of economic growth. America is facing a recession. The negative value of the index of production activity contributed to the weakening of the US dollar, which, incidentally, fully coincided with its considerable technical overbought. The dollar fell against major currencies on Tuesday with the exception of the Japanese one. But the question is if it is a local correction or the beginning of a global reversal? We believe that this is only a correctional decline so far. It's too early to talk about a possible change in the global trend. It seems to us that markets can only get a hint of the real future of monetary policy following the results of the September Fed meeting on monetary policy, from which investors are almost 100% likely to expect a 0.25% reduction in the key interest rate. Forecast of the day: The EUR/USD pair is correcting upward in the wake of the local weakening of the dollar. It can grow to 1.1015 if it holds above 1.0975. But in general, we believe that the pair needs to be sold on growth from 1.1015 or after its decrease below 1.0975. The pair may turn around today due to the publication of weak data on retail sales in the eurozone. According to the results of the meeting of the Central Bank of Canada, the USD/CAD pair may decrease locally if not only the key interest rate is lowered, but the regulator does not give a specific signal about its future monetary policy. The fall in the pair may also be supported by a limited increase in crude oil prices. A price decline below the level of 1.3310 may serve as the basis for its fall to 1.3250. |
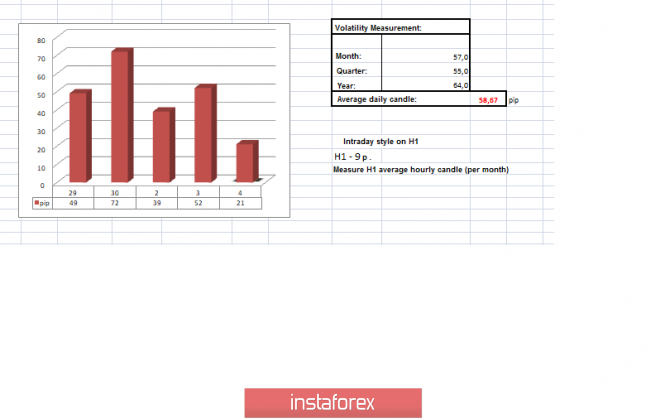
| Trading recommendations for the EURUSD currency pair - placement of trade orders (September 4) Posted: 04 Sep 2019 01:27 AM PDT Over the past trading day, the EUR/USD currency pair showed volatility close to the average daily point of 52 points, as a result of having a technical pullback in the market. From the point of view of technical analysis, we see that the inertial course, which held us for more than 6 trading days, led to the fact that sellers not only managed to overcome the psychological level of 1.1000, we consolidated below it, while maintaining downward interest. The decline of the price to the level of 1.0926 overheated the short positions so much that the slightest noise, background, was enough to form a technical pullback / correction. As discussed in the previous review, traders worked steadily on the decline, having a considerable profit behind them, but everyone had only one thought in their heads - "the correction has matured". Thus, the pullback that we had, as a result, was expected, and the temporary fixation of trading positions in this contributed to it. Considering the trading chart in general terms (daily period), we see that the "Impulse" tact in the global downward trend is still there and even if the price returns to 1.1000, the tact will remain in the market. On the other hand, the news background of the past day contained data on producer prices in Europe, where a slowdown from 0.7% to 0.2% was recorded, which directly indicates a significant slowdown in inflation, why should it grow. In the United States, data on business activity in the manufacturing sector were published, where it cannot be said that they failed, and so, ISI PMI indicators show a slight decrease from 51.2 to 49.1. Did this data affect the local weakening of the US dollar? I think so, but only in terms of the fact that the dollar itself was overbought and the traders needed at least a small correction. Recently, there has been quite a lot of talk on the open spaces of the information background regarding the resumption of the QE program and a new reduction in the interest rate, as you know, we are talking about the ECB. So, this time the head of the Central Bank of France, Francois Villeroy de Galhau, who is one of the senior representatives of the leadership of the European Central Bank, expressed his thoughts on this topic. He believes that the ECB has a quartet of powerful instruments, including an asset purchase program, but, according to Francois, these instruments should not play simultaneously or at the same pace. At the same time, according to the head of the Central Bank of France, the ECB's monetary policy cannot work miracles. That is, Francois Villeroy de Galhau has doubts about the rationality of the resumption of the QE program. Let me remind you that the ECB meeting is scheduled for September 12. Now back to the long-playing topic - Brexit. So here it's all about Feng Shui, the House of Commons voted on Wednesday night to decide to take control of the agenda, which could lead to the fact that the British Parliament will require a new delay of exit from the government, which, I'll notice, has already been raised, and the European Union is ready to provide it. Now, the Prime Minister of Great Britain is trying by all possible means to oppose parliament and the "shadow government", threatening out-of-town elections and the dissolution of parliament. Let's see what happens next, but the pressure is growing daily. Today, in terms of the economic calendar, we have data on retail sales in Europe, where they expect a significant slowdown from 2.6% to 2.0%. If the data is confirmed, the single currency can get considerable pressure and, as a result, continue to decline. In turn, the information background will continue to flounder in the divorce proceedings, where the British Parliament has fewer and fewer days to withstand the country's tough secession from the EU. EU 9:00 Universal time - Retail sales for July Further development Analyzing the current trading chart, we see that the rollback returns us to the psychological level of 1.1000, which we expected in the previous review. The fact that the quotation still manages to stay below the level of 1.1000 is a good sign in terms of the formation of a downward trend. In turn, traders will record a considerable part of the profit, are in a comfort zone and are still considering short positions in terms of a possible recovery of the trend after correction. It is likely to assume that a price rapprochement with the level of 1.1000 is possible, where in the event of stagnation and the flow of news flow, traders will try to identify descending positions in the direction of the previously found support level of 1.0930. Do not forget about the massive informational background, which can make considerable changes to our earlier forecast - we follow the actions of Britain. Based on the above information, we derive the following trading recommendations: - Buying positions relative to the current development should be considered already in terms of the formation of an oblong correction, that is, in case of price fixing higher than 1.1000. It is desirable, having a foundation from an information background. - Selling positions are considered in terms of resuming a downward move, where if the price is fixed lower than 1.0960, we can expect a move to 1.0930. Further actions are made after fixing the price below the local minimum of yesterday. Indicator analysis Analyzing a different sector of timeframes (TF), we see that indicators in the short-term and intraday periods tend to increase due to the formation of a technical correction. Meanwhile, the medium-term outlook is more stable, reflecting the general market background. Volatility per week / Measurement of volatility: Month; Quarter; Year Measurement of volatility reflects the average daily fluctuation, calculated for the Month / Quarter / Year. (September 4 was built taking into account the time of publication of the article) The current time volatility is 21 points. It is likely to assume that due to the information and news background, the volatility of the day may have a value close to the average daily or exceed it. Key levels Resistance zones: 1,1000 ***; 1,1100 **; 1,1180 *; 1.1300 **; 1.1450; 1.1550; 1.1650 *; 1.1720 **; 1.1850 **; 1,2100 Support areas: 1.0850 **; 1,0500 ***; 1.0350 **; 1,0000 ***. * Periodic level ** Range Level *** Psychological level **** The article is built on the principle of conducting a transaction, with daily adjustment The material has been provided by InstaForex Company - www.instaforex.com |
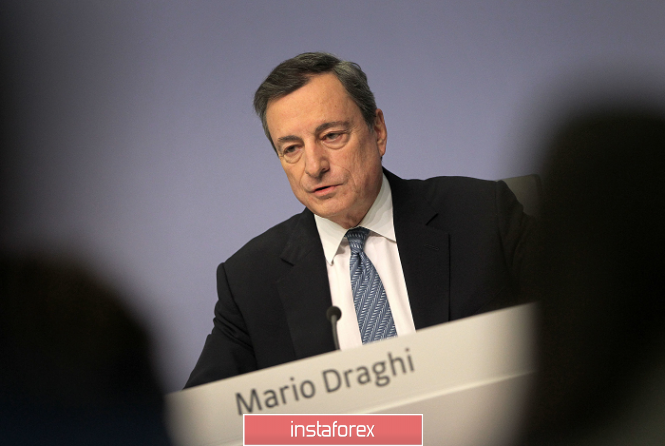
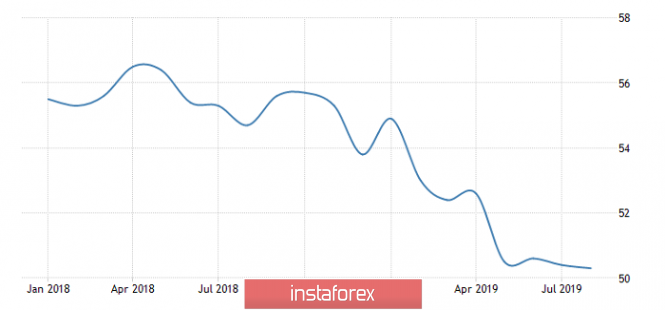
| Temporary correction (A review of EUR / USD and GBP / USD on 09/04/2019) Posted: 04 Sep 2019 01:15 AM PDT Naturally, Britain is in the spotlight with its never-ending epic called Brexit. It has always been assumed that the British simply leave without notifying anyone. But what is happening completely breaks all the patterns. They said loudly - and did not leave at all. Thus, you can bring the situation to the point where everyone else leaves, and they remain alone. The next series of the highest grossing series of our time began with the fact that Boris Johnson threatened by early elections if the parliament rested and prevented him from making Brexit without a "divorce" agreement. True, he added that this is an extreme measure, and he himself does not want this, but if Europe rests and does not agree to the conditions of the United Kingdom, he will show them where the crayfish hibernate, slamming the door loudly, just no deal Brexit. After all, no one can predict the consequences. But at the same time, his support in the parliament is melting right before our eyes, and it came to the point that the conservatives lost their majority in the House of Commons by the evening, which now intends to consider the possibility of a new postponement of Brexit. However, not everything is so bad, since for speculators, prolongation of this story is the best option for the development of events. In conditions of total confusion and unpredictability, volatility just roll over, as well as the opportunity to earn extra money. Moreover, given how confidently the pound is going down, only occasionally demonstrating attempts to increase, it's quite easy to earn money - play banally against the pound, not paying attention to the periodically upward movements. They are more like dying pain and do not change anything. This story also affects Europe, which, naturally, negatively affects the single European currency. However, there are enough problems on the continent without playful Britons. Just look at producer prices, whose growth rates have slowed from 0.7% to 0.2%. And, looking at this, it becomes clear that inflation simply has nothing to grow. This means that the European Central Bank has even more reasons for easing monetary policy. Also, taking into account the fact that less than two months remain before Christine Lagarde succeeds Mario Draghi as head of the European Central Bank, there are suspicions that the easing of monetary policy will happen in the near future. Let's just say that Mario Draghi can pretend to be a gentleman, and lower the refinancing rate right before his departure in order to divert criticism from the fragile lady. However, the fascinating process of increasing the cost of portraits of the dead American presidents led to an unexpected overbought, and the market needed at least some reason to correct the imbalances. That is, a local correction was needed, which happened almost immediately after the auction opened in the United States. The reason for the rebound was the American statistics. True, not immediately, since the Markit data was treacherously better than predicted, and if the preliminary data on the index of business activity in the manufacturing sector showed a decrease from 50.4 to 49.9, then the final data showed a decrease to 50.3. And although this is still a decrease, the indicator turned out to be higher than 50.0 points, which means that all talk of an impending recession clearly does not hold water. Although similar data from ISM came to the rescue, showing a decrease in the index from 51.2 to 49.1. Thus, traders joyfully seized on such sad data and calmly carried out a long overdue correction, somewhat correcting the imbalances. US Markit Manufacturing PMI: Nevertheless, no correction does not change the general picture, which currently consists of the explicit desire of the European Central Bank to soften monetary policy and the explicit unwillingness to do so on the part of the Federal Reserve System. Yes, and no one will let forget about the confusion with Brexit. So the dollar will continue its confident move, especially since today, there will be a very good reason for this in the form of retail sales in Europe. The growth rate of which should slow down from 2.6% to 2.0%. It turns out that not only inflation is stably low, but sales are not growing properly. However, this alignment threatens the profits of companies, which should not be allowed, also no investor will buy shares in companies for which profit is not growing, and even shows a downward trend. Retail Sales in Europe: Thus, the single European currency can continue to decline today, and the reference point is 1.0925. A purely British farce is also not going anywhere, so thanks to the titanic efforts of politicians, the pound may decline to 1.2050. |


| You are subscribed to email updates from Forex analysis review. To stop receiving these emails, you may unsubscribe now. | Email delivery powered by Google |
| Google, 1600 Amphitheatre Parkway, Mountain View, CA 94043, United States | |
No comments:
Post a Comment