
Forex analysis review |
- USD/CAD: faceless Nonfarm and the growth of the Canadian labor market
- September 6, 2019 : EUR/USD Intraday technical analysis and trade recommendations.
- September 6, 2019 : GBP/USD Intraday technical analysis and trade recommendations.
- British Pound Suffering: Excessive volatility and vague prospects
- Trading recommendations for GB USD currency pair – prospects for further movement
- Euro believes the split in the ranks of the ECB
- BTC 09.06.2019 -Major resistnace on the test and bearish divergence on the MACD oscillator
- EUR/USD for September 06,2019 - More upside potential
- Gold 09.06.2019 - Gold in the buy zone, more upside in play
- Oil under attack - Citi
- GBP/USD: plan for the American session on September 6. The growth of the pound stopped near the resistance of 1.2345 but
- EUR/USD: plan for the American session on September 6. The bears returned to the level of 1.1021 on a weak report on GDP
- AUD/CHF: Take-profit!
- Markets will closely monitor data from Europe and the US, as well as the decision of the Central Bank of the Russian Federation
- Trading strategy for Bitcoin on September 6th. Bitcoin will still try to beat the level of $11000
- Trading strategy for EUR/USD and GBP/USD on September 6th. Support for European currencies can be provided by Jerome Powell
- EUR/USD facing bearish pressure from resistance, potential for drop!
- NZD/USD right on big resistance, prepare for a drop!
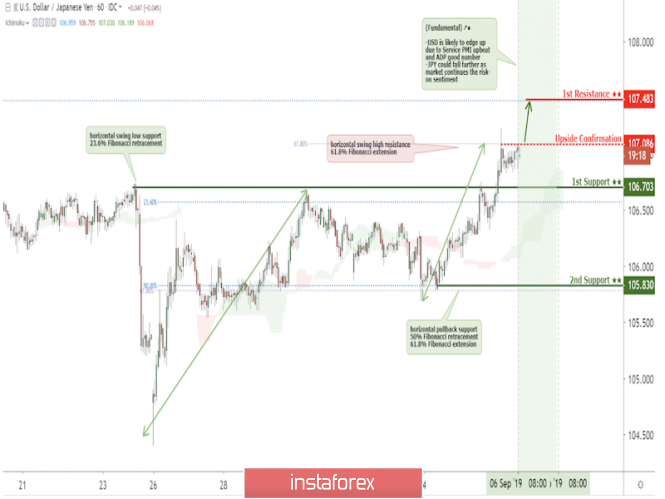
- USD/JPY approaching upside confirmation, potential bounce!
- Technical analysis of EUR/USD for September 06, 2019
- Review of EUR / USD and GBP / USD pairs on 09/06/2019: Family Drama
- Strong ISM and ADP reports will not help the dollar, euro and pound may rise higher on Friday
- Trading recommendations for the EURUSD currency pair - prospects for further movement
- Analysis of EUR / USD and GBP / USD for September 6. Non-farm payrolls can send euros down again
- Indicator analysis. Daily review on September 6, 2019 for the GBP / USD currency pair
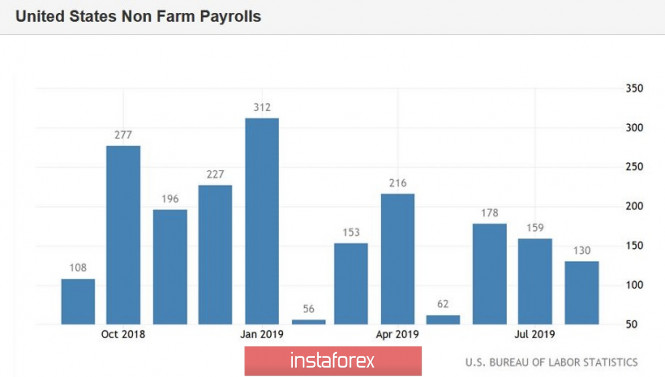
| USD/CAD: faceless Nonfarm and the growth of the Canadian labor market Posted: 06 Sep 2019 08:32 AM PDT Traders were not impressed by American Nonfarm. After some hesitation, investors still decided that "the glass is half empty" than vice versa, after which they began to gradually get rid of the US dollar. However, this process was uneven: if the pair EUR/USD, GBP/USD, USD/JPY remained in place, showing only impulsive, but extremely short-term price "delays", then the pair USD/CAD went down to the bottom, breaking the resistance level of 1.3200 (the lower line of the Bollinger Bands indicator on D1), trying to finally gain a foothold in the framework of the 31st figure. Such a violent reaction is also due to the release of "Canadian Nonfarms." However, first things first. Data on the US labor market largely fell short of forecast values. The number of people employed in the non-agricultural sector increased by 130 thousand with a growth forecast of 160 thousand. The indicator has been declining for the second consecutive month: the worst situation was only at the beginning of this year when Nonfarm twice fell below the level of one hundred thousandths (February and May). The increase in the number of people employed in the private sector of the economy has also slowed down for the second month in a row, as has an increase in the number of people employed in the manufacturing sector of the economy. All these indicators came out in the "red zone", not meeting the expectations of most analysts.
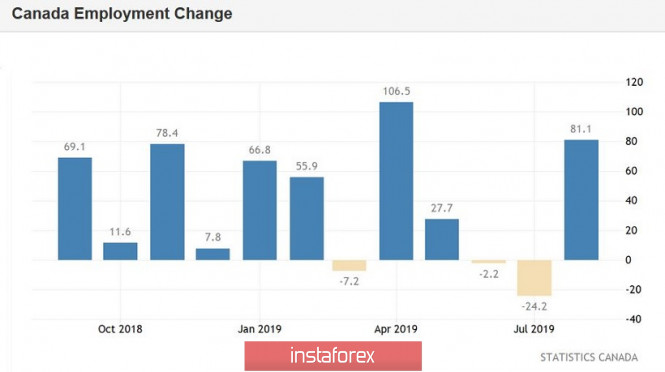
The unemployment rate remained at the same level (3.7%), but this indicator is a lagging economic indicator, so today's figures did not have any effect on traders. The only undeniable advantage of today's release is salaries. The average hourly wage level increased both on a monthly and an annual basis, while experts expected a decline in this indicator. This fact restrained the downward dynamics of the US currency in many dollar pairs. Also, traders are waiting for the speech of the head of the Fed Jerome Powell, who will announce at 17:30 (London time) in Switzerland his speech on the prospects of monetary policy. He can focus on the negative consequences of the global trade conflict, leaving macroeconomic reports "out of the blue". In this case, the greenback will increase its dive. Returning to the American Nonfarm, it is worth noting that we can talk about certain "alarm bells". So, according to most experts, while the American economy creates 200,000+ jobs per month, there is no need to worry about the labor market. Two hundred thousand is a well-established "health indicator", which is used by experts, traders and the Fed. Analysts have repeatedly voiced this figure in the context of assessing the state of the American labor market. Therefore, a significant deviation from this target has a very significant impact on the market. The last time Nonfarm crossed the 200th line in April (and before that – only in January). The downward trend of this indicator may alert members of the US regulator, many of which have softened their position recently. Now the fate of the interest rate is at stake, therefore, the contradictory dynamics of Nonfarm are considered primarily through the prism of the Fed's monetary policy prospects. There are growing fears in the market that the Fed will resort to aggressive monetary easing measures, and dollar bulls were in dire need of strong labor market data today. But the published release can be called very mediocre, so the intrigue of the September meeting remains. But the Canadian dollar has "survived" the September meeting of the Central Bank of Canada while strengthening more than 150 points. Stephen Poloz, contrary to numerous rumors, did not announce the interest rate cut, and indeed left this question in the air, in fact: according to him, everything will depend on the dynamics of the trade war, as well as on the incoming data. And if the prospects for resolving the global conflict look vague (the parties agreed only on a high-level meeting in October), the incoming Canadian data continue to please the bulls of the USD/CAD pair. For example, the growth of the Canadian economy came out in the "green zone", exceeding the forecast values. In particular, GDP for the quarter grew by 3.7% year-on-year (with growth forecast to 3%) – this is the best result since the second quarter of 2017. Before that, inflation indicators were published, which also showed good growth. The data published today on the growth of the labor market in Canada only added to the positive picture. The unemployment rate remained at the same level (5.7%), and the number of employed jumped by 80 thousand, with the forecast growth of only 18 thousand. Although these dynamics were mainly due to the increase in underemployment, this fact did not bother traders. The published figures suggest that the Canadian Central Bank can continue to maintain a wait-and-see attitude against the background of the "dovish" intentions of the Federal Reserve.
Thus, if Jerome Powell does not encourage dollar bulls with his rhetoric today (which is unlikely), the USD/CAD pair will retain the potential for further decline. After overcoming the support level of 1.3160 (the lower limit of the Kumo cloud on D1), the price will move to the next support level – 1.3090, which also corresponds to the lower limit of the Kumo cloud, but on the weekly chart. The material has been provided by InstaForex Company - www.instaforex.com |
| September 6, 2019 : EUR/USD Intraday technical analysis and trade recommendations. Posted: 06 Sep 2019 08:03 AM PDT
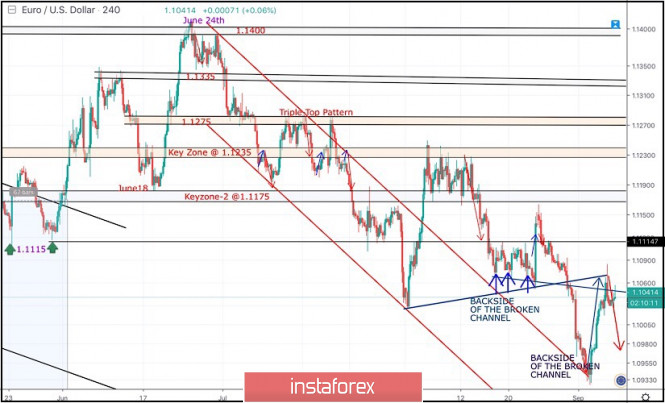
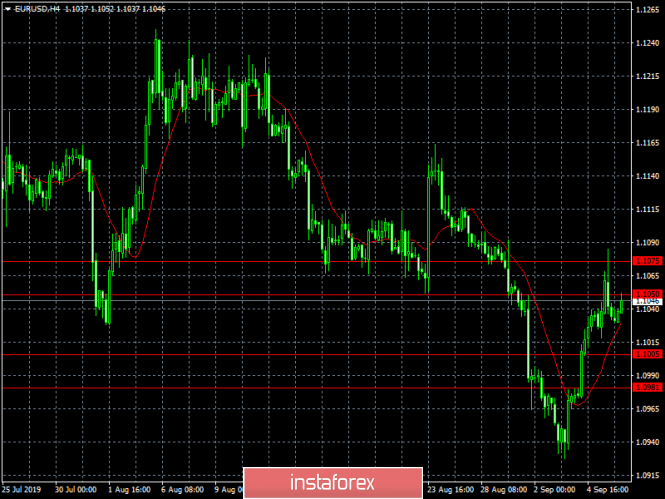
Back in June 24, the EURUSD looked overbought around 1.1400 facing a confluence of supply levels which generated significant bearish pressure over the pair. Shortly after, In the period between 8 - 22 July, a sideway consolidation-range was established between 1.1200 - 1.1275 until a triple-top reversal pattern was demonstrated around the upper limit. Then, Evident bearish momentum (bearish engulfing H4 candlestick) could bring the EURUSD below 1.1175. This facilitated further bearish decline towards 1.1115 (Previous Weekly Low) then 1.1025 (the lower limit of the depicted recent bearish channel) where significant signs of bullish recovery were demonstrated. Shortly-After in Mid-August, the EUR/USD has been trapped between 1.1235-1.1175 for a few trading sessions until bearish breakout below 1.1175 occurred on August 14. Bearish breakout below 1.1175 promoted further bearish decline towards 1.1075 where the backside of the broken bearish channel has provided temporary bullish demand for sometime (Bullish Triple-Bottom pattern). Bullish persistence above 1.1115 was needed to confirm the short-term trend reversal into bullish. However, the depicted Triple-Bottom pattern was invalidated especially after the EURUSD pair bulls have failed to establish Bullish persistence above 1.1115. Moreover, the recently established short-term uptrend line has been invalidated as well thus rendering the short-term outlook as bearish. By the end of last week's consolidations, a quick bearish decline was demonstrated towards 1.0965 - 1.0950 where the backside of the broken channel came to meet the EURUSD pair again. Risky traders were advised to look for a valid BUY entry anywhere around the price levels of 1.0950. All T/p levels were successfully reached. Trade recommendations : Conservative traders should be looking for a valid SELL entry around the current price levels 1.1050-1.1070. S/L should be placed just above 1.1115 while target levels to be located at 1.1025, 1.0988 and 1.0935. The material has been provided by InstaForex Company - www.instaforex.com |
| September 6, 2019 : GBP/USD Intraday technical analysis and trade recommendations. Posted: 06 Sep 2019 07:56 AM PDT
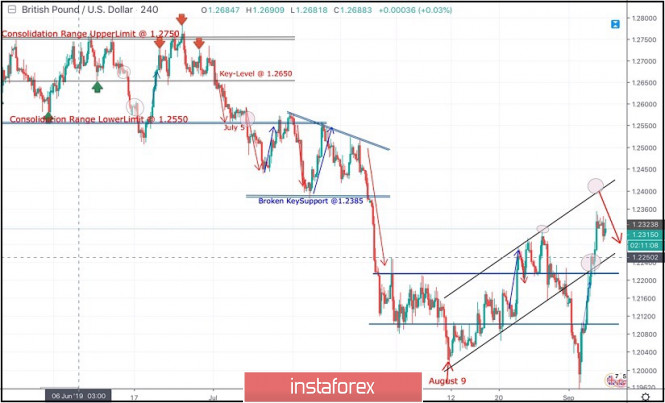
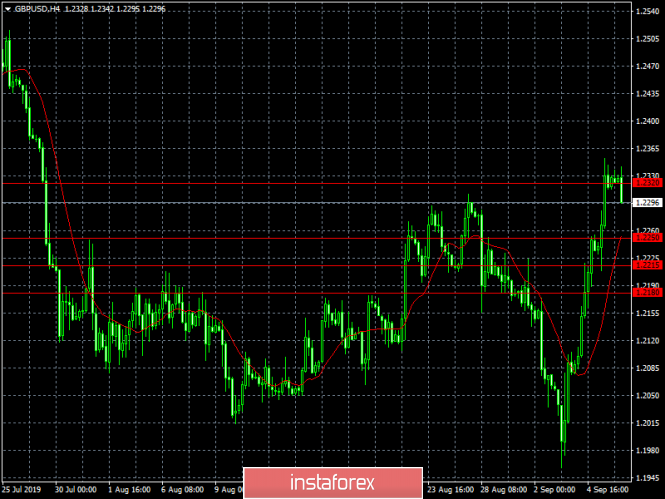
On July 26, Bearish breakdown below 1.2385 (Wedge-Pattern Key-Level) facilitated further bearish decline towards 1.2320, 1.2210 and 1.2100 which corresponded to significant key-levels on the Weekly chart. In Early August, another consolidation-range was temporarily established above 1.2100 before August 9 when temporary bearish movement was executed towards 1.2025. Recent bullish recovery was demonstrated off the recent bottom (1.2025). This brought the GBP/USD pair back above 1.2100 (Lower limit of the recently established consolidation-zone) within the depicted short-term bullish channel. As expected, further bullish advancement was demonstrated towards 1.2230 then 1.2280 where recent bearish rejection was demonstrated (near the upper limit of the recent movement channel). Bullish persistence above 1.2160 (the recent consolidation range pivot-point) was needed to enhance further bullish advancement. However, recent bearish rejection was demonstrated around 1.2200-1.2215 (upper limit of the consolidation range). That's why, another quick bearish decline took place towards 1.2100 then 1.2000 (corresponding to a prominent bottom established on August 9). Earlier this week, early signs of bullish recovery (Bullish Engulfing candlesticks) were manifested around 1.1960 bringing the GBPUSD back above 1.2100. As expected, further bullish advancement was demonstrated towards 1.2200 where the GBPUSD pair looked overbought. However, further bullish momentum was demonstrated towards 1.2320 bringing the pair back inside the depicted movement channel again. Further bullish advancement should be expected towards 1.2390-1.2400 where the upper limit of the current movement channel comes to meet the pair. Trade Recommendations: Conservative traders should wait for the current bullish movement to pursue towards 1.2390-1.2400 (upper limit of the depicted movement channel) for a valid SELL entry. T/P level to be placed around 1.2300, 1.2250 then 1.2220 while S/L should be placed above 1.2250. The material has been provided by InstaForex Company - www.instaforex.com |
| British Pound Suffering: Excessive volatility and vague prospects Posted: 06 Sep 2019 07:37 AM PDT Market participants and investors have no illusions about the British currency. Recently, many analysts have called the pound a hero of political drama. They agree on a further decline in the fog of Albion. The British pound has become hostage to the political situation in the country. Its high volatility is largely due to instability relative to the upcoming Brexit. Serious passions are boiling around Britain's exit from the European Union. On Thursday, September 5, members of parliament tried to thwart Prime Minister Boris Johnson's decision to leave the Euroblock without a deal. The representative of the Conservative Party and Prime Minister's brother Joe Johnson left the party ranks. The result of these events was a sharp increase in the pound. On Thursday evening, the British currency peaked at $ 1.2346. Analysts predict her 6% rise in the process of agreeing on a Brexit deal. According to Daniel Trum, currency strategist at UBS Wealth Management, the pound may show significant growth if Brexit is postponed until January 2020. Many investors and traders remain cautious about the prospects for the British currency. They are concerned about excessive volatility due to political uncertainty in the country. Experts compare the British pound with the Mexican peso, which has similar problems. Some analysts ironically call the pound "British peso." They emphasize that the hidden volatility of the Foggy Albion currency, expected in the next two months, was higher for the pound than for the peso. At the same time, strong intraday fluctuations of the British currency became more frequent, indicating the growing problems associated with the country's exit from the EU. Experts draw attention to the excessive activity of the "swing" of the pound when intraday fluctuations reached 1.2% for two consecutive trading sessions. This is an extremely alarming indicator, analysts say. In the price of the British currency, markets place a high risk of powerful price fluctuations in the near future. Note that over the past five years, the latent pound volatility has exceeded the volatility of the Mexican peso three times, and the active growth of the "British" has always been due to Brexit. Investors' desire to abandon the pound due to growing political problems led to a reduction in liquidity and exacerbated currency fluctuations. According to the calculations of Nick Sguropoulos, a currency expert at Barclays, at the moment the market price includes a 40% probability of Britain leaving the EU without a deal. For the pound, this means the prevalence of bad news over good. The analyst is confident that without a deal Brexit will bring down the British currency to $1.09. Experts of the largest bank Nomura agree with him. If the UK does not agree to the deal, they predict a strong decline to $1.01 and pound drop - almost to parity with the US dollar. Currently, the currency of Misty Albion is in the range from 1.2316 to 1.2323. The GB /USD pair is trading in a narrow range of consolidation at the top of the growth wave. At the same time, analysts do not exclude the appearance of the first impulse to decrease to 1.22. In general, the situation with the pound is seen by experts as not too rosy, but not without certain prospects. Only they, unfortunately, remain vague for the British currency. The material has been provided by InstaForex Company - www.instaforex.com |
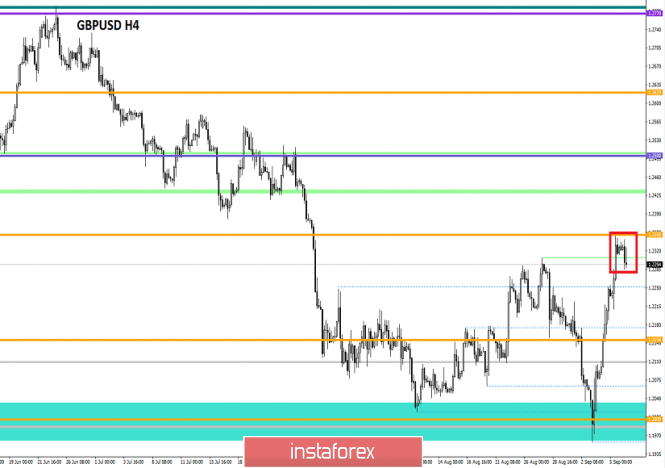
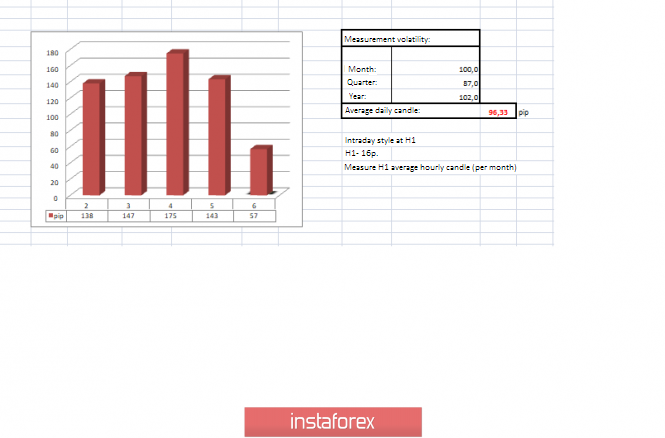
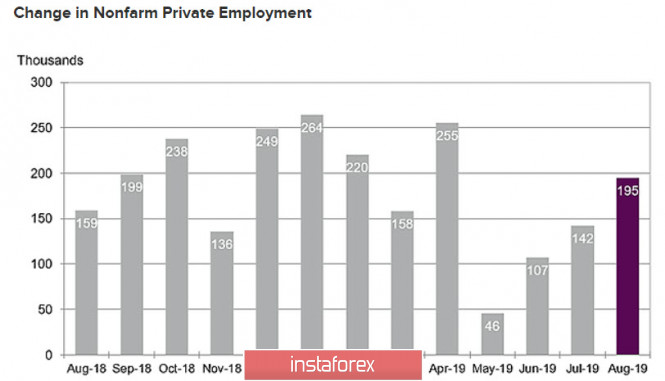
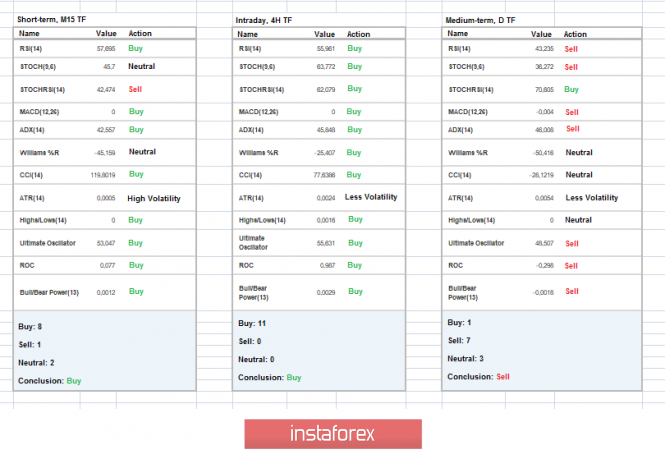
| Trading recommendations for GB USD currency pair – prospects for further movement Posted: 06 Sep 2019 07:32 AM PDT The pound/dollar currency pair for the last trading day showed ultra-high volatility of 143 points and this is the fourth day in a row; how can you not be happy when the average daily volatility is around 150 points. From technical analysis, we see just a vertical line. It is more than 360 points of upward movement without any rollbacks or stagnation. It is hard to imagine how much the long positions were overheated, it's hard to imagine the slightest rustle to destroy this tower of Babel. The level of 1.2350, there is a distinct slowdown with the formation of consolidation. What to say – FOMO works wonders. As discussed in the previous review, only speculators work now, as everyone else is wary of such fluctuations. The tactics are the same, we monitor the information and news flow and try to identify the information as soon as possible. I'll open a little secret, in the era of the Internet and social networks, monitor Twitter and you will be happy. Examining the trading chart in the general plan (day time period), we see that the quotation managed to go just above the correction peak on August 27 (1.2307), which, frankly, is a little worrying if there will be a repetition of the period from the end of 2016 and the beginning of 2017. While I attribute everything that is happening to the panic of the market and do not exclude the possibility of a global downward trend, still nothing has changed in Britain, but the problems have only increased. The news background of the past day had the report of the ADP on employment in the private sector of the United States, where, without exception, everyone expected a decrease in growth from 156K to 149K, and as a result, they got the opposite picture. According to the report, employment increased by 53 thousand and amounts to 195 thousand (Aug). At the same time, a lot of summary statistics came out in the States, and surprisingly, all of it was only in bright colors. Nothing happened to the US dollar at that point. The quote stood still, so high that it would be a sin not to fall. As you may have guessed, the fault, as always, was the information background, which cut the entire news stream to the root. So again, the same thing happened, floundering in a puddle of "Scandals, Intrigues, Investigations" dedicated to the divorce proceedings. Our beloved Prime Minister Boris Johnson managed to suffer two crushing defeats in just a few days of autumn: Postponement of Brexit; Loss of conservative votes. So this show did not end, yesterday Boris's brother announced his resignation from parliament, as well as from the post of minister for university and science. Joe Johnson said on his twitter – "In recent weeks, I have been torn between family loyalty and national interests. These are insoluble contradictions. It's time for someone else to take my place as MP and Minister." @JoJohnsonUK. In turn, Michel Barnier, the EU's chief negotiator for Brexit, said the talks were "paralyzed." According to Barnier, the party interested in replacing the "backstop" clause has not yet submitted any proposals. At the same time, information was received from EU deputies regarding the delay. The EU is ready to consider postponing Brexit, but France and other countries are likely to want clear explanations from Britain about how much longer it may take for a positive result, and legal guarantees that the UK will not undermine EU business. Today, in terms of the economic calendar, we are waiting for the report of the United States Department of Labor, where, according to forecasts, they expect a reduction in the number of people employed in the non-agricultural sector from 164K to 160K. But if you refer to the ADP report, then it could be the other way around, and the indicators will come out pretty good. Maybe this time, the GBPUSD pair will not ignore the statistics and there will be a reaction on the dollar. The upcoming trading week in terms of the economic calendar expects to be no less hot. There will be a considerable package of data on Britain and the United States but the main round of volatility will be tied to a spontaneous information background, and it is scheduled for Monday. So, on September 9, two votes were scheduled in the British Parliament at once. The first vote on the bill, excluding the possibility of Britain's exit from the EU without a deal, forcing to take a delay. The second vote on the initiative of Boris Johnson in early elections. Thus, we are waiting for the continuation of the banquet and high volatility. The most interesting events displayed below: Monday, September 9th United Kingdom 09:30 London time – Production in the manufacturing industry (y/y) (July): Forecast. -1.1% United Kingdom 09:30 London time - Volume of construction in the UK (YoY) (July) Tuesday, September 10th United Kingdom 09:30 London time – Average wage excluding bonuses (July): Prev 3.9% – 3.8% forecast United Kingdom 09:30 London time – Average wage including bonuses (July): Prev 3.7% – 3.7% forecast United Kingdom 09: 30 London time – Unemployment rate (July): Prev 3.9% – 3.8% forecast USA 15:00 London time – The number of open vacancies in the labor market JOLTS (July): Prev. 7.348M Wednesday, September 11th USA 13:30 London time – Producer price index (PPI) (y/y) (Aug): Prev 1.7% – 1.7% Thursday, September 12th ECB meeting, followed by a press conference USA 13:30 London time – Core consumer price index (CPI) (y/y) (Aug): Prev 2.2% – 2.2% forecast Friday, September 13th USA 13:30 London time – Retail sales (y/y) (Aug): Prev 3.4% – 3.2% forecast Further development Analyzing the current trading chart, we see that the pound froze in anticipation, is not just in a substantial overbought, but in a stunning one. The fluctuation within the level of 1.2350, followed by consolidation, clearly reflects the uncertainty and the desire to adjust as soon as possible. Traders took a waiting position, preparing to jump into the descending candles. It is likely to assume that if the data on the number of employed in the non-agricultural sector of the United States will be better than forecasts and the pound/dollar pair will not ignore them, then against the background of the excessive overbought, a recovery process can occur with considerable amplitude. Traders are considering a primary recovery towards the level of 1.2150. There is one more plot, this complete "ignore" of everything that is happening and freezing within the level of 1.2350 (+/- 70 p.), where the pair will continue to work exclusively on incoming information. Thus, be prepared for this development of the plot. Based on the above information, we derive trading recommendations:
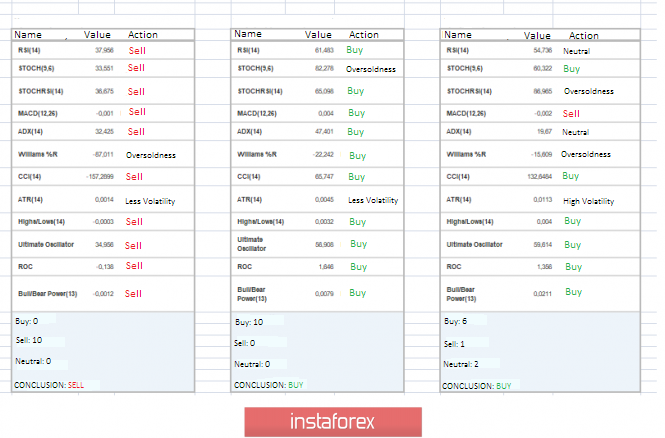
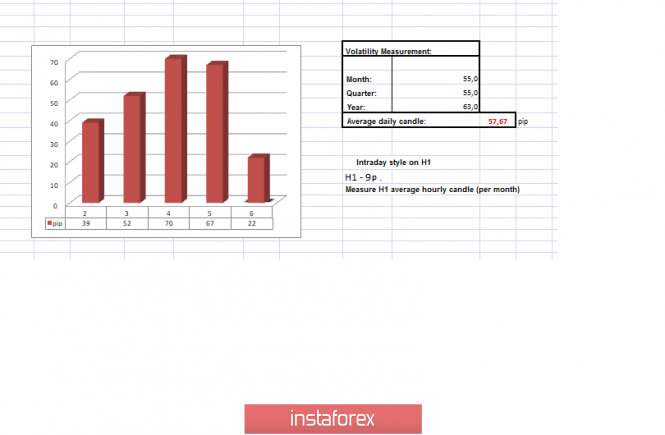
Technical analysis Analyzing the different sector of timeframes (TF), we see that the indicators in the short term variably signal a downward interest, but are still in stagnation. The intraday and medium-term outlook signal an upward interest due to the stunning leap of days past. Volatility per week/Measurement of volatility: Month; Quarter; Year The measurement of volatility reflects the average daily fluctuation, with the calculation for the Month / Quarter / Year. (September 6 was based on the time of publication of the article) The volatility of the current time is 57 points, which is a low indicator for this period. If we refer to the indicators from the beginning of the month, we have an average daily level of about 150 points, wherein the case of maintaining at least the slightest mood, the volatility of the current day will exceed the average daily figure. Key level Resistance zones: 1,2350**; 1,2430; 1,2500; 1,2620; 1,2770**; 1,2880 (1,2865-1,2880)**. Support zones: 1,2150**; 1,2000***; 1,1700; 1,1475**. * Periodic level ** Range level *** The article is based on the principle of conducting transactions, with daily adjustments. The material has been provided by InstaForex Company - www.instaforex.com |
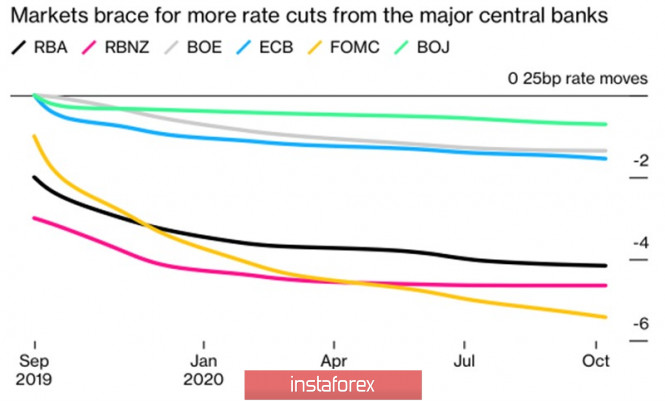
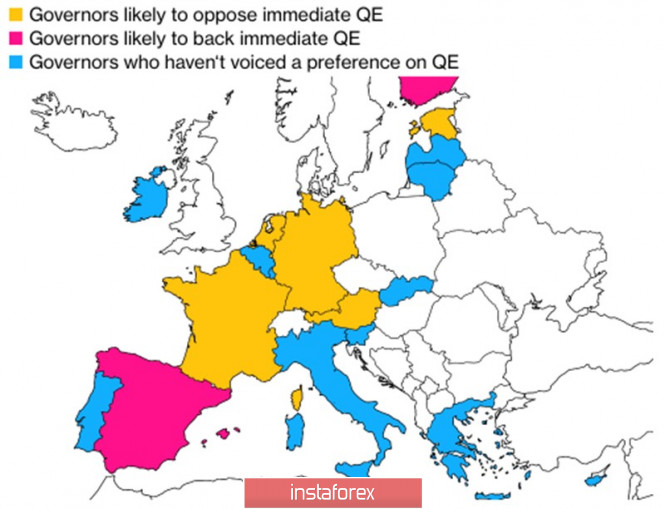
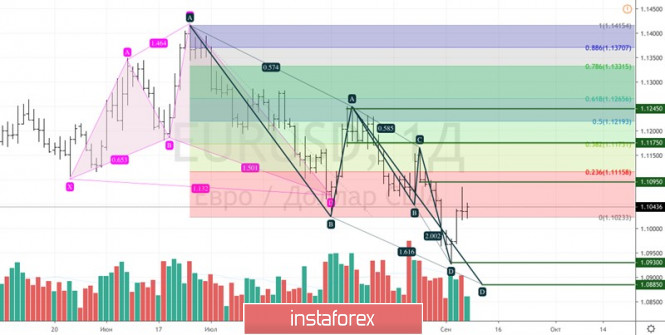
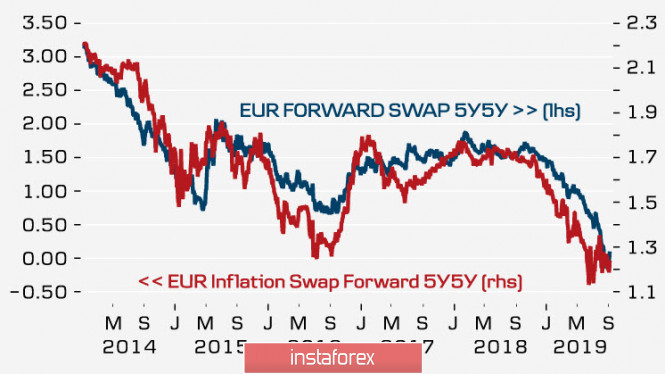
| Euro believes the split in the ranks of the ECB Posted: 06 Sep 2019 07:26 AM PDT This scenario often happens where investors are looking forward to one event, and completely different markets are moving. The US labor market report for August left a mixed impression. Employment outside the agricultural sector increased by 130 thousand, which is below the average for January-July (165 thousand). On the contrary, salaries accelerated to + 0.4% m/m and as a result, investors received a new puzzle. What if the inflation in the United States accelerates to 3% under the influence of the weakening monetary policy of the Fed? The main drivers of EUR/USD quotes changed during the first week of autumn, when the hawkish speeches of the ECB envoys, weak statistics on business activity in the US manufacturing sector, as well as good news from Rome and London. Contrary to the desire of Prime Minister Boris Johnson (who voted to prolong the transition period for 3 months) to "leave the EU or die" , and the new-old head of the Italian government, Giuseppe Conte, announced the formation of a new pro-European cabinet. Reducing political risk has extended a helping hand to both the pound and the euro, especially since a split is planned in the ranks of the ECB. Investors were sure that the European Central Bank was following the path of its colleagues from other countries, which had already reduced 32% cumulative rates by almost 14% since the beginning of the year. Markets expect deposit rates to decrease by 10 bp and the asset purchase program to resume by € 30 billion per month. Alas, judging by the speeches of the representatives of Germany, the Netherlands, France and Estonia, the consensus in September, Mario Draghi will be extremely difficult to achieve. The hawks are confident that deflation is still too far away, so a large-scale monetary stimulus is not required. Of particular interest is the position of the head of the Bank of France, Francois Villeroy de Galhau, who believes that there is no need to use all the tools at hand at the same time. Monetary expansion of central banks "Doves" and "hawks" of the ECB The ECB meeting is rightfully considered the key event of the week by September 13, but investors will pay attention to a serious package of macro statistics in the States. In particular, inflation and retail sales. When Donald Trump launched a massive fiscal stimulus and launched trade wars, people were frightened by an uncontrolled rise in consumer prices. Time passed, but they were not in a hurry to disperse. However, in August, Bloomberg experts expect core inflation to rise to 2.3%. If it is even higher, should the Fed consider whether it is necessary to reduce rates? No less significant is the release of retail sales data. The indicator allows you to determine consumer activity, and the contribution of consumers to GDP is difficult to overestimate. If everything goes well with retail, the economy in 2019 is quite capable of expanding by more than 2%, which makes the easing of the Fed's monetary policy inappropriate. Technically, the EUR/USD quotes rebound from the convergence area of 1.089-1.093 is a signal that the initiative is in the hands of the bulls. Nevertheless, the "bears" do not lose hope of returning to the game but first, they need to lower the pair below 1.1015. EUR / USD daily chart  |
| BTC 09.06.2019 -Major resistnace on the test and bearish divergence on the MACD oscillator Posted: 06 Sep 2019 07:13 AM PDT Bitcoin 4H time-frame:
MACD oscillator on the 4H time-frame is on the bear divergence, which is first sign for potential downward rotation. Important resistance at the price of $10,860 is holding so far. I didn't find any stronger reaction after the most recent Non-Farm employment change, which is indication of potential weakness for the BTC. Buyers should be careful near the $11,000 cause it is strong resistance and there is bear divergence in the background on the MACD oscillator. Bitcoin Forecast and recommendations for traders: Bitcoin is in overall consolidation phase but most recently I found bear divergence on the MACD oscillator, which is sign that there is chance for more downside and potential of $10,392 or $9,453. Thus, I recommend selling cryptocurrency with the first target at $10,392 The material has been provided by InstaForex Company - www.instaforex.com |
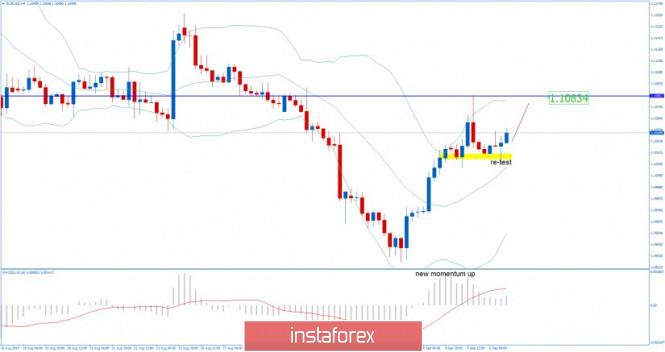
| EUR/USD for September 06,2019 - More upside potential Posted: 06 Sep 2019 06:46 AM PDT EUR/USD has been trading sideways at the price of 1.1050 but there is still upward pressure from the background, which is sign for potential new upward wave. There is potential for re-test of 1.1083.
Blue horizontal lines – Resistance level and upward objective Yellow rectangle – Short-term support Purple rising line – Expected path I found rejection of the middle Bollinger band (20SMA) and strong and potential new wave up. Key support is at 1.1025 and resistance at $1.1083. Bears need to be very cautious as there is still upward pressure in the background. As long as the EUR is holding above 1.1018, there is a chance for more upside. The material has been provided by InstaForex Company - www.instaforex.com |
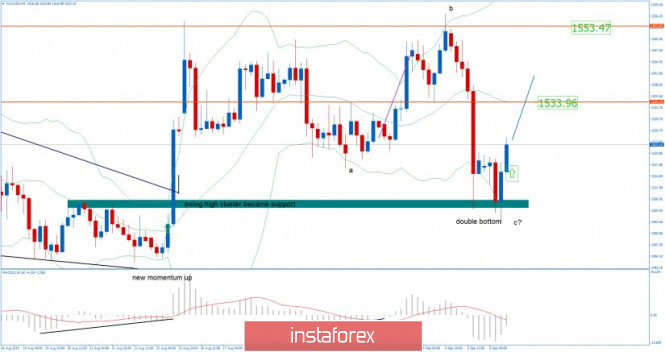
| Gold 09.06.2019 - Gold in the buy zone, more upside in play Posted: 06 Sep 2019 06:30 AM PDT Gold has been trading downwards in past 24hours but it found support at the level of $1,505, which is very important level for the Gold. I still see more upside on the Gold and potential re-test of the $1,533 and $1,553.
Red horizontal lines – Important resistance levels and upward objectives Green rectangle - major support area Green rising line – Expected path I found double bottom confirmed pattern and strong rejection of the key support, which is for me sign that new money started with buying. Key support is at $1,504 and resistance at $1,533 and $1,553. Bears need to be very cautious as there is strong aggressive buying and potential end of the downward correction ABC. As long as the Gold is holding above $1,500 there is a chance for potential test of $1,553. Don't forget that short-term and long-term trends are bullish.Watch for buying opportunities on the dips on lower frames 5/15 for better timing.The material has been provided by InstaForex Company - www.instaforex.com |
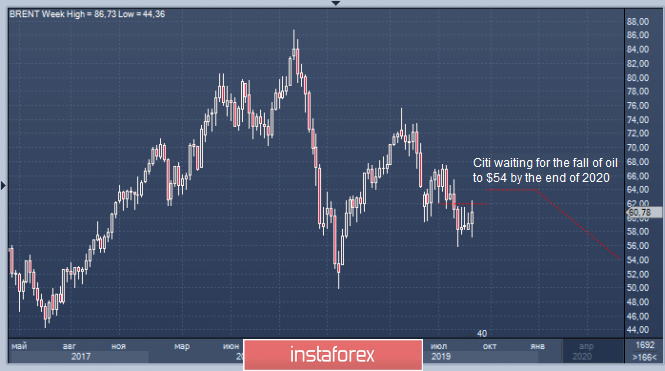
| Posted: 06 Sep 2019 06:23 AM PDT Assessing the current situation in the black gold market, analysts at the largest Citi bank are pessimistic. They are confident that the price of oil will fall amid continued trade wars, casting doubt on the achievement of an agreement between the United States and China. Experts draw attention to the fact that so far there have been no positive changes in the framework of the trade confrontation. Moreover, Beijing and Washington exchanged new blows in the form of trade duties and the next round of negotiations is scheduled for October this year. Citi analysts believe that investors will continue to assess the growth prospects of the global economy as negative, and the situation with the trade conflict between the US and China adds fuel to the fire in this matter. Experts do not exclude that this confrontation will last until the end of 2020 when the election campaign starts in America. Citi expects a slowdown in oil demand next year. Experts also downgraded the forecast for Brent from the previous $72 to $62 per barrel in the third quarter of 2019. In the fourth quarter of this year, it is expected to decline to $64 per barrel instead of the previous forecast at $74. By the end of 2020, bank analysts predict a reduction in the cost of raw materials to $54 per barrel despite the extension of the OPEC + agreement. The pessimistic picture is slightly diluted by the positive points that Citi points out. These include low oil production growth in the United States and a slight decrease in raw material reserves in the country. In general, the situation cannot be called dramatic since the drop in oil prices is only a reflection of global financial changes, experts emphasized.  |
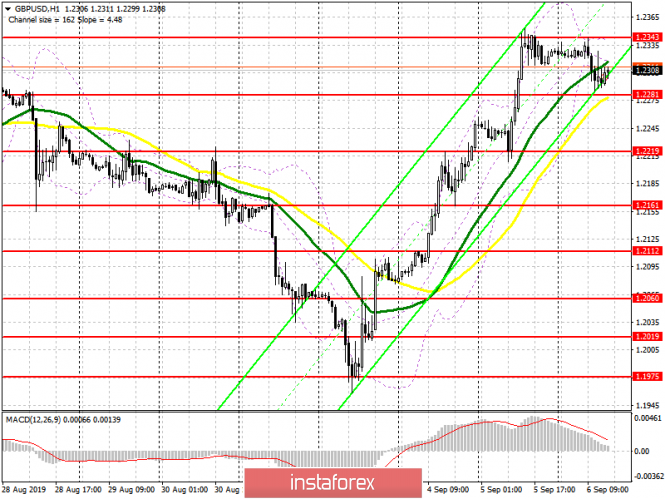
| Posted: 06 Sep 2019 05:52 AM PDT To open long positions on GBP/USD, you need: From a technical point of view, nothing has changed. Pound buyers, although counting on continued growth, but this will be extremely difficult to do. The problem remains the resistance of 1.2343, and only its break will provide a larger upward trend n the area of 1.2387 and 1.2427, where I recommend taking the profit. However, it is best to make more rational purchases today after a downward correction to the support area of 1.2281, subject to the formation of a false breakdown there, or to a rebound from a minimum of 1.2219, which can be updated after a good report on the state of the US labor market is released. To open short positions on GBP/USD, you need: The bears tried to push the support of 1.281 in the first half of the day, but nothing came of it. An important task for sellers of the pound remains consolidating below 1.2281, as only such a scenario will lead to larger profit taking and to upgrade low of 1.2219, where I recommend taking the profit. If the bullish momentum is maintained above the resistance of 1.2343, it is best to consider new short positions after updating the highs of 1.2387 and 1.2427. Signals of indicators: Moving Averages Trading is around 30 and 50 moving averages, indicating market uncertainty. Bollinger Bands Volatility is low, which does not give signals to enter the market.
Description of indicators
 |
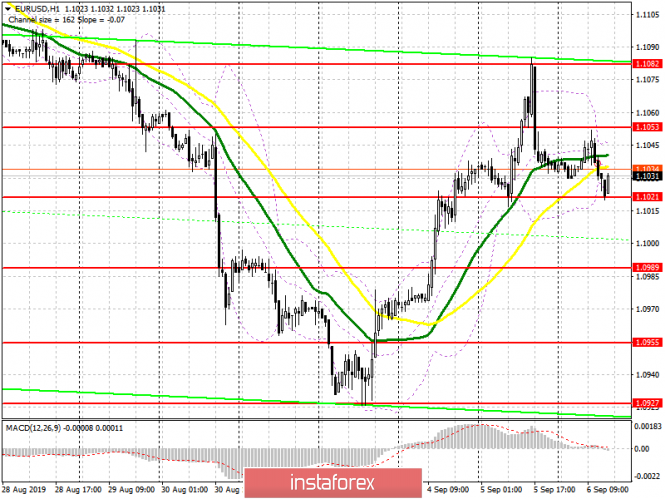
| Posted: 06 Sep 2019 05:52 AM PDT To open long positions on EURUSD, you need: A weak report on the growth of the eurozone economy in the 2nd quarter of this year, which was revised downward, led to an update of the support of 1.1021, from which I recommended to open long positions in the morning on the condition of a false breakdown. At the moment, while trade is conducted above the range of 1.1021, the bulls' goal is to break the level of 1.1053, which will lead to updating yesterday's high in the area of 1.1082, where I recommend taking the profits. In the scenario of the EUR/USD decline in the North American session below the level of 1.1021, we can only count on support in the area of 1.0989. To open short positions on EURUSD, you need: An important task for bears remains a breakthrough in the support of 1.1021, which may occur after the release of fundamental statistics on the American labor market, which will push the pair below the lows of 1.0989 and 1.0955, where I recommend taking the profit. In the scenario of a return to the resistance level of 1.1053 in the afternoon, you can open short positions provided that there is a false breakdown there, or a rebound from the maximum of 1.1082, which kept the pair from further growth yesterday. Signals of indicators: Moving Averages Trading is around 30 and 50 moving averages, indicating the lateral nature of the market. Bollinger Bands Volatility is low, which does not give signals to enter the market.
Description of indicators
 |
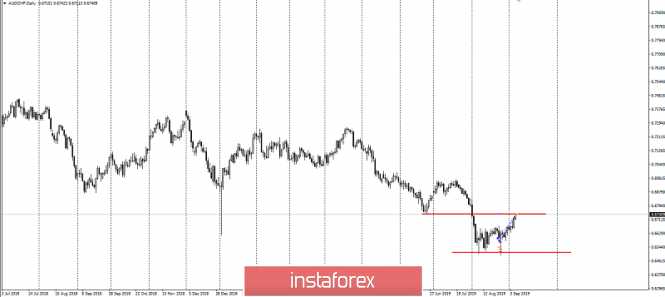
| Posted: 06 Sep 2019 05:01 AM PDT Good afternoon, dear traders. Time to collect profit! The trading idea for the AUD/CHF pair has fully worked out. The instrument reached the target resistance level of 0.67400. We're fixing the profits and I came in parts. So, at the average price, the profit was +150p! In my opinion, the very idea of rejecting the name of this cross was the most technical, because these tools do not differ in beautiful figures and trends. The main role in this trading idea was played by several factors. Firstly, this tool has a very clear idea of working out kickbacks after medium and maximum passes. Those who follow my cross analytics know this very well. Secondly, the Bank of Australia left the interest rate unchanged amid falling rates in New Zealand. And thirdly is to pick up the instrument that has a lot of "noise" after the breakdown of not only the past but also of 2015. All these factors played at the same time and both of us made good money. There is another very important point. Having been trading for many years, I came to understand that if you are trading, no matter what system, you should always clearly know where to get money from the market. I'm sure that many of you see the market very well and enter it wonderfully, but it can be difficult to exit. My strategy allows you to do this with fine accuracy, and you will see this more than once. In the afternoon I will give out an interesting trading idea on the S&P 500 index. Be careful when trading in the evening on US news on Non-Farm Payrolls at 12.30. I don't give trading ideas on dollar instruments today because they have already worked for us. We will look after the news the balance of power. Good luck in trading and follow the rules of money management. The material has been provided by InstaForex Company - www.instaforex.com |
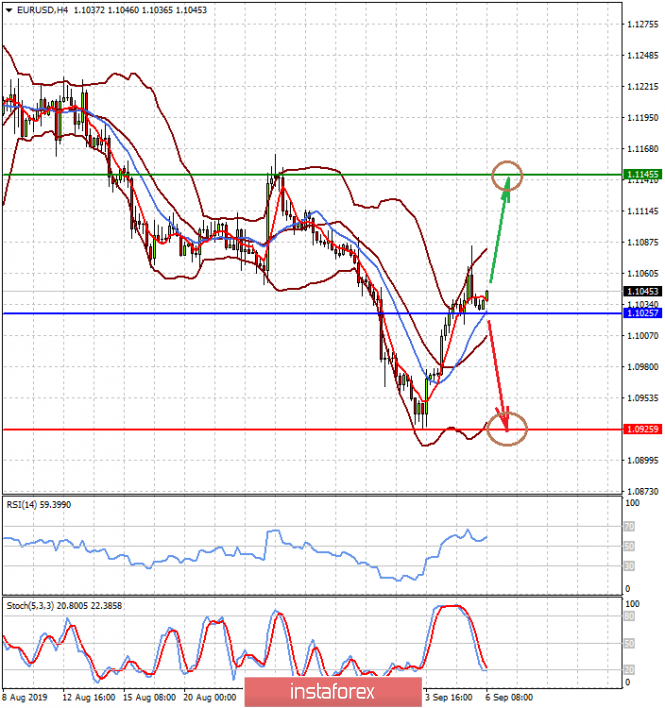
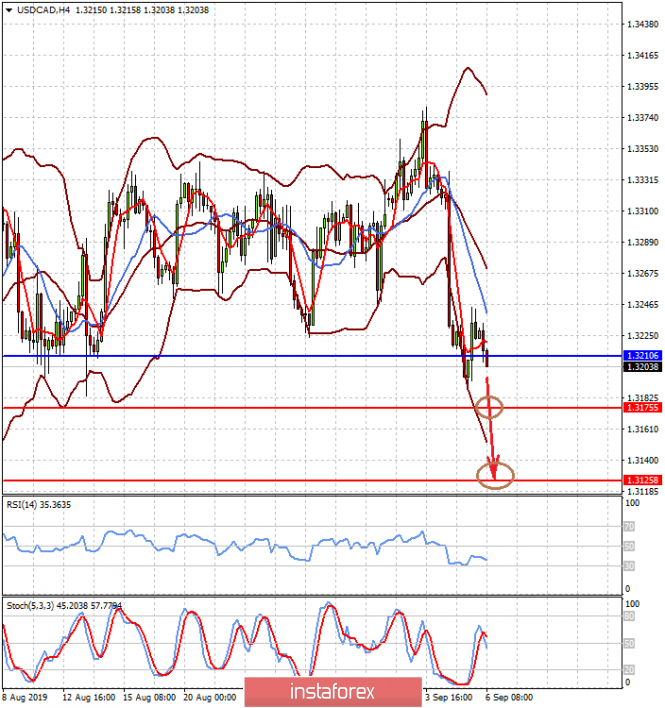
| Posted: 06 Sep 2019 04:17 AM PDT Today, the focus of the market will be important data on economic statistics. First of all, we highlight the publication of intermediate values of the Eurozone GDP for the 2nd quarter, as well as figures on employment in the States. According to the forecast, it is expected that the growth of the European economy in the second quarter will decrease to 1.1% from 1.2% year on year and in quarterly terms, the growth rate will drop to 0.2% from 0.4%. If the data are confirmed, then the ECB will have every reason despite some discrepancies in the assessments of the future monetary policy by representatives of the regulator to begin large-scale incentive measures. This may ultimately lead to the resumption of the bearish trend of the single European currency. Of the American statistics released today, the undoubted favorite will be the values of the number of new jobs in the US economy. In August, the US economy is expected to have 160,000 new jobs in the non-agricultural sector, compared to 164,000 a month earlier. The forecast is also to maintain unemployment at around 3.7%. What will be the data, it will become known at 12.30 UTC but they may turn out to be significantly higher than expected. In any case, the employment figures from ADP presented on Wednesday showed a significantly higher value of the number of new jobs at 195,000 against 142,000 a month earlier and growth forecasts of up to 148,000. Of course, data from Automatic Data Processing or an employment report from ADP does not always coincide with the official values from the US Department of Labor, but in general often show general dynamics, which is important. So, if the value of the number of new jobs also demonstrates growth above expectations, then this will undoubtedly support the dollar. It can also weaken the market's expectations that the Fed will begin the process of lowering interest rates this year, and not just limit itself to a single decrease this month. With regard to the final decision of the Central Bank of the Federal Republic on rates, we note that cutting the key rate by 0.25% to 7.00% is justified against the background of a slowdown in inflation and the direct economic need to stimulate business activity in Russia. But this decision is actually the stock market of the Russian Federation, as well as the dynamics of the ruble is already taken into account in prices. Investors will be interested in the further course of the regulator. If the Central Bank makes it clear that the reduction in rates can continue, it will be positively received by the stock market, and the ruble will experience noticeable problems with growth in relation to the dual-currency basket. Forecast of the day: The EUR/USD pair is trading above the level of 1.1025. If data from the United States turns out to be weaker and Eurozone GDP is no worse than the forecast, the pair will continue to grow locally to 1.1145. But if the values of the indicators are opposite, we should expect a local price fall to 1.0925. The USD/CAD pair may resume decline on weak data on employment in the States and the resumption of rising oil prices. In this case, it will continue to fall to 1.3175 and then to 1.3125. However, if the NFPs come out better than expected, the pair could jump to 1.3270.  |
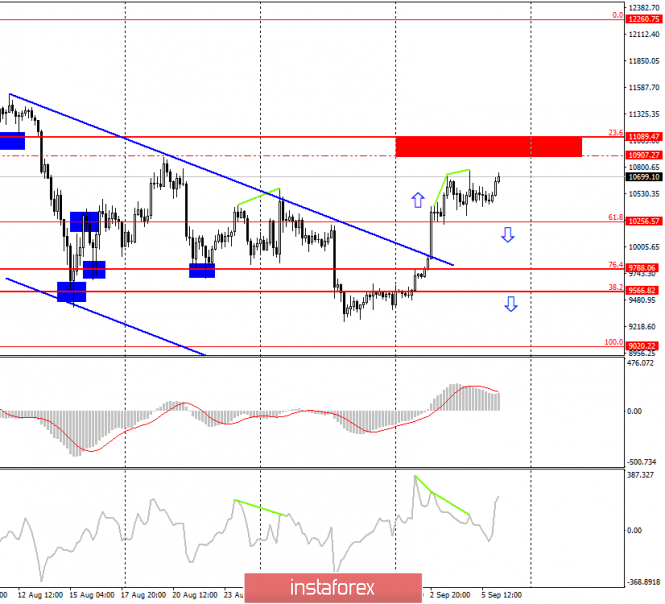
| Trading strategy for Bitcoin on September 6th. Bitcoin will still try to beat the level of $11000 Posted: 06 Sep 2019 03:39 AM PDT Bitcoin – 4H.
On September 5, bitcoin began to move up again and threatens to update the highs of the previous two days in the next few hours. This means that the bulls will still try to work out the area of $10900 - $11100 per coin. Well, the further development of events will depend entirely on the ability of traders to close over this area. If successful, the number 1 cryptocurrency in the world will not deter anything from reaching new heights. It is clear that traders are now inclined to buy and did not take into account even two bearish divergences. At the same time, the signal to buy at the close above the level of 61.8% ($10256) did not go anywhere but was weakened by two divergences. Thus, I suggest that buyers wait until they reach the level of $ 10,907, and sellers do not force events and wait for a favorable situation to enter the market. While the bitcoin is tearing up again, discussions are underway on the network of two "topics of the day" at once. The first is an anonymous transfer of $1000000 (94504 BTC) in bitcoins at once for one transaction. It is reported that the transfer was made by an anonymous wallet that does not belong to any exchange. The second is the message that the number of wallets containing more than 10 BTC has reached a record number of 157,000. I do not know how interesting this news is, they only show that bitcoin continues to be actively used by users, but in fact, they mean nothing. It is also impossible to say that bitcoin is growing in recent days due to any fundamentally important events. China and the States agreed on a new round of talks. Brexit in the UK postponed for several months. That is, there was no new geopolitical tension or escalation of existing conflicts. Thus, the growth of the "cue ball" is not associated with the desire of traders to diversify risks. In conclusion, I can recommend bear traders to wait for either the price rebound from the red area on the chart or close at $10256. The Fibo grid is based on the extremes of July 17, 2019, and August 6, 2019. Forecast for Bitcoin and trading recommendations: Bitcoin has completed the consolidation above the level of Fibo 61.8%, however, 2 bearish divergence continues to be questioned further growth. I recommend selling the currency if it closes at the level of 61.8% ($10256), with a target of $9788 (76.4% Fibo). I do not recommend buying bitcoin right now, as there is not much left until the target and very strong areas, and two divergences reduce the chances of cryptocurrency growth. The material has been provided by InstaForex Company - www.instaforex.com |
| Posted: 06 Sep 2019 02:56 AM PDT EUR/USD – 4H.
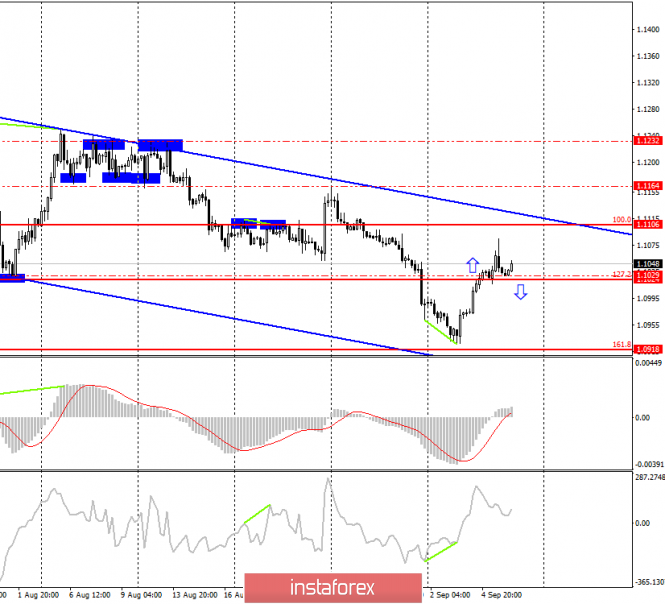
As seen on the 4-hour chart, the EUR/USD has completed the consolidation above the correction level of 127.2% (1.1029). Thus, the growth of quotations of the euro/dollar pair may continue today in the direction of the next correction level of 100.% (1.1106), which wonderfully coincides with the upper line of the downward trend channel in which the pair continues to be. Based on this, we can assume that around the level of 1.1100, there will be a reversal in favor of the US currency. At least around this level, I will consider the new sales of the pair. Euro can also be sold by the signal "closing under the Fibo level of 127.2% (1.1024)". The information background in recent days was on the side of the European currency, but yesterday, the ISM business activity index in the US services sector unexpectedly for many turned out to be higher than the expectations of traders, which caused profit-taking on previously opened purchases. The index of business activity ISM blocked two unsuccessful business activity index from Markit. But the report on the change in the number of people employed by ADP also supported the US dollar, as it showed an increase of 195K. What to expect from the euro/dollar currency pair on Thursday? On September 6, I look forward to continued correctional growth of the pair in the direction of the upper area of the downward channel and the correction level of 100.0% (1.1106). Near this level, I expect a reversal and consider this option as the main one, and closing above it as a secondary one. Today will be a very interesting day, as the level of GDP for the second quarter (forecast + 1.1% y/y) will be known in the European Union, and after lunch – Nonfarm Payrolls, unemployment, change in average wages in the United States. The trading day and week will end with a speech by Fed Chairman Jerome Powell, who can once again "direct" traders, indicating what the Fed plans at its next meeting. The Fibo grid is built on the extremes of May 23, 2019, and June 25, 2019. Forecast EUR/USD and trading recommendations: I recommend selling the pair with a target of 1.0918 if consolidation below the level of 1.1024 is completed. Stop Loss – Over 1.1029. It is possible to buy the pair now, as it closed above the level of 1.1029 with a target of 1.1106. GBP/USD – 4H.
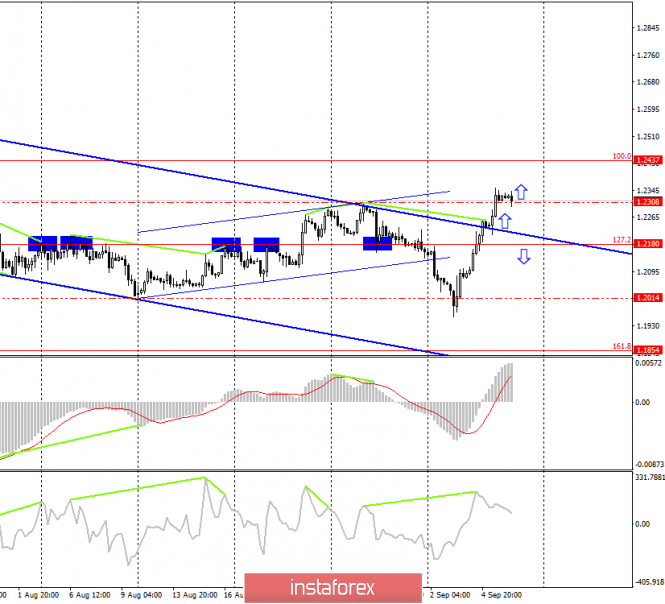
The latest developments and news from the British Parliament are discouraging. It seems that Boris Johnson was not going to make any deals with the European Union, and this moment casts a strong shadow on the Prime Minister. Although the Parliament decided to postpone Brexit until January 31, 2020 and blocked the country's possible exit from the EU on Johnson's initiative, Boris himself still refuses to ask the EU for a delay. It is the Prime Minister who should now contact EU leaders and ask for a postponement of the Brexit date until January 31. However, Johnson said: "I would rather lie dead in a ditch than ask for a postponement of Brexit." What does this mean? Johnson already questioned the principles of "legality", "democracy" by his decision to send parliament to forced leave. Now that the majority of deputies decided to postpone Brexit, Johnson refuses to perform their duties? Labor and opposition leader Jeremy Corbyn accused the Prime Minister of "not planning to conclude a new agreement." I believe that I did not plan earlier. The question is Boris Johnson's motivation; why should the Prime Minister clearly show that it is important for him to withdraw the country from the EU, and the agreement is a secondary issue? After all, we are talking about the future of the country, and the future of the UK will be very vague with Brexit "No Deal". But Johnson doesn't seem to care. That is why more and more often the name of Boris is associated with the name of Donald Trump, who is almost the only one actively supports Britain's hard exit from the EU. Trump's motivation is clear – it's profitable for the US president to quarrel between the EU and Britain, but why is this for Boris Johnson? The pound rose on the latest reports from Parliament, but the flow of information recharge stopped, so the pound/dollar pair may fall. What to expect from the pound/dollar currency pair on Thursday? Now, the pound/dollar pair has completed consolidation over the peak on August 27 – 1.2308. Thus, traders can count on the continued growth of the pair in the direction of the correction level of 100.0% (1.2437). However, a close below the level of 1.2308 will work in favor of the US dollar and a slight fall in the pair in the direction of the correction level of 127.2% (1.2180). Today, the divergence is not observed in any indicator. The Fibo grid is based on the extremes of January 3, 2019, and March 13, 2019. Forecast for GBP/USD and trading recommendations: I recommend buying the pair very cautiously with the target of 1.2437 as close was performed on the level of 1.2308 with the stop-loss order under the level of 1.2308. I recommend selling a pair with the target of 1.2180, if it closes below the level of 1.2308, with the stop-loss order above the level of 1.2308. The material has been provided by InstaForex Company - www.instaforex.com |
| EUR/USD facing bearish pressure from resistance, potential for drop! Posted: 06 Sep 2019 02:33 AM PDT
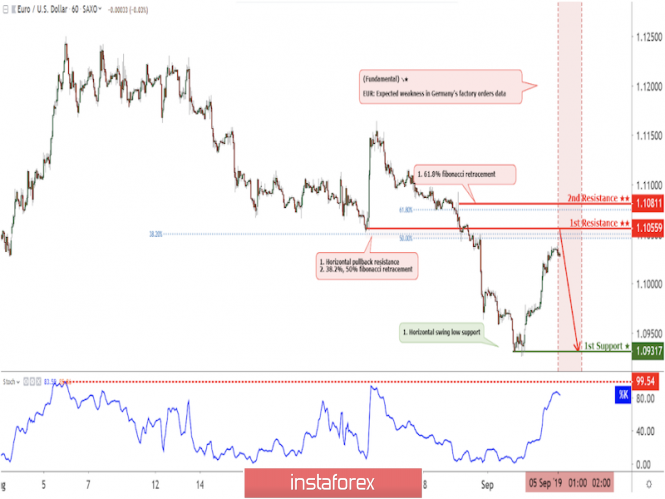
EURUSD is facing bearish pressure from our first resistance where we could be seeing a further drop below this level. Entry: 1.10559 Why it's good : horizontal pullback resistance, 50%, 38.2% fibonacci retracement Stop Loss : 1.10811 Why it's good : 61.8% Fibonacci retracement, horizontal swing high resistance Take Profit : 1.09317 Why it's good: Horizontal swing low support
 |
| NZD/USD right on big resistance, prepare for a drop! Posted: 06 Sep 2019 02:30 AM PDT
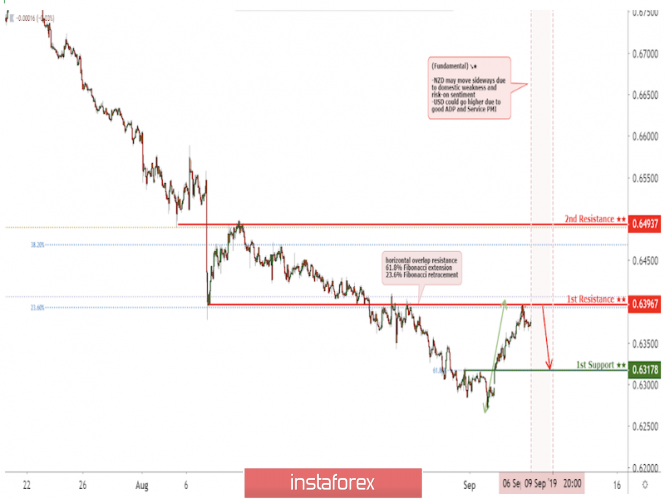
NZDUSD is approaching big resistance at 0.6397 where we expect a reversal. Entry: 0.6397 Why it's good : horizontal overlap resistance 61.8% Fibonacci extension 23.6% Fibonacci retracement Take Profit : 0.6318 Why it's good: 61.8% fibonacci retracement
 |
| USD/JPY approaching upside confirmation, potential bounce! Posted: 06 Sep 2019 02:28 AM PDT
USDJPY is approaching upside confirmation at 107.08, if breaks above this level, could go up further. Entry :107.08 Why it's good :horizontal swing high resistance 61.8% Fibonacci extension Take Profit : 1107.48 Why it's good :61.8% Fibonacci retracement
 |
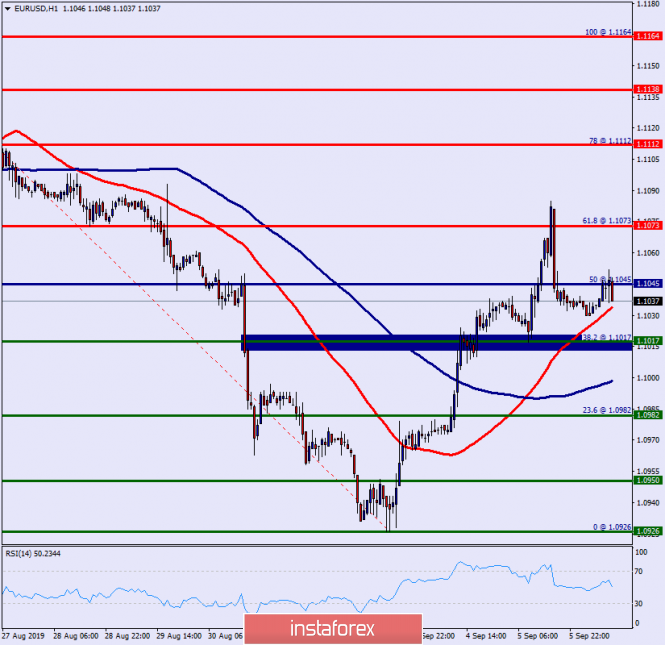
| Technical analysis of EUR/USD for September 06, 2019 Posted: 06 Sep 2019 02:13 AM PDT Overview: Any upside pullback from the price of 1.1017 now is normal, because on the whole we remain bullish at present. The bullish trend is still expected for the upcoming days as long as the price is above 1.1017. The EUR/USD pair reached a new maximmum at the price of 1.1030/1.1045. So, today the price may reach one more maximmum around the spot of 1.1073, which coincides with the ratio of 61.8% Fibonacci retracement levels. Today, the EUR/USD pair is challenging the psychological resistance at 1.1045. The EUR/USD pair will probably go up because an upward trend is still strong and the RSI is still signaling that the trend is upward. The breakthrough of 1.1045 will allow the pair to go further up to the levels of 1.1073 and 1.1112. As a result, it is gainful to buy above this price of 1.1017 with targets at 1.1073 and 1.1112. Alternative scenario: On the downside, a clear breakdown at the level of 1.1017 could trigger further bearish pressure testing 1.0982, which represents the major support today. The material has been provided by InstaForex Company - www.instaforex.com |
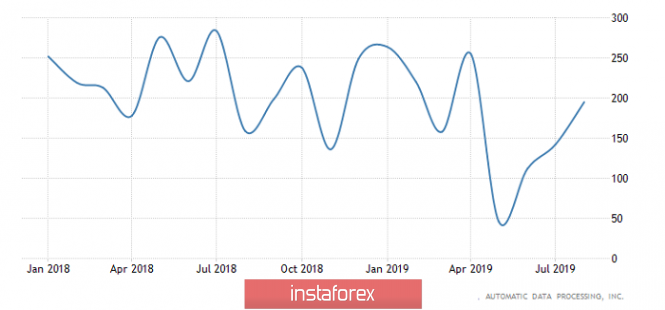
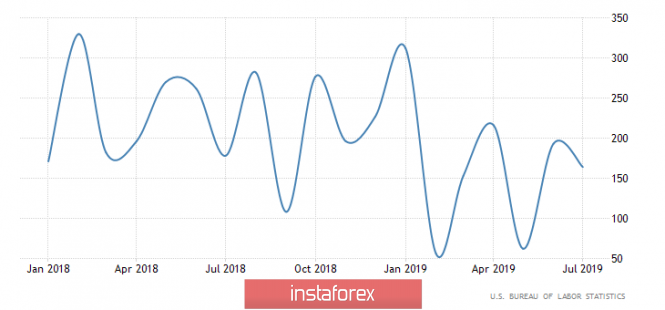
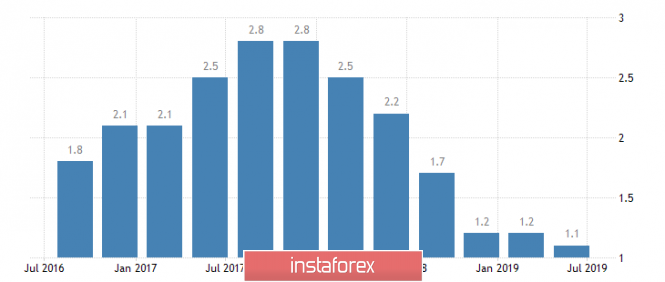
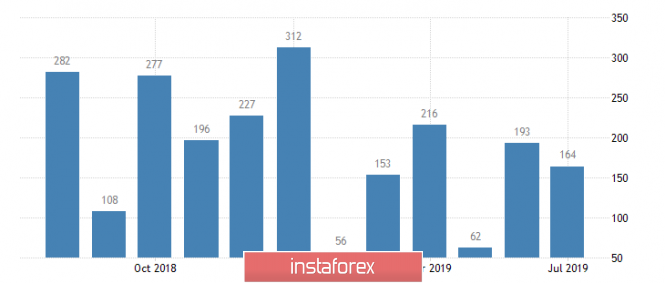
| Review of EUR / USD and GBP / USD pairs on 09/06/2019: Family Drama Posted: 06 Sep 2019 02:11 AM PDT The problem with all the series is that every next season is almost certainly worse than the previous one. But this does not apply to our favorite Brexit series. Indeed, real life is always much fuller and more interesting than any fiction. The third season was supposed to be the shortest, which began with the entry of Boris Johnson into the post of the prime minister, and most importantly, the final. Indeed, real life is always much fuller and more interesting than any fiction. The third season, which began with the entry of Boris Johnson into the post of the prime minister, was supposed to be the shortest, and most importantly, the final. However, although it may turn out to be the shortest, it already breaks all box office records and prepares us for the next season most importantly. Moreover, unlike the previous two seasons, the intensity of passions only increases, as now the family drama has also been added to the plot. Joe Johnson, who is another Johnson but with a tidier haircut, left the UK government due to disagreements with his Brexit brother. After the conservatives lost their majority in the House of Commons, this casts even greater doubt on the implementation of Boris Johnson's plan to hold early elections on October 15. Voting on this issue is scheduled for Monday and it is highly likely that Labor, led by Jeremy Corbin, will agree to an early election but only on October 29. by the way, Jeremy Corbin himself clearly marks for the role of the protagonist in the fourth season of the series, which was loved by all speculators. Nevertheless, the most important thing so far is that unfolding events reduce the likelihood of the onset of the Apocalypse in the form of an unregulated Brexit, which has a beneficial effect on the value of the pound. The single European currency was also glad that the threat of the most terrible horror stories for the night had somewhat diminished. True, the joy was short-lived as the common European currency for some reason remembered that the consequences of an unregulated Brexit for it were an order of magnitude less frightening than for the pound. Just as soon as the common European currency remembered this, it began to glance with interest towards the United States, where a whole series of macroeconomic data was published. What they saw led the single European currency to such a gloomy state that it immediately returned to where it started yesterday. The highlight of the program was the ADP data on employment, which showed its growth by 195 thousand with a forecast of 149 thousand, whereas in the previous month, employment increased by 142 thousand. However, these data precede the publication of the report of the United States Department of Labor. In addition to this, the total number of applications for unemployment benefits fell by 38 thousand, although they expected a decrease of 17 thousand. True, this happened solely due to repeated applications for unemployment benefits, the number of which did not fell by 16 thousand, but by 39 thousand. The number of initial applications for unemployment benefits increased by 1 thousand, instead of decreasing by 1 thousand. It is no less curious that the growth rate of labor productivity did not slow down from 2.3% to 2.2%, but remained unchanged. Curiously, productivity growth has not slowed from 2.3% to 2.2% but has remained unchanged. Also, production orders increased by 1.4%. So the single European currency really was a sad thing. The only thing that somehow restrained the growth of the dollar was the final data on the Markit business activity indices. It is worth recalling that the preliminary estimate showed a decrease in the index of business activity in services from 53.0 to 50.9, and the composite index from 52.6 to 50.9. However, the final figures showed a decline in both figures to 50. Employment Change from ADP (USA): Today, the focus is on the content of the report of the United States Department of Labor, which will determine the mood of market participants over the next few days at least. If you look at the forecasts, they are somewhat alarming. In particular, 158 thousand new jobs were to be created outside agriculture, compared to 164 thousand in the previous month. Also, the growth rate of average hourly wages may slow down from 3.2% to 3.1% and only the average working week should increase from 34.3 hours to 34.4 hours. All other indicators should remain unchanged. However, given yesterday's data on employment, there is every reason to believe that the contents of the report will be slightly better than forecasts. Moreover, do not forget about Jerome Powell's words about the current state of the labor market, which he described as the best in history. Indeed, at the moment, more jobs are being created than necessary, since the pace of their creation exceeds the rate of growth of labor. As a result, it turns out that there is nothing to worry about even if the pace of creating new jobs slows down. Moreover, it will be quite normal, since there is no point investing in creating jobs for which it is impossible to find appropriate workers. But the main conclusion from all this is that the state of the labor market is clearly not conducive to even thinking about easing the monetary policy of the Federal Reserve System. Even if the pace of job creation slows down, there's nothing wrong with that. Moreover, it will be quite normal since there is no point investing in creating jobs for which it is impossible to find appropriate workers. The number of new jobs created outside agriculture (USA): It is worth paying attention to the fact that today the final data on the GDP of Europe for the second quarter are published, which should confirm the fact of a slowdown in economic growth from 1.2% to 1.1%. Hence, the single European currency should fall to 1.0975. The significance of the report of the United States Department of Labor is so high that even true Brexit fans will be forced to switch the channel for a while. True, this does not bode well for the pound. Although the pound itself grew solely on the background of information, and not on real economic grounds, so it really needs to be somewhat adjusted. In other words, it is worth waiting for the pound to drop to 1.2175.  |
| Strong ISM and ADP reports will not help the dollar, euro and pound may rise higher on Friday Posted: 06 Sep 2019 02:11 AM PDT On the eve of the publication of the US labor market report, the dollar received very tangible support. The ISM index in the services sector rose in August to 56.4p from 53.7p a month earlier and the sub-indices of business activity and new orders rose above 60p, which indicates a strong growth of optimism. The only alarming signal is the decrease in the employment sub-index from 56.3p to 53.1p, which contradicts the ADP report. It shows the private sector employment increased by 195 thousand after three months of relative weakness. At the same time, Markit gives a completely different result of the activity in the services sector as it slowed in August 50.7p versus 50.9p a month earlier and barely exceeds 50p. That is, growth is barely noticeable and the current PMI level is at a minimum for 3.5 years. Since investors tend to focus on ISM indices as being more informative, the optimism before the publication of Nonfarm has grown slightly. However, one can't help but worry about the huge gap between the results of ISM and Markit with both agencies noting that the labor-market slowdown continues. This report is the last before the key meeting of the Fed at the rate, therefore, attention to it has increased. While the forecasts are neutral, experts do not expect noticeable deviations from the July results either in the number of new jobs or in the rate of increase in wages. Hence, the dollar is under slight pressure due to a decrease in the level of risk. The chance to see a failed employment report is higher than positive, thus, the likelihood of a further weakening dollar on Friday remains high. EUR / USD pair Markets are preparing for the ECB meeting next week, which is expected to announce the introduction of the next stimulus package. It is significant that the euro is strengthening against these expectations, which indicates at least two important points - the markets take into account the 10p rate cut, and this decrease will not lead to increased pressure on the euro, as well as the resumption of the asset purchase program by 30 billion euros per month. Accordingly, the intrigue is whether the ECB will present a more extensive package than has already been taken into account by the market, for example, a reduction in the base rate by 20p, a decrease in the deposit rate and a more extensive repurchase program. Most banks believe that this will be so. In particular, DanskeBank and Nordea suggest that the ECB will provide a more significant mitigation package, which will lead to a depreciation of the euro. Otherwise, the inflation target would not be achieved. For 9 meetings, when the ECB was under the leadership of Draghi, the EUR/USD lowered the rate and drop in average to 151p. So if expectations are met, the euro will go below 1.0925 and will seek support in the 1.0870/90 zone. If the markets are inclined towards this scenario (Danske believes that it has at least 60% probability), then the euro will have good prospects for decline even before the Fed meeting approaches. This scenario will become relevant closer to the middle of next week. On Friday, the euro looks stronger both due to a decrease in geopolitical tensions and the risk of seeing weak non-farms, which is why it is more likely to increase to yesterday's maximum of 1.1083. GBP/USD pair The pound responded with growth to a serious defeat of Boris Johnson in the British Parliament. On Wednesday, the lower house passed a law. According to which, the government is obliged to postpone Brexit until January 31, 2020, in the absence of an agreement with the EU while Johnson's counter-attempt to dissolve parliament and hold early elections failed. In the short term, this news is an absolute positive for the pound, which can resume growth if the likelihood of reaching an agreement with the EU increases. However, according to Michel Bernier, the EU's chief negotiator, the negotiations are paralyzed at this stage and Johnson has other ways to get an early election. Therefore, the pound's growth is unlikely to be strong. Today, an attempt is likely to update a maximum of 1.2354 and the support at 1.2307. The material has been provided by InstaForex Company - www.instaforex.com |
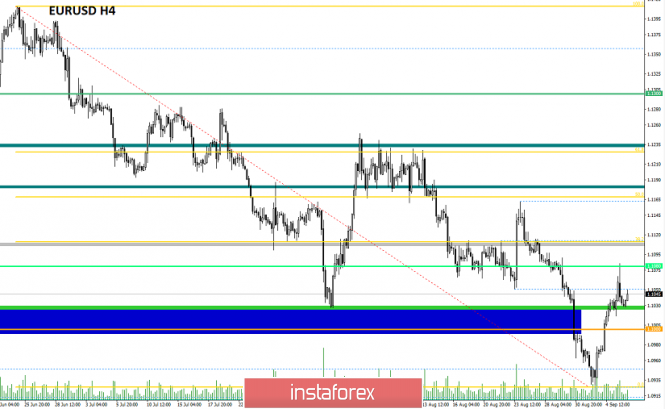
| Trading recommendations for the EURUSD currency pair - prospects for further movement Posted: 06 Sep 2019 01:56 AM PDT Over the past trading day, the currency pair euro / dollar pleased with the high volatility of 67 points again, as a result of which the quotation rushed to the cluster area in mid-August. From the point of view of technical analysis, we see that the correctional course from the values of 2017 has already reached the level of 1.1080. This, by the way, is more than 150 points of the upward movement. As you understand, the level of 1.1080 is a mirror level, relative to which a slowdown in the form of quotation accumulation previously occurred. As discussed in a previous review, speculators do not sleep and continue to work on the corrective course. The judgment is that the upward movement will continue to coincide 100%, as the quote managed to reach 1.1070-1.1080. The profit received is relatively small, but along with all the actions within the week, we have a decent profit. In turn, conservative traders again sat on the fence, waiting for the return of the quotation below the psychological mark of 1.1000. Considering the trading chart in general terms (daily period), we see that the corrective move in the global downward trend is still preserved in the market, where the mid-August cluster, together with the Fibo level of 38.2, is located before the quote. As you know, it's still very early to talk about a change in the global trend. Thus, it's better to analyze the 2015-2017 section to be ready for anything. Do you understand the hint? The news background of the past day contained ADP data on US employment, where, of course, everyone expected a decrease in growth rates from 156 thousand to 149 thousand. As a result, the previous data was revised for the worse, and the current data came out with very good growth, 142 thousand. ---> 195 thousand. In addition to everything, we were pleased with the data on the number of applications for unemployment benefits, which fell by 38 thousand with a forecast of a decrease of 17 thousand. The finish line of the extravaganza of statistics in the United States was data on the volume of industrial orders and business activity in non-production sector where we see significant growth in both areas. How did the American dollar react to all this? At first, the dollar was losing its position without even noticing the key news of ADP, but closer to 14:00 Universal time, the picture changed, and the positions on the green piece of paper began to grow. The reason for such an extraordinary market reaction lies precisely in the information background, in particular Brexit. Therefore, the panic in the United Kingdom does not abate, the draft law on forced delay in the absence of agreements with the EU has already been approved by the House of Lords, and the brother of Prime Minister Boris Johnson announced his resignation from Parliament, as well as from the post of Minister for Universities and Science Affairs. Joe Johnson said that he was torn between family loyalty and national interests, so he will leave the government. This kind of step is clearly a stone in the garden of the current Prime Minister, and, as a fact, further panic leaps. Thus, how good the statistics for the States were, the synchronous publication of the news and informational background played the role of a veil, and we saw a belated reaction. Today, in terms of the economic calendar, we have a report from the United States Department of Labor, which predicts a reduction in the number of people employed in the non-agricultural sector from 164K to 160K. But if you refer to the ADP data, as written above, there is a high probability that the report will come out with a much better forecast than expected. Thus, the reaction that we saw yesterday was delayed, paired with new data, could play into the hands of the American dollar. The upcoming trading week in terms of the economic calendar begins rather sluggish. But by the middle of the week, we will have an acceleration, which is only worth the ECB meeting, where they plan to reduce the rate on deposits. At the same time, no one forgets about the information background, which can unfold in the form of discussions on the postponement of Brexit. The most interesting events displayed below ---> Tuesday September 10th USA 14:00 Universal time. - The number of open vacancies in the labor market JOLTS (July): Prev. 7.348M Wednesday, September 11 USA 12:30 Universal time. - Producer Price Index (PPI) (YoY) (Aug): Prev 1.7% ---> Forecast 1.7% Thursday, September 12 EU 9:00 Universal time - Industrial Production (YoY) (July): Prev -2.6% ---> Forecast -1.2% ECB meeting, followed by a press conference EU 11:45 Universal time - Deposit rate (Sep): Prev -0.40% ---> Forecast -0.50% USA 12:30 Universal time. - Core Consumer Price Index (CPI) (YoY) (Aug): Prev 2.2% ---> Forecast 2.2% Friday September 13 USA 12:30 Universal time. - Retail Sales (YoY) (Aug): Prev 3.4% ---> Forecast 3.2% Further development Analyzing the current trading chart, we see that after a small pullback from the level of 1.1080, the quotation stopped at around 1.1030, where there is a clear restraint. Traders, in turn, hid, as there are prerequisites for the restoration of the main movement, and work in the correction may come to an end. It is likely to assume a temporary amplitude in the region of 1.1030-1.1080, where it is worthwhile to carefully analyze the price fixing points. If the forecast is confirmed and the price is fixed lower than 1.1030, it is likely to expect a decline to 1.1000, after which we analyze the price behavior relative to the psychological level, where there will be a chance of further topping up of short positions. The plot is quite realistic, but there is only one. If there will be a wide informational background again, then the plot may change, so we should closely monitor the news feed. Based on the above information, we derive trading recommendations: - Buying positions are considered in the case of price fixing higher than 1.1080, not puncture, with the prospect of a move to 1.1110. - Selling positions are considered if prices are fixed lower than 1.1030, with the prospect of a move to 1.1000 --- 1.0980 ---- 1.0940. Indicator analysis Analyzing a different sector of timeframes (TF), we see that indicators in the short and intraday perspective have upward interest, reflecting the current corrective movement. Meanwhile, mid-term indicators follow the main market movement - downward interest. Volatility per week / Measurement of volatility: Month; Quarter; Year Measurement of volatility reflects the average daily fluctuation, calculated for the Month / Quarter / Year. (September 6 was built taking into account the time of publication of the article) Current time volatility is 22 points. It is likely to assume that due to the information and news background, volatility may increase, exceeding the daily average. Key levels Resistance zones: 1,1100 **; 1,1180 *; 1.1300 **; 1.1450; 1.1550; 1.1650 *; 1.1720 **; 1.1850 **; 1,2100 Support Areas: 1,1000 ***; 1.0850 **; 1,0500 ***; 1.0350 **; 1,0000 ***. * Periodic level ** Range Level *** Psychological level **** The article is built on the principle of conducting a transaction, with daily adjustment The material has been provided by InstaForex Company - www.instaforex.com |
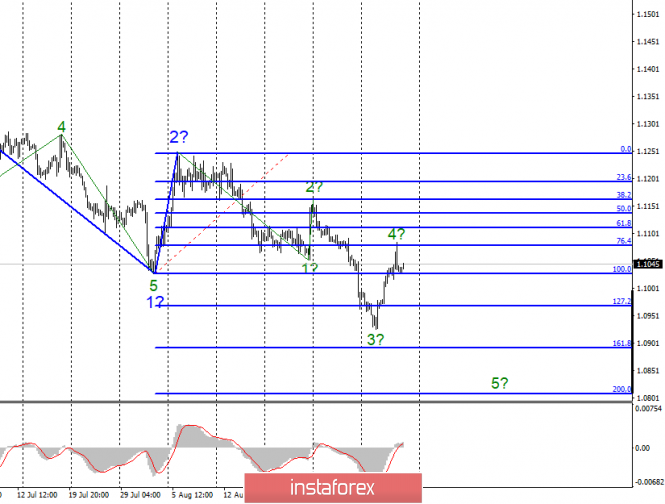
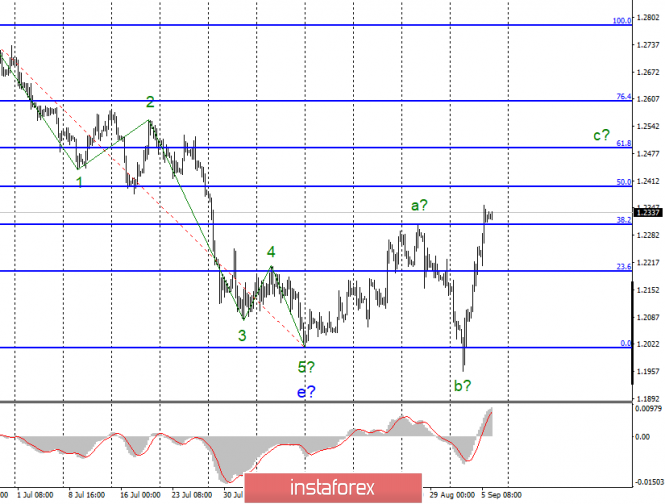
| Analysis of EUR / USD and GBP / USD for September 6. Non-farm payrolls can send euros down again Posted: 06 Sep 2019 01:13 AM PDT EUR / USD On Thursday, September 5, the EUR / USD pair ended without any price changes, although the instrument reached the level of 76.4% during the day, and made a puncture of this level and an unsuccessful attempt to break through. Thus, the internal wave structure of the alleged wave 3 took a non-standard form, since wave 4 went beyond the minimum of wave 2. Nevertheless, the fifth wave in the composition of proposed 3 can still be constructed. Its targets are located near the levels of 161.8% and 200.0% Fibonacci. In order for the markets to return to sales of the euro-dollar pair, we need strong economic reports from America. Yesterday, the beginning was made thanks to the report on ISM business activity in the service sector, which exceeded the expectations of the foreign exchange market (56.4 with a forecast of 54.0). Well, today, GDP will be published for the second quarter of 2019 in the European Union. It is unlikely that market expectations to see + 1.1% y / y will be exceeded. Thus, at best, the European GDP report will not disappoint markets. Meanwhile, in America, today is a very important report on the number of new jobs outside the agricultural industry, or Nonfarm payrolls. The last two values of this indicator were quite high. Based on Non-farm's annual data, we see that every third month is often a failure. The forecast for August is 163,000 new jobs, but I believe that they may be slightly less in reality. However, to build the fifth wave of the downward trend, you need Nonfarm to please the Forex currency market. Purchase goals: 1.1248 - 0.0% Fibonacci Sales goals: 1.0893 - 161.8% Fibonacci 1.0807 - 200.0% Fibonacci General conclusions and recommendations: The euro-dollar pair continues to build bearish wave 3 and its internal correctional wave 4. I recommend selling the pair with targets near the calculated levels of 1.0893 and 1.0807, which corresponds to 161.8% and 200.0% Fibonacci, for the MACD signal is down. GBP / USD On September 5, GBP / USD gained another 80 base points. Thus, the construction of the proposed wave c, comprising at least the correctional part of the trend, continues. The wave c itself can take a more complex, pronounced five-wave form. In this case, quotes may already begin to move away from the maximums reached as part of the construction of correctional wave 2 in the future c. In turn, news background can help if US economic reports are strong. In Great Britain, political passions calmed down a bit, as the main events that worried and interested the whole world gave answers to important questions. The most important of them - Brexit - was postponed to January 31, 2020, and without the consent of parliament, Boris Johnson will not be able to withdraw the country from the European Union without an agreement. Sales goals: 1.2016 - 0.0% Fibonacci Purchase goals: 1.2401 - 50.0% Fibonacci 1.2489 - 61.8% Fibonacci General conclusions and recommendations: The downward trend section is still considered completed. Thus, now, the construction of the rising wave is expected to continue with targets located near the calculated levels of 1.2401 and 1.2489, which corresponds to 50.0% and 61.8% Fibonacci. You can buy a pound now when the news tension has subsided a bit, but I still do not recommend doing so in large volumes. The material has been provided by InstaForex Company - www.instaforex.com |
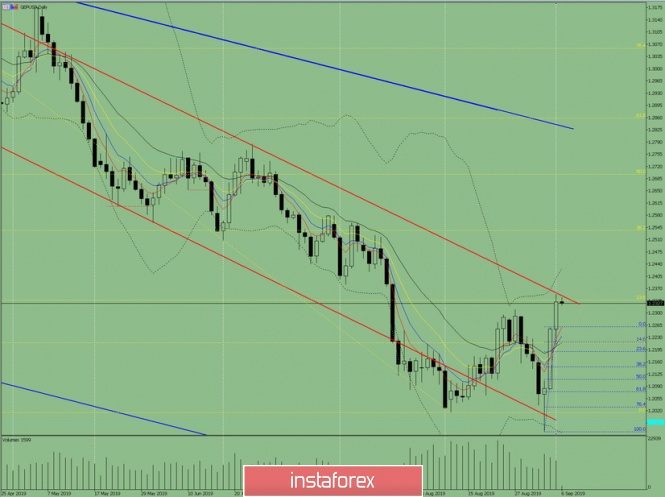
| Indicator analysis. Daily review on September 6, 2019 for the GBP / USD currency pair Posted: 06 Sep 2019 12:55 AM PDT Trend analysis (Fig. 1). On Friday, the price, after testing the resistance line, may begin to move down with the target of a pullback level of 14.6% - 1.2296 (blue dashed line) and in case of breaking further down to a pullback level of 23.6% - 1.2261 (blue dashed line).
Fig. 1 (daily chart). Comprehensive analysis: - indicator analysis - up; - Fibonacci levels - down; - volumes - down; - candlestick analysis - down; - trend analysis - down; - Bollinger Lines - up; - weekly schedule - down. General conclusion: On Friday, the price, after testing the resistance line, may begin to move down with the target of a pullback level of 14.6% - 1.2296 (blue dashed line) and in case of breaking further down to a pullback level of 23.6% - 1.2261 (blue dashed line). An unlikely scenario is an upward movement, with the first target of 1.2387 - the upper boundary of the Bollinger Line indicator (black dashed line). The material has been provided by InstaForex Company - www.instaforex.com |







| You are subscribed to email updates from Forex analysis review. To stop receiving these emails, you may unsubscribe now. | Email delivery powered by Google |
| Google, 1600 Amphitheatre Parkway, Mountain View, CA 94043, United States | |

No comments:
Post a Comment