
Forex analysis review |
- Fractal analysis of the main currency pairs for September 9
- GBP/USD. September 8. The results of the week. Boris Johnson may end up in jail due to unwillingness to do Parliament's will
- EUR/USD. The results of the week. Jerome Powell did not answer the question about the Fed's readiness to lower the rate in
- USDJPY in bounce mode eyeing 107.50.
- EURUSD gets rejected at previous support now resistance area of 1.1050.
- Weekly analysis on Gold
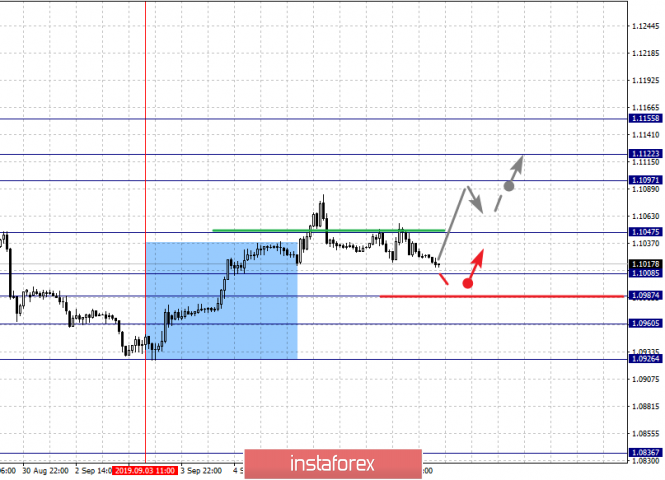
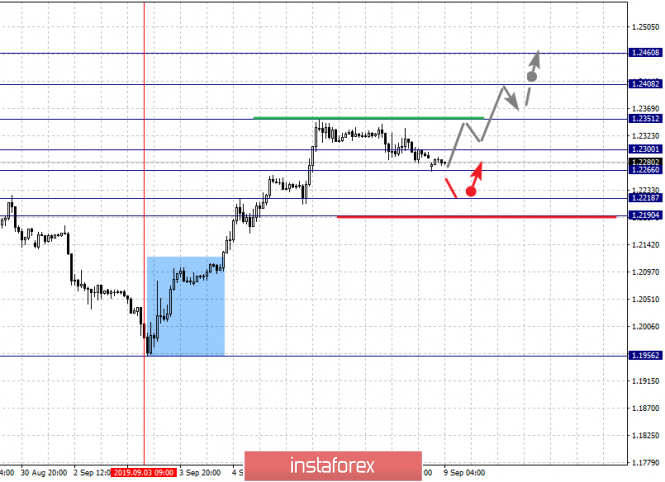
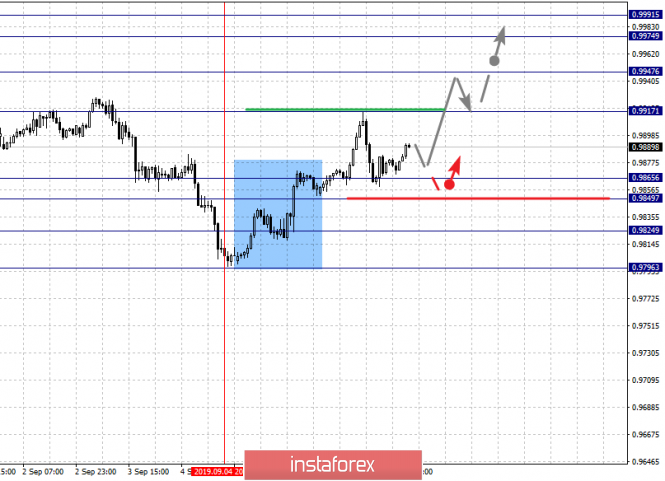
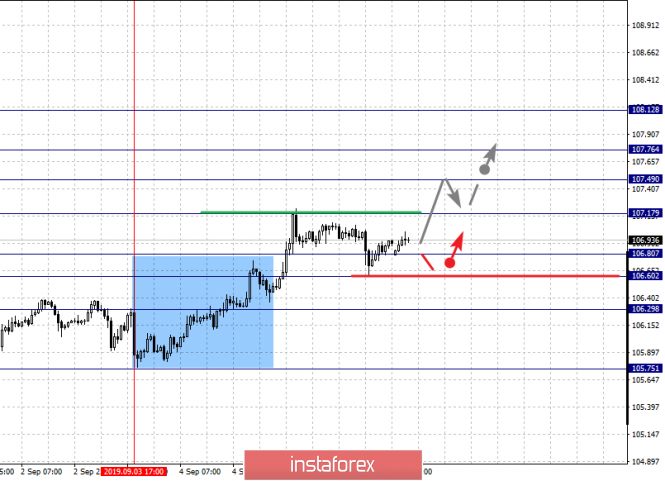
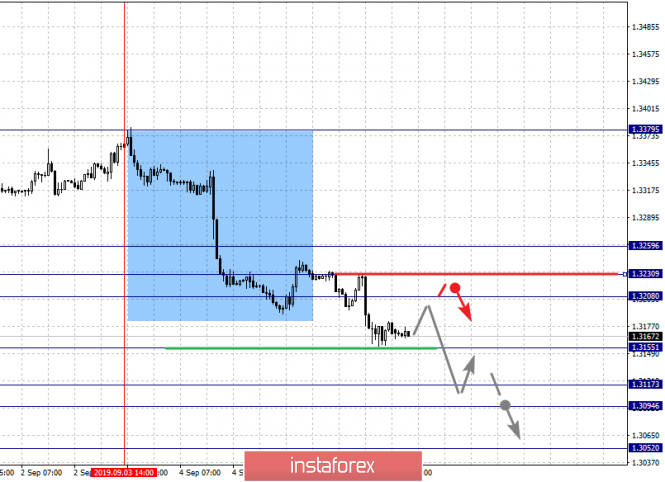
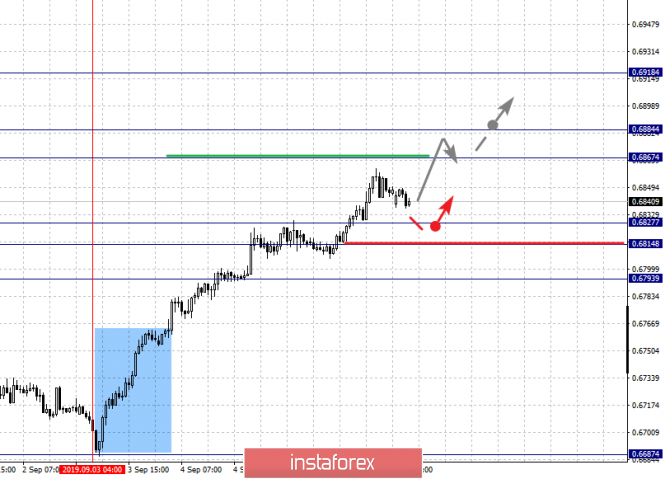
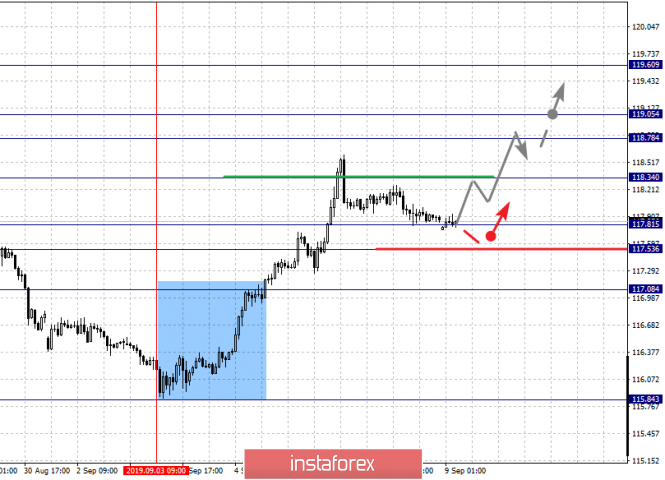
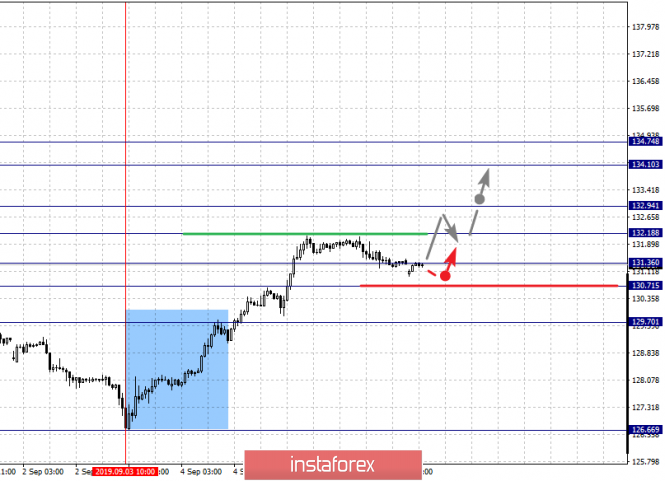
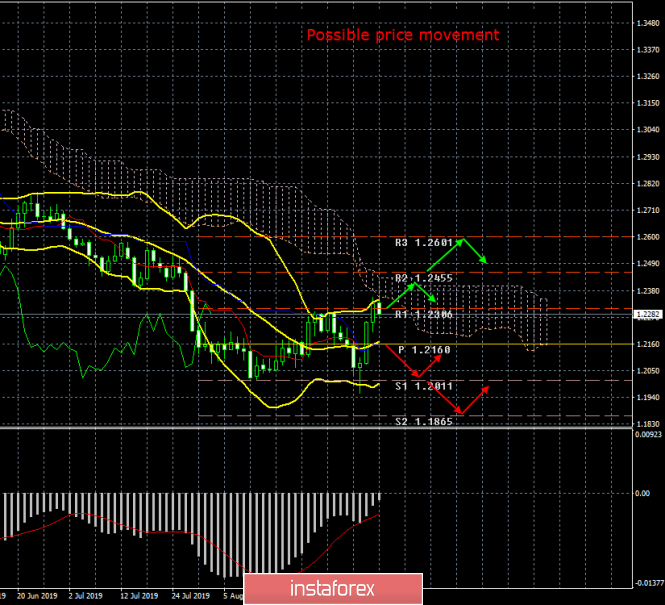
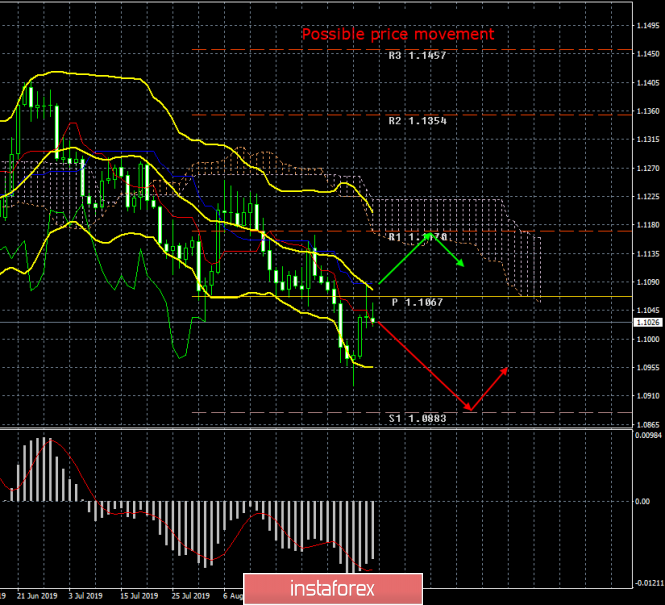
| Fractal analysis of the main currency pairs for September 9 Posted: 08 Sep 2019 06:55 PM PDT Forecast for September 9: Analytical review of currency pairs on the scale of H1: For the euro / dollar pair, the key levels on the H1 scale are: 1.1155, 1.1122, 1.1097, 1.1047, 1.1008, 1.0987, 1.0960 and 1.0926. Here, we continue to monitor the development of the ascending structure of September 3. The continuation of the movement to the top is expected after the breakdown of the level of 1.1047. In this case, the target is 1.1097. Short-term upward movement, as well as consolidation is in the range of 1.1097 - 1.1122. We consider the level of 1.1155 to be a potential value for the upward trend. Upon reaching which, we expect consolidation, as well as a pullback to the bottom. Short-term downward movement is expected in the range of 1.1008 - 1.0987. The breakdown of the last value will lead to an in-depth correction. Here, the target is 1.0960. This level is a key support for the upward structure. Its passage at the price will lead to the formation of a local downward structure. In this case, the first goal is 1.0926. The main trend is the upward structure of September 3. Trading recommendations: Buy: 1.1047 Take profit: 1.1095 Buy 1.1098 Take profit: 1.1120 Sell: 1.1008 Take profit: 1.0988 Sell: 1.0985 Take profit: 1.0960 For the pound / dollar pair, the key levels on the H1 scale are: 1.2460, 1.2408, 1.2351, 1.2300, 1.2266, 1.2218 and 1.2190. Here, we follow the development of the upward cycle of September 3. The continuation of the movement to the top is expected after the breakdown of the level of 1.2351. In this case, the target is 1.2408. The breakdown of which, in turn, will allow us to count on the movement to the potential target - 1.2460. Upon reaching this level, we expect a pullback to the bottom. Consolidated movement is expected in the range of 1.2300 - 1.2266. The breakdown of the latter value will lead to an in-depth correction. Here, the target is 1.2218. The range of 1.2218 - 1.2190 is a key support for the upward cycle. The main trend is the upward cycle of September 3. Trading recommendations: Buy: 1.2351 Take profit: 1.2406 Buy: 1.2409 Take profit: 1.2460 Sell: Take profit: Sell: 1.2264 Take profit: 1.2220 For the dollar / franc pair, the key levels on the H1 scale are: 0.9991, 0.9974, 0.9947, 0.9917, 0.9865, 0.9849, 0.9824 and 0.9796. Here, we follow the development of the ascending structure of September 4. The continuation of the movement to the top is expected after the breakdown of the level of 0.9917. In this case, the target is 0.9947, near this level is a price consolidation. The breakdown of the level of 0.9947 will lead to movement to a potential target - 0.9974. Upon reaching this value, we expect consolidation in the range of 0.9974 - 0.9991, as well as a rollback to the bottom. Short-term downward movement is expected in the range of 0.9865 - 0.9849. The breakdown of the latter value will lead to an in-depth correction. Here, the target is 0.9824. This level is a key support for the top. The main trend is the ascending structure of September 4. Trading recommendations: Buy : 0.9917 Take profit: 0.9945 Buy : 0.9948 Take profit: 0.9972 Sell: 0.9865 Take profit: 0.9850 Sell: 0.9847 Take profit: 0.9826 For the dollar / yen pair, the key levels on the scale are : 108.12, 107.76, 107.49, 107.17, 106.80, 106.60 and 106.29. Here, we follow the development of the ascending structure of September 3. The continuation of the movement to the top is expected after the breakdown of the level of 107.17. In this case, the target is 107.49. Short-term upward movement, as well as consolidation is in the range of 107.49 - 107.76. For the potential value for the top, we consider the level of 108.12. Upon reaching which, we expect a pullback to the bottom. Short-term downward movement is possibly in the range of 106.80 - 106.60. The breakdown of the last value will lead to a long correction. Here, the goal is 106.29. This level is a key support for the top. Main trend: local upward structure from September 3. Trading recommendations: Buy: 107.17 Take profit: 107.46 Buy : 107.50 Take profit: 107.74 Sell: 106.80 Take profit: 106.62 Sell: 106.58 Take profit: 106.30 For the Canadian dollar / US dollar pair, the key levels on the H1 scale are: 1.3259, 1.3230, 1.3208, 1.3155, 1.3117, 1.3094 and 1.3052. Here, we follow the development of the descending structure of September 3. The continuation of the movement to the bottom is expected after the breakdown of the level of 1.3155. In this case, the target is 1.3117. Price consolidation is in the range of 1.3117 - 1.3094. We consider the level of 1.3052 to be a potential value for the bottom; upon reaching this level, we expect a pullback to the top. Short-term upward movement is possibly in the range of 1.3208 - 1.3230. The breakdown of the last value will lead to a long correction. Here, the target is 1.3259. This level is a key support for the downward structure. The main trend is the descending structure of September 3. Trading recommendations: Buy: 1.3208 Take profit: 1.3230 Buy : 1.3232 Take profit: 1.3259 Sell: 1.3155 Take profit: 1.3120 Sell: 1.3116 Take profit: 1.3095 For the Australian dollar / US dollar pair, the key levels on the H1 scale are : 0.6918, 0.6884, 0.6867, 0.6827, 0.6814 and 0.6793. Here, we follow the development of the ascending structure of September 3. Short-term upward movement is expected in the range of 0.6884 - 0.6867. The breakdown of the last value should be accompanied by a pronounced upward movement. Here, the potential target is 0.6918. We expect a pullback to the bottom from this level. Short-term downward movement is possibly in the range of 0.6827 - 0.6814. The breakdown of the last value will lead to a long correction. Here, the potential target is 0.6793. This level is a key support for the top. The main trend is the upward structure of September 3. Trading recommendations: Buy: 0.6868 Take profit: 0.6882 Buy: 0.6886 Take profit: 0.6918 Sell : 0.6826 Take profit : 0.6815 Sell: 0.6812 Take profit: 0.6795 For the euro / yen pair, the key levels on the H1 scale are: 119.60, 119.05, 118.78, 118.34, 117.81, 117.53 and 117.08. Here, we continue to monitor the development of the ascending structure of September 3. The continuation of the movement to the top is expected after the breakdown of the level of 118.34. In this case, the target is 118.78. Short-term upward movement, as well as consolidation is in the range of 118.78 - 119.05. The breakdown of level 119.05 should be accompanied by a pronounced upward movement towards a potential target - 119.60. We expect a pullback from this level to the bottom. Short-term downward movement is expected in the range of 117.81 - 117.53. The breakdown of the latter value will lead to an in-depth correction. Here, the goal is 117.08. This level is a key support for the upward structure. The main trend is the upward cycle of September 3. Trading recommendations: Buy: 118.36 Take profit: 118.76 Buy: 118.78 Take profit: 119.05 Sell: 117.80 Take profit: 117.55 Sell: 117.50 Take profit: 117.10 For the pound / yen pair, the key levels on the H1 scale are : 134.74, 134.10, 132.94, 132.18, 131.36, 130.71 and 129.70. Here, we continue to monitor the development of the upward cycle of September 3. Short-term upward movement is expected in the range of 132.18 - 132.94. The breakdown of the last value should be accompanied by a pronounced upward movement. Here, the target is 134.10. For the potential value for the top, we consider the level of 134.74. Upon reaching which, we expect consolidation, as well as a pullback to the bottom. Short-term downward movement is possibly in the range of 131.36 - 130.71. The breakdown of the last value will lead to an in-depth correction. Here, the goal is 129.70. This level is a key support for the upward structure. The main trend is the upward structure of September 3. Trading recommendations: Buy: 132.20 Take profit: 132.90 Buy: 132.98 Take profit: 134.10 Sell: 131.36 Take profit: 130.74 Sell: 130.68 Take profit: 129.80 The material has been provided by InstaForex Company - www.instaforex.com |
| Posted: 08 Sep 2019 03:40 PM PDT 24 hour timeframe Last week, the pound showed a 5-month growth record against the US dollar. From the lowest to the highest, about 400 points, or 4 cents, were passed. In the previous review, we already wrote that the Parliament decided to postpone the Brexit date to January 31, 2020. The full conclusion of MPs can be described as follows: Boris Johnson has no right to implement a "hard" Brexit until January 31, 2020 without the approval of Parliament. That is, after January 31, Johnson, if he remains in the chair of the British Prime Minister, may again push through the disordered "divorce" with the European Union. However, there is still a lot of time until January 2020, so it's now hardly worth it to engage in reasoning, which Johnson will do in 5 months. Meanwhile, Minister for Labor and Pensions Amber Rudd announced her resignation from the Conservative Party (!!!), as well as her resignation from the Cabinet of Ministers. It is difficult to say whether this is the decision of Mrs. Rudd or the pressure of Boris Johnson, who had previously threatened members of the Conservative Party with exclusion from this and from the ranks of MPs if they refuse to support his initiatives on Brexit issues. One way or another, the next minister will leave his post. Recall that during the reign of Theresa May, more than 10 senior politicians left their posts because of disagreements with the prime minister in matters of Brexit. The story repeats itself ... Mrs. Rudd also noted that "she cannot stand by when the moderate Conservatives are expelled from the Party." I think it's clear to everyone who is exactly responsible for the expulsion... Mrs. Rudd sent a letter to Boris Johnson, in which she said that she did not believe that the prime minister's goal was to leave the EU with an agreement. At the same time, another initiative group of MPs is preparing a lawsuit against Boris Johnson if he refuses to comply with the new law, which obliges him to ask for European Union leaders to delay Brexit. Johnson's last words on the law prohibiting the "hard" Brexit until October 31 were: "I'd rather die in a ditch than ask for a respite." Thus, it is easy to guess that Johnson does not want to postpone Brexit, and will also look for ways to circumvent this obligation. At the same time, the behavior of the odious prime minister is already easily predicted by deputies. Realizing that Johnson was ready to take any measures to avoid the delay of Brexit, the deputies began to consider the possibility of going to court if the country's government refused to comply with the new law. Johnson said a little later: "They just passed a law that obliges me to beg Brussels to postpone Brexit. I will never do that." "Boris Johnson may end up in jail if he refuses to endure Brexit," said Ken McDonald of the British Attorney's Office. In the meantime, political passions are boiling in the UK, the pound/dollar pair completely ignores any macroeconomic statistics. Fortunately, it was a little last week in the United Kingdom. But the whole package of American data was not taken into account by traders. As for the technical picture on the higher timeframe, the pound has unexpectedly very interesting growth prospects. Firstly, a false breakdown of the previous low of the pair is clearly visible on the chart. This is a signal for growth. Secondly, the pair updated the previous high, it is also a signal to increase. Third, it overcame the critical line Kijun-sen. Fourth, the fundamental background for the pair unexpectedly changed from "bearish" to "bullish". Of course, by and large, Brexit's next delay cannot be called extra positive news for the pound and for the UK as a whole. However, this is still good news. Given the strong oversold pound (certainly justified by fundamental factors), the pair is likely to grow in September. Boris Johnson's hands are now restrained by the shackles of the newly adopted Brexit blocking law, and with a clear conscience, the Parliament is going on vacation tomorrow arranged by Boris Johnson himself. Trading recommendations: The pound/dollar is ready to form an upward trend on the 24-hour timeframe. At the moment, the pair has reached the Ichimoku cloud, which is now an obstacle to the further growth of the GBP/USD pair. Thus, next week the bulls need to continue to develop their success, while they favor the fundamental background. In addition to the technical picture, fundamental data and the time of their release should also be taken into account. Explanation of the illustration: Ichimoku indicator: Tenkan-sen is the red line. Kijun-sen is the blue line. Senkou Span A - light brown dotted line. Senkou Span B - light purple dashed line. Chikou Span - green line. Bollinger Bands Indicator: 3 yellow lines. MACD indicator: Red line and bar graph with white bars in the indicator window. The material has been provided by InstaForex Company - www.instaforex.com |
| Posted: 08 Sep 2019 03:40 PM PDT 24 hour timeframe The speech of Federal Reserve Chairman Jerome Powell on Friday was the final chord of the week, which was rather rich in macroeconomic events. As we said in previous articles, traders ignored all reports from the European Union and the United States on Friday. Even one of the most significant NonFarm Payrolls reports with a real value much lower than the forecast did not cause traders' reaction. What is it? Reluctance of traders to change the "bearish" mood to "bullish"? The disbelief of bulls in the ability of the euro to rise in price against the dollar? The currency market's disbelief in the Fed's key interest rate cut in September, or high concerns about easing the already ultra-soft monetary policy of the European Union? In part, traders could get an answer on Friday night. Federal Reserve Chairman Jerome Powell spoke in Zurich and touched on US monetary policy. Powell's speech began with words about "good performance in the US economy." However, Powell notes that high risks of a global recession remain, a slowdown in global economic growth, and uncertainty over trade wars and low inflation. GDP growth in 2019 is expected to reach 2% - 2.5%. Powell also touched on the slowdown in the index of business activity in the US manufacturing sector (recall that the ISM index this week fell to 49.1 points, indicating a decline in the industry). He said that so far the decline in business activity in production has been offset by the larger services sector and the high level of business activity in it (which is confirmed by the same ISM index for the services sector, which rose to 56.4). At the end of his speech, Powell said that he expects moderate growth in the global economy and the US economy. Thus, the head of the Fed in no way clarified the situation with a possible second consecutive easing of monetary policy at a regulator meeting on September 17-18. However, analysts expect a rate cut in September with a 90% probability. Mostly thanks to James Bullard, a member of the Fed's monetary committee, who spoke earlier on this issue. But his colleague, the head of the Boston Federal Reserve, Eric Rosengren, on the contrary, believes that the US economy is in good condition and there is no need to reduce the rate. We believe that the probability of a rate cut in September is not 90%, but slightly less, say 70%. An important role in this matter is played by the constant pressure of US President Donald Trump on the Fed and Jerome Powell. In addition, in earlier reviews, we assumed that Trump could put pressure on other members of the monetary committee, fully aware that not only Powell decides to change or not change monetary policy. Thus, the rhetoric of James Bullard that the rate can be immediately trimmed by 0.5%, can be considered as a "deflection" under Donald Trump, who needs to reduce the rate like air. We mentioned more than once as to why Trump would lower the rate. Firstly, competitors, the United States, China, the European Union, have an influence on their central banks and, accordingly, can artificially depreciate their national currencies in order to gain an advantage in trade relations with the United States and offset the damage from duties imposed by Trump. Secondly, for a country that eternally lives in debt, the issue of servicing this debt is an acute issue. The more expensive the dollar, the more difficult it is to service the debt. For example, Bloomberg analysts conducted a study. They suggested what would happen to the US economy if the opportunity to build up debts disconnected and America would have to live within its means. The results of the study turned out to be very disappointing, but predictable. The country's GDP per capita in this case will go into the negative zone. It is clear that the GDP indicator itself cannot be negative, since it expresses the total value of goods and services produced and rendered in the country. However, the fact that the GDP was negative in the study excellently shows how much the US economy is dependent on debt. In addition, Trump's policy is to return the production facilities of companies that have chosen "cheaper countries" for the production of their goods to the United States. This will provide an opportunity to further develop the labor market and receive even more tax revenues. However, how to do this, if the dollar is very expensive (and constantly rising in price), it is very expensive to produce goods in the US, so these goods cost a fortune abroad. The answer is simple: the US dollar must be cheap in order to be able to produce goods in the United States, and easily sell them abroad. However, to implement this plan, not only a cheap dollar is needed, but also so that the dollar remains the world's reserve currency. In this case, the United States will be able to continue to increase the debt base, which is the basis of the well-being and financial system of this country. That is why Trump does not cease to "pick on" the Fed and claim that America's main enemy is not China but the Fed. That is why Trump needs low rates, which is almost guaranteed to cause the dollar to drop in global financial markets. Well, the technical picture on the 24-hour timeframe has not changed much since the last review. The euro/dollar pair again adjusted to the critical line, bounced off from it again and can now resume the formation of a downward trend. The target is 1.0883. If the ECB lowers its key rate in September and announces the use of other monetary easing instruments, the euro could go down to a record 1.05 against the US currency. Trading recommendations: The trend for the euro/dollar pair remains downward. Bears reached the support level of 1.0967, so now you can count on a rebound and a slight increase in the pair. But in general, given the fundamental background, we believe that the pair's fall will continue in September. In addition to the technical picture, fundamental data and the time of their release should also be taken into account. Explanation of the illustration: Ichimoku indicator: Tenkan-sen is the red line. Kijun-sen is the blue line. Senkou Span A - light brown dotted line. Senkou Span B - light purple dashed line. Chikou Span - green line. Bollinger Bands Indicator: 3 yellow lines. MACD indicator: Red line and bar graph with white bars in the indicator window. The material has been provided by InstaForex Company - www.instaforex.com |
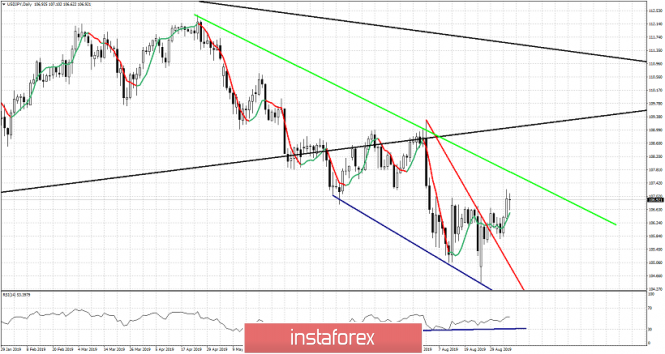
| USDJPY in bounce mode eyeing 107.50. Posted: 08 Sep 2019 02:31 AM PDT As we warned in previous posts, USDJPY was ready for a bounce towards 107-107.50 and maybe higher. Price broke above short-term resistance and is trying to recapture 107. There is potential for a move higher and bulls are in control of the short-term trend as long as price is above 105.85.
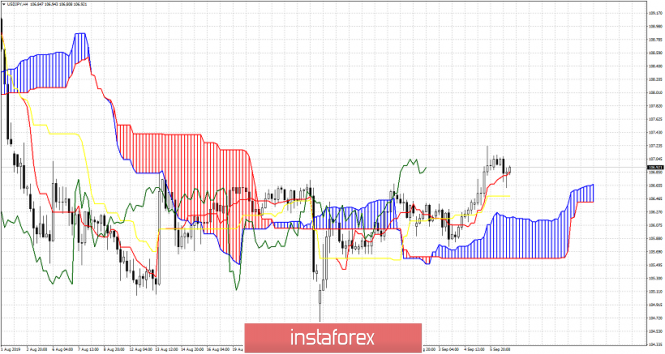
Blue lines - bullish divergence Green line - important resistance trend line USDJPY is expected to move towards the green trend line resistance around 107.50. Short-term trend is bullish and as can be seen in the 4 hour chart below, price is above the Kumo (cloud) with tenkan-sen (red line indicator) above the kijun-sen (yellow line indicator) and with a recent bullish cross.
|
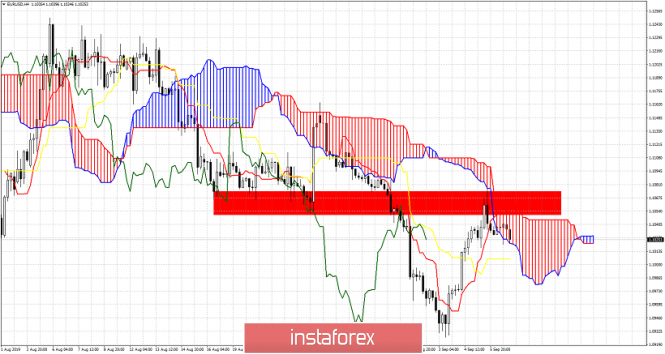
| EURUSD gets rejected at previous support now resistance area of 1.1050. Posted: 08 Sep 2019 02:24 AM PDT EURUSD has bounced as expected from 1.0950 to 1.1050 as expected. Price back tested the previous support now resistance area and got rejected. This bounce was a selling opportunity as we explained since trend remains bearish and price challenged the cloud resistance.
EURUSD bounced towards cloud resistance and got rejected. Price has broken below the tenkan- sen (red line indicator). Support is found at 1.10 by the kijun-sen (yellow line indicator). Breaking below it combined with a break below the Kumo (cloud) would be a bearish signal at least for the short-term. If the tenkan-sen (red line indicator) crosses the kijun-sen (yellow line indicator) we will have another bearish signal for EURUSD that could lead to a move below 1.09. On the other hand if support at 1.10 holds and price breaks above 1.1085 then we have a bullish signal. However traders need to be very cautious even if price breaks above resistance and wait for a pull back towards cloud support. The material has been provided by InstaForex Company - www.instaforex.com |
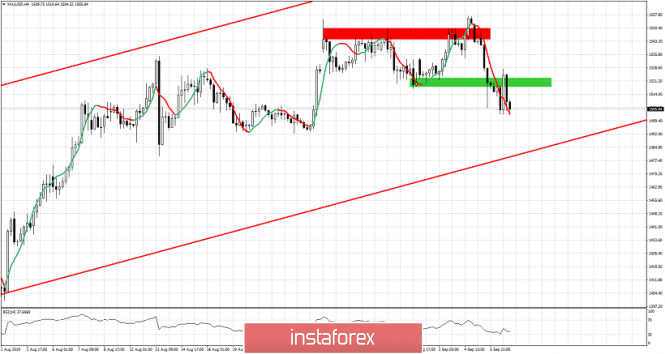
| Posted: 08 Sep 2019 02:11 AM PDT Gold price despite making a slightly higher high this week at $1,557, price reversed and closed below last week's low breaking below short-term support levels. The bearish divergence warning signs that we noted in previous posts together with one more new higher high come to life.
Red rectangle - resistance Green rectangle - support Gold price initially moved above the red resistance area but it seems that was a false break out. The chances for this happening were high because we noted in previous posts that the bullish trend was weakening and each new higher high was followed by a divergent high by the RSI. Breaking below $1,533 was the confirmation of the false breakout. Price failed to hold above the green support area and is now moving lower. Our short-term target is the medium-term lower channel boundary near $1,480. Short-term trend is bearish. Support is at $1,490-$1,500 and breaking below this level will certainly push prices lower to test the channel support. The material has been provided by InstaForex Company - www.instaforex.com |
| You are subscribed to email updates from Forex analysis review. To stop receiving these emails, you may unsubscribe now. | Email delivery powered by Google |
| Google, 1600 Amphitheatre Parkway, Mountain View, CA 94043, United States | |
No comments:
Post a Comment