
Forex analysis review |
- Fractal analysis of the main currency pairs for October 3
- Trading Idea for NZD/CAD
- EUR/USD. Dollar bulls are frightened by the ADP report
- GBP/USD. October 2. Results of the day. The latest Brexit proposal to the EU looks unconvincing
- EUR/USD. October 2. Results of the day. The euro reached the long-awaited low or is it just another correction?
- Gold does not need peace
- EUR/USD: dizzying somersaults of the dollar and cautious hopes for the euro's growth
- A predicted fall for the kiwi, but it maintains defense
- The border between Britain and Ireland "injures" the pound
- BTC 10.02.2019 - Sellers in control, watch for selling opportunities
- October 2, 2019 : EUR/USD Intraday technical outlook and trade recommendations.
- GBP/USD 10.02.2019 - Bullish divergence on the 4H time-frame
- Gold 10.02.2019 - First upward target has been met, more upside yet to come
- October 2, 2019 : GBP/USD Intraday technical outlook and trade recommendations.
- Short-term EURUSD analysis for October 2nd, 2019
- Gold price back tests broken support now resistance
- Trading recommendations for the EURUSD currency pair – placement of trade orders (October 2)
- GBP/USD: plan for the American session on October 2nd. The pound fell on the construction sector data
- EUR/USD: plan for the American session on October 2nd. Euro buyers are trying to return to the market
- Technical analysis of GBP/USD for October 02, 2019
- Trading plan for EUR/USD for October 02, 2019
- Trading strategy for EUR/USD on October 2nd. Business activity in the EU and the US continues to fall. Trump is furious again
- Trading strategy for GBP/USD on October 2nd. The number of factors in the fall of the pound – huge
- Trading idea on EUR/USD
- Trading recommendations for the GBPUSD currency pair - placement of trade orders (October 2)
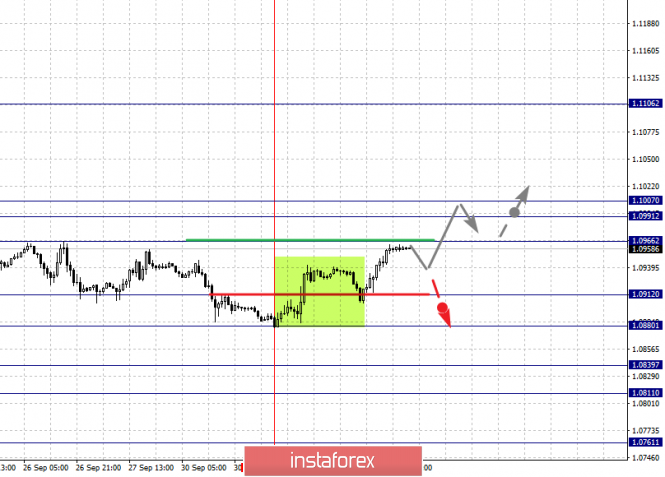
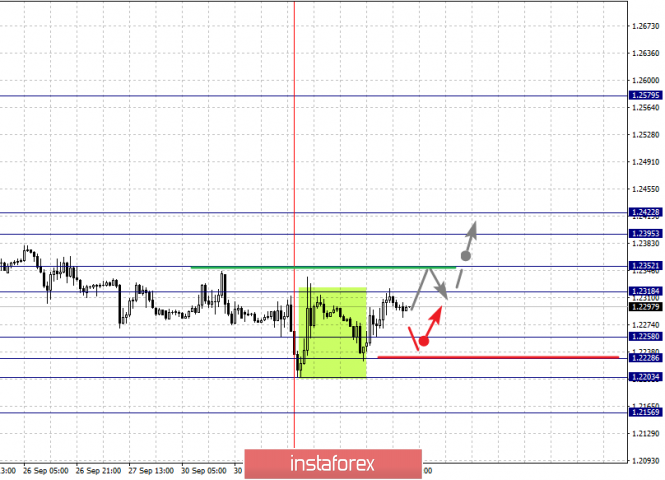
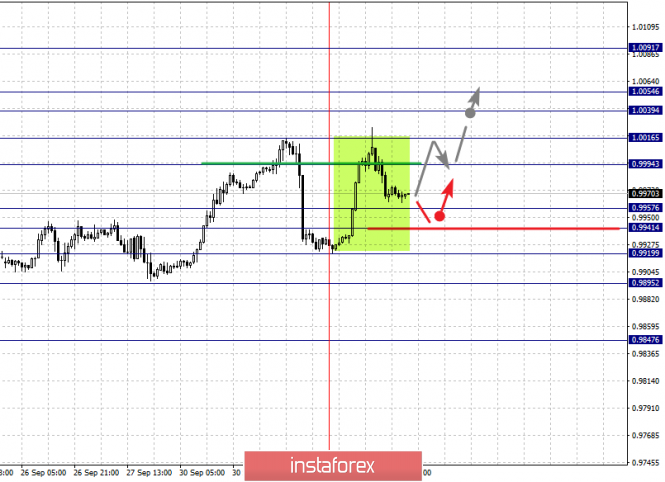
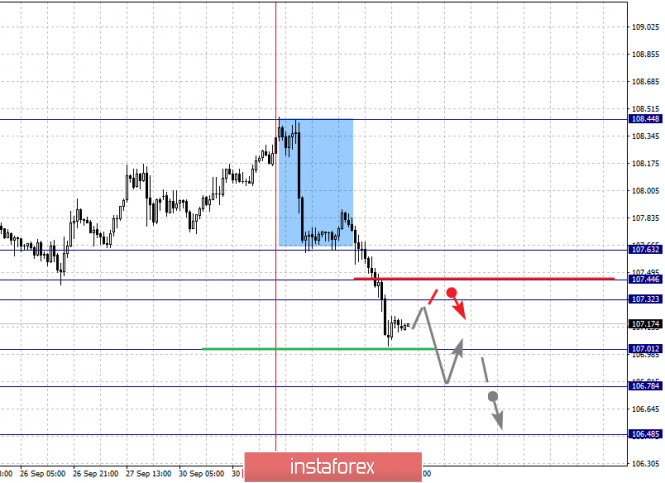
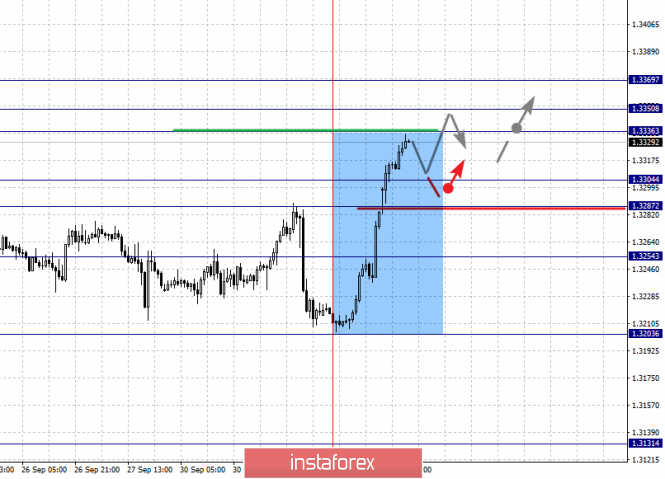
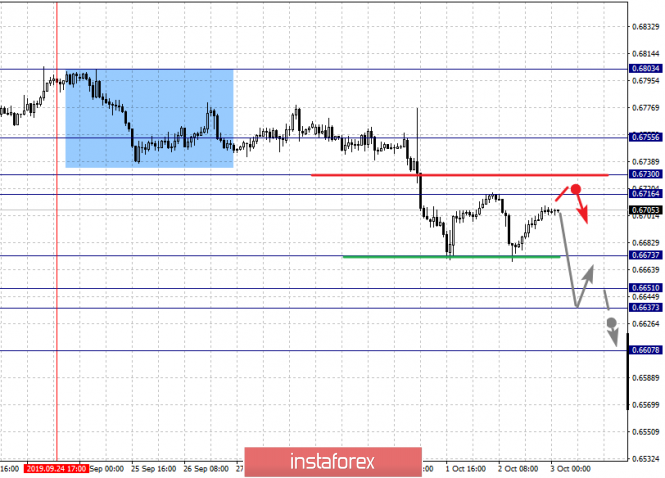
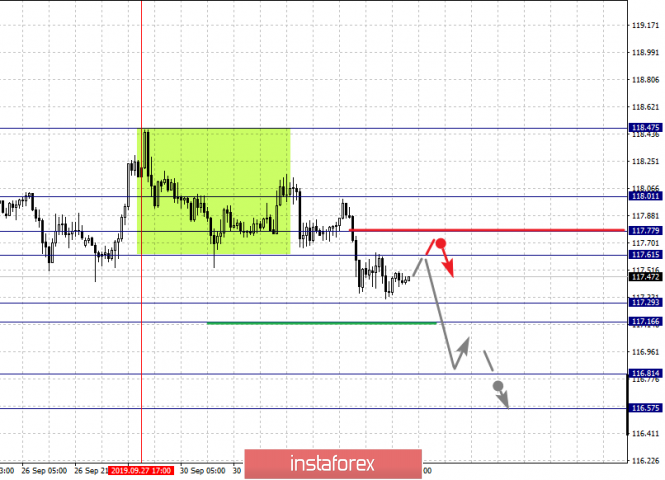
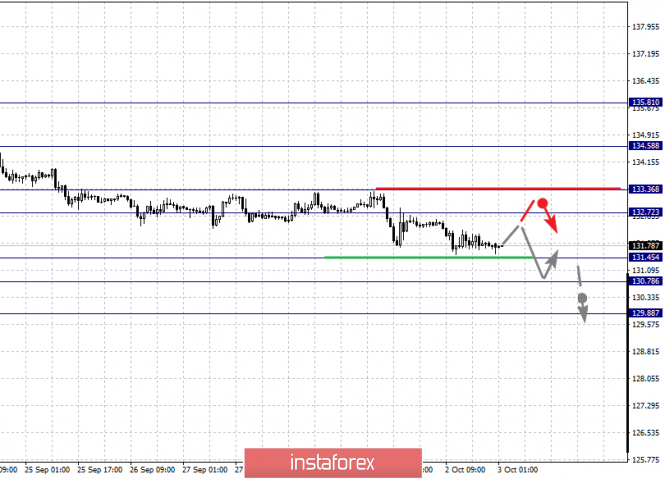
| Fractal analysis of the main currency pairs for October 3 Posted: 02 Oct 2019 06:03 PM PDT Forecast for October 3: Analytical review of currency pairs on the scale of H1: For the euro / dollar pair, the key levels on the H1 scale are: 1.1007, 1.0991, 1.0966, 1.0912, 1.0880, 1.0839, 1.0811 and 1.0761.Here, the price is in correction and forms a small potential for the top of October 1. The development of the ascending structure of October 1 is expected after the breakdown of the level of 1.0966. In this case, the first goal is 1.0991. Price consolidation is n the range of 1.0991 - 1.1007. We expect the design of expressed initial conditions for the upward cycle up to the level of 1.1007. The continuation of the movement to the bottom is expected after the breakdown of the level of 1.0912. In this case, the first target is 1.0880. The breakdown of which will allow us to count on movement to the level of 1.0839. Short-term downward movement, as well as consolidation is in the range of 1.0839 - 1.0811. For the potential value for the bottom, we consider the level of 1.0761. Upon reaching this level, we expect a pullback to the top. The main trend is the descending structure of September 13, the stage of deep correction. Trading recommendations: Buy: 1.0967 Take profit: 1.0990 Buy Take profit: Sell: 1.0912 Take profit: 1.0884 Sell: 1.0880 Take profit: 1.0840 For the pound / dollar pair, the key levels on the H1 scale are: 1.2422, 1.2395, 1.2352, 1.2318, 1.2258, 1.2228, 1.2203 and 1.2156. Here, the price is in correction from the downward structure and forms a small potential for the top of October 1. Short-term upward movement is expected in the range of 1.2318 - 1.2352. The breakdown of the latter value will lead to the formation of expressed initial conditions for the upward cycle of October 1. Here, the target is 1.2395. Noise range 1.2395 - 1.2422. Short-term downward movement is expected in the range 1.2258 - 1.2228. The breakdown of the latter value will lead to the subsequent development of a downward trend in the scale of H1. In this case, the first goal is 1.2203. For the potential value for the bottom, we consider the level of 1.2156. Upon reaching this level, we expect a pullback to the top. The main trend is the descending structure of September 20, the correction stage. Trading recommendations: Buy: 1.2318 Take profit: 1.2350 Buy: 1.2353 Take profit: 1.2395 Sell: 1.2258 Take profit: 1.2230 Sell: 1.2226 Take profit: 1.2203 For the dollar / franc pair, the key levels on the H1 scale are: 1.0091, 1.0054, 1.0039, 1.0016, 0.9994, 0.9957, 0.9941, 0.9919 and 0.9895. Here, the price has formed a local structure for the subsequent development of an upward trend on the H1 scale. Short-term upward movement is expected in the range 0.9994 - 1.0016. The breakdown of the latter value will lead to a movement to the level of 1.0039. Price consolidation is near this level. The passage at the price of the noise range 1.0039 - 1.0054 should be accompanied by a pronounced upward movement. Here, the potential target is 1.0091. Short-term downward movement is possibly in the range of 0.9957 - 0.9941. The breakdown of the last value will have the downward movement. Here, the first goal is 0.9919. As a potential value for the bottom, we consider the level of 0.9895. The main trend is the local ascending structure of October 2. Trading recommendations: Buy : 0.9995 Take profit: 1.0014 Buy : 1.0017 Take profit: 1.0039 Sell: 0.9956 Take profit: 0.9941 Sell: 0.9939 Take profit: 0.9919 For the dollar / yen pair, the key levels on the scale are : 107.63, 107.44, 107.32, 107.01, 106.78 and 106.48. Here, we are following the development of the downward cycle of October 1. The continuation of movement to the bottom is expected after the breakdown of the level of 107.01. In this case, the target is 106.78. Price consolidation is near this level. For the potential value for the downward movement, we consider the level of 106.48. Upon reaching which, we expect a pullback to the top. Short-term upward movement is expected in the range of 107.32 - 107.44. The breakdown of the last value will lead to an in-depth correction. Here, the goal is 107.63. This level is a key support for the downward structure. The main trend: the downward cycle of October 1. Trading recommendations: Buy: 107.32 Take profit: 107.43 Buy : 107.46 Take profit: 107.63 Sell: 107.00 Take profit: 106.80 Sell: 106.75 Take profit: 106.48 For the Canadian dollar / US dollar pair, the key levels on the H1 scale are: 1.3369, 1.3350, 1.3336, 1.3304, 1.3287 and 1.3254. Here, we are awaiting the formalization of the expressed initial conditions for the upward cycle of October 2. Short-term upward movement is possibly in the range 1.3336 - 1.3350. From here, we expect a key reversal in the correction. For the potential value for the top, we consider the level of 1.3369. Short-term downward movement is possibly in the range of 1.3304 - 1.3287. The breakdown of the latter value will lead to an in-depth correction. Here, the target is 1.3254. This level is a key support for the top. The main trend is the formation of the upward potential of October 2. Trading recommendations: Buy: 1.3336 Take profit: 1.3350 Buy : 1.3352 Take profit: 1.3369 Sell: 1.3304 Take profit: 1.3390 Sell: 1.3285 Take profit: 1.3260 For the Australian dollar / US dollar pair, the key levels on the H1 scale are : 0.6755, 0.6730, 0.6716, 0.6673, 0.6651, 0.6637 and 0.6607. Here, we are following the local downward cycle of September 24. At the moment, the price is in the correction zone. The continuation of the movement to the bottom is expected after the breakdown of the level of 0.6670. In this case, the target is 0.6651. Price consolidation is in the range of 0.6651 - 0.6637. For the potential value for the bottom, we consider the level of 0.6607. Upon reaching this level, we expect a pullback to the top. Short-term upward movement is possibly in the range of 0.6716 - 0.6730. The breakdown of the last value will lead to a long correction. Here, the potential target is 0.6755. This level is a key support for the downward structure. The main trend is the downward cycle of September 13, the correction stage. Trading recommendations: Buy: 0.6716 Take profit: 0.6730 Buy: 0.6734 Take profit: 0.6755 Sell : 0.6670 Take profit : 0.6652 Sell: 0.6635 Take profit: 0.6607 For the euro / yen pair, the key levels on the H1 scale are: 118.01, 117.77, 117.61, 117.29, 117.16, 116.81 and 116.57. Here, we determined the next goals from the local descending structure on September 27. The continuation of the movement to the bottom is expected after the price passes the noise range 117.29 - 117.16. In this case, the target is 116.81. For the potential value for the bottom, we consider the level of 116.57. Upon reaching which, we expect a rollback to the correction. Short-term upward movement is possibly in the range 117.61 - 117.77. The breakdown of the latter value will lead to in-depth movement. Here, the goal is 118.01. This level is a key support for the downward structure. The main trend is the local descending structure of September 27. Trading recommendations: Buy: 117.61 Take profit: 117.75 Buy: 117.80 Take profit: 118.00 Sell: 117.14 Take profit: 116.85 Sell: 116.78 Take profit: 116.60 For the pound / yen pair, the key levels on the H1 scale are : 134.58, 133.36, 132.72, 131.45, 130.78 and 129.88. Here, we are following the development of the descending structure of September 20. Short-term movement to the bottom is expected in the range 131.45 - 130.78. The breakdown of the latter value will lead to movement to a potential target - 129.88. When this level is reached, we expect a pullback to the top. Short-term upward movement is possibly in the range of 132.72 - 133.36. The breakdown of the last value will lead to a long correction. Here, the target is 134.58. We also expect the formation of expressed initial conditions for the upward cycle to this level. The main trend is the descending structure of September 20. Trading recommendations: Buy: 132.72 Take profit: 133.30 Buy: 133.40 Take profit: 134.55 Sell: 131.43 Take profit: 130.80 Sell: 130.74 Take profit: 129.90 The material has been provided by InstaForex Company - www.instaforex.com |
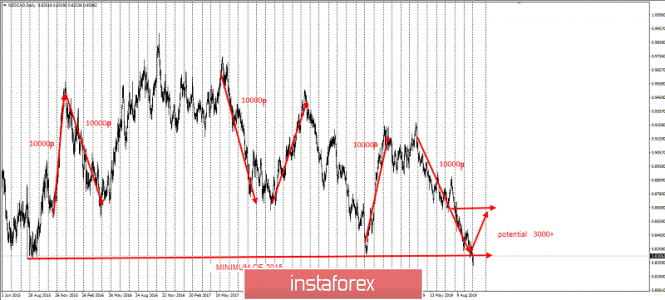
| Posted: 02 Oct 2019 04:50 PM PDT As you know, cross-rates are an excellent tool for hedging positions in "majors", such as the most popular of them - the EUR/USD pair. I recommend for each position in major - to have a position in the "right" cross, and you will appreciate this tactic of distributing profits between instruments. Let's pay attention to the very oversold NZD/CAD cross-instrument, which has passed 10,000 p for 5 figures almost without a pullback since March 2019. However, several people know that this cross has an average rollback passage of exactly 10 points. And right now, after updating the minimum of 2015, it makes sense to buy it with a potential of at least 3,000 p at 5 figures. It is easier to do this by collecting a grid of orders in longs on pullback movements. In fact, you will work out a false breakdown on an annual scale, or rather - for 4 years. This does not happen every day. Therefore, it is necessary to take advantage of this unique opportunity. The material has been provided by InstaForex Company - www.instaforex.com |
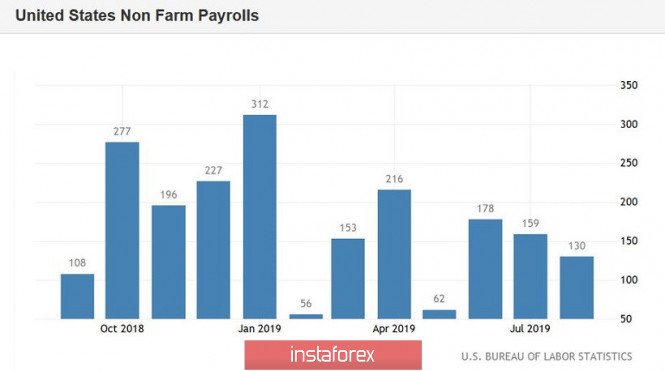
| EUR/USD. Dollar bulls are frightened by the ADP report Posted: 02 Oct 2019 03:48 PM PDT US statistics continue to disappoint dollar bulls: following the release of the extremely weak manufacturing index ISM, a weak report was published today from the analytical agency ADP. The dollar index continued to decline, and the EUR/USD pair got an opportunity for its corrective growth. Once again, the bears could not gain a foothold in the eighth figure, making it possible for the bulls to seize the initiative. It is worth recalling that a month ago, the ADP report likewise alerted traders, portending weak Nonfarms. As it turned out later, the agency's specialists confirmed their reputation: official figures came out worse than forecasts, causing concern not only among experts, but also among some members of the Federal Reserve. Today the situation is repeating, only now the rates are slightly higher: if Friday's data confirms the weakening labor market, this will be a serious argument in favor of lowering the interest rate by the end of this year. 135 thousand created jobs in the private sector: this verdict was announced today by Automatic Data Processing. Such a low result was the worst in the last four months, since this indicator reached 41 thousand in May (and Nonfarm, in turn, at 72 thousand). However, in this case, the trend itself is more alarming. The fact is that the results of the last month were also reviewed in the direction of deterioration, and very significantly - from 195 to 157 thousand. The ISM manufacturing index is also worth mentioning here: the indicator of industrial activity in the US fell to a ten-year low, contrary to analysts' forecasts, who expected its growth in September. The volume of construction costs in August also showed a negative trend - instead of growing by 0.5%, the indicator rose only by 0.1%. Let me remind you that according to the results of the September meeting of the Fed, ten members of the regulator stated that they did not see any reason for easing monetary policy by the end of this year. However, seven of their colleagues still allowed this scenario. Jerome Powell himself tried to maintain a balance between hawks and bears. At his press conference, he strongly avoided making any predictions regarding future prospects, "hiding" behind vague and ambiguous formulations. He said that members of the regulator will make decisions depending on the current situation, while monitoring key indicators. It is quite obvious that after such words all the attention of traders is directed to the Nonfarms data, which either confirms the given trend or refutes it. In my opinion, today we can say with great certainty that the official data on Friday will disappoint the market - just like a month ago. Even the consensus forecast leaves low chances: according to most analysts, the indicator will reach 140 thousand. In other words, Nonfarm has minimal, if not zero, chances to overcome the key 200,000th mark. Thus, now the EUR/USD pair is at a crossroads: either the dollar will continue its rally, or the pair will get another chance for recovery, as part of the correctional growth. But here it is worth noting that if official data on the labor market come out even worse than expected, the pair is unlikely to leave the 10th figure. Yes, the impulsive reaction will be bullish, but the upward movement will be limited, since the European currency is now under the yoke of its own problems. If we talk about the medium term, then everything will depend on the reaction of Fed members to published releases. Indeed, the key statistics in this case are just an excuse to assess the general situation on the part of representatives of the Federal Reserve - and especially on the part of Jerome Powell. The closer the Friday indicator is to the figure of 200,000, the higher the likelihood of "hawkish" notes in the rhetoric of regulator members will be. Vice versa: if the official figures coincide with the ADP report (I'm not talking about lower results), then the "dove wing" of the Fed will have an extra opportunity to remind its colleagues about the need for further steps to mitigate monetary policy. In other words, the medium-term vector of the EUR/USD movement will not be determined on Friday, but somewhat later - when the Fed representatives comment on the situation in the labor market and in the US economy as a whole. Thus, in spite of today's general weakening of the dollar, on the whole, the fundamental picture remains uncertain, despite the ADP "hint". The technical picture in the medium term also speaks of uncertainty: on a four-hour chart, EUR/USD tested the middle line of the Bollinger Bands indicator, but could not overcome it. On the daily chart, the price could not even approach the midline of this indicator. This suggests that the downward trend is still dominant in the pair, and dollar bulls have only temporarily retreated, waiting in the wings. The Friday release will either return the pair within the framework of the eighth figure, or allow the bulls to "visit" the tenth figure again. The material has been provided by InstaForex Company - www.instaforex.com |
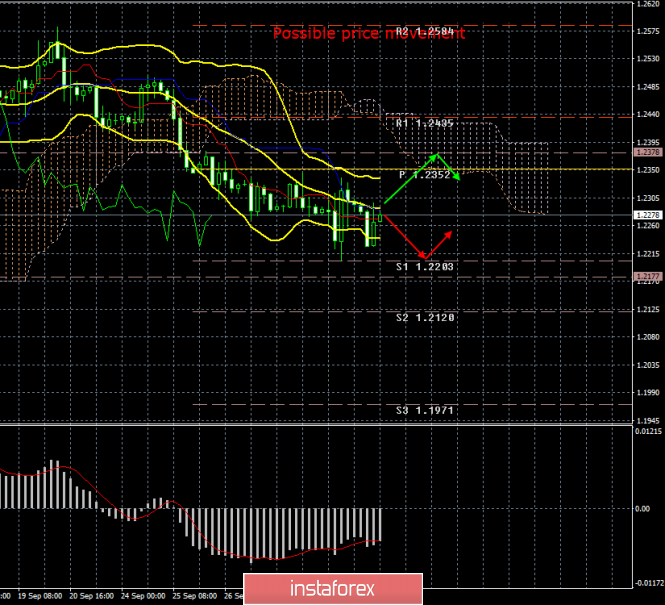
| GBP/USD. October 2. Results of the day. The latest Brexit proposal to the EU looks unconvincing Posted: 02 Oct 2019 03:48 PM PDT 4-hour timeframe Amplitude of the last 5 days (high-low): 150p - 78p - 66p - 70p - 134p. Average volatility over the past 5 days: 99p (high). The GBP/USD currency pair has been treading water for the last two days, as if not knowing where to go next. The first support level of 1.2203 worked out perfectly, point to point, followed by a rebound and a correction began, similar to the correction for the EUR/USD currency pair. As in the case of the European currency, it is strange that the pound has not continued to fall today. The fact is that the US ADP report on the change in the number of people employed in the private sector cannot be called a failure. But it is possible to do so for the British index of business activity in the construction sector. The total value for September fell to 43.3. Recall that any value of the indicator of business activity below 50 is considered to signal a decline. Of course, we can say that both reports do not have the degree of significance for traders to unconditionally respond to them. On the labor market in the United States, NonFarm Payrolls is more important, and in Britain, indexes of business activity in the areas of production and services are more interesting. Meanwhile, at the annual conference of the Conservative Party, Boris Johnson announced that he would forward the latest proposal to the EU leaders regarding the "deal" on Brexit. According to the odious prime minister, if it does not suit European leaders, then London officially refuses further negotiations and prepares for a "hard" exit on October 31. Of course, Johnson again did not even tell his party members how he was going to circumvent the law obliging him to ask the European Union for a postponement and prohibiting him from implementing Brexit without a deal. But Boris Johnson has excellently publicized his proposal of the EU among his party members, calling it "constructive and reasonable, which will allow a compromise on both sides." But now, will the bloc consider him such? Johnson also said that his plan would be based on the principles of "the absence of customs points on the border between Ireland and Northern Ireland" and "the United Kingdom gaining full control of foreign trade policy after Brexit". Not even a few hours after the speech of the prime minister of Great Britain, skepticism has already emerged from EU countries. The first to speak was Irish Foreign Minister Simon Coveney. He said that such a plan "is not able to become the basis for an agreement on Brexit." However, we believe that it is better not to rush things, and wait for the comments of Jean-Claude Juncker, representatives of the European Parliament or the European Commission, as well as the leaders of the EU member states. As a result, we can say that the fundamental background for the pound/dollar pair has not changed much. Yes, there was enough important and interesting information published reports, but they are all more neutral in nature. As before, everything rests on Brexit, on the uncertainty associated with it. We consider this general fundamental background for the pound to be negative. By the way, the technical picture of the pair, despite the correction and rebound from the level of 1.2203, also implies the resumption of the downward trend. There was no consolidation above the critical Kijun-sen line. All lines of the Ichimoku indicator are still directed down. At the same time, volatility remains at a fairly high level - about 100 points per day, which indicates that traders did not leave the forex market. Trading recommendations: The GBP/USD currency pair is currently being adjusted. Thus, we recommend that you wait for the correction to complete, and then again consider buying the US currency while aiming for support levels 1.2203 and 1.2177. It's not recommended that you return to buying yet. In addition to the technical picture, fundamental data and the time of their release should also be taken into account. Explanation of the illustration: Ichimoku indicator: Tenkan-sen is the red line. Kijun-sen is the blue line. Senkou Span A - light brown dotted line. Senkou Span B - light purple dashed line. Chikou Span - green line. Bollinger Bands Indicator: 3 yellow lines. MACD indicator: Red line and bar graph with white bars in the indicator window. The material has been provided by InstaForex Company - www.instaforex.com |
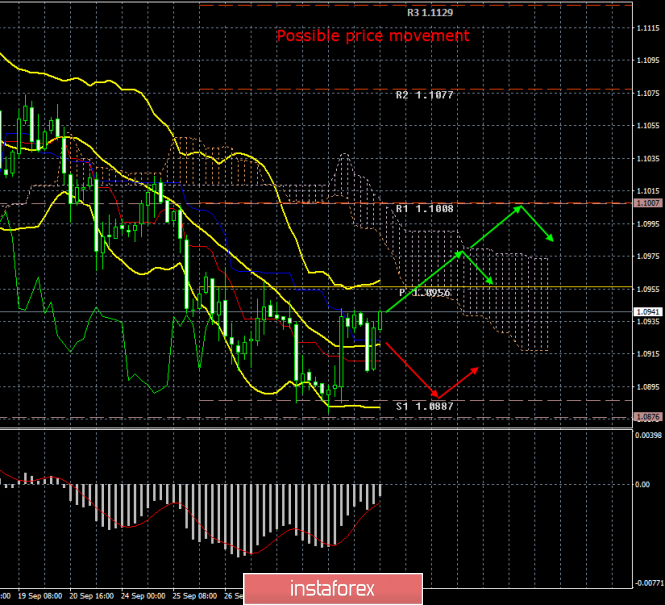
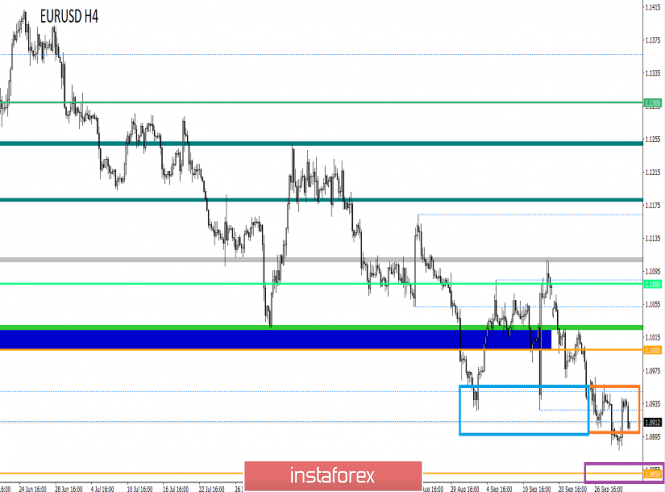
| Posted: 02 Oct 2019 03:48 PM PDT 4-hour timeframe Amplitude of the last 5 days (high-low): 84p - 59p - 54p - 63p - 64p. Average volatility over the past 5 days: 65p (average). The EUR/USD currency pair adjusted for the second consecutive day. For the euro currency, this event can be considered an achievement, since the currency did not lose its position against the US dollar for two whole days. Moreover, today the currency of the European Union managed to overcome the critical Kijun-sen line, which to a greater extent "came" to the price itself, rather than the pair rose to it. Nevertheless, there is a consolidation over the Kijun-sen line, which is a critical trend-supporting line. Now the bulls can feel a surge of strength and buy the euro with a vengeance. We could if there were enough fundamental factors. On Wednesday, October 2, the only macroeconomic report was published in the States. The ADP report showed that the number of employees in the US increased by 135,000 in September. Forecasts predicted an increase of 140,000. Well, a slight discrepancy. However, either the bear positions were too weak in recent days, or traders were so impressed with the shortage of 5,000 workers in the United States, but the euro has shown steady growth in the last 6 hours. The most interesting thing is that this growth can hardly be connected with the speech of the ECB President Mario Draghi in Athens, which once again, though indirectly, indicated the weakness of the bloc's economy. This time it was about investment. Mario Draghi called on all EU member states to introduce fiscal stimulus measures to support investment. That is, according to Draghi, the measures taken by the European regulator are not enough to save the economy of the entire bloc. Each country should also take responsibility for maintaining and stimulating the economy of the entire union. Draghi also expressed a positive attitude towards the decision to create a common eurozone budget since 2021, but nevertheless he paid more attention to problems during his speech. At the end of the speech, Draghi once again reminded the audience that in any case, monetary policy will fulfill its function, that is, stimulate the economy. What can be said as a conclusion? Mario Draghi, who has less than a month to spend at his post, has once again stepped on the euro currency. Perhaps he says the right thing, because the ECB is more interested in the stability and condition of the entire EU economy, and the value of the euro in the foreign exchange market is not the biggest problem. At least, the central bank has never voiced its goal - to maintain the exchange rate of the single European currency. Nevertheless, Draghi again stepped on the euro. By miracle, the bears were not provoked during his speech and did not rush to buy the US dollar again. It is unlikely that the fall of the US dollar today can be connected with the next matches of Donald Trump to the Federal Reserve and Jerome Powell. That's all, as always. It is not even worth it to know exactly what Trump's criticism is. Of course, "too high rates and Powell's reluctance to lower them as quickly as possible." In addition, the Trump party announced a record collection of voluntary donations for the election campaign - $125 million. This is almost twice as much as Barack Obama collected when he wanted to run for a second term. What is the result? What are the prospects for the European currency today? From our point of view, high technical factors can provoke a strengthening of the euro and a fall in the dollar. There are not many of these technical factors at the moment. Until the euro/dollar pair overcomes the Ichimoku cloud, all upward movement will be regarded as a banal correction. The fundamental growth factors for the euro have not increased in recent days. Moreover, yesterday's reports on business activity in the eurozone showed that there are no improvements in reality. There is only a minimal correction of business activity indicators in the manufacturing sector, which should not be regarded as the first step towards improving the situation. Trading recommendations: The EUR/USD pair continues its corrective movement. Since the bulls managed to gain a foothold above the critical line, the first goal for the upward movement is now the upper boundary of the Ichimoku cloud, the Senkou span B line. You can trade on this target, but very carefully, since the pair has few growth factors. In addition to the technical picture, fundamental data and the time of their release should also be taken into account. Explanation of the illustration: Ichimoku indicator: Tenkan-sen is the red line. Kijun-sen is the blue line. Senkou Span A - light brown dotted line. Senkou Span B - light purple dashed line. Chikou Span - green line. Bollinger Bands Indicator: 3 yellow lines. MACD indicator: Red line and bar graph with white bars in the indicator window. The material has been provided by InstaForex Company - www.instaforex.com |
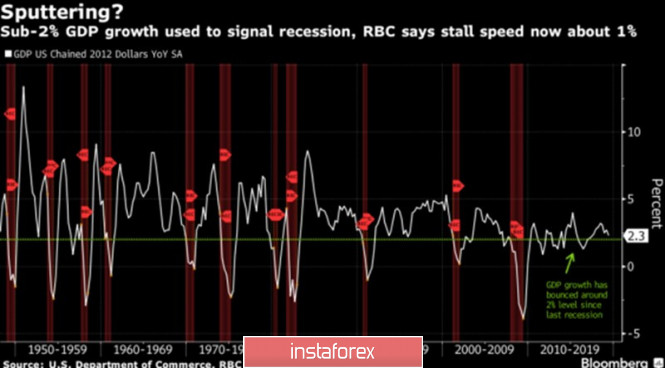
| Posted: 02 Oct 2019 03:48 PM PDT The fall in business activity in the US manufacturing sector to the area of a 10-year low drove the arrogance of gold sellers, but did not convince buyers to return to long positions. The bulls are seriously frightened by the collapse of XAU/USD quotes and want additional arguments in favor of the restoration of the trend. For example, weak statistics on the US labor market for September, which will convince the Federal Reserve of the need to further reduce the rate on federal funds. After four quarters of growth, which is the longest series in the last 8 years, the precious metal has entered a correction. Growing net long positions, speculators realized that they had gone too far. They were guided by the idea of slowing down the global economy, record low profitability of the global debt market and the Fed's focus on easing monetary policy for preventive purposes. In fact, if the next round of US-China trade negotiations ends with a breakthrough, global GDP will begin to regain lost ground, US stock indices will refresh record highs, risk appetite will increase, and safe haven assets will come under pressure. It is not a fact that global debt market rates will continue to go down. Investors are actively discussing the version that central banks have overdone easing monetary policy. They are unable to cope with trade wars, and it takes fiscal stimulus, not monetary, to keep the affected economies afloat. Contrary to the federal funds rate cut, the US dollar is not going to fall. As a result, the XAU/USD "bears" had serious arguments for attacks, although not all "bulls" intend to give up. In particular, TD Securities believes that the precious metal can still grow to $1,600 per ounce. The precious metal's fans bet on the deterioration of relations between Washington and Beijing. As the index of purchasing managers in the manufacturing sector shows, the US economy is already beginning to feel the pain of trade wars. If GDP, instead of the 2.3% expected by Bloomberg analysts, grows in 2019 by 1.5% or less, the Fed will be forced to aggressively weaken its monetary policy. This will strike both the US dollar and the yield on Treasury bonds, and lend a helping hand to gold. US GDP dynamics Thus, the precious metal is unlikely to determine the further direction of its movement after the release of data on business activity and the US labor market. It needs information on the course of trade negotiations between Washington and Beijing. In my opinion, the risks of escalating the conflict are great: if Donald Trump agrees to a partial agreement, the Democratic opponents will actively criticize him. But there are no special prerequisites for concluding a comprehensive agreement: the positions of the conflicting parties vary significantly. Technically, a head and shoulders reversal pattern was formed on the daily gold chart. Quotes may go down to the target for this model, which is near $1412 per ounce. On the contrary, if the "bulls" manage to return them above the neckline ($1490-1500), their chances of restoring the upward trend will increase significantly. The material has been provided by InstaForex Company - www.instaforex.com |
| EUR/USD: dizzying somersaults of the dollar and cautious hopes for the euro's growth Posted: 02 Oct 2019 03:48 PM PDT After reaching 2.5-year peaks, the USD index turned sharply to decline amid the release of disappointing data on manufacturing activity in the United States. The ISM's PMI in the US manufacturing sector fell to 47.8 in September from 49.1 in August. The rate has reached its lowest level in more than a decade. After the publication of a weak report on business activity in the US manufacturing sector, the head of the White House, Donald Trump, had another reason to criticize the Federal Reserve, and the latter to lower the interest rate. The US president has already taken advantage of it. He said Fed Chairman Jerome Powell and his colleagues allowed the greenback to strengthen so much that it negatively affected US manufacturers. Only time will tell whether the Federal Reserve will resort to weakening monetary policy. Following the release of the ISM manufacturing index, the chances of the Fed cutting interest rates in October rose from 40% to 65%. It seems that investors are confident that the cycle of monetary expansion in the United States will continue. At first glance, there is no reason to panic, since the US manufacturing sector accounts for only 11% of the country's GDP and 8.5% of employment, but transport services, warehouses and retail trade depend on production. Given these relationships, the Wall Street Journal estimates the contribution of manufacturing to US GDP at 30%. Obviously, the US economy is slowing down because of the trade wars, forcing analysts to think about how slowly it can grow without sliding into a recession. Growth of less than 2% earlier almost guaranteed a reduction in the future. Now, some economists believe that this indicator may fluctuate around 1% -1.5%, not necessarily portending a recession. According to the head of the Federal Reserve Bank of Chicago Charles Evans, a 50% reduction in the federal funds rate will ensure a 2.25% GDP growth this year, 2% inflation over the next few years and unemployment slightly below 4%. Bloomberg analysts expect the US economy to expand 2.3% this year. However, weak data on business activity in the United States cast doubt on these figures. If the global index of purchasing managers has been below the critical level of 50 for the fifth month in a row, then the American counterpart is only the second. While many countries have already adapted to trade wars, the United States is only beginning to sense their negative effects. This may be a bullish factor for EUR/USD. Thus, if the Federal Reserve used to cut the interest rate due to international risks, which were evidenced by investors' flight into safe haven assets and a decrease in the yield of treasuries, now the regulator has an internal argument for easing monetary policy. Given the split in the ranks of the ECB Governing Council and the limitations of its "arsenal", the rebound of the EUR/USD pair from support at 1.0875-1.0885 seems quite logical. The bulls will be able to continue the attack in the event of the release of weak statistics on the US labor market in September. According to forecasts, the US economy created 147 thousand new jobs in the first month of autumn, which is 17 thousand more than in August. However, the publication of the ISM manufacturing index reinforced concerns that actual numbers would not reach forecast estimates. Another factor in support of the euro may be reaching an agreement between the UK and the EU on the terms of Brexit, but this still remains a big question. The material has been provided by InstaForex Company - www.instaforex.com |
| A predicted fall for the kiwi, but it maintains defense Posted: 02 Oct 2019 03:48 PM PDT The New Zealand dollar is held captive by conflicting trends. On the one hand, it is seen to fall due to the general easing of monetary policy by world central banks, and on the other, it is trying to maintain his gains. The NZD/USD pair could not develop an upward correction above the local resistance level of 0.6443 at the beginning of September. As a result, the pair resumed to fall, analysts said. The NZD/USD pair was trading near the 0.6225 mark, below the short-term resistance level of 0.6293, on Tuesday, October 1. An alternative scenario could be a breakdown of the local resistance level of 0.6365 and corrective growth with targets at positions 0.6443 and 0.6490, analysts said. They also do not exclude a retest of 0.6260. According to analysts, further growth of the NZD/USD pair is unlikely if the Federal Reserve does not aggressively reduce interest rates. At the same time, the New Zealand regulator is inclined to cut rates, analysts said. They allow such an opportunity since the leadership of the Reserve Bank of New Zealand (RBNZ) is set to further soften its monetary policy. Recall that in August of this year, the RBNZ reduced the interest rate immediately by 50 basis points (bp) to 1.00%. The regulator explained his decision by the aggravation of trade confrontation between the US and China, as well as the loss of momentum in the New Zealand economy. In this situation, the NZD/USD pair may again test record lows of 2015 near the psychologically important mark of 0.6200. The kiwi's further fall depends on the strengthening of the US dollar index over the levels of 99.40–99.60, analysts said. A breakthrough of a local high in the index chart along with a breakdown of the record low in the NZD/USD chart can provoke a radical reversal of the current trend. With further abnormal growth of the US dollar above 99.40 and in case of a breakthrough of the bar of 99.60, analysts do not exclude a powerful collapse in the quotes of the NZD/USD pair. With the implementation of such a scenario, it is possible for the pair to collapse up to the levels of 0.6140-0.6120, analysts said. The New Zealand currency remains vulnerable due to the high risk of a slowdown in the global economy and a protracted trade conflict between the United States and China, which remain the country's largest trading partners. The kiwi is currently trading in the range of 0.6233–0.6236, trying to stay at current levels. The material has been provided by InstaForex Company - www.instaforex.com |
| The border between Britain and Ireland "injures" the pound Posted: 02 Oct 2019 03:48 PM PDT It has not been easy for the Btirish currency lately. Britain's exit from the European Union is approaching, and the question of its "rigidity" or "softness" remains open. High probability of Brexit without a deal does not allow the pound to rise, analysts are certain. The sterling fell to new lows against the US dollar on Tuesday, October 2. The GBP/USD pair is currently trading in the range of 1.2269–1.2277. Yesterday, the pair hit 0.5%, to 1.2225, the lowest since the beginning of September 2019. The collapse of the sterling was largely due to reports of stringent rules regarding the border with Northern Ireland. Some time later, Brexit Minister James Duddridge noted that the news about the placement of customs posts 5-10 miles from the Irish border was misinterpreted by the opposition. Earlier, British Prime Minister Boris Johnson said that a number of customs checks on the island of Ireland would be required after the country's exit from the euro bloc. The politician is convinced of the need for such checks and does not believe that such measures will lead to the so-called "tight border". This situation injures the pound. The internal border of the United Kingdom, ironically, is becoming a kind of rift that runs through the British currency. GBP/USD moved to its first close below the 55-day moving average (DMA) - near the level of 1.2278. According to analysts, another reason for the pound's recent fall below 1.2280 was because leading market players made large purchases of GBP/USD. Analysts consider the high probability of the release of weak data on business activity in the UK industry as another negative factor for sterling. The reason for the possible deterioration of statistics was a noticeable reduction in factory orders in the country. Analysts are confident that this situation will force investors to again build up short positions in the British currency. The material has been provided by InstaForex Company - www.instaforex.com |
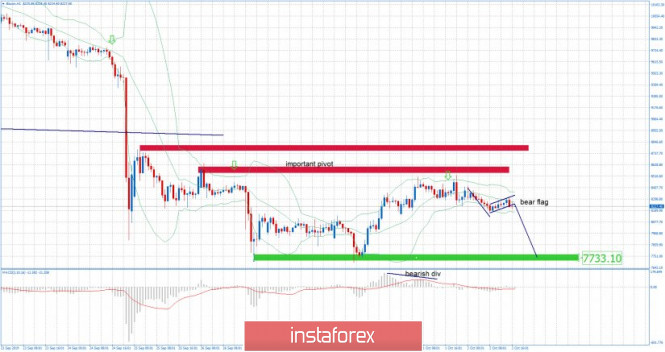
| BTC 10.02.2019 - Sellers in control, watch for selling opportunities Posted: 02 Oct 2019 07:14 AM PDT BTC is trading lower exactly what I expected yesterday.My analysis from yesterday is still active and I still expect more downside in the future and potential test of $7,730.
Red rectangle – Important resistance levels Green rectangle – Important support and objective Purple falling line – Expected path I found broken bearish flag in the background based on the 1H time-frame and I do expect more downside yet to come. My advice is to watch for selling opportunities due to rejection of the important resistance level at $8,500 and the broken bearish flag most recently. The downward target is set at the price of $7,730. The material has been provided by InstaForex Company - www.instaforex.com |
| October 2, 2019 : EUR/USD Intraday technical outlook and trade recommendations. Posted: 02 Oct 2019 06:59 AM PDT
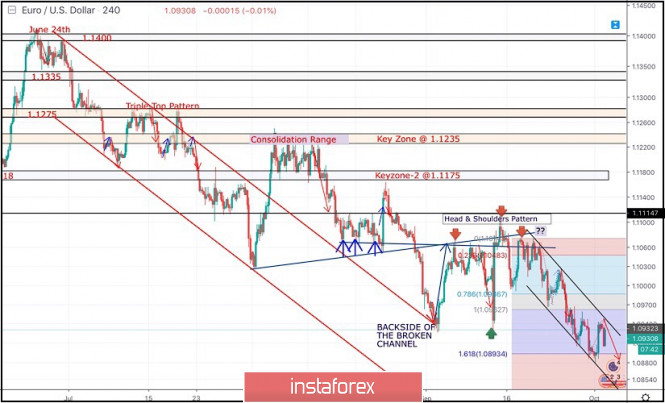
On September 13, the EUR/USD pair was testing the backside of both broken trends around 1.1060-1.1080 where significant bearish pressure was demonstrated. Shortly-After, Few DESCENDING-Tops were established around 1.1075 and 1.1060. This rendered the recent bullish spike as a bullish trap. Since then, the EURUSD has been trending-down within the depicted short-term bearish channel. On September 23, a recent bullish pullback towards the price level of 1.1020 was obviously rejected by the end of last Tuesday's consolidations. Bearish persistence below 1.0965 (recent daily bottom) enhanced more bearish decline towards 1.0930 and 1.0890 (Fibonacci Expansion 161.8%) where recent signs of bullish recovery is being demonstrated (Inverted Head & Shoulders Pattern). Moreover, the EUR/USD is demonstrating a long-term Head & Shoulders continuation pattern extending between (1.0930 - 1.1080) with neckline located around 1.0940. As long as bearish persistence below 1.0940 (Neckline) is maintained, Pattern projection target would remain projected towards 1.0840. On the other hand, any bullish breakout above 1.0960 confirms the mentioned Inverted Head & Shoulders Pattern which opens the way for further bullish advancement towards 1.1030 (Pattern projection Target). Trade recommendations : Risky traders should wait for a bullish breakout above 1.0960 as a valid BUY signal. Initial Target levels should be located at 1.1000 and 1.1030. The material has been provided by InstaForex Company - www.instaforex.com |
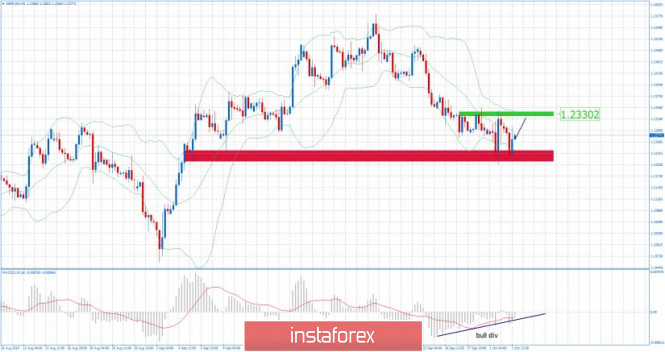
| GBP/USD 10.02.2019 - Bullish divergence on the 4H time-frame Posted: 02 Oct 2019 06:59 AM PDT GBP price has been trading sideways at the price of 1.2275. Anyway, I still potential upside due to the bullish divergence in the background on the MACD and rejection of the support.
Red rectangle – Important support Green rectangle – Important resistance Purple rising line – Expected path MACD oscillator is showing bullish divergence and I do expect at least another push higher. Additionally, there is the successful rejection of the support at 1.2225 (red rectangle), which is another sign of the strength. Watch for buying opportunities on the dips using 5/15 minutes time-frame for better entries. The upward target is set at the price of 1.2330 (cluster of highs). The material has been provided by InstaForex Company - www.instaforex.com |
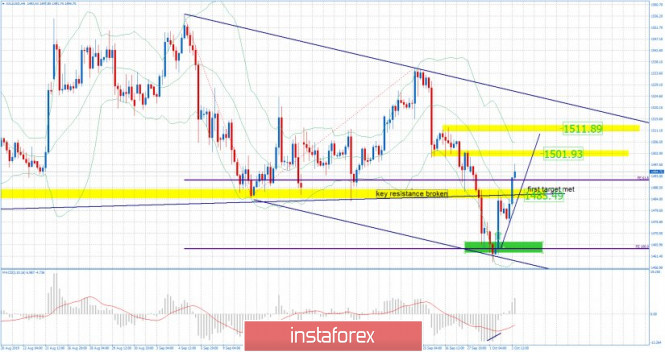
| Gold 10.02.2019 - First upward target has been met, more upside yet to come Posted: 02 Oct 2019 06:35 AM PDT Gold price had a nice push higher and our first upward target from yesterday was met at the price of $1485. Anyway, I still expect more upside and at least another upward swing. Next upward levels are set at $1,500 and $1,511.
Yellow rectangles – Important resistance levels and upward objectives Green rectangle - major support area Purple rising line – Expected path MACD oscillator is showing good new momentum up in the background and I do expect at least another push higher. Watch for buying opportunities on the dips using 5/15 minutes time-frame for better entries. There is also a failed HSS pattern in creation, which may lead Gold to higher levels. The material has been provided by InstaForex Company - www.instaforex.com |
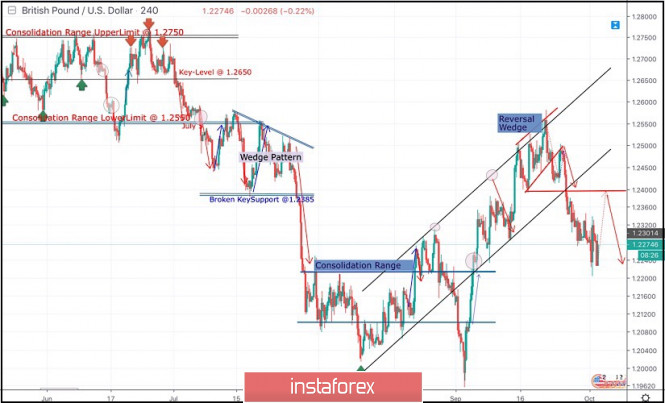
| October 2, 2019 : GBP/USD Intraday technical outlook and trade recommendations. Posted: 02 Oct 2019 06:09 AM PDT
Since August 9, the GBP/USD pair has been trending-up within the depicted bullish channel except on September 3 when a temporary bearish breakout was demonstrated towards 1.1960. Around the price level of 1.1960, aggressive signs of bullish recovery (Bullish Engulfing candlesticks) brought the GBPUSD back above 1.2230 where the pair looked overbought. However, further bullish momentum was demonstrated towards 1.2320 maintaining the bullish movement inside the depicted movement channel. Moreover, Temporary bullish advancement was demonstrated towards 1.2550 where a reversal wedge pattern was established. As anticipated, the reversal wedge pattern was confirmed Last week on Monday's consolidations supported by obvious bearish price action demonstrating a successful bearish closure below 1.2450. On September 24, the backside of the confirmed reversal wedge was successfully re-tested around 1.2500 where a new episode of bearish rejection was expressed. The Long-term outlook remains bearish as long as the most recent top established around 1.2500 remains defended by the GBP/USD bears. Bearish persistence below 1.2400-1.2440 (Reversal-Pattern Neckline) allowed more bearish decline to occur towards the price levels of 1.2210 where early signs of bullish rejection has been demonstrated since Yesterday. Trade Recommendations: Conservative traders should wait for a bullish pullback towards the backside of the broken channel (Anywhere around 1.2400-1.2450) for another valid SELL entry. T/P level to be placed around 1.2360, 1.2330 and 1.2280 while S/L should be set as a H4 candlestick closure above 1.2450. The material has been provided by InstaForex Company - www.instaforex.com |
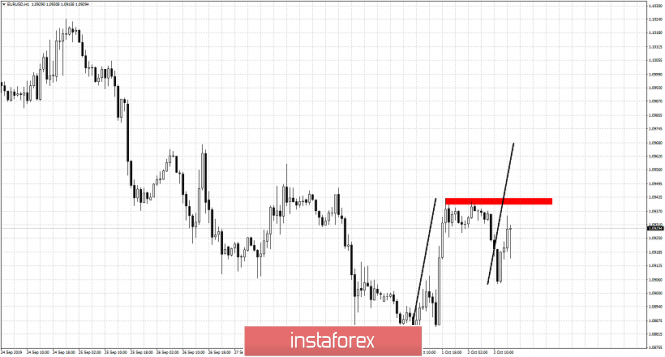
| Short-term EURUSD analysis for October 2nd, 2019 Posted: 02 Oct 2019 06:00 AM PDT EURUSD is trading above 1.09 and is making higher highs and higher lows in intraday time frame. If price breaks above 1.0940 I expect to see EURUSD reach at least 1.0970 if not higher. As long as price is above 1.0905 bulls expect to see more upside.
EURUSD is showing short-term reversal signs. Price has the potential to move towards 1.0970 and higher as long as price holds above 1.09 and if we break above 1.0940. At 1.0970 we also find the 38% Fibonacci retracement of the entire leg down from 1.1110 to 1.0880. So this level is pretty important resistance. If this resistance is broken, we could see a bounce higher towards 1.1020. The material has been provided by InstaForex Company - www.instaforex.com |
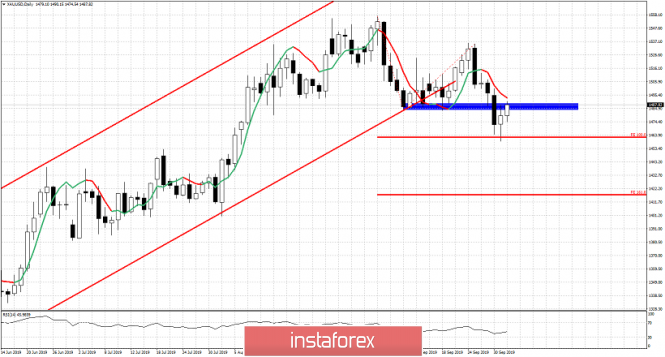
| Gold price back tests broken support now resistance Posted: 02 Oct 2019 05:56 AM PDT Gold price is bouncing after making a low yesterday at $1,459. Price has reached our first target area and is now bouncing towards the key resistance that was once support. Recapturing $1,500 is key for the short-term trend.
Red lines - bullish channel Blue rectangle - resistance Gold price is trying to move above the resistance area around $1,500 which was once support. Gold price is bouncing after the 100% extension target was hit. This could very well be a selling opportunity bounce for Gold. Trend remains bearish as long as price is below $1,535. If price breaks above $1,535 would should expect $1,600 to be reached. However I believe it is more probable to see another lower high and then a downward reversal. Support is now at $1,474 and if we see this level broken then I would expect price to move towards the 161.8% Fibonacci extension lower. The material has been provided by InstaForex Company - www.instaforex.com |
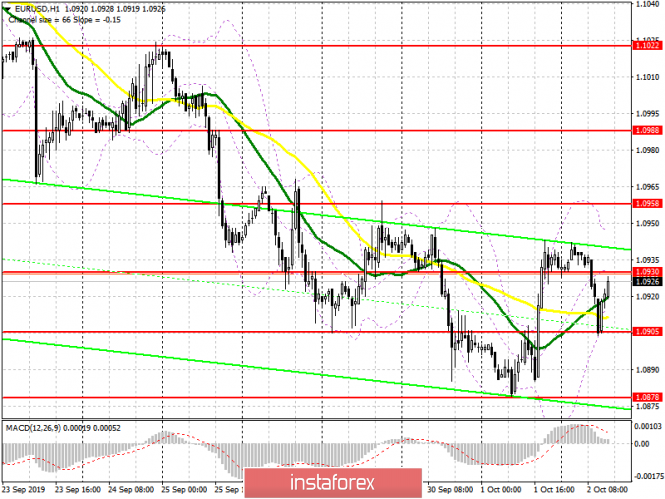
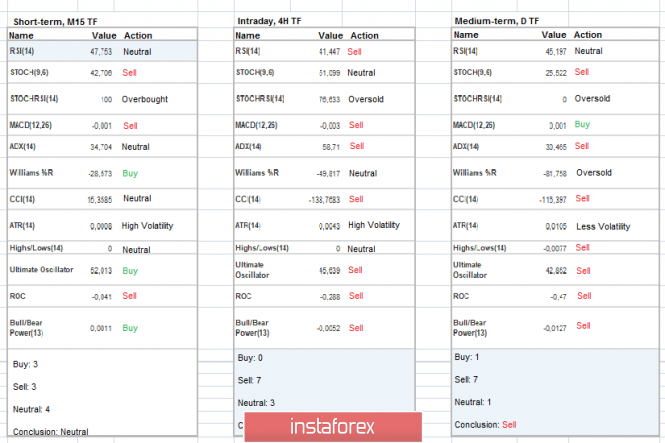
| Trading recommendations for the EURUSD currency pair – placement of trade orders (October 2) Posted: 02 Oct 2019 04:38 AM PDT Over the last trading day, the EUR/USD currency pair showed high volatility of 63 points, as a result of which an interesting impulse move took place, which we will analyze in the current article. From technical analysis, we see that the price fixation below the control point of 1.0900 was false, since already within the value of 1.0880 there was a stop with the subsequent return of the quote to the previously passed support point. So, if we analyze the past fluctuation in detail, we will see that the main surge occurred in the period from 17:00-19:00 (time on the trading terminal) and, most likely, was tied to the information and news background, but more on that later. Thus, if we refer to a local burst, we see that the picture of cycles, in general, has not changed. As discussed in the previous review, traders were mostly focused on short positions, where entry into the market was made at the time of fixing the price below the mark of 1.0900. The primary perspective, in this case, was located in the area of 1.0850 but was not achieved. Looking at the trading chart in general terms (daily period), we see that the momentum tact in the global downward trend continues to hold in the market. In this case, a significant role of further development will be played by the behavior of the price relative to the current coordinates, since the pivot point of 1.0900/1.0950 has not yet been sufficiently played by the quote in terms of decline, and there is still some caution of the reverse return. The news background of the past day had a significant package of statistics. So, the statistics started in Europe, where inflation data was published, which showed a slowdown from 1.0% to 0.9% with the forecast for holding the inflation rate at 1.0%. To a large extent, the results that we saw were expected. Yesterday, we referred to the preliminary data on inflation in Germany, which showed a decrease, and, as a fact, they affected the indicators for the EU. In turn, the single currency did not respond to the slowdown in inflation, probably because of the previously laid expectations. In the afternoon of Tuesday, data on the manufacturing activity index in the manufacturing sector (PMI) of the United States were released, where they expected growth to 50.1, but the PMI data from ISM showed the opposite picture in the form of a decrease from 49.1 to 47.8, actually rendering local pressure on the American dollar. In terms of the information background, we had quite a lot of different bursts, which certainly affected the behavior of the quotes. So, one of the first to stand out was the head of the ECB, Mario Draghi, were at his last speech in this position, he explicitly announced a possible further reduction in the interest rate. After that, US President Donald Trump woke up, who, without violating the old tradition, decided to criticize the Federal Reserve. "As I expected, (the head of the Federal Reserve) Jerome Powell and the Federal Reserve have allowed the dollar to become so strong against all other currencies that our producers are experiencing (this) negative impact. The stakes are too high! They are the worst enemies of themselves, although they have no idea about it. What a pity!", – twitter @realDonaldTrump But this does not end the information background since the long-playing Brexit almost daily feeds us with new information. So, information appeared that on October 2, British Prime Minister Boris Johnson will unveil his proposal for the Brexit of the European Union, and it will carry an ultimatum character: "Accept" or "Leave". Chancellor Angela Merkel, who, during a meeting with the heads of international financial and economic organizations, stated that the world economy is in a difficult situation and a culprit is several factors in the form of a trade war between the US & China; Brexit. "We had a discussion during which we unanimously concluded that the world economy is in a difficult situation. Everywhere, according to the assessment of all organizations, there is a slowdown. We, in Germany, see this through our forecasts. This applies to all important world players," the German Chancellor said. Today, in terms of the economic calendar, the focus is on the ADP report on the level of employment in the private sector of the United States. According to preliminary forecasts, they expect a decrease in employment by 140 thousand, which can put pressure on the US currency in case the forecast coincides. Let me remind you that the report of the United States Department of Labor will be published on Friday (October 4). Further development Analyzing the current trading chart, we see that a slight stagnation (1.0925/1.0940) during the Pacific and Asian trading sessions led to a regrouping of trading forces and, as a fact, a breakdown of the lower border. We see a belated reaction to the information background, expressed in a local surge. In turn, traders continue to hold short positions, almost being at zero. At the same time, placing a restrictive stop-loss order in case there is another return of the quote above the point of the previously passed support. It is likely to assume that the range level (1.0900/1.0950), which has already been repeatedly discussed, will not let us go so quickly, and tightening into its framework is still possible. Thus, we monitor the behavior of quotes and fixing points and do not forget about the restrictive stop loss. The main trend is set to decrease, but local changes are possible. Based on the above information, we will derive trading recommendations:
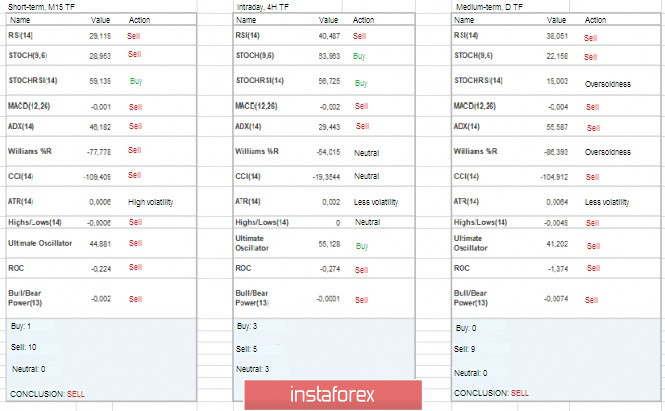
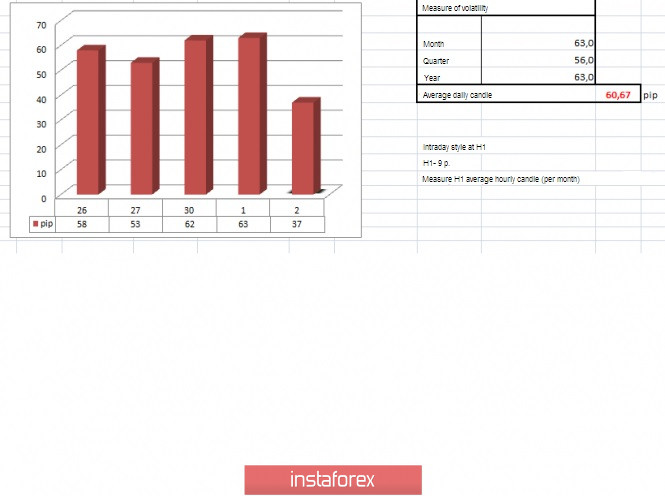
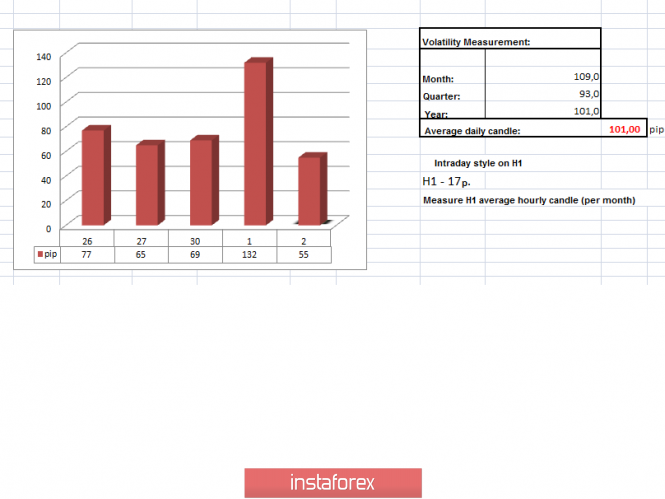
Indicator analysis Analyzing different sectors of timeframes (TF), we see that the indicators on all analyzed time intervals signal a further downward trend, which reflects in some sense the general background of the market. It is worth taking into account such a moment, in the case of hovering within (1.0900/1.0950), the indicators for the short-term and intraday periods can be volatile. Volatility per week / Measurement of volatility: Month; Quarter; Year. Measurement of volatility reflects the average daily fluctuation, calculated for the Month / Quarter / Year. (October 2 was built taking into account the time of publication of the article) The volatility of the current time is 37 points, which is the average for this period. It is likely to assume that if the fluctuations remain within the existing framework, volatility will be limited, but at the time of the release of the ADP report, there may be local spikes. Key level Resistance zones: 1.0900/1.0950**; 1.1000***; 1.1100**; 1.1180*; 1.1300**; 1.1450; 1.1550; 1.1650*; 1.1720**; 1.1850**; 1.2100 Support zones: 1.0850**; 1.0500***; 1.0350**; 1.0000***. * Periodic level ** Range level *** Psychological level **** The article is based on the principle of conducting transactions, with daily adjustments. The material has been provided by InstaForex Company - www.instaforex.com |
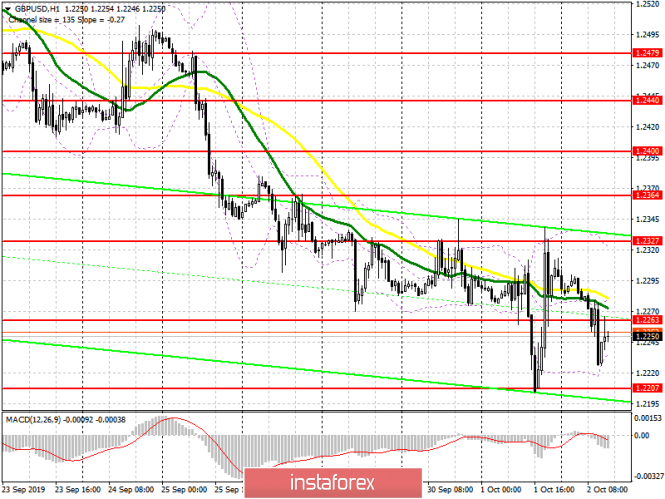
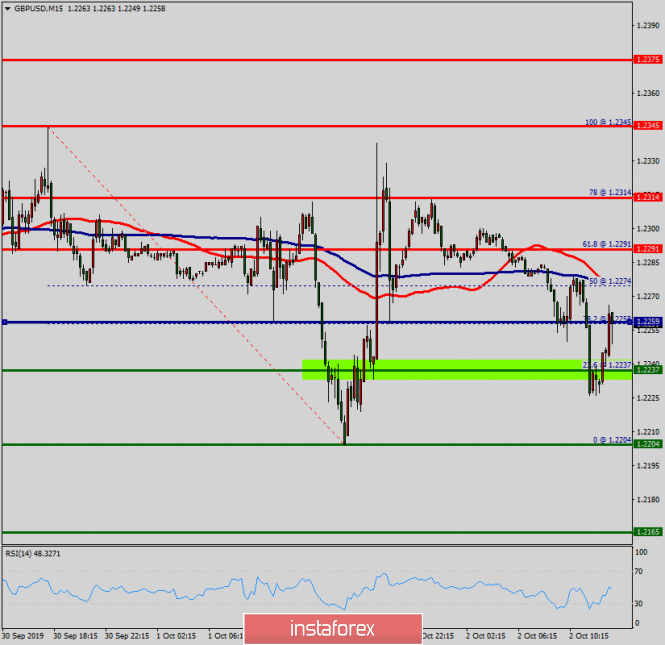
| Posted: 02 Oct 2019 04:38 AM PDT To open long positions on GBP/USD, you need: The pound fell on data on the construction sector, wherein September this year there was an even greater reduction in the activity. However, the bulls took advantage of this moment and tried to return to the market. For a larger upward correction, buyers of the pound need a breakout and consolidation above the resistance of 1.2263, which will lead to an update of the highs in the area of 1.2327, where I recommend taking the profit. If the US labor market data is better than economists' forecasts, the pressure on the pair may return. In this scenario, it is best to open new long positions from the week's low at 1.2207, subject to the formation of a false breakdown there or buy the pound to rebound from the level of 1.2165. To open short positions on GBP/USD, you need: Bears need to keep the pair below the resistance of 1.2263, and good data from ADP will serve as an additional signal to open short positions to update and break the low of this week at 1.2207. Only such a scenario will push GBP/USD to the area of new support levels of 1.2165 and 1.2112, where I recommend taking the profit. If the US labor market data leads to a breakout of the resistance at 1.2263, then it is best to return to short positions in the pair after updating the maximum at 1.2327 or rebounding from the larger level at 1.2364. Indicator signals: Moving Averages Trading is conducted below 30 and 50 daily averages, which indicates a further decline in the market. Bollinger Bands In the scenario of growth of the pound, you can count on sales immediately on the rebound after the test of the upper limit of the indicator in the area of 1.2327.
Description of indicators
|
| Posted: 02 Oct 2019 04:38 AM PDT To open long positions on EURUSD, you need: The absence of important fundamental statistics allowed the sellers of the euro to break below the level of 1.0930, however, the bulls returned to the market from the support of 1.0905, from which I recommended buying in the morning review. At the moment, the more important task will be to break through and consolidate above the resistance of 1.0930, which will only strengthen the demand for the euro and lead to an update of this week's maximum in the area of 1.0958, where I recommend taking the profit. However, under the scenario of the release of good statistics on the American labor market, the release of which is scheduled for the afternoon, a second wave of EUR/USD decline is possible. In this case, it is best to consider new purchases on a rebound from a minimum of 1.0878. To open short positions on EURUSD, you need: The bears coped with the morning task and broke below the support level of 1.0930, updating the minimum of 1.0905, where the profit was fixed. At the moment, short positions in EUR/USD are best calculated after the release of a weak report from ADP, as well as under the condition of forming a false breakdown in the resistance area of 1.0930. The main task of sellers will be to return and consolidate below the support of 1.0905, which will increase the pressure on the euro and lead the pair to the lows of the week in the area of 1.0878, where I recommend taking the profit. In the case of EUR/USD growth above the resistance of 1.0930, short positions can be considered immediately on the rebound from the resistance of 1.0958. Indicator signals: Moving Averages Trading is just above 30 and 50 moving averages, indicating an attempt to return to the market of euro buyers. Bollinger Bands With further growth of EUR/USD, the upward trend will be limited to the upper limit of the indicator 1.0950.
Description of indicators
|
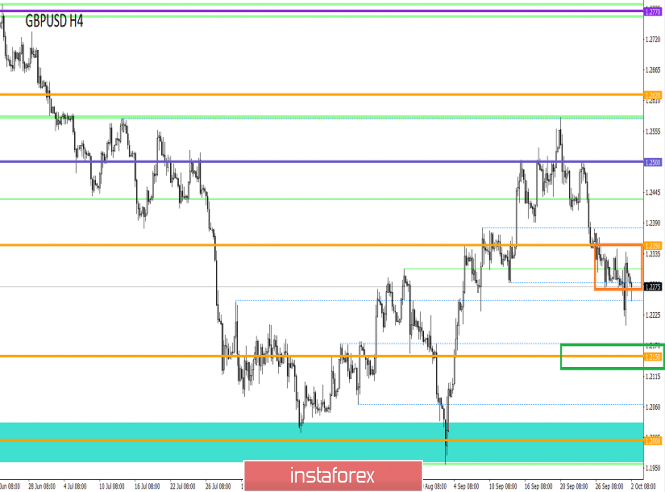
| Technical analysis of GBP/USD for October 02, 2019 Posted: 02 Oct 2019 04:08 AM PDT The GBP/USD pair continues moving in a bullish trend from the support level of 1.2204. Currently, the price is in a bullish channel. In the short term, further close above the high end may cause a rally towards 1.2291. Nonetheless, the weekly resistance level and zone should be considered. The resistance is seen at the levels of 1.2291 and 1.1345. Volatility is very high for that the GBP/USD pair is still expected to be moving between 1.2204 and 1.1345 in coming hours. We expect the GBP/USD pair to continue to trade in a bullish trend from the new support level of 1.2204 to form a bullish channel. Also, it should be noted that major resistance is seen at 1.1345, while immediate resistance is found at 1.2291. According to the previous events, the pair is likely to move from 1.2204 towards 1.2291 and 1.1345 as targets. The trend is still above the 100 EMA for that the bullish outlook remains the same as long as the 100 EMA is headed to the upside. On the contrary, if a breakout takes place at the resistance level of 1.2204, then this scenario may become invalidated. The material has been provided by InstaForex Company - www.instaforex.com |
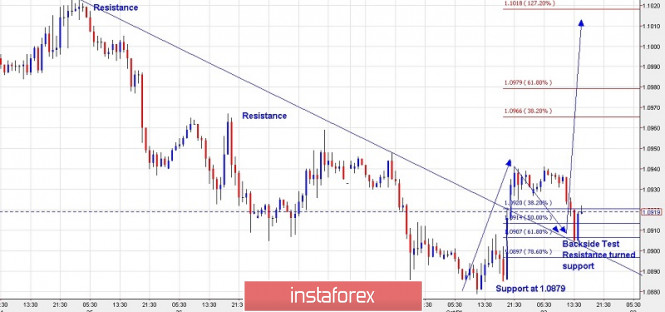
| Trading plan for EUR/USD for October 02, 2019 Posted: 02 Oct 2019 03:40 AM PDT
Technical outlook: The EURUSD pair bounced off yesterday after printing a low at 1.0879, just below 1.0880 levels as expected. The single currency pair is trading around 1.0917 levels at this point in writing, after having tested the backside of its resistance trend line at 1.0903 which turned into support. A major low might have just formed at 1.0879. The prices are expected to print higher highs going forward. If the above structure holds, the EUR/USD pair should be taking out resistance at 1.0960 and 1.1025 levels going forward. Only a drop below 1.0879 should be the reason to worry about the ongoing bullish momentum. Besides, note that prices bounced off right from the fibonacci 0.618 support of the recent boundary as highlighted here. Trading plan: Remain long stop below 1.0879, a target is open. Good luck! The material has been provided by InstaForex Company - www.instaforex.com |
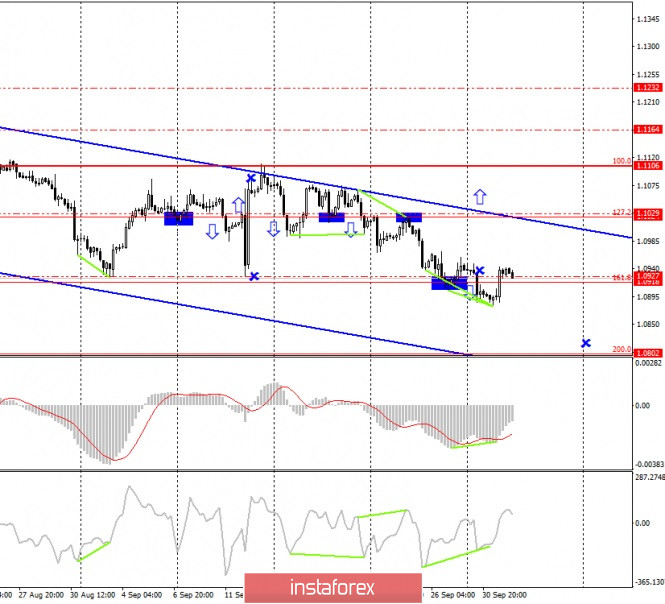
| Posted: 02 Oct 2019 02:09 AM PDT EUR/USD – 4H. As seen on the 4-hour chart, the EUR/USD pair performed a reversal in favor of the European currency after the formation of two bullish divergences at the CCI and MACD indicators. Subsequently, the pair's quotes performed growth above the Fibo level of 161.8% (1.0918). Nevertheless, the downward trend channel is adamant and continues to indicate the "bearish" mood of most traders. Thus, the consolidation of the euro/dollar exchange rate under the correction level of 161.8% will again work in favor of the US currency and the resumption of the fall in the direction of the correction level of 200.0% (1.0802). Yesterday, I wrote that almost all the indices of business activity in the industrial sectors of European countries showed a negative trend. Only two indicators rose compared to August, but even they were below the key level of 50.0. Thus, the euro continued to remain under pressure until the second half of the day, when the indices of business activity in the US manufacturing sector were released. And it turned out that in America, not everything is smooth. In recent months, both indices, which determine the level of business activity, have shown a decline, but traders still hoped that they still would not go below 50.0. Yesterday's reports showed that the ISM index sank significantly to 47.8, instead of returning above 50.0. Thus, in the afternoon, traders bought the euro and got rid of the dollar. Against the background of declining business activity in the US, it is even somehow uninteresting to talk about another slowdown in inflation in the European Union, although this value is not final for September. In America, the topic of impeachment of Donald Trump has faded into the background, but the US President does not like to be in the shadows for a long time. Once again, Trump "rode" around the Fed and personally to Jerome Powell, criticizing the organization and its chairman for a too-high key rate. As always, via Twitter: "As I expected, Jerome Powell and the Federal Reserve have allowed the dollar to become very strong against all other currencies, and our producers are experiencing a negative impact. The stakes are too high! They are the worst enemies of themselves, although they have no idea about it. What a pity!" – Trump wrote. It seems that Donald Trump will not leave the Fed alone until the regulator lowers the rate to 0%, as the US President wants. However, Trump does not specify that a strong dollar prevents him, first of all, from waging a trade war with China. Also, the more expensive the US dollar, the more expensive any goods produced in the US on world markets. And one of Trump's goals is to return all the production capacity of American companies to the territory of America. And, of course, the huge US public debt that needs to be serviced, which is easier to do with the cheap national currency. What to expect today from the euro/dollar currency pair? On October 2, traders will wait for developments near the correction level of 161.8% (1.0918). If there is a close below this level, the fall of quotations with a high probability will resume, as well as the entire downward trend. But until this happens, there are small chances for some growth of the pair in the direction of the upper line of the trend channel. The Fibo grid is based on the extremes of May 23, 2019, and June 25, 2019. Forecast for EUR/USD and trading recommendations: I recommend selling the pair again today with the target of 1.0802 if a new close is made below the level of 1.0918. A stop-loss order above the level of 1.0927. It will be possible to buy the pair after the close above the downward trend channel, before – I do not recommend it. The material has been provided by InstaForex Company - www.instaforex.com |
| Trading strategy for GBP/USD on October 2nd. The number of factors in the fall of the pound – huge Posted: 02 Oct 2019 02:09 AM PDT GBP/USD – 4H.
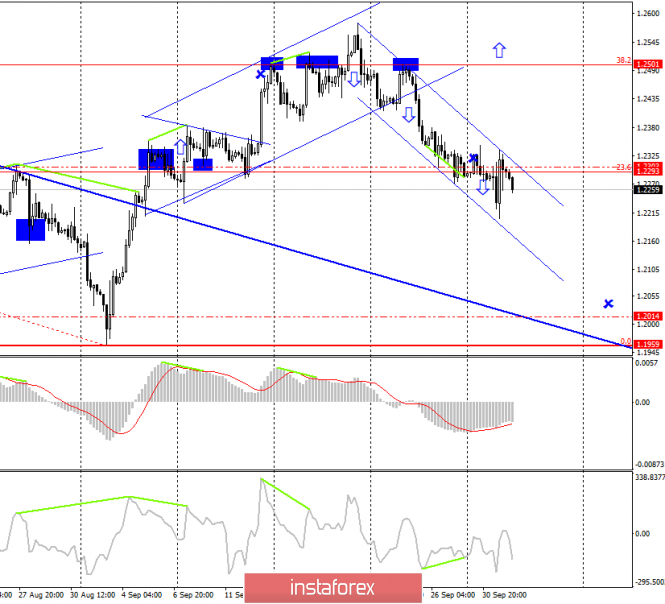
As seen on the 4-hour chart, the GBP/USD pair performed a rollback from the low, the growth to the corrective level of 23.6% (1.2293), but at the moment, it is ready to resume the fall. A new downward channel has been built, within which the movement of the pound/dollar pair continues. As before, I expect the pair to drop, as the information background remains negative for the pound. The events taking place in the UK are becoming more and more like a farce. For a long time, British Prime Minister Boris Johnson, with all his actions, showed that the agreement on Brexit is not the most important step for him. Either the Prime Minister understood that it was impossible to reach an agreement or simply did not want any agreement. However, in recent days, information has unexpectedly arrived that conservatives are still developing a mechanism that will be called upon to replace the so-called Backstop. I already wrote about its essence in yesterday's article. There is nothing to add to this. On paper, everything looks beautiful, but what are the chances that he will suit the European Union? What are the chances that it will be approved by the UK Parliament? So it turns out that the European Union, Parliament, and Boris Johnson are in different parts of the world and are not moving towards each other to find a solution that will suit everyone and finally allow the Kingdom to leave the European Union. Parliament needs a soft exit from the EU, with an agreement. Boris Johnson – any exit. The European Union – a soft way out, but with completely different conditions, not those offered by London. If the media had not heated the weekly thesis that the parties are continuing negotiations, that there are certain chances for an agreement, this situation would be called a "dead end". However, the internal wars between Parliament and the British Government are also unclear what will end. In general, we get a picture with a mass of different options for the development of events and with a huge uncertainty of the future for both the country and its currency. Under such conditions, it is still extremely difficult to count on the growth of the pound. And then there is a possible reduction in the key rate by the Bank of England, which again is quite logical against the backdrop of worsening economic reports. Yesterday, for example, the index of business activity in the UK manufacturing sector was frankly bad, although it exceeded slightly the expectations of traders. Today, an index of business activity in the construction sector will be released, but nothing favorable is expected from it either. What to expect from the pound/dollar currency pair today? The pound/dollar pair performed a reverse consolidation under the correction level of 23.6% (1.2293), but it is uncertain again. Thus, it is not a fact that the fall will continue, although the information background speaks in favor of such an option as a new trend channel. One thing is clear – buying the pound is now even riskier than selling. A report on the number of new jobs in the US will also be released this afternoon, which may also affect the movement of the pound/dollar pair on October 2. The Fibo grid is based on the extremes of March 13, 2019, and September 3, 2019. Forecast for GBP/USD and trading recommendations: I do not recommend buying the pair shortly, as the pair can now perform a maximum rollback to the top. I recommend considering the pair's new sales with the target of 1.2014, as the closing was made at the level of 23.6%, with the stop-loss order above the level of 1.2308, but the closing is still uncertain. The material has been provided by InstaForex Company - www.instaforex.com |
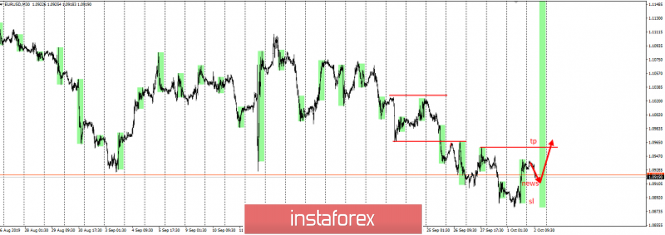
| Posted: 02 Oct 2019 01:44 AM PDT Recently, the EUR/USD has been under extreme pressure from both currencies. On the one hand, weak macroeconomic statistics of the eurozone did not allow the pair to stay above annual lows in the region of 1.09, and against the backdrop of a strengthening US dollar, the pair declined to 1.08700. However, there was an interesting USD event that pushed the pair out of the abyss yesterday. Let me remind you that yesterday at 14:00 Universal time, an important indicator came out - the index of business activity in the manufacturing sector, which was much lower than the forecast. The indicator fell to 10-year lows and stopped at 47.8 with a forecast of 50.5. This is a very big difference, which allowed news traders to enter the market and play huge volumes against the dollar. Thus, yesterday, the EUR/USD pair closed on a positive note. In this regard, I propose a trading idea related to the continued growth of the pair, which was actually in the third wave from yesterday's news. I recommend that you choose the time for trading either the first 2 hours from the opening of Europe, or at the American session with the first goal - update 1.09600. I remind you that news will be released this week. Be careful when holding positions on Friday - unemployment in the United States. The material has been provided by InstaForex Company - www.instaforex.com |
| Trading recommendations for the GBPUSD currency pair - placement of trade orders (October 2) Posted: 02 Oct 2019 01:14 AM PDT Over the past trading day, the pound / dollar currency pair showed a high volatility of 132 points but the movement was expressed as a V-shaped fluctuation. From the point of view of technical analysis, we see that there was still a breakdown of the accumulation of 1.2270 / 1.2350. However, the quotation failed to stay outside the lower border, and a rebound occurred within 1.2206, giving out as a result the same V-shaped oscillation. In fact, everything is not so bad. The V-shaped fluctuation in this situation did not carry something extremely bad, and the feet located outside the 1.2350 level were not touched, and during the Pacific and Asian trading sessions, partial recovery has occurred. As discussed in the previous review, traders were out of the market for several days, and the breakdown of 1.2270 level, nevertheless, forced them to enter the short positions that are still held by traders. In principle, the current position is not so bad. The past stagnation and consolidation of the quotation below the level of 1.2350 give the prerequisites for a further downward move. Now, let's see what happens. Considering the trading chart in general terms (the daily period), we see that the recovery process locally reached 60% relative to the elongated correction, but this is not enough to talk about the full return of sellers to the market. In fact, fixing the price below 1.2150 would give more confidence in terms of restoring the main movement, where we would just go into the framework of 70% recovery. The news background of the past day contained data on business activity in the manufacturing sector (PMI) of Great Britain, where an increase was recorded from 47.4 to 48.3, however, this did not affect the pound sterling. In the afternoon, a similar indicator came out, but for the United States, where the PMI data from ISM showed a decrease from 49.1 to 47.8 with a growth forecast of up to 50.1. In fact, the dollar was locally under pressure. The informational background displayed a riot of colors regarding Brexit. Thus, there was information that Prime Minister Boris Johnson on October 2 will unveil his "last" proposal for the European Union regarding Brexit. In fact, Johnson wants to deliver an ultimatum to the EU: negotiate Brexit on its terms over the next ten days or hold the so-called "Hard" exit. The prime minister's position to withdraw from the bloc on October 31, despite everything, remains as never before, and the goal of achieving a deal with the EU is on some secondary plan. In turn, the representative of the European Commission's press service, Mina Andreeva, said that Britain had not submitted proposals on the situation with the Irish border after Brexit, which would satisfy all the requirements of the European Union. "We did not receive any offers from Great Britain that would satisfy all the goals (backstop) that we reminded of and which achievements demanded. It is the United Kingdom that must present workable solutions that satisfy all the requirements of (backstop): preventing a tough border, maintaining cooperation between south and north (on the island where Ireland and Northern Ireland are located) and the economy on the whole island, protecting the EU's single market and place Ireland in it, "Mina Andreeva curled at a briefing However, already on Wednesday night, The Daily Telegraph, citing the British Prime Minister's plan, wrote that Boris Johnson plans to make an offer to the European Union. According to which, Northern Ireland will remain part of the EU single market until 2025 after Brexit. It is estimated that there will be a temporary border and customs checks between Northern Ireland and the Republic of Ireland in the Irish Sea. In fact, there are a lot of questions on the available information, thereby continuing to follow the news feed. Today, in terms of the economic calendar, we have an index of business activity in the construction sector in Britain, where the current level is 45.0. The main statistics burn us in the afternoon, where they will publish the ADP report on the level of employment in the private sector of the United States. According to preliminary forecasts, they expect a decrease in employment by 140 thousand, which may put pressure on the US currency if the forecast coincides. Further development Analyzing the current trading chart, we see that during the Pacific and Asian trading sessions, there was a recovery process relative to yesterday's fluctuation. In fact, the level of 1.2350 plays the role of resistance again, where the quotation works out. In turn, traders continue to work to lower, holding trading positions opened yesterday. The restrictive stop loss continues to be located above the level of 1.2350, in case the picture of the movement changes radically. It is likely to assume that the fluctuation within the 1.2270 value will still remain in the market for some time, where we will get a number of possible scenarios in the end. As you already guessed, the main scenario is focused on the resumption of the downward movement towards 1.2150. On the other hand, the opposite plot is considered in the initial hovering within 1.2270 / 1.2350, where depending on the incoming information will be clear how strong the resistance level is 1.2350 in terms of its breakdown. Based on the above information, we concretize trading recommendations: - We consider purchase positions in the case of a clear price fixing above the level of 1.2350, preferably with a yield of 1.2390. - Many traders already have positions for sale, and they are sent towards the subsequent level of 1.2150. If we do not have positions, then it makes sense to wait and enter after fixing the price lower than 1.2200, with a prospect of 1.2150. Indicator analysis Analyzing a different sector of timeframes (TF), we see that indicators on the main spectrum of periods signal a further decline. In turn, the short-term period took a neutral position in connection with local stagnation. Volatility per week / Measurement of volatility: Month; Quarter; Year Measurement of volatility reflects the average daily fluctuation, calculated for the Month / Quarter / Year. (October 2 was built taking into account the time of publication of the article) The current time volatility is 55 points, which is a normal indicator for this time section. It is likely to assume that if the information background is forced, the volatility of the day may again be higher than the daily average. Key levels Resistance zones: 1.2350 **; 1.2500 **; 1.2620; 1.2770 **; 1.2880 (1.2865-1.2880) **. Support areas: 1.2150 **; 1,2000 ***; 1.1700; 1.1475 **. * Periodic level ** Range Level *** The article is built on the principle of conducting a transaction, with daily adjustment The material has been provided by InstaForex Company - www.instaforex.com |


| You are subscribed to email updates from Forex analysis review. To stop receiving these emails, you may unsubscribe now. | Email delivery powered by Google |
| Google, 1600 Amphitheatre Parkway, Mountain View, CA 94043, United States | |
No comments:
Post a Comment