Forex analysis review |
- Fractal analysis of the main currency pairs on October 21
- Control zones EURUSD 10/21/19
- Control zones AUDUSD 10/21/19
- Weekly Bitcoin analysis
- USDCAD at critical support
- EURUSD remains firmly bullish in the short-term
- Weekly analysis of Gold
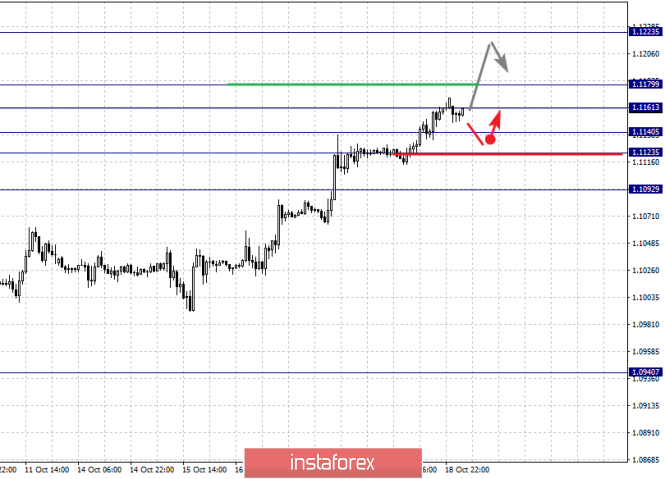
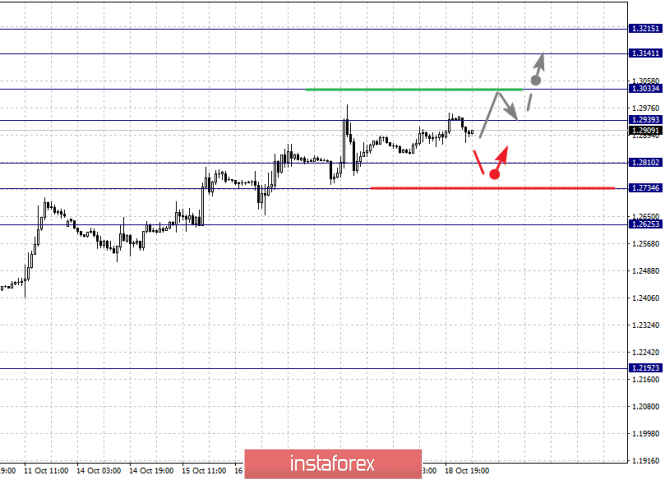
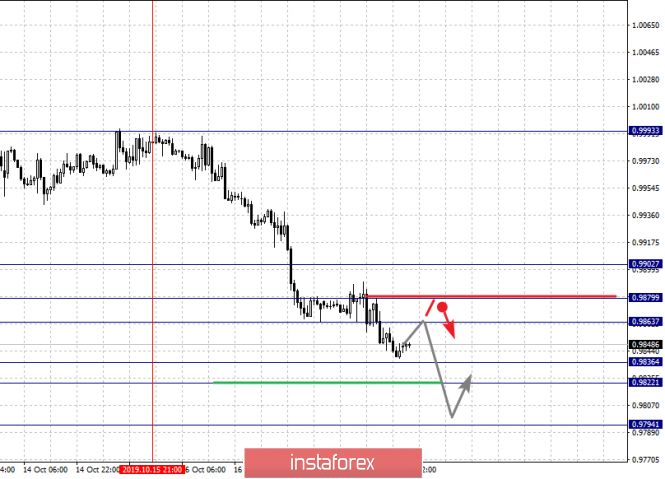
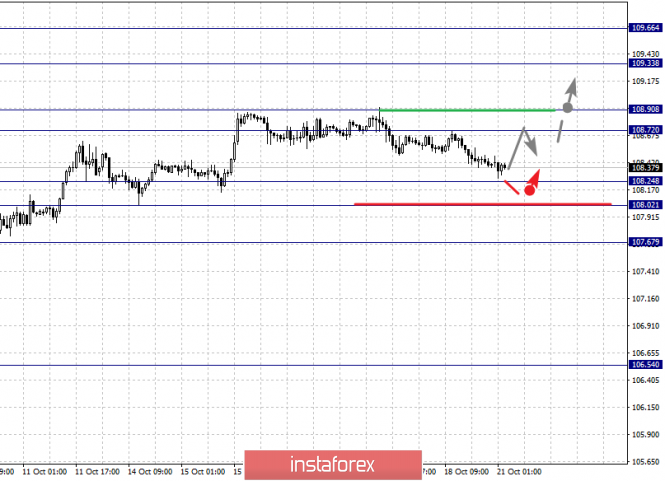
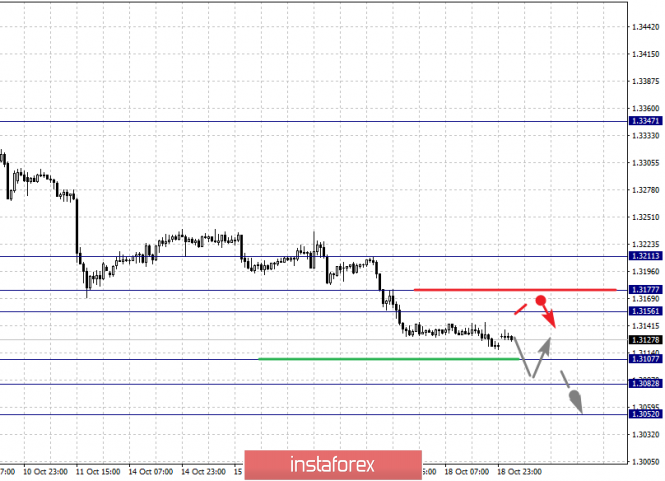
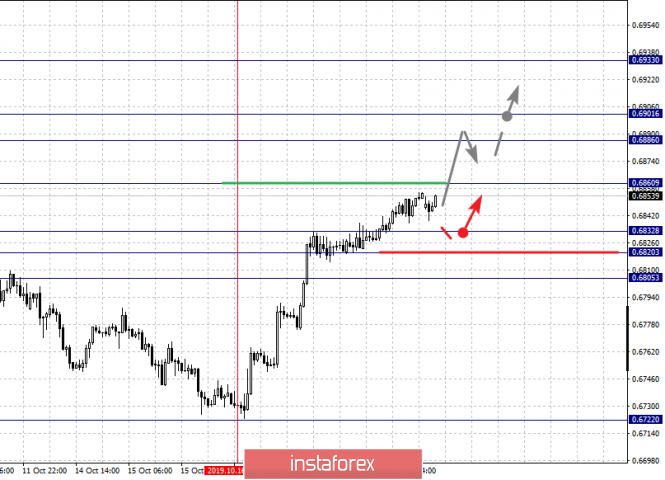
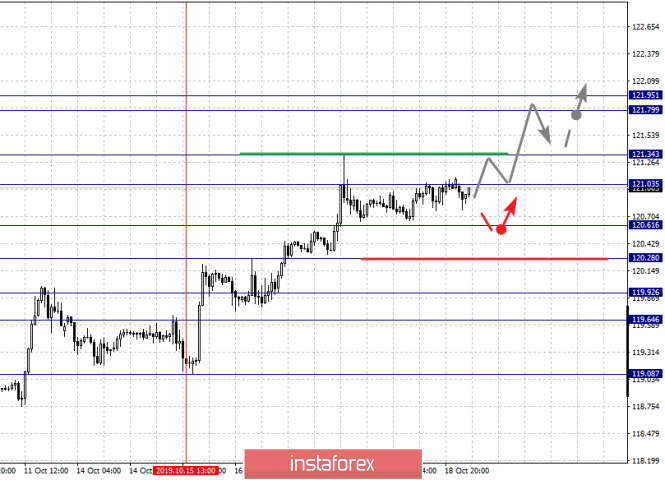
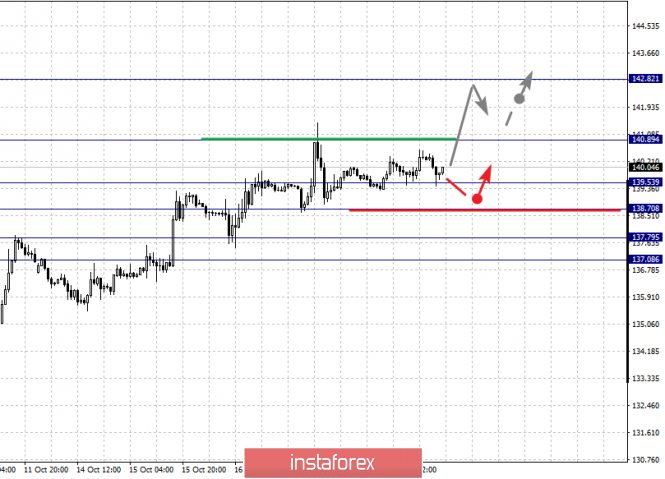
| Fractal analysis of the main currency pairs on October 21 Posted: 20 Oct 2019 05:55 PM PDT Forecast for October 21 : Analytical review of currency pairs on the scale of H1: For the euro / dollar pair, the key levels on the H1 scale are: 1.1223, 1.1179, 1.1161, 1.1140, 1.1123 and 1.1092. Here, we continue to monitor the development of the upward cycle of October 9. Short-term upward movement is expected in the range 1.1161 - 1.1179. The breakdown of the last value will lead to a movement to a potential target - 1.1223, when this level is reached, we expect a pullback to the bottom. Short-term downward movement is possibly in the range 1.1140 - 1.1123. The breakdown of the last value will lead to a long correction. Here, the goal is 1.1092. This level is a key support for the top. The main trend is the local ascending structure of October 8. Trading recommendations: Buy: 1.1162 Take profit: 1.1175 Buy 1.1181 Take profit: 1.1220 Sell: 1.1140 Take profit: 1.1124 Sell: 1.1121 Take profit: 1.1093 For the pound / dollar pair, the key levels on the H1 scale are: 1.3215, 1.3141, 1.3033, 1.2939, 1.2810, 1.2734 and 1.2625. Here, we are following the development of the upward cycle of October 9. Short-term upward movement is expected in the range 1.2939 - 1.3033. The breakdown of the level of 1.3035 should be accompanied by a pronounced upward movement. Here, the potential target is 1.3141. Price consolidation is in the range of 1.3141 - 1.3215 . Short-term downward movement is expected in the range of 1.2810 - 1.2734. The breakdown of the last value will lead to an in-depth correction. Here, the target is 1.2625. This level is a key support for the top. The main trend is the upward structure of October 9. Trading recommendations: Buy: 1.2940 Take profit: 1.3032 Buy: 1.3035 Take profit: 1.3140 Sell: 1.2810 Take profit: 1.2735 Sell: 1.2730 Take profit: 1.2625 For the dollar / franc pair, the key levels on the H1 scale are: 0.9902, 0.9879, 0.9863, 0.9836, 0.9822 and 0.9794. Here, we are following the development of the local descending structure of October 15. Short-term downward movement is expected in the range 0.9836 - 0.9822. The breakdown of the latter value will lead to a pronounced movement to a potential target - 0.9794. We expect a pullback to the top from this level. Short-term upward movement is possibly in the range of 0.9863 - 0.9879. The breakdown of the latter value will lead to an in-depth correction. Here, the goal is 0.9902. This level is a key support for the downward structure. The main trend is the local descending structure of October 15. Trading recommendations: Buy : 0.9863 Take profit: 0.9875 Buy : 0.9881 Take profit: 0.9900 Sell: 0.9836 Take profit: 0.9822 Sell: 0.9820 Take profit: 0.9796 For the dollar / yen pair, the key levels on the scale are : 109.66, 109.33, 108.90, 108.72, 108.24, 108.02 and 107.67. Here, we are following the development of the upward cycle of October 4. Short-term upward movement is expected in the range 108.72 - 108.90. The breakdown of the latter value will lead to a movement to the level of 109.33. Price consolidation is near this level. For the potential value for the top, we consider the level of 109.66. Upon reaching this level, we expect a consolidated movement, as well as a pullback to the bottom. Short-term downward movement is expected in the range of 108.24 - 108.02. The breakdown of the last value will lead to an in-depth correction. Here, the goal is 107.67. This level is a key support for the top. The main trend: the upward cycle of October 4. Trading recommendations: Buy: 108.90 Take profit: 109.30 Buy : 109.34 Take profit: 109.65 Sell: 108.24 Take profit: 108.03 Sell: 108.00 Take profit: 107.70 For the Canadian dollar / US dollar pair, the key levels on the H1 scale are: 1.3211, 1.3177, 1.3156, 1.3107, 1.3082 and 1.3052. Here, we are following the development of the downward cycle of October 10. Short-term downward movement is expected in the range of 1.3107 - 1.3082. The breakdown of the last value will lead to a movement to a potential target - 1.3052. From this level, we expect a pullback to the top. Short-term upward movement is possibly in the range of 1.3156 - 1.3177. The breakdown of the last value will lead to an in-depth correction. Here, the target is 1.3211. This level is a key support for the downward structure. The main trend is the downward cycle of October 10th. Trading recommendations: Buy: 1.3156 Take profit: 1.3176 Buy : 1.3178 Take profit: 1.3210 Sell: 1.3107 Take profit: 1.3084 Sell: 1.3080 Take profit: 1.3052 For the Australian dollar / US dollar pair, the key levels on the H1 scale are : 0.6933, 0.6901, 0.6886, 0.6860, 0.6832, 0.6820 and 0.6805. Here, we are following the development of the ascending structure of October 16. The continuation of the movement to the top is expected after the breakdown of the level of 0.6860. In this case, the target is 0.6886. Short-term upward movement, as well as consolidation is in the range of 0.6886 - 0.6901. For the potential value for the top, we consider the level of 0.6933. The movement to which is expected after the breakdown of the level of 0.6901. Short-term downward movement is possibly in the range of 0.6832 - 0.6820. The breakdown of the latter value will lead to an in-depth correction. Here, the target is 0.6805. This level is a key support for the upward structure. The main trend is the upward structure of October 16. Trading recommendations: Buy: 0.6860 Take profit: 0.6886 Buy: 0.6887 Take profit: 0.6900 Sell : 0.6832 Take profit : 0.6822 Sell: 0.6820 Take profit: 0.6805 For the euro / yen pair, the key levels on the H1 scale are: 121.95, 121.79, 121.34, 121.03, 120.61, 120.28, 119.92 and 119.64. Here, we are following the development of the local ascendant structure of October 15. Short-term upward movement is expected in the range 121.03 - 121.34. The breakdown of the level of 121.35 should be accompanied by a pronounced upward movement. Here, the target is 121.79. Price consolidation is in the range of 121.79 - 121.95. From here, we expect a correction. Short-term downward movement is possibly in the range of 120.61 - 120.28. The breakdown of the last value will lead to an in-depth correction. Here, the goal is 119.92. This level is a key support for the top. Its passage at the price will lead to the formation of initial conditions for the downward cycle. In this case, the first goal - 119.64. The main trend is the upward structure of October 15. Trading recommendations: Buy: 121.05 Take profit: 121.34 Buy: 121.36 Take profit: 121.76 Sell: 120.60 Take profit: 120.33 Sell: 120.25 Take profit: 119.94 For the pound / yen pair, the key levels on the H1 scale are : 142.82, 140.89, 139.53, 137.79, 137.08, 136.05 and 135.47. Here, we are following the development of the upward cycle of October 8. The continuation of the movement to the top is expected after the breakdown of the level of 139.55. In this case, the target is 140.89. Price consolidation is near this level. The breakdown of the level of 140.92 will lead to the development of a pronounced movement. In this case, the potential goal is 142.82. Upon reaching which, we expect consolidation, as well as a pullback to the bottom. Short-term downward movement is possibly in the range of 137.79 - 137.08. The breakdown of the last value will lead to a long correction. Here, the target is 136.05. The range of 136.05 - 135.47 is a key support for the top. The main trend is the medium-term upward structure of October 8. Trading recommendations: Buy: Take profit: Buy: 141.00 Take profit: 142.80 Sell: 139.50 Take profit: 138.75 Sell: 138.65 Take profit: 137.80 The material has been provided by InstaForex Company - www.instaforex.com |
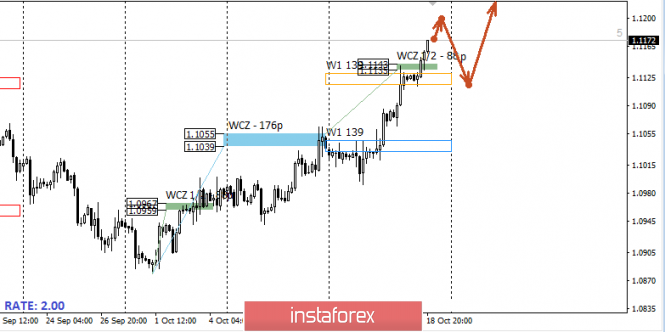
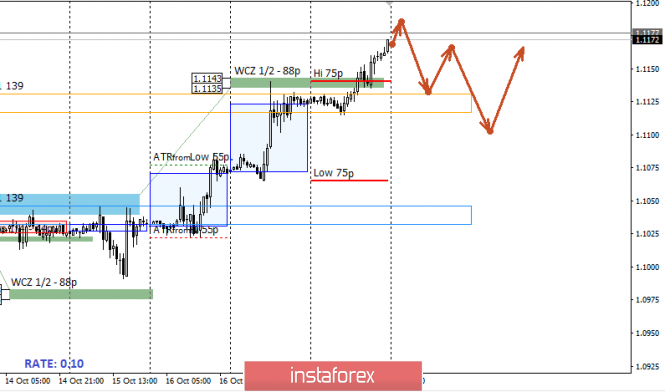
| Posted: 20 Oct 2019 03:43 PM PDT The growth of the euro is a strong medium-term impulse. This indicates the need to find favorable prices for the purchase. Since the closing of trading last week occurred above the weekly and monthly average moves, the probability of the formation of a correctional model increased to 90%. Work towards continued growth will be relevant all week, as the growth of the pair has led to a violation of the downward long-term model. Any decrease should be perceived as a correction and look for opportunities to buy the instrument. An alternative model will be developed if a local accumulation zone is formed. This will require retention of the Friday high and the formation of a false breakout pattern. At least two days should be traded within the Friday movement. Daily CZ - daily control zone. The area formed by important data from the futures market, which change several times a year. Weekly CZ - weekly control zone. The zone formed by important marks of the futures market, which change several times a year. Monthly CZ - monthly control zone. The zone, which is a reflection of the average volatility over the past year. The material has been provided by InstaForex Company - www.instaforex.com |
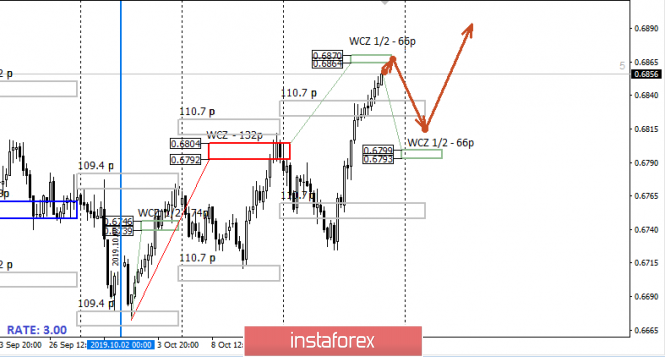
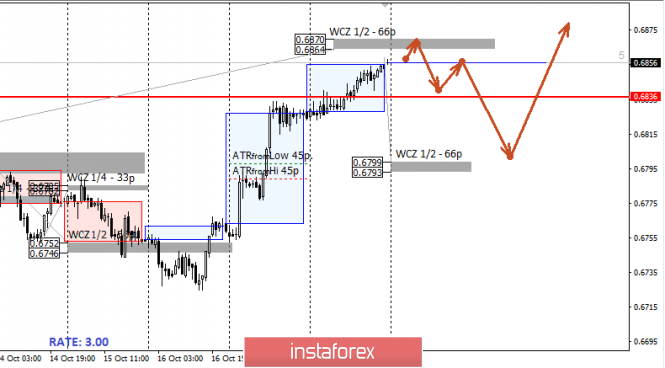
| Posted: 20 Oct 2019 03:43 PM PDT At the end of last week, the pair went beyond the average weekly move, which indicates the strength of the upward movement. However, it is important to understand that the probability of a return to the breached zone has increased to 90%. When building a daily plan, it is important to take this fact into account, as this will make it possible to obtain more favorable prices for purchasing. There is not much left to the target zone of WCZ 1/2 0.6870-0.6864, so its test will be decisive for further movement. If the test leads to the formation of a "false breakout" pattern, then this will indicate the beginning of the formation of the correctional model. The main support on Monday will be WCZ 1/2 0.6799-0.6793. After returning to the range of the average course of the previous week, this zone will be decisive for the entire upward impulse. If the pair continues to trade above it, then the monthly high will be updated several more times. Daily CZ - daily control zone. The area formed by important data from the futures market, which change several times a year. Weekly CZ - weekly control zone. The zone formed by important marks of the futures market, which change several times a year. Monthly CZ - monthly control zone. The zone, which is a reflection of the average volatility over the past year. The material has been provided by InstaForex Company - www.instaforex.com |
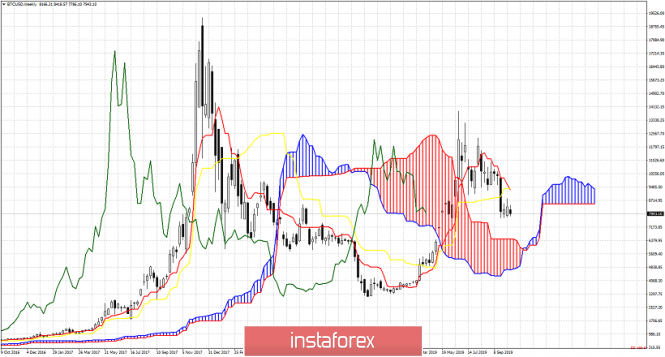
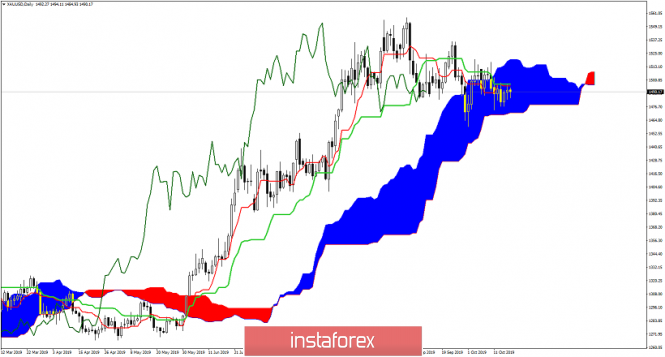
| Posted: 20 Oct 2019 01:21 PM PDT On a weekly basis the Ichimoku cloud indicator has given a weak bearish signal by a cross of the tenkan-sen below the Kijun-sen. I expect this bearish signal to provide a pull back test towards weekly cloud support before the bullish trend resumes.
|
| Posted: 20 Oct 2019 01:14 PM PDT USDCAD is challenging important long-term support levels. Bulls need to step in now, otherwise we could see price move below 1.30 soon, even this week. Such a break down could lead to 1.27 and would cancel any scenario for a move towards 1.35.
USDCAD price is right above the red trend line support at 1.3125. The RSI has already broken this support level. This is a bearish sign. This increases the chances of a move lower at least towards 1.30. Long-term support is found at 1.30. Breaking below it will open the way for a move towards 1.28-1.27. Bulls need to recapture the 1.3240 level in order to keep hopes for 1.35 alive. The material has been provided by InstaForex Company - www.instaforex.com |
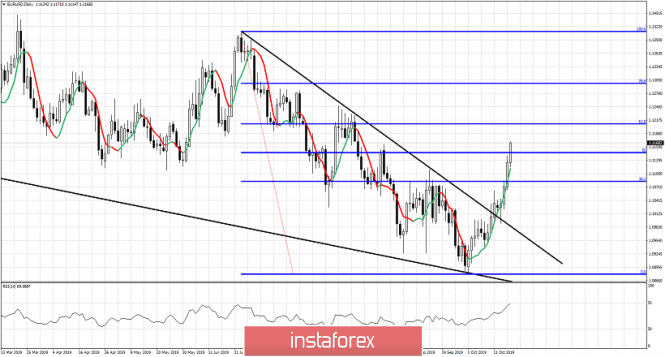
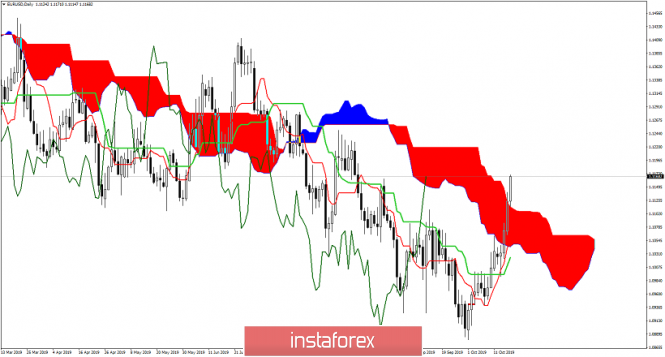
| EURUSD remains firmly bullish in the short-term Posted: 20 Oct 2019 01:09 PM PDT EURUSD has held its ground this week and closed at its week highs not looking back from 1.1030 where it opened last Monday. In our previous posts we noted that holding above 1.10-1.1030 would lead to a move towards 1.1130 and higher. Resistance at 1.10-1.1030 area got broken, back tested and then broken again. What else do we need for a clearer bullish sign?
This wedge pattern has been noted several times in previous analysis. Our first target was the 38% Fibonacci retracement once the resistance at 1.10 was broken. Now we are moving closer to our next target at the 61.8% Fibonacci retracement level. Trend is bullish in the short-term.
|
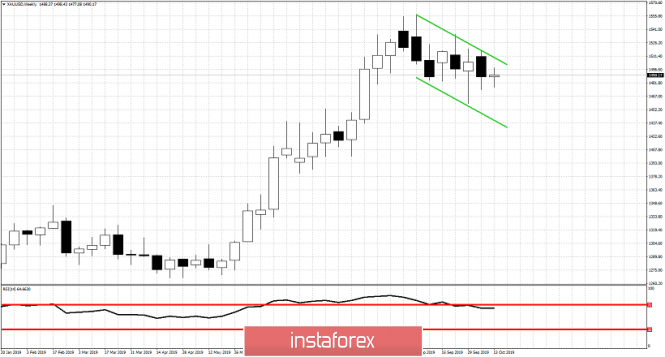
| Posted: 20 Oct 2019 01:02 PM PDT Gold price was mostly stable last week moving within a narrow price range. Gold ended the week slightly higher than last week while price moved between $1,477 and $1,498. At the end of the week price was just a bit higher than where it opened on Monday. So this is a no event week.
Despite Dollar sell off last week, Gold bulls did not manage to recapture the $1,500 level. Price remains inside the bearish channel and as long as we continue to trade below $1,525 I continue to expect price to move closer to the lower green channel boundary near $1,440. Support is at $1,477-74 and resistance at $1,500 and next at $1,525. Any bounce is considered selling opportunity as long as we trade below $1,525.
|
| You are subscribed to email updates from Forex analysis review. To stop receiving these emails, you may unsubscribe now. | Email delivery powered by Google |
| Google, 1600 Amphitheatre Parkway, Mountain View, CA 94043, United States | |


No comments:
Post a Comment