Forex analysis review |
- EUR/USD. October 24. Results of the day. The final speech of Mario Draghi as ECB chairman pulled down the euro
- Fractal analysis of the main currency pairs for October 25
- AUD / USD vs USD / CAD vs NZD / USD vs #USDX (H4). Comprehensive analysis of movement options from October 25, 2019 APLs
- Necessary as air: gold is an indispensable attribute of any portfolio
- EUR/USD: farewell song of the ECB president, or why you should buy the euro
- Forecast of EURUSD ahead of ECB and Fed meetings
- EUR/USD. The "passing" ECB meeting, uncertain growth of the dollar and Johnson's ultimatum
- USDJPY holds firmly above 108.50 ready for its next move higher
- EURUSD has many chances for an upward reversal
- Gold challenges major resistance and pivot area
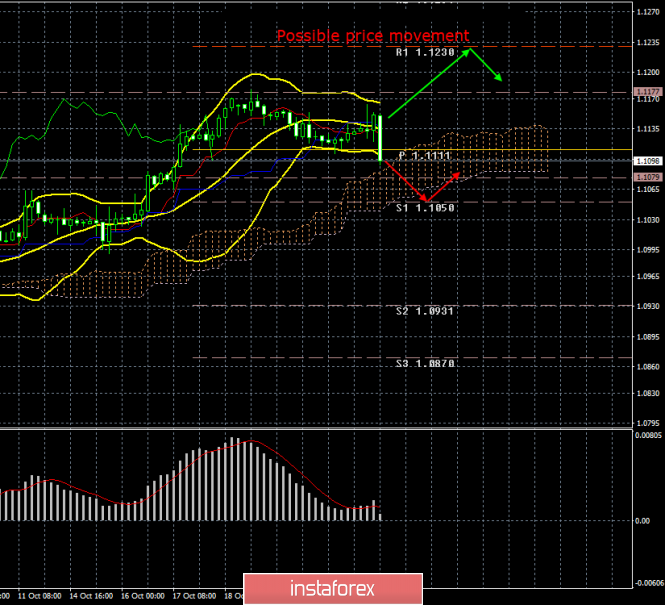
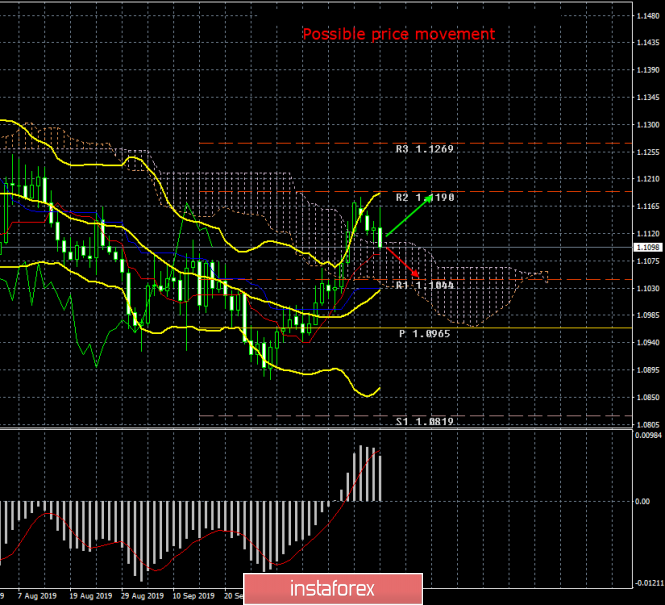
| Posted: 24 Oct 2019 07:21 PM PDT 4-hour timeframe Amplitude of the last 5 days (high-low): 75p - 56p - 41p - 39p - 34p. Average volatility over the past 5 days: 49p (average). The penultimate trading day of the week was in more active trading than the first three. There is nothing surprising in this, as there were plenty of macroeconomic reports and events today. Below we will consider them in detail. Now we can say that the bears went on the attack, as they received the most compelling reasons for this at the US trading session. Thus, the chances of a resumption of the downward trend have significantly grown on Thursday, and the euro/dollar pair itself has already fallen 65 points from the high of the day. All the first three days we just did what we wrote about the upcoming ECB meeting, about the whole package of various macroeconomic reports on Thursday. This Thursday has arrived, and there really is something to analyze. It all started with the publication of business activity indexes in Germany and the European Union. Without going into too much detail, we'll immediately say that all six indices turned out to be worse than forecasted values, although five out of six indices showed improvement compared to the previous month. However, this improvement doesn't mean much and certainly does not add optimism to traders, since the most significant and expected business activity indexes in the EU and Germany production again failed miserably, amounting to 45.7 and 41.9. Recall that any value below 50.0 represents an industry decline. Thus, it is easy to guess in what condition the industry of both the "locomotive of the European Union" and the European Union itself is in. On this news, traders have already begun to gradually get rid of the euro currency, although during the day there was also an increase in the euro/dollar pair. Then came the time to announce the results of the meeting of the European Central Bank. There were no surprises. The lending rate remained at the level of 0.0%, and the deposit rate - at the level of -0.5%. Such figures could not provoke a serious change in price, and traders calmly accepted the absence of changes. The most interesting event was certainly the speech of the ECB President Mario Draghi, who is completing his 8-year cycle of government. From November 1, his place will be taken by Christine Lagarde, who previously held the post of head of the IMF. What did Draghi say? By and large, nothing new. Yes, he could not say anything new; there were no grounds for this and global changes in the economy or geopolitical situation. Draghi reiterated weak inflation and that the regulator will do everything in his power to increase it. He noted a weak economy, clearly in need of stimulation. Once again, he complained about the increased risks of protectionism policies, alluding to Trump's activities and complete uncertainty with Brexit. Thus, at his last meeting, Mario Draghi did not express himself "softly," leaving Christine Lagarde to further developments. Draghi said everything as it is. His speech caused a sell-off of the European currency. In fact, traders heard a clear hint in Draghi's speech that the rate could be lowered again. This "one more time" may come very soon. The regulator clearly decided to postpone a similar decision, since the announced program of quantitative easing will begin to operate only in November, and before stimulating the economy again, you must at least wait for the first results of the QE program . As for the prospects for the European currency, they are again bearish, as traders again saw how bad everything is in the European Union. Now the bulls hope will be associated only with the Federal Reserve meeting, at which Jerome Powell may not put off the ballot and announce the third consecutive reduction in the key rate. This could save the European currency from updating two-year lows. To top it off, the United States released indicators of changes in the volume of orders for durable goods and business activity indices in the Markit industries and services. What can I say? All 4 indicators of orders for durable goods were significantly worse than forecasts and August values. The reduction of the main indicator was 1.1% in September, excluding transport - 0.3% of losses, excluding defense orders - a decrease of 1.2%, excluding defense and aviation - a decrease of 0.5%. Macroeconomic statistics from the United States continues to disappoint, which increases the chances of another easing of the Fed's monetary policy. Well, at the very end, preliminary values of business activity indices in the US for October came out. All three indicators exceeded the previous values, however, these data were clearly lost against the background of all the previous events of Wednesday and there was no reaction to them. The technical picture was on the side of the bulls on Wednesday. Draghi's speech made adjustments to the plans of traders and now we expect a fall to the support level of 1.1050, where a strong support line for the Ichimoku indicator - Senkou Span B. also passes nearby. Overcoming these two supports will show that the bears are really ready for new feats and will move the pair down at least until the Fed meeting. If the Fed does not lower the rate, this will be another bearish factor for the euro/dollar pair. 24-hour timeframe The price hit the Senkou Span B line, and if there is no sharp pullback, then most likely this line will be overcome. But a rebound from it can play in favor of the euro and its long-term prospects. At least in this case, we can expect an upward movement to the resistance level of 1.1190, and on the 4-hour timeframe - consolidation above the Kijun-sen line, which will return the bulls to the game. Trading recommendations: EUR/USD continues to be adjusted, however, in the coming days, a downward trend may resume. We do not recommend selling the pair yet, as the sell signal from Ichimoku is very weak, and trading was held on emotions. On Friday, market participants will calm down, the volatility will slightly decrease, and it will be possible to draw conclusions about the movement of the pair on Thursday in a more relaxed atmosphere. However, formally, shorts are now relevant with goals of 1.1079 and 1.1050. Returning to euro purchases is now recommended no earlier than the reverse crossing the critical line with the target of 1.1230. Explanation of the illustration: Explanation of the illustration: Ichimoku indicator: Tenkan-sen is the red line. Kijun-sen is the blue line. Senkou Span A - light brown dotted line. Senkou Span B - light purple dashed line. Chikou Span - green line. Bollinger Bands Indicator: 3 yellow lines. MACD indicator: Red line and bar graph with white bars in the indicator window. Support / Resistance Classic Levels: Red and gray dotted lines with price symbols. Pivot Level: Yellow solid line. Volatility Support / Resistance Levels: Gray dotted lines without price designations. Possible price movement options: Red and green arrows. The material has been provided by InstaForex Company - www.instaforex.com |
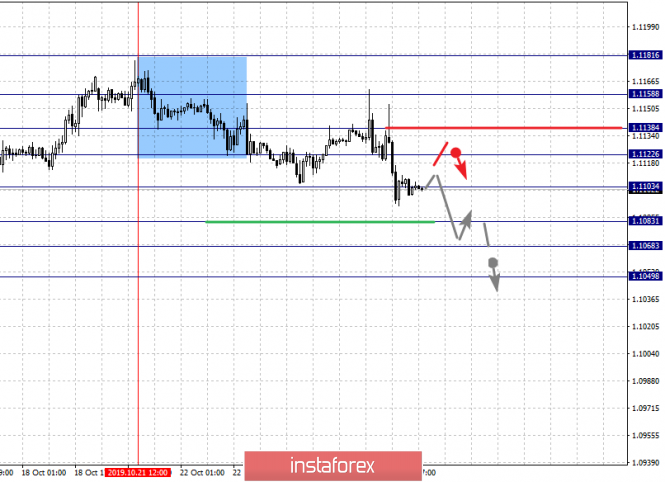
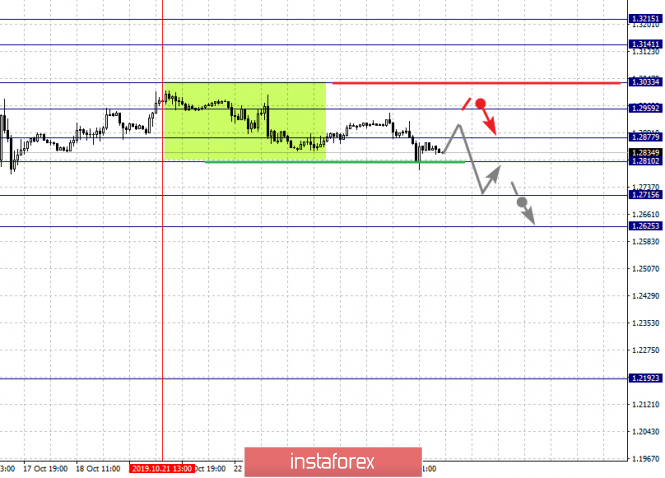
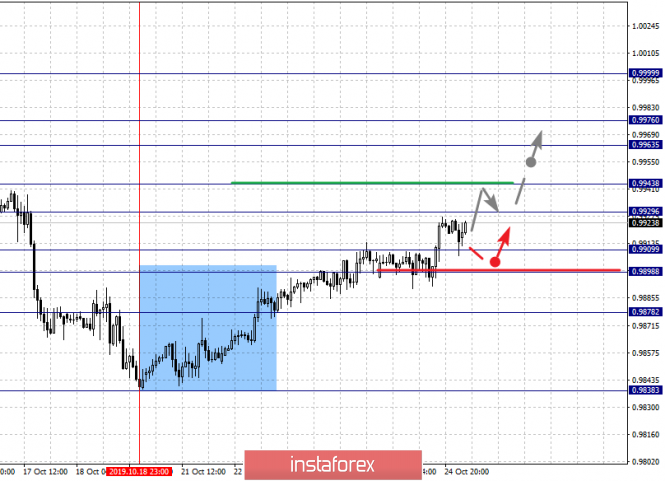
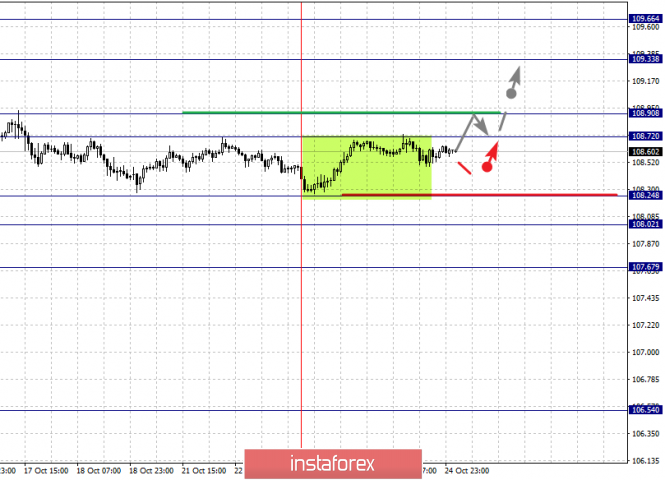
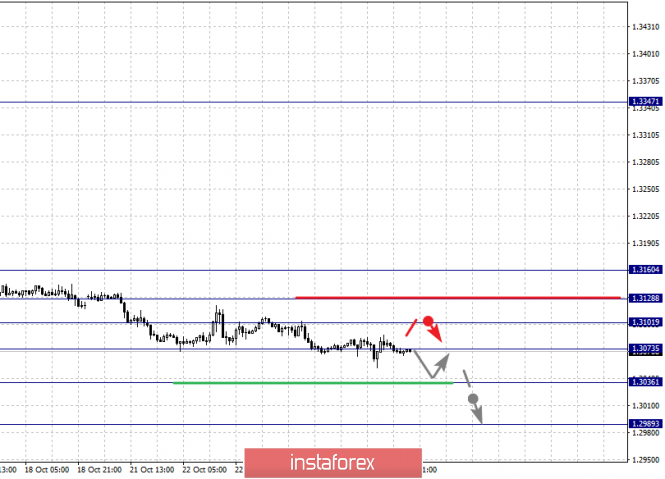
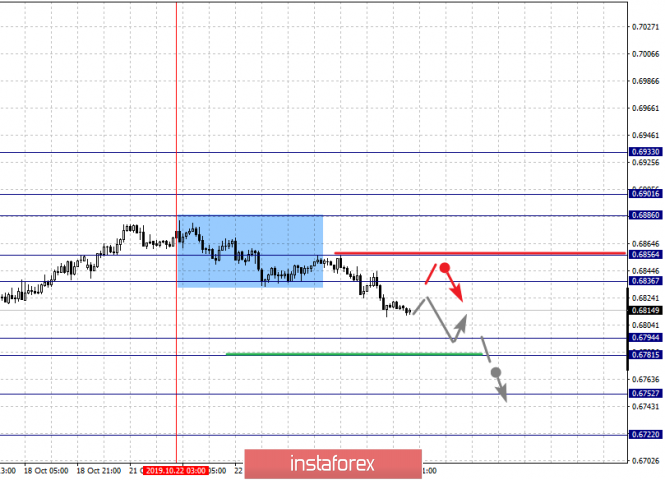
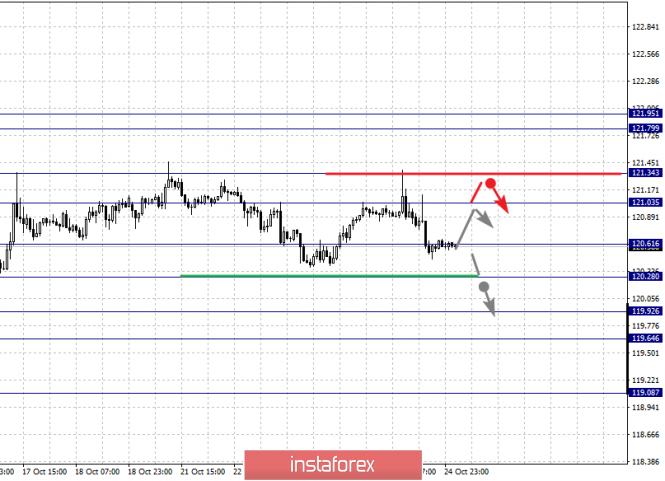
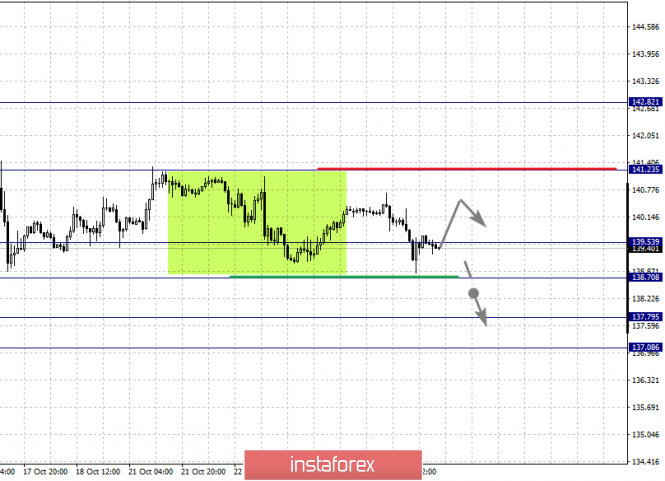
| Fractal analysis of the main currency pairs for October 25 Posted: 24 Oct 2019 05:31 PM PDT Forecast for October 25: Analytical review of currency pairs on the scale of H1: For the euro / dollar pair, the key levels on the H1 scale are: 1.1223, 1.1181, 1.1158, 1.1138, 1.1122, 1.1103, 1.1083, 1.1068 and 1.1049. Here, the price forms a pronounced structure for the downward movement of October 21. The continuation of the movement to the bottom is expected after the breakdown of the level of 1.1103. In this case, the target is 1.1083. Price consolidation is in the range of 1.1083 - 1.1068 For the potential value for the bottom, we consider the level of 1.1049. Upon reaching which, we expect a pullback to the top. Short-term upward movement is expected in the range 1.1122 - 1.1138. The breakdown of the latter value will lead to an in-depth correction. Here, the target is 1.1158. This level is a key support for the downward structure. The main trend is the descending structure of October 21. Trading recommendations: Buy: 1.1122 Take profit: 1.1136 Buy: 1.1140 Take profit: 1.1156 Sell: 1.1103 Take profit: 1.1083 Sell: 1.1068 Take profit: 1.1050 For the pound / dollar pair, the key levels on the H1 scale are: 1.3215, 1.3141, 1.3033, 1.2939, 1.2810, 1.2734 and 1.2625. Here, we are following the development of the upward cycle of October 9. At the moment, the price has expressed a pronounced potential for the downward movement of October 21. The continuation of the movement to the top is expected after the breakdown of the level of 1.2959. In this case, the first target is 1.3035. The breakdown of the level of 1.3035 will lead to a pronounced upward movement. Here, the potential target is 1.3141. Price consolidation is in the range of 1.3141 - 1.3215. We expect consolidated movement in the range of 1.2877 - 1.2810. The breakdown of the last value will lead to an in-depth correction. Here, the target is 1.2715. This level is a key support for the top. Its breakdown will lead to the formation of potential for the downward cycle. Here, the goal is 1.2625. The main trend is the ascending structure of October 9, the formation of the descending structure of October 21. Trading recommendations: Buy: 1.2960 Take profit: 1.3031 Buy: 1.3035 Take profit: 1.3140 Sell: 1.2808 Take profit: 1.2717 Sell: 1.2713 Take profit: 1.2627 For the dollar / franc pair, the key levels on the H1 scale are: 0.9999, 0.9976, 0.9963, 0.9943, 0.9929, 0.9909, 0.9898 and 0.9878. Here, we are following the development of the ascending structure of October 18. Short-term upward movement is expected in the range 0.9929 - 0.9943. The breakdown of the last value will lead to pronounced movement. Here, the target is 0.9963. Short-term upward movement, as well as consolidation is in the range of 0.9963 - 0.9976. For the potential value for the top, we consider the level of 0.9999. Upon reaching this value, we expect a rollback to the bottom. Short-term downward movement is possibly in the range of 0.9909 - 0.9898. The breakdown of the latter value will lead to an in-depth correction. Here, the target is 0.9878. This level is a key support for the upward structure. The main trend is the upward structure of October 18. Trading recommendations: Buy : 0.9930 Take profit: 0.9943 Buy : 0.9945 Take profit: 0.9963 Sell: 0.9909 Take profit: 0.9900 Sell: 0.9896 Take profit: 0.9878 For the dollar / yen pair, the key levels on the scale are : 109.66, 109.33, 108.90, 108.72, 108.24, 108.02 and 107.67. Here, we are following the development of the upward cycle of October 4. Short-term upward movement is expected in the range 108.72 - 108.90. The breakdown of the latter value will lead to a movement to the level of 109.33. Price consolidation is near this level. For the potential value for the top, we consider the level of 109.66. Upon reaching this level, we expect a consolidated movement, as well as a pullback to the bottom. Short-term downward movement is expected in the range of 108.24 - 108.02. The breakdown of the last value will lead to an in-depth correction. Here, the goal is 107.67. This level is a key support for the top. Main trend: local structure for the top of October 23. Trading recommendations: Buy: 108.90 Take profit: 109.30 Buy : 109.34 Take profit: 109.65 Sell: 108.24 Take profit: 108.03 Sell: 108.00 Take profit: 107.70 For the Canadian dollar / US dollar pair, the key levels on the H1 scale are: 1.3160, 1.3128, 1.3101, 1.3073, 1.3036 and 1.2989. Here, we consider the descending structure of October 10 as a medium-term initial condition. The continuation of movement to the bottom is expected after the breakdown of the level of 1.3073. In this case, the target is 1.3036. Price consolidation is near this level. For the potential value for the bottom, we consider the level of 1.2989. Upon reaching this level, we expect a pullback to the top. Short-term upward movement is possibly in the range of 1.3101 - 1.3128. The breakdown of the latter value will lead to an in-depth correction. Here, the target is 1.3160. This level is a key support for the downward structure. The main trend is the downward cycle of October 10. Trading recommendations: Buy: 1.3101 Take profit: 1.3126 Buy : 1.3130 Take profit: 1.3160 Sell: 1.3073 Take profit: 1.3038 Sell: 1.3034 Take profit: 1.3000 For the Australian dollar / US dollar pair, the key levels on the H1 scale are : 0.6933, 0.6901, 0.6886, 0.6856, 0.6836, 0.6794, 0.6781, 0.6752 and 0.6722. Here, we are following the descending structure of October 22. At the moment, we expect to reach the level of 0.6794. Price consolidation is in the range of 0.6794 - 0.6781. The breakdown of the level of 0.6780 will lead to a pronounced movement. Here, the target is 0.6752. Price consolidation is near this level, and there is also a high probability of a rollback to the top. For the potential value for the bottom, we consider the level of 0.6722. Upon reaching which, we expect a departure in the correction. Short-term upward movement is possibly in the range of 0.6836 - 0.6856. The breakdown of the latter value will favor the formation of an ascending structure. Here, the potential target is 0.6886. The main trend is the descending structure of October 22. Trading recommendations: Buy: 0.6836 Take profit: 0.6854 Buy: 0.6858 Take profit: 0.6886 Sell : 0.6780 Take profit : 0.6752 Sell: 0.6750 Take profit: 0.6724 For the euro / yen pair, the key levels on the H1 scale are: 121.95, 121.79, 121.34, 121.03, 120.61, 120.28, 119.92 and 119.64. Here, we are following the development of the local ascendant structure of October 15. Short-term upward movement is expected in the range 121.03 - 121.34. The breakdown of the level of 121.35 should be accompanied by a pronounced upward movement. Here, the target is 121.79. Price consolidation is in the range of 121.79 - 121.95. From here, we expect a correction. Short-term downward movement is possibly in the range of 120.61 - 120.28. The breakdown of the last value will lead to an in-depth correction. Here, the goal is 119.92. This level is a key support for the top. Its passage at the price will lead to the formation of initial conditions for the downward cycle. In this case, the first goal - 119.64. The main trend is the upward structure of October 15. Trading recommendations: Buy: 121.05 Take profit: 121.34 Buy: 121.36 Take profit: 121.76 Sell: 120.60 Take profit: 120.33 Sell: 120.25 Take profit: 119.94 For the pound / yen pair, the key levels on the H1 scale are : 142.82, 141.23, 139.53, 138.70, 137.79 and 137.08. Here, we are following the development of the upward cycle of October 8. The continuation of movement to the top is expected after the breakdown of the level of 141.23. In this case, the potential target is 142.82. Upon reaching which, we expect consolidation, as well as a pullback to the bottom. Short-term downward movement is possibly in the range of 139.53 - 138.70. The breakdown of the last value will lead to a long correction. Here, the target is 137.79. The range of 137.79 - 137.08 is the key support for the top. The main trend is the medium-term upward structure of October 8. Trading recommendations: Buy: Take profit: Buy: 141.25 Take profit: 142.80 Sell: 139.50 Take profit: 138.75 Sell: 138.65 Take profit: 137.80 The material has been provided by InstaForex Company - www.instaforex.com |
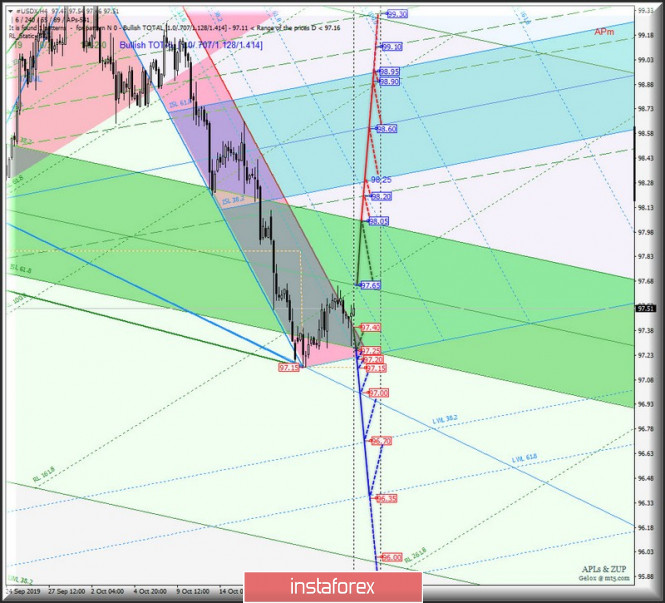
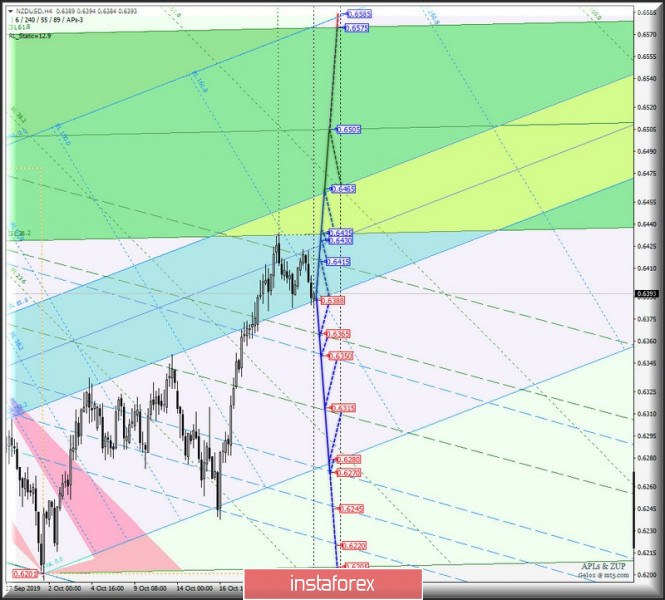
| Posted: 24 Oct 2019 05:00 PM PDT Minuette (H4) Here's a comprehensive analysis of the development options for the movement AUD / USD vs USD / CAD vs NZD / USD vs #USDX from October 25, 2019 on the Minuette operational scale forks (H4 time frame) ____________________ US dollar Index The movement of the dollar index #USDX from October 25, 2019 will be due to the development and range breakdown direction :
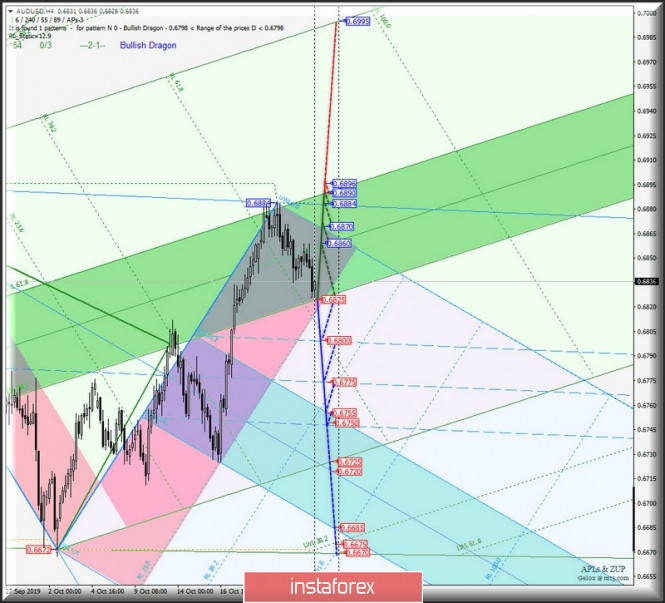
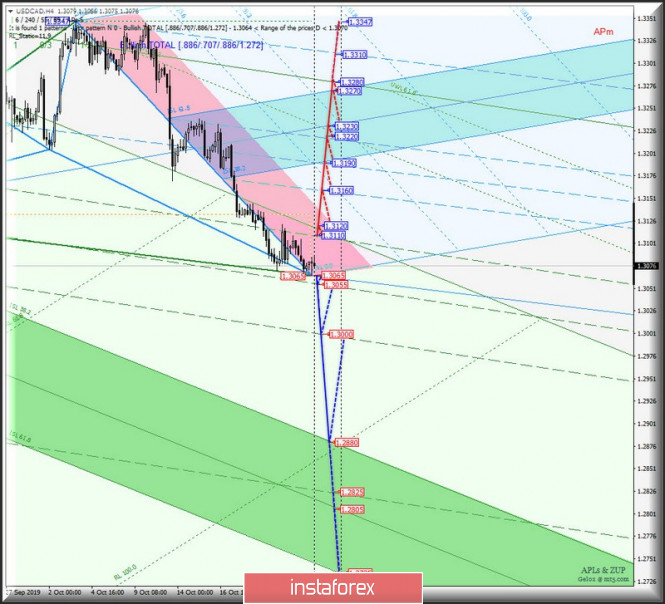
Now, in case that the Median Line Minuette breaks down (resistance level of 97.65), the dollar index price may continue to rise towards the targets - the upper boundary of the ISL38.2 (98.05) equilibrium zone of the Minuette operational scale forks - the final Schiff Line Minuette (98.20) - the equilibrium zone (98.25 - 98.50 - 98.95) of the Minuette operational scale forks. Consecutive breakdown of support levels : - 97.40 (the boundary of the red zone of the Minuette operational scale forks); - 97.25(lower boundary of the ISL61.8 equilibrium zone of the Minuette operational scale forks); - 97.20 (start line SSL of the Minuette operational scale forks); - 97.15 (local minimum); will make the continuation of the downward movement of #USDX to the control LTL (97.00) and warning - LWL38.2 (96.70) - LWL61.8 (96.35) - to the lines of the Minuette operational scale forks relevant. The markup of #USDX movement options from October 25, 2019 is shown in the animated chart. ____________________ Australian dollar vs US dollar The development of the movement of the Australian dollar AUD / USD on October 25, 2019 will depend on the development and direction of the breakdown of the boundaries of the equilibrium zone (0.6825 - 0.6860 - 0.6890) of the Minuette operational scale forks. The details of the development of the boundaries of this equilibrium zone are presented in the animated chart. The breakdown of the lower boundary of ISL38.2 (support level of 0.6825) of the equilibrium zone of the Minuette operational scale forks - continuation of the development of the downward movement of the Australian dollar to the a Median Line channel (0.6800 - 0.6775 - 0.6750) and equilibrium zones (0.6755 - 0.6720 - 0.6685) of the Minuette operational scale forks. In the case of combined breakdown of resistance levels : - 0.6890 (the upper boundary of ISL61.8, the equilibrium zone of the Minuette operational scale forks); - 0.6896 (local maximum); The upward movement of AUD / USD can be continued to the final line FSL (0.6995) Minuette operational scale forks. From October 25, 2019, we look at the layout of the AUD / USD movement options in the animated chart. ____________________ New Zealand dollar vs US dollar From October 25, 2019, the development of the movement of the New Zealand dollar NZD / USD will be determined by the development and direction of the breakdown of the boundaries of the equilibrium zone (0.6388 - 0.6430 - 0.6465) of the Minuette operational scale forks. The marking of the development of the above levels is shown in the animated chart. The breakdown of the lower boundary of ISL38.2 (support level of 0.6388) of the equilibrium zone of the Minuette operational scale forks - an option to continue the downward movement of the New Zealand dollar to the targets - 1/2 Median Line Minuette (0.6365) - the final Schiff Line Minuette (0.6350) - the lower boundary of the 1/2 Median Line Minuette channel (0.6315) - the initial SSL line (0.6280) Minuette operational scale forks. On the contrary, if the upper boundary of ISL61.8 (resistance level of 0.6465) is broken, the equilibrium zone of the Minuette operational scale forks will confirm that further the development of the NZD / USD movement which will occur within the boundaries of the equilibrium zone (0.6435 - 0.6505 - 0.6575) of the Minuette operational scale forks. The marking options NZD / USD from October 25, 2019 can be seen in the animated chart. ____________________ US dollar vs Canadian dollar The development of the movement of the Canadian dollar USD / CAD from October 25, 2019 will be due to the development and direction of the breakdown of the range:
Consecutive breakdown of support levels : - 1.3065 (control line LTL Minuette operating scale forks); - 1.3055 (1/2 Median Line Minuette); will determine the continuation of the downward movement of the Canadian dollar to the lower boundary of the 1/2 Median Line Minuette channel (1.3000) and the upper boundary of ISL38.2 (1.2880) the equilibrium zone of the Minuette operational scale forks. In case of combined breakdown, the resistance level is : - 1.3110 (the upper boundary of the 1/2 Median Line Minuette channel); - 1.3120 (start line SSL of the Minuette operational scale forks); the upward movement of USD / CAD can continue to the boundaries of the 1/2 Median Line channel (1.3160 - 1.3190 - 1.3220) and the equilibrium zone (1.3190 - 1.3230 - 1.3270) of the Minuette operating scale forks. From October 25, 2019, we look at the layout of the USD / CAD movement options in the animated chart. ____________________ The review is made without taking into account the news background. Thus, the opening of trading sessions of major financial centers does not serve as a guide to action (placing orders "sell" or "buy"). The formula for calculating the dollar index: USDX = 50.14348112 * USDEUR0.576 * USDJPY0.136 * USDGBP0.119 * USDCAD0.091 * USDSEK0.042 * USDCHF0.036. where the power coefficients correspond to the weights of the currencies in the basket: Euro - 57.6%; Yen - 13.6%; Pound Sterling - 11.9%; Canadian dollar - 9.1%; Swedish Krona - 4.2%; Swiss franc - 3.6%. The first coefficient in the formula leads the index to 100 at the start date of the countdown - March 1973, when the main currencies began to be freely quoted relative to each other. The material has been provided by InstaForex Company - www.instaforex.com |
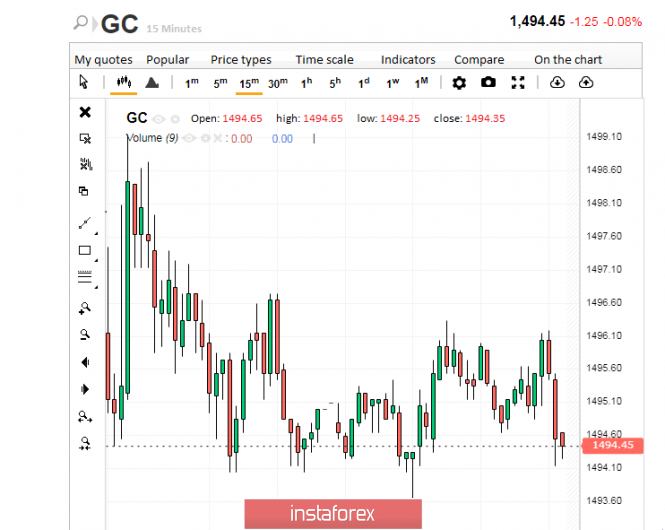
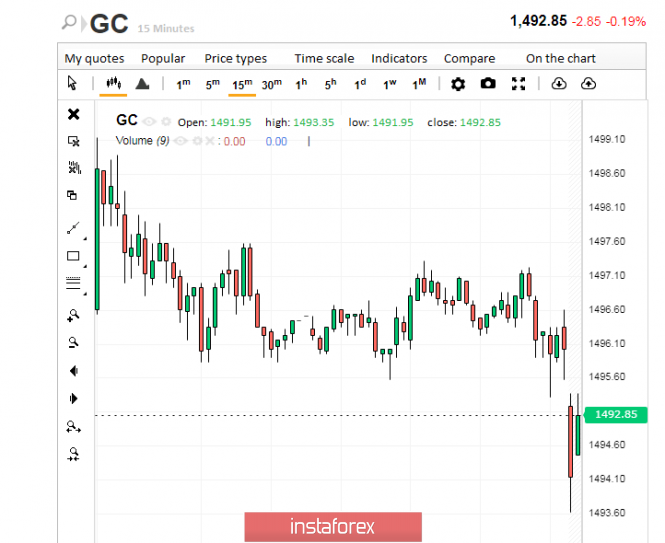
| Necessary as air: gold is an indispensable attribute of any portfolio Posted: 24 Oct 2019 03:51 PM PDT The market has never questioned the importance of gold. The yellow metal is considered one of the key components of any trader's investment portfolio. However, the current year clearly indicated the high demand and importance of precious metals. According to the observations of several analysts, gold was on a pedestal in 2019. It has become one of the most important assets. Confirmation of this is the sharply increased price of precious metals. Analysts consider the current policy of world central banks aimed at a total reduction in interest rates to be the reason for this price spurt. The global market is periodically storming, which worries investors who are fleeing into defensive assets. The main safe haven asset is still considered to be gold, which is time-tested. Many experts conclude that at the moment the precious metal has become a mandatory attribute of any investment portfolio. This point of view is held by the leading currency strategist Peter Grosskopf. He emphasizes that this year gold has won the lion's share of the market and is not going to stop there. Both world central banks and large investors are actively building up gold reserves, the analyst notes. Last month, the yellow metal reached a six-year high amid growing demand for defensive assets. The reasons for this, experts consider the reduction in interest rates by the Federal Reserve and the appeal of world regulators to super-soft monetary policy. According to analysts, this triggered a rapid increase in investments in exchange-traded funds secured by gold. "Soft monetary policy, as well as negative interest rates, do not stimulate economic activity so that the economic growth rate of countries exceeds the growth rate of debt," P. Grosskopf notes. According to the expert, the Federal Reserve put a check and check in this game, and gold entered the arena, which is now an obligatory portfolio asset. Over the past few months, the value of the yellow metal has shown impressive growth, and silver has followed up. In 2019, the price of gold increased by 16%. In the first month of autumn, the precious metal reached $1,557 per ounce, which is the limit since 2013. On Wednesday, October 23, immediate-delivery gold futures were trading near $1,492 per ounce. On Thursday morning, October 24, the price of the yellow metal did not rise above $1,494 per ounce. Precious metal market experts draw attention to the strong correlation of the European currency with gold and silver. They fear a bullish rally in emerging stock markets, as investors can start selling precious metals in this case. This could trigger a drop in the price of gold and the European currency, analysts said. Over the past two weeks, the yellow metal has consolidated at a strong record resistance level of $1,490 per ounce, which until recently acted as a support. At the moment, the asset is trading within the range of $1491– $1492 per ounce, maintaining its gained position and confidently making its way to the next peaks. This year has become a litmus test for the global economy, analysts said. The danger of the onset of the economic crisis came close, and the strong depreciation of fiat currencies became apparent. The current strategy of central banks has created a false idea of successfully overcoming the crisis, but now this soap bubble is ready to burst. According to analysts, the time has come for real assets, namely gold and silver. Their monetary value will play a key role in the coming years, they said. The debt burden in the global economy will continue to grow, and this will provide significant support to precious metals. Gold and silver will become alternative currencies for a wide range of investors, analysts summarize. The material has been provided by InstaForex Company - www.instaforex.com |
| EUR/USD: farewell song of the ECB president, or why you should buy the euro Posted: 24 Oct 2019 03:51 PM PDT Today will be the last ECB meeting on monetary policy, chaired by Mario Draghi. "The ECB is ready to do everything necessary to protect the euro" - these words made in 2012 will go down in history, becoming the cultural heritage of the retiring head of the ECB on October 31. "At that time - in the summer of 2012 - there was a huge systemic risk. Draghi saved not only European sovereign governments, but all European banks, especially given that they are linked like dominoes through interbank overnight lending. In legacy, Draghi is passing on a much healthier financial system with very affordable rates and balanced programs to continue to drive activity and consumer spending, " said Mondher Bettaib of Vontobel Asset Management. The head of the ECB, indeed, skillfully managed financial markets, but left his post in a difficult time for Europe. Germany is on the verge of a recession, inflation in the EU has slowed to 0.8%, Brexit's fate is still unsettled, and a more serious trade war could erupt between Washington and Brussels than between the United States and China, given the impressive volume of US exports to Europe. Thus, seeing Super Mario as President of the ECB are, on the one hand, under a storm of applause, and on the other, against the backdrop of increasing criticism of the regulator's last steps. Skeptics argue that lowering the ECB's deposit rate by 10 basis points, to -0.5%, will hit depositors even more. 95% of analysts recently surveyed by Bloomberg do not believe that the revival of European QE in the amount of €2.6 trillion will help the region's economy. At the September meeting of the Governing Council of the ECB, representatives of Germany, the Netherlands, France and Austria openly opposed certain elements of the new stimulus package. Recently, some of them have made it clear that they are ready to abandon claims due to the fact that from November the ECB will have a new chairman - Christine Lagarde. However, experts warn that public opposition to the decisions of the regulator weakens confidence in it and may complicate the task of the next head of the ECB if necessary to mitigate monetary policy in the future. It is expected that at the upcoming meeting, Draghi will speak in support of the September stimulus package and may even attempt to defend all the measures taken during his tenure at the head of the ECB, drawing attention to the following points: the fall in borrowing costs to record low levels, the weakening of political risks of peripheral eurozone countries, a strong labor market and growing confidence in the euro. In addition, Draghi can once again emphasize the need to ease the fiscal policy of the eurozone countries. However, the transfer of the ECB Chairman of his former merits, the protection of the revival of QE and calls to national governments may not provide adequate support to the bears on EUR/USD. Oxford Economics experts believe that after the announcement of a large-scale monetary stimulus in September, the ECB does not have any opportunity to make serious decisions in October. ABN Amro predicts that the regulator will reduce the rate on deposits to -0.6% in December, and from March will increase the scale of purchases of assets under QE, but few are of this opinion. BNP Paribas believes that in the coming months the ECB will operate in autopilot mode, as the Governing Council collects data on how the decisions already made by the regulator work in practice. It is possible that the ECB monetary expansion has reached its limit, while the Federal Reserve, according to the consensus forecast of Reuters analysts, will lower the rate on federal funds in October this year and early next year. 75% of more than 100 Reuters respondents believe that trade conflicts will push the US economy into a recession, the chances of which within 12 and 24 months are estimated at 35% and 45%, respectively. According to analysts, trade relations between the United States and China are developing according to the "one step forward, two steps backward" scenario. Despite the fact that the parties have concluded a truce, more imports are currently under tariffs than three months ago. The wider (in comparison with the ECB) space for the Fed's monetary expansion, the US economy is beginning to feel negative from trade disputes, as well as the hope that it will be possible to avoid a "hard" Brexit, are pushing the EUR/USD rate up. Thus, the press conference of Mario Draghi following the October meeting of the Governing Council of the ECB could be a good opportunity to buy the single European currency with a target of $1.1215 and $1.1270. The material has been provided by InstaForex Company - www.instaforex.com |
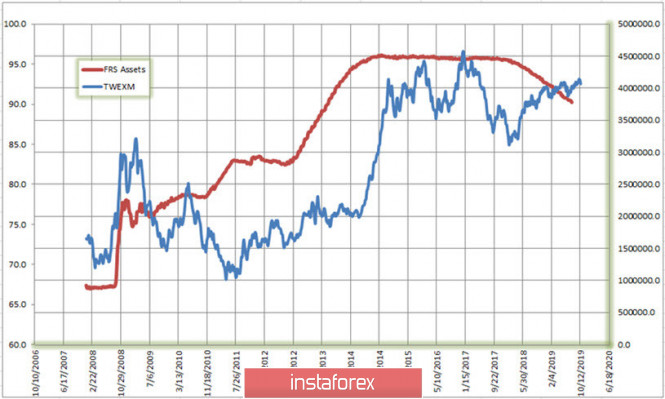
| Forecast of EURUSD ahead of ECB and Fed meetings Posted: 24 Oct 2019 03:51 PM PDT Key central banks will hold their meetings on Thursday, October 24, and Wednesday, 29 and 30, which will determine the dynamics of financial markets for at least the next one and a half to two months, and maybe in the longer term. Given these important events, from the point of view of trading in the foreign exchange market, we need to make assumptions cleared of information noise, and then look at how our assumptions worked out in reality. In other words, we need to create an algorithm of actions and make changes to it in accordance with newly emerging circumstances. However, why did I need to mark up a roadmap before and not after the event has already happened? There are a number of reasons for this, and first of all, my deep conviction that in the current situation, meetings of central banks will only confirm decisions already made earlier. Surprises are possible only from the Fed, but this seems unlikely. Therefore, while there are still some doubts regarding the actions of the Open Market Committee, I personally have no doubts about the actions of the European Central Bank. First of all, traders should know that, according to the regulations, the ECB never comments on or regulates the euro or, at least, declares it in words. However, one must be very naive to assume the detachment of the regulator in the fate of the exchange rate of the currency accountable to him. In words, the Fed and the ECB pursue an independent monetary policy, but the ability to create surplus value from the issue of money helps maintain the high standards of life for the "golden billion". Therefore, it's impossible for me to imagine that the change in exchange rates has been let off by gravity of key central banks. Well, if Russia holds consultations with OPEC countries to limit oil production and thus regulates the price, then the countries that are members of the North Atlantic alliance have been doing this for a long time and quite successfully, but with regard to money. Having in its hands a tool that controls 90 percent of the world's money circulation, it is a sin not to use this tool. So, what do we currently know about the policy of central banks? The European Central Bank maintains a refinancing rate of 0% and re-launched a large-scale asset purchase program worth €20 billion per month, and did so simultaneously with new long-term refinancing programs, which should not only increase the availability of liquidity in the European market, but also stimulate the development of the European economics. According to many experts, this should serve to weaken the euro, but did it? Having been hit by a liquidity crisis in the repurchase market that erupted in September, the Fed, under the formal pretext of increasing reserves of commercial banks, was forced to adopt an urgent program for the purchase of short-term bills of the US government totaling $65 billion per month. This at least equalizes the chances of the dollar in the competition of printing presses, if it does not increase its advantage. However, the truth is that the quantitative easing policy does not affect the exchange rate, at least to the extent that we would like to. You can see the evidence on the chart (Fig. 1), which shows the dynamics of the trade-weighted US dollar index calculated by the Fed based on the results of trade with leading world currencies. Figure 1: Relationship between US Fed assets and the trade-weighted dollar index. Source - Federal Reserve Bank of St. Louis Indeed, there are periods on the chart when the dollar depreciated with an increase in the Fed balance, but there are periods when everything happened exactly the opposite. A similar picture can be obtained by comparing the euro and the change in the balance sheet of the European Central Bank. The connection between the exchange rate and the balance sheet of the central bank may exist, but it is certainly not so primitive that we could calculate it using simple methods. When assessing the prospects for exchange rates, one should rather be guided by dynamic changes in the interest rate differential in the EURUSD rate, an assessment of the yield of treasury instruments with the same maturity, inflation potential, growth prospects for prices of major commodity assets, positioning of leading traders in the futures market, and seasonal factors. You and I can try to evaluate something, but most of the factors will remain unknown to us. At the same time, trading in exchange rates is doing so in probability, and the more facts we can evaluate, the higher the probability of success for the transactions we make. The main thing in these factors then is not to get confused. If we talk about the dynamic prospects of rates, then the advantage here is on the side of the euro. The ECB is in no hurry to make a refinancing rate below zero, and Mario Draghi, as a downed pilot, is rather concerned about how he can eject a golden parachute. He did everything he could, which at least presupposes a period of some stability in the policy of the regulator. In turn, since July of this year, the US Federal Reserve lowered the federal funds rate by half a percent, from 2.25 to 1.75, meaning the lower limit of the range established by the Open Markets Committee. Today, 94% of traders believe that the Fed will go for another rate cut in 6 days, dropping it to the level of 1.50-1.75 percent. A decrease in differential by 0.75% over three months is a serious decrease in the possibility of earning by arbitrage operations. Therefore, it is not surprising that from the beginning of August, that is, from the moment the Fed rate was lowered, institutional investors gradually refused to place investments in US dollars. During this time, the long positions of institutional management funds (Asset Manager) lost about a tenth, while euro sales by this category of traders in the futures market, on the contrary, increased. At the same time, asset managers have been the main buyers of the euro in the futures market since 2016, which was due to their hedging a short position in the cash market that accompanies transactions in investments in higher-yield dollar instruments. Actually, the question now is not whether there will be a reversal of the downward trend in euros, but when it will happen. Last week ended with serious technical signs of breaking the fundamental trend on the EURUSD course. However, the reversal is not yet over, and its formation may last another one or two months, which is fraught for us with problems associated with the formation of a new direction, and the meetings of central banks that we will see in the near future may accelerate or may slow down the formation of the reversal. However, the probability of a EURUSD rate reversal is becoming more and more every day, take this into account when opening your positions. The material has been provided by InstaForex Company - www.instaforex.com |
| EUR/USD. The "passing" ECB meeting, uncertain growth of the dollar and Johnson's ultimatum Posted: 24 Oct 2019 03:51 PM PDT Traders predictably ignored the October meeting of the ECB. Although Mario Draghi voiced the dovish theses, his rhetoric did not impress market participants. This was the final speech of the chairman of the European central bank, so all his comments and suggestions were more likely to be recommendatory in nature. Nevertheless, Draghi eloquently conveyed the general mood that is in the camp of the European Central Bank. ECB members are still determined to maintain a high degree of accommodation over a "long period of time," while they positively assess the impact of negative interest rates. But they assess the prospects for the European economy on the contrary, pessimistically: Mario Draghi reiterated his thesis that current macroeconomic reports suggest a "more pronounced" slowdown in economic growth, while downward risks only increase. Sluggish inflation also worries ECB members, especially in light of the September data: the general consumer price index was revised downward (to 0.8% from the previous 1%). In addition, according to Draghi, the growth dynamics of the manufacturing industry in the eurozone is of particular concern. This sector of the economy is the most vulnerable in the context of the negative effects of global trade conflicts. In other words, the head of the ECB did not say anything new: he voiced all these theses before. At the same time, taking into account the fact of his final speech, he allowed himself to open the curtain of the "inner workings". According to him, members of the European regulator who previously voted "differently from the majority" resolved controversial issues and called for unity. Thus, Draghi, firstly, admitted that at the September meeting there was a split among the ECB members (some members of the regulator opposed the resumption of the stimulus program), and secondly, he announced the settlement of the conflict. Thus, the October meeting of the European Central Bank was "passing". The euro-dollar pair quickly switched to other fundamental factors. By and large, today the EUR/USD pair followed the dynamics of the US currency, ignoring the ECB meeting. In turn, the dollar index jumped in a few hours from 97.105 to 97.515 points, even despite weak data on orders for durable goods. The greenback rose in price due to another indicator: the index of business activity in the manufacturing sector for the first time in a long time came out in the green zone. For the first time in several weeks, the manufacturing sector was pleased with positive dynamics after a series of negative releases. The US manufacturing ISM index has been steadily decreasing for the past six months (in September it crashed to around 47.8 points, updating a 10-year low). Following the ISM, the producer price index also showed a significant decline - on a monthly basis, this indicator unexpectedly plunged into the negative area, for the first time since January of this year, showing the weakest result since the fall of 2015. The load of industrial capacities decreased, and the volume of industrial production (the indicator includes manufacturing, mining and utilities) decreased in September by 0.4% on a monthly basis. This is also a kind of anti-record - for the first time since April this year, this indicator fell into the negative area. That is why the greenback reacted so violently to the growth of the US index of business activity in the manufacturing sector. Instead of falling to around 50.7, the indicator rose to 51.5. Frankly speaking, this is a rather modest and unconvincing reason for the growth of the dollar, however, against the background of the general pessimism that prevailed among dollar bulls, this information line triggered a rise in the price of the greenback throughout the market. The European currency turned out to be vulnerable to the onslaught of the dollar: the dovish heses of the ECB coincided with the uncertain prospects of Brexit. Every day the situation is becoming more confused, while the "X-hour" - October 31 - is just around the corner. On the one hand, Brussels is ready to grant a reprieve to London, but cannot decide on the final date of extension. On the other hand, Johnson is still "playing his own game": according to the latest information, the head of the British government delivered an ultimatum to the deputies of the House of Commons: he gives deputies more time to discuss the deal (agreeing on a postponement), but only if they agree to hold early elections - December 12. At the same time, he called on the Laborites to support the elections by voting, which he plans to hold next week (but until October 31). Uncertainty on this issue puts background pressure on the euro. Given the shaky and rather controversial reasons for the growth of the US currency, it can be assumed that the euro-dollar pair will completely switch to the Brexit theme tomorrow, and will essentially follow the pound. If traders again have hope for a deal before the end of this year, EUR/USD will test the resistance level 1.1190 (the upper line of the Bollinger Bands on the daily chart), which turned out to be "too tough" for the pair's bulls at the beginning of this week. The material has been provided by InstaForex Company - www.instaforex.com |
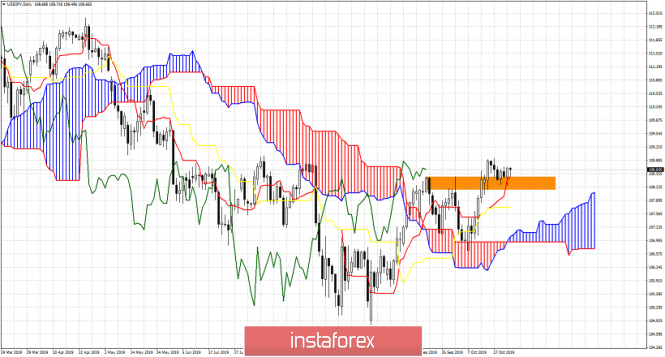
| USDJPY holds firmly above 108.50 ready for its next move higher Posted: 24 Oct 2019 01:51 PM PDT USDJPY is still above the Ichimoku cloud indicator and above both the tenkan- and kijun sen indicator. Price has broken the important resistance of 108.50 and holding above it is a positive sign.
Orange rectangle- support (previous resistance) USDJPY is trading above both the tenkan- and kijun-sen indicators. Price is also above the Kumo (cloud) and holding above 108.50 would be supportive for the short-term bullish trend. Support is at 108.50 and next at 107.70. Major trend change level is at 107.20. USDJPY is making higher highs and higher lows.Until we see a cloud breakdown we consider each pull back as a buying opportunity. The material has been provided by InstaForex Company - www.instaforex.com |
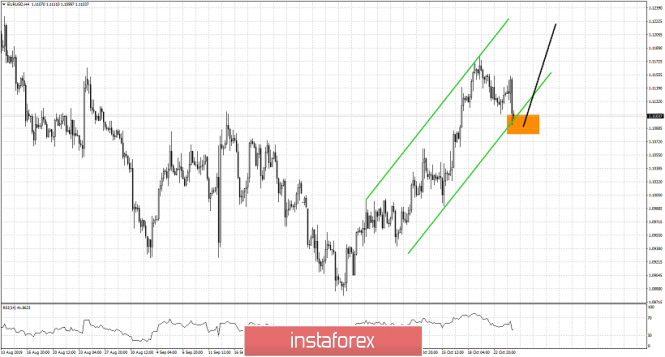
| EURUSD has many chances for an upward reversal Posted: 24 Oct 2019 01:41 PM PDT EURUSD is trading above the support area of 1.11-1.1080. A reversal from this area is highly probable. EURUSD has the potential to move towards 1.1250. What is needed for the bullish scenario to come true, is a bounce of current levels.
Green lines- bullish channel Black line -expectations Orange rectangle - support area EURUSD remains inside the bullish channel. EURUSD is approaching the important support area shown in the chart above as an orange rectangle. EURUSD has the potential to reverse its pull back to a move higher. I do not believe the entire move upwards is complete and I also believe that we should expect more upside. Breaking below 1.1080 would be a bearish sign. The material has been provided by InstaForex Company - www.instaforex.com |
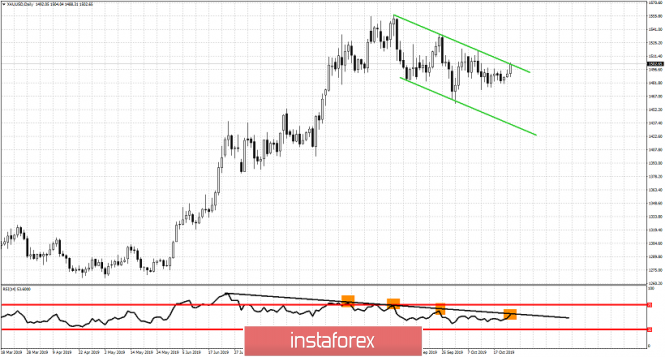
| Gold challenges major resistance and pivot area Posted: 24 Oct 2019 01:36 PM PDT Gold price is back above $1,500 and ending the week above it could turn around the short-term back to bullish. Bulls are fighting the important resistance area of $1,500-$1,505. A rejection is possible at current levels and if it happens we should expect a move towards $1,480 at least.
Black line -RSI resistance Orange rectangles - rejections Gold price is still inside the bearish channel. Trend remains bearish. Price is testing the upper channel boundary. The resistance here is very important. Support is at $1,480. A rejection at $1,500 at the end of the week would lead to a pull back towards the major short-term support at $1,480. Breaking below $1,480 will push price below $1,460. So all eyes are on $1,500 and if at the end of the week bulls will continue to have the upper hand. The material has been provided by InstaForex Company - www.instaforex.com |
| You are subscribed to email updates from Forex analysis review. To stop receiving these emails, you may unsubscribe now. | Email delivery powered by Google |
| Google, 1600 Amphitheatre Parkway, Mountain View, CA 94043, United States | |






No comments:
Post a Comment