
Forex analysis review |
- USDJPY remains inside bullish channel despite end of the week pull back
- USDCAD back tests broken long-term channel
- EURUSD reverses short-term trend as expected respecting support at 1.11-1.1070.
- Weekly Gold analysis
- November 1, 2019 : EUR/USD Intraday technical analysis and trade recommendations.
- November 1, 2019 : GBP/USD showing respect for supply-level around 1.2980. Bearish rejection is anticipated.
- BTC 11.01.2019 - Weekly analysis of BTC
- EUR/USD for November 01,2019 - Weekly analysis for EUR
- Gold 11.01.2019 - Weekly analysis of Gold
- Technical analysis of EUR/USD for November 01, 2019
- Technical analysis of ETH/USD for 01/11/2019
- Technical analysis of BTC/USD for 01/11/2019
- Technical analysis of GBP/USD for 01/11/2019
- Technical analysis of EUR/USD for 01/11/2019
- Elliott wave analysis of GBP/JPY for November 1 - 2019
- Elliott wave analysis of EUR/JPY for November 1 - 2019
- Technical analysis: Important intraday Level For EUR/USD, November 01,2019
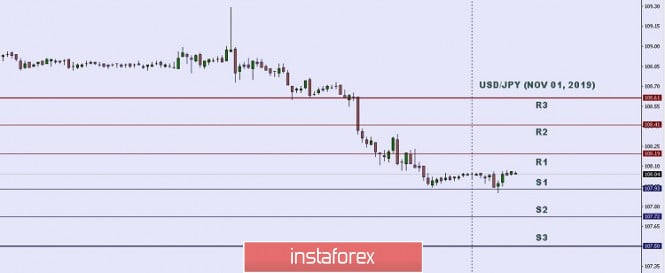
- Technical analysis: Important Intraday Levels for USD/JPY, November 01, 2019
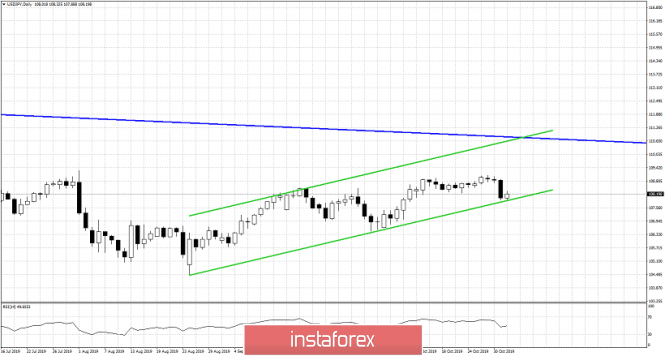
| USDJPY remains inside bullish channel despite end of the week pull back Posted: 01 Nov 2019 01:15 PM PDT USDJPY is holding above 108 respecting the medium-term bullish channel since the end of August. Price should continue higher as long as we trade above last week's lows. This is still considered as a buying opportunity and a corrective pull back inside a bullish trend.
Blue line - long-term resistance trend line USDJPY is bouncing off the lower channel boundary. Support is key at 108 area and as long as price is above we remain bullish looking for a move closer to the long-term resistance trend line at 110.50. Important resistance level that must be broken in order to push closer to 110.50 is at 109.10.
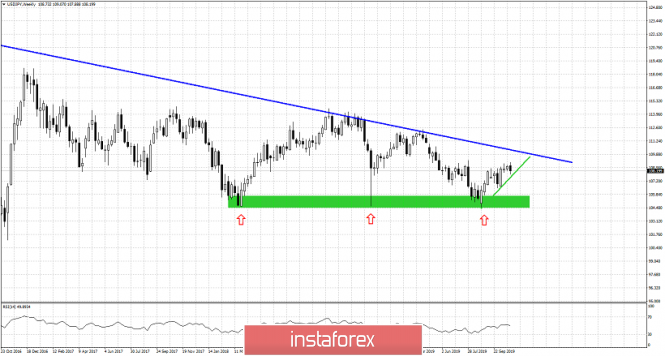
Green rectangle - major support area Green line - support trend line Red arrows - reversal points in time inside the green rectangle Blue line - long-term resistance USDJPY has formed a major low and important support area around 104. Price as expected has moved towards 108.50 since then and back at that time we were targeting the blue downward sloping trend line. We continue to see the blue trend line as the most probable target. Price continues to make higher highs and higher lows. This week's low is very important for bulls as they do not want to see a weekly close below it, in order to remain in control of the short-term trend. The material has been provided by InstaForex Company - www.instaforex.com |
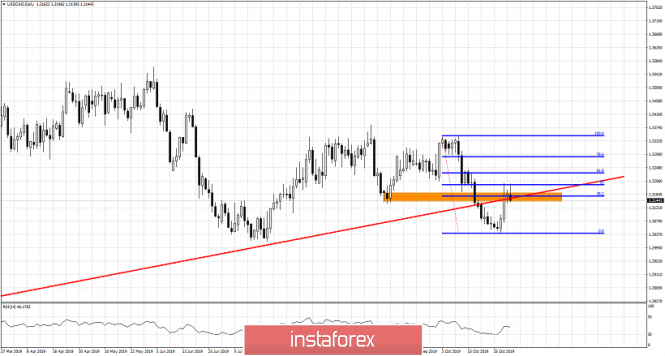
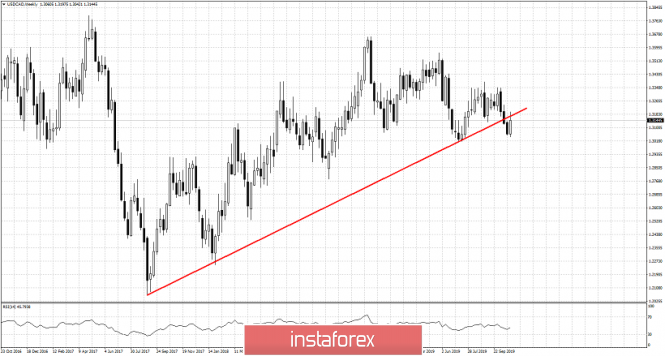
| USDCAD back tests broken long-term channel Posted: 01 Nov 2019 01:04 PM PDT USDCAD has bounced from 1.3050 to 1.3150 but I believe that most probably this is just a back test of the break down area. I expect prices to get rejected at current levels and I continue to be bearish USDCAD looking for a move below 1.30.
Orange rectangle - resistance (previous support) USDCAD has pulled back towards the broken red trend line support, now resistance. Price has also entered the orange area which was once support and now resistance. Price has retraced 50% of the last move down and now we see some signs of rejection.
The breaking below this long-term weekly trend line support is big news for USDCAD. This back test is also very important because it will clear things up. A rejection will increase the chances that the break down is real and not a fake one. Price moving below 1.3050 will also increase chances of a move towards 1.28 and lower as this is where the next major support area is found. The material has been provided by InstaForex Company - www.instaforex.com |
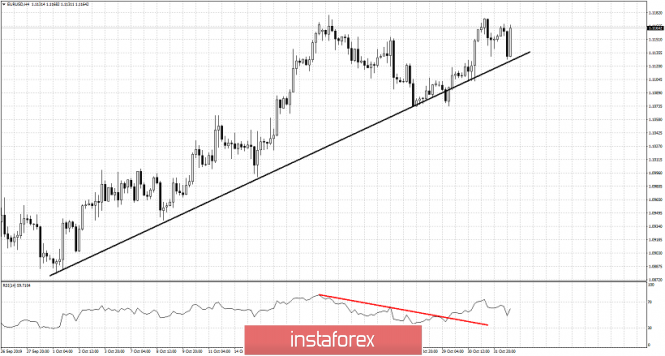
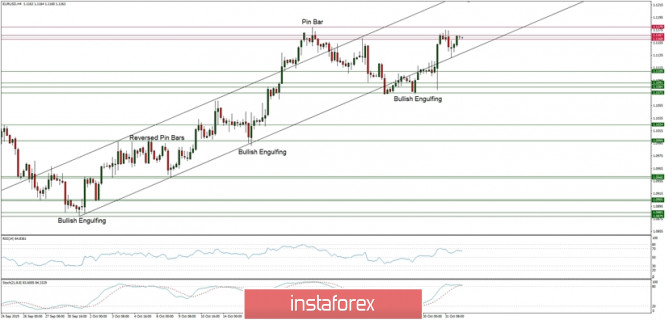
| EURUSD reverses short-term trend as expected respecting support at 1.11-1.1070. Posted: 01 Nov 2019 12:52 PM PDT EURUSD was expected to move higher from the key support of 1.1070. Price has managed to recapture 1.11 and is now trading above 1.1150. EURUSD remains inside the short-term bullish channel targeting 1.12 to 1.1250.
Red line -RSI resistance EURUSD continues to make higher highs and higher lows in the 4 hour chart. the RSI has broken its resistance trend line. We find support at 1.1130 which was short-term resistance and next at 1.1073 this week's lows.
As EURUSD continues to trade inside the bullish short-term channel we focus on the next Fibonacci resistance at 1.12 (61.8% retracement) and at 1.1250-1.1260 (upper channel boundary). As long as price is inside the channel we remain bullish. Price reversed to the upside from 1.1070 and this is where bulls should protect their profits. The material has been provided by InstaForex Company - www.instaforex.com |
| Posted: 01 Nov 2019 12:44 PM PDT Gold price started the week on a negative note reaching $1,483 but reversing its trend and recapturing the key pivot level of $1,500. Gold price has been moving around $1,500 since late July but so far it has not managed to break out of the $1,530-$1,480 trading range.
The weekly chart shows how price is supported each time it moves below $1,500. This time we might also have a new weekly high relative to the past 4 weekly closing prices. This could be a positive signal for the next couple of weeks and a rally to $1,600 could be seen. Key support remains at $1,500-$1,490. The material has been provided by InstaForex Company - www.instaforex.com |
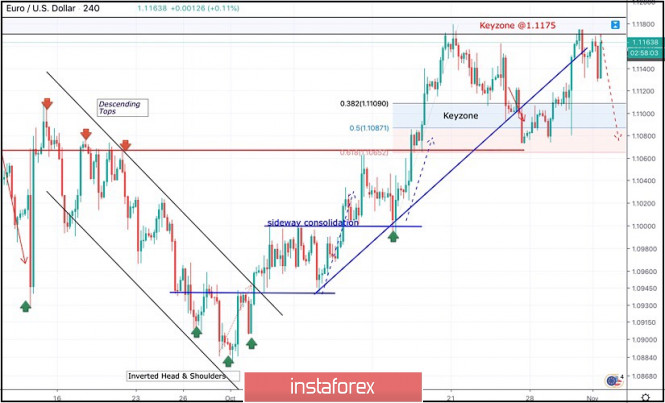
| November 1, 2019 : EUR/USD Intraday technical analysis and trade recommendations. Posted: 01 Nov 2019 07:17 AM PDT
Since September 13, the EUR/USD has been trending-down within the previous short-term bearish channel until an Inverted Head & Shoulders Pattern was demonstrated around 1.0880. Shortly After, a bullish breakout above 1.0940 confirmed the mentioned reversal Pattern which opened the way for further bullish advancement towards (1.1000 -1.1020) maintaining bullish movement above the recent bullish trend. On October 7, a sideway consolidation range was demonstrated around the price zone of (1.1000 -1.1020) before another bullish swing could be initiated towards 1.1175 where the previous bearish movement was recently originated. Earlier this week, the short-term technical outlook has temporarily turned into bearish after breakdown below 1.1090 was achieved (the depicted uptrend line and 50% Fibonacci Retracement Level). However, recent bullish spikes have been demonstrated above (1.1090 - 1.1100) advancing towards 1.1175. Thus, hindering further bearish decline. Intraday destination remains unclear until bearish breakout below 1.1090 is re-established again. On the other hand, the current price zone around 1.1175 - 1.1190 should be watched for early bearish rejection and a possible Intraday SELL entry. Hence, a Double-Top pattern may be in progress with neckline located around 1.1070. Bearish Projection target would be located around 1.1000. Quick bearish decline should be expected towards 1.1025 and 1.0995 provided that early bearish breakout below 1.1090-1.1070 is re-established again. The material has been provided by InstaForex Company - www.instaforex.com |
| Posted: 01 Nov 2019 07:12 AM PDT
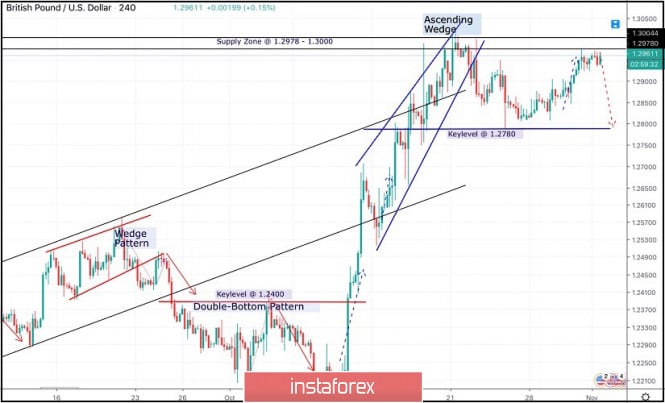
Few weeks ago, the neckline of the depicted Double-Bottom pattern (1.2400-1.2415) was breached to the upside allowing further bullish advancement to occur towards 1.2800 then 1.3000 where the GBP/USD pair looked OVERBOUGHT. Shortly After, the GBP/USD pair has failed to achieve a persistent bullish breakout above the depicted SUPPLY-zone (1.2980-1.3000) which corresponds to a previous Prominent-TOP that goes back to May 2019. Moreover, the depicted ascending wedge reversal pattern has been confirmed indicating a high probability of bearish reversal around the price levels of 1.2950-1.2970. That's why, a quick bearish movement was initiated towards 1.2780 (Key-Level) where the current bullish recovery was recently initiated. The recent Bullish rejection around the price levels of 1.2780, indicated another temporary bullish movement towards 1.2980-1.3000 where another long-term bearish swing can be initiated. On the other hand, quick bearish breakout below 1.2780 should be achieved to enable further bearish decline towards 1.2600-1.2650 where some bullish recovery should be anticipated. Please note that bullish breakout above 1.3000 invalidates the mentioned bearish outlook temporarily until re-closure below 1.2970 is established again Trade Recommendations: Risky traders were advised to have a valid BUY entry around 1.2780 which is running in profits now. S/L should be advanced to 1.2880 to secure more profits. On the other hand, Intraday traders can look for bearish rejection around 1.2980-1.3000 as a valid SELL signal with T/P levels projected towards 1.2780 and 1.2650. The material has been provided by InstaForex Company - www.instaforex.com |
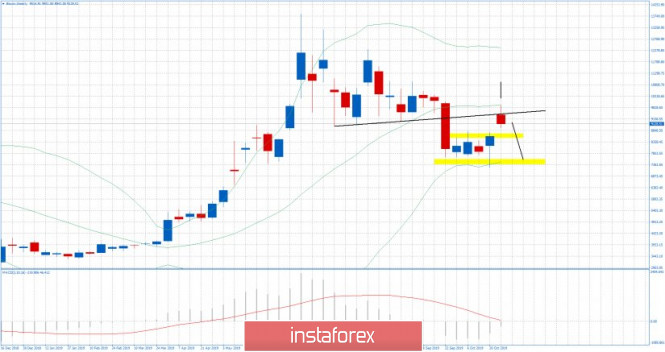
| BTC 11.01.2019 - Weekly analysis of BTC Posted: 01 Nov 2019 07:06 AM PDT Bitcoin price did perfect test and reject of the middle Bollinger band line (20 SMA) at the level of $9.900. There is chance for further downside in case of the gap fill.
Green lines – Bollinger bands Black line – Support became resistance This week BTC increased all the way up to $9.900 level but it found resistance there. I would pay attention to potential gap fill into the area $8.800. If the price fill the gap from current week, there is a chance for test of the support cluster at $7.700. For the buying opportunities you can watch potential breakout of the $9.900 to confirm test of $10.500 For the selling opportunities you would need the BTC to fill the gap zone and confirm further downside movement. Middle Bollinger line is set at $9.400 (arcing like resistance) The material has been provided by InstaForex Company - www.instaforex.com |
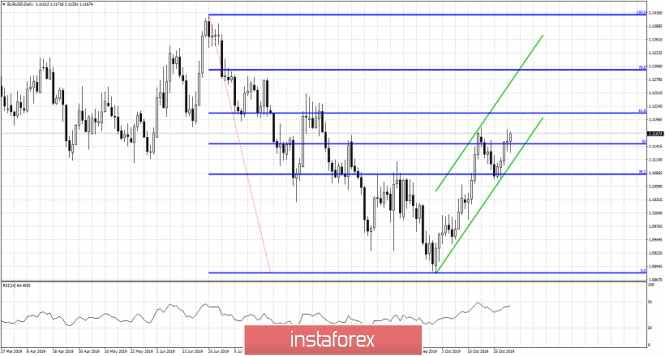
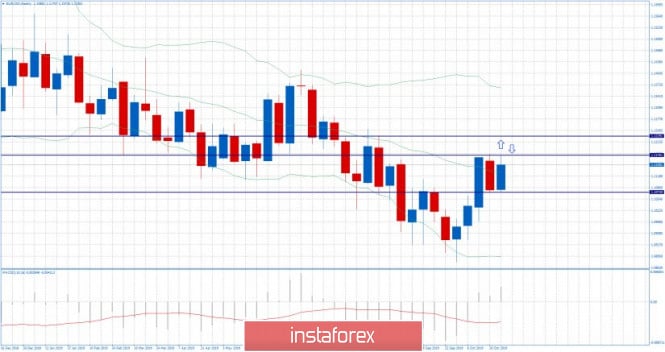
| EUR/USD for November 01,2019 - Weekly analysis for EUR Posted: 01 Nov 2019 06:56 AM PDT EUR price is still trading inside of the 2- week trading range between the price of 1.1176 (top of the range) and 1.1073 (bottom of the range).Most recently, EUR did test and reject of the resistance at 1.1176.
Horizontal lines – Important pivot levels Last week left us almost inside week relative to 2-weeks ago and seems like this week will close inside of the previous week range. This is signal that market is waiting for new information from outside and that EUR is in the contracting regime. For the buying opportunities you can watch potential breakout of the 1.1180 to confirm test of 1.1229. For the selling opportunities you can watch potential rejection of the resistance and test of bracket low at 1.1073. Middle Bollinger line is set at 1.1133 Trading recommendation: Watch for potential breakout or rejection of the multi-week bracketing zone to confirm further direction. The material has been provided by InstaForex Company - www.instaforex.com |
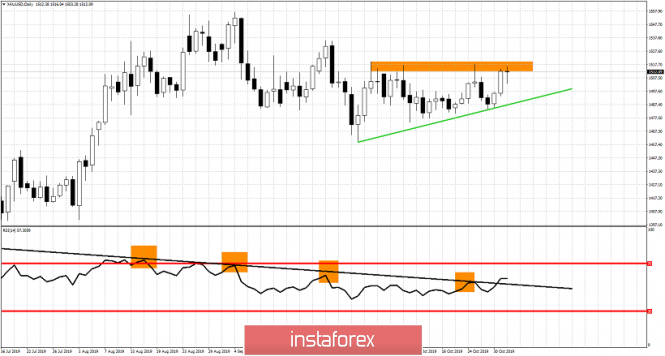
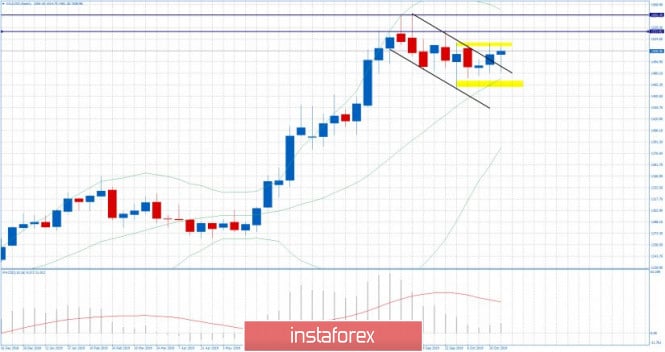
| Gold 11.01.2019 - Weekly analysis of Gold Posted: 01 Nov 2019 06:44 AM PDT Gold price is still trading inside of the multi week trading range between the price of $1.518 (top of the range) and $1.461 (bottom of the range).
Yellow rectangles – trading range boundaries Falling purple lines – Broken downward channel Horizontal lines – Resistance levels Last week I found the breakout of the downward channel (bull flag) and potential for new upward wave. Anyway, to confirm potential upside continuation on the weekly chart, I would like to see the breakout of resistance at $1.518, which will eventually lead for test of $1.533 or $1.555. Eventual rejection of the resistance may lead the gold for rotation back into the support zone of the well defined bracket at the price of $1.475. Middle Bollinger line is set at $1.472 and it is acting like good support zone. Trading recommendation: Watch for potential breakout of the multi-week bracketing zone. The material has been provided by InstaForex Company - www.instaforex.com |
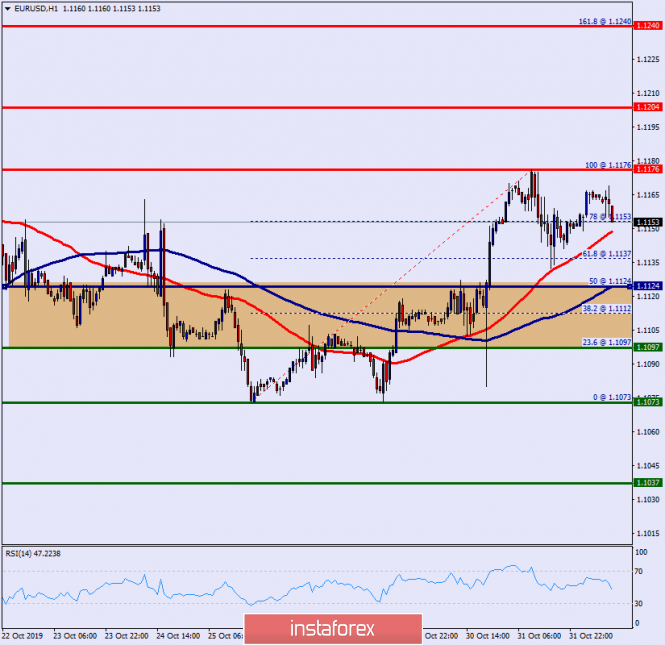
| Technical analysis of EUR/USD for November 01, 2019 Posted: 01 Nov 2019 02:39 AM PDT Overview: The EUR/USD pair climbed from 1.1124 to 1.1176 and closed at the price of 1.1154. But, this week we note that the market opens below the level of 1.1124. Please, note that the resistance stands at the levels of 1.1176 and 1.1204 in the H1 time frame. In the longer term, the strong resistance at 1.1124 (18/10/2019 high, see also the long-term declining trendline from the October 2019 peak) continues to represent a major hurdle. Therefore, right now the first descending impulse is forming the first one; the market is being corrected from the area of 1.1470/1.1350 this week. In our opinion, the EUR/USD pair may grow up to test 1.1176 from below and then form the second descending impulse with a target at 1.1124 to test the daily pivot. Today, if the trend is able to close below the level of 1.1176, the price will fall into the bearish market in order to go further towards the strong support at 1.1124, 1.1097 and 1.1073 to test them again. Furthermore, the level of 1.1073 will form a double bottom which represents the major support level this week. In the the daily time frame, the pair will probably go down because a downward trend is still strong and the RSI indicator is still signaling that the trend is downward. Conclusion The depicted resistance level of 1.1176 acted as an important key level offering a valid sell entry. So, sell below the 1.1176 level with the targets of 1.1124, 1.1097 and 1.1073 in coming hours. Conversely, stop loss should be placed above the high reached near the second resistance (1.1240). The material has been provided by InstaForex Company - www.instaforex.com |
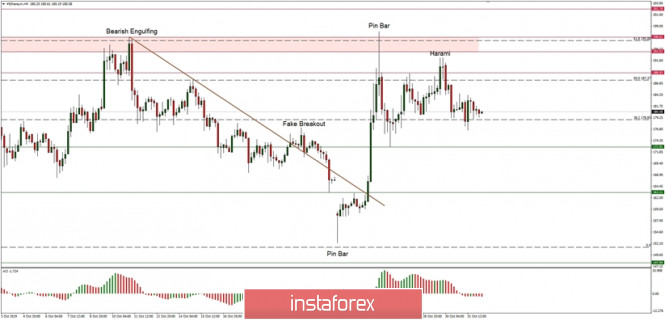
| Technical analysis of ETH/USD for 01/11/2019 Posted: 01 Nov 2019 12:27 AM PDT Crypto Industry News: The leading cryptocurrency exchange Binance has quietly started trading the Russian ruble today, allowing users to deposit and withdraw in this currency. Less than two weeks after Binance's plans to start trading fiat currencies from the Russian ruble, CEO of Binance Changpeng Zhao (CZ) revealed that ruble trading is now available. Zhao noticed that the premiere of the Russian ruble was quietly released and stated that Russia is one of Binance's largest exchange markets. CZ for the first time announced the start of trading ruble at the Russian Government-sponsored event, Open Innovations Forum in Moscow, October 21. Binance said then that the launch would take place in about two weeks. In another interview with Forklog, the Russian-language cryptographic magazine, CEO of Binance revealed that Russia is one of the top 10 markets on Binance. When asked about the number of users from Russia, CZ suggested that the quantity is significant, saying: "Russia is definitely in the top ten. Our user base is very similar to the geographical distribution of Bitcoin owners," he said. According to a recent Forklog survey, Binance is the most popular cryptocurrency exchange in Russia, Ukraine and Belarus, and almost 60% of respondents say they prefer Binance over other global cryptocurrency exchanges. Asked what could be the reason for such a high level of popularity in these regions, CZ said that Binance is trying to meet demand by tailoring its products to the local language. Technical Market Overview: the ETH/USD pair keeps trading in the lower part of the trading range after a Harami candlestick pattern was made around the level of $193.00. So far all the bullish attempts to rally were stopped by bears and the price of ETH/USD was making new local lows. The market has entered a corrective cycle with a low made at the level of $172.91, but as long as ETH/USD trades above the level of $163.11 there is still a chance for another impulsive wave up. The nearest technical resistance is seen at the level of $193.52 and the nearest technical support is seen at the level of $179.94. The key technical support is located at the level of $172.91. Weekly Pivot Points: WR3 - $249.74 WR2 - $225.62 WR1 - $207.85 Weekly Pivot - $177.85 WS1 - $161.54 WS2 - $131.99 WS3 - $115.01 Trading Recommendations: The best strategy in the current market conditions is to trade with the larger timeframe trend, which is still up. All the shorter timeframe moves are still being treated as a counter-trend correction inside of the uptrend. When the wave 2 corrective cycles are completed, the market might will ready for another impulsive wave up of a higher degree and uptrend continuation.
|
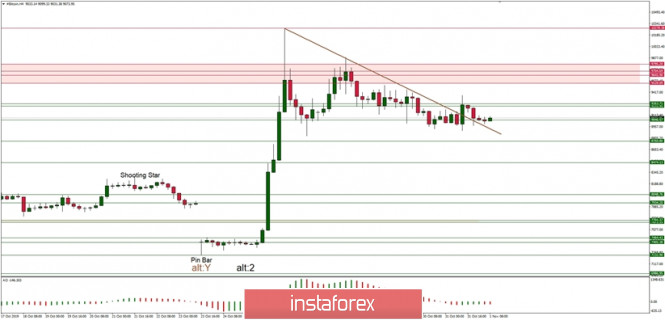
| Technical analysis of BTC/USD for 01/11/2019 Posted: 01 Nov 2019 12:21 AM PDT Crypto Industry News: The Malta Financial Services Authority (MFSA) warns the public that the entity named "Bitcoin Future" appears to exhibit "the same deceptive features" as a separate fraud called "Bitcoin Revolution", for which two public warnings have already been issued this year. The statement noted that such fraudulent operations seem to constantly appear on the Internet as advertisements, changing their names to avoid detection. Deceptive ads distribute false passwords, such as "A Way to Build a Better Life" and "A Unique Opportunity for Maltese People," notes MSFA, pointing readers to specific URLs where these fake ads currently appear. The supervisor characterizes the culture and strategies of these exploits, noting that: "Bitcoin Future promotes itself through fake press articles that use images of local personalities and images of local government institutions. Fake articles are advertised on various social media platforms and falsely claim to be associated with these people." As part of the correction, MSFA explains that Bitcoin Future is not a company registered in Malta, is not authorized to provide financial services to or from the country and is not an entity operating - as it claims - under transitional provisions within the meaning of Art. 62 of the Malta Act on Virtual Financial Assets. In summary, the regulator claims that Bitcoin Future appears to be an international "get rich quick" scam and asks the public not to engage in business or transactions with the entity in any of the forms it specifies. The notification includes a link to the official list of financial service providers that are currently licensed by MFSA, as well as guidelines for detecting fraud and a contact point for fraud warnings and victims. Technical Market Overview: The BTC/USD bulls had broke through the short-term trendline resistance and now are testing the breakout from below. The zone from $9,645 to $10,278 is still a sell zone, where most of the sell orders have entered the market. The immediate support is seen at the level of $8,925. The bearish pressure intensifies and the next target for bears is seen at the level of $8,760 or even $8,474 before a new wave up will be made. Weekly Pivot Points: WR3 - $14,033 WR2 - $12,095 WR1 - $10,995 Weekly Pivot - $9,057 WS1 - $8,029 WS2 - $6,062 WS3 - $4,932 Trading Recommendations: Due to the short-term impulsive scenario invalidation, the best strategy in the current market conditions is to trade with the larger timeframe trend, which is still up. All the shorter timeframe moves are still being treated as a counter-trend correction inside of the uptrend. When the wave 2 corrective cycles are completed, the market might will ready for another impulsive wave up of a higher degree and uptrend continuation.
|
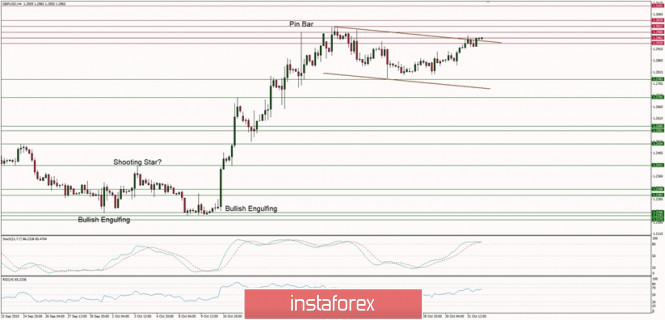
| Technical analysis of GBP/USD for 01/11/2019 Posted: 01 Nov 2019 12:16 AM PDT Technical Market Overview: The GBP/USD pair is trying to break out from a narrow horizontal range located between the levels of 1.2783 - 1.2939 as bulls tries to test the upper boundary of the Flag pattern around the level of 1.2962. The market participants await a breakout in any direction, but on the other hand, the market might be making the Bullish Flag or Pennant pattern as well. The key technical support is still located at the level of 1.2561. The larger timeframe trend remains bearish. Weekly Pivot Points: WR3 - 1.3149 WR2 - 1.3068 WR1 - 1.2923 Weekly Pivot - 1.2842 WS1 - 1.2710 WS2 - 1.2624 WS3 - 1.2478 Trading Recommendations: The best strategy for current market conditions is to trade with the larger timeframe trend, which is down. All upward moves will be treated as local corrections in the downtrend. In order to reverse the trend from down to up, the key level for bulls is seen at 1.3000 and it must be clearly violated. The key long-term technical support is seen at the level of 1.2231 - 1.2224 and the key long-term technical resistance is located at the level of 1.3509. As long as the price is trading below this level, the downtrend continues towards the level of 1.1957 and below.
|
| Technical analysis of EUR/USD for 01/11/2019 Posted: 01 Nov 2019 12:08 AM PDT Technical Market Overview: The EUR/USD pair has tested the lower line of the ascending channel and currently, bulls are preparing to test the technical resistance located at the level of 1.1179. Despite the overbought market conditions the momentum is now clearly strong and positive, so there is still a chance for another leg up and even the breakout. The next target for bulls is seen at the level of 1.1232 and the nearest technical support is seen at the level of 1.1121. Weekly Pivot Points: WR3 - 1.1242 WR2 - 1.1207 WR1 - 1.1134 Weekly Pivot - 1.1103 WS1 - 1.1028 WS2 - 1.0992 WS3 - 1.0922 Trading Recommendations: The best strategy for current market conditions is to trade with the larger timeframe trend, which is down. All upward moves will be treated as local corrections in the downtrend. The downtrend is valid as long as it is terminated or the level of 1.1445 clearly violated. There is an Ending Diagonal price pattern visible on the larget timeframes that indicate a possible downtrend termination soon. The key short-term levels are technical support at the level of 1.0999 and the technical resistance at the level of 1.1267.
|
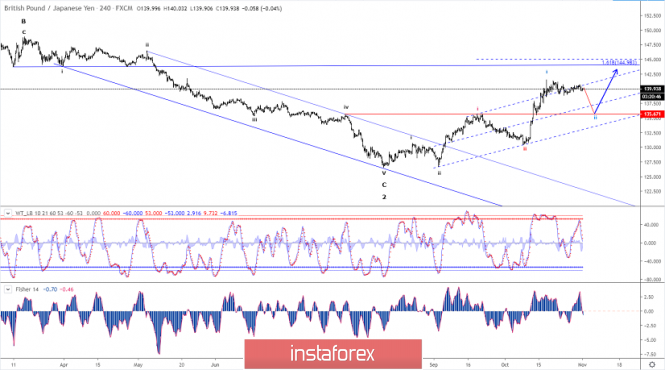
| Elliott wave analysis of GBP/JPY for November 1 - 2019 Posted: 31 Oct 2019 10:52 PM PDT
Short-term key resistance at 140.74 has been capped. We continue to look for support at 138.64 and a break below here will lead to a decline to a minimum 137.74 and possibly even closer to our ideal corrective target at 135.67 from where a new rally towards 144.98 is expected. A direct break above short-term key resistance at 140.74 will indicate completion of the correction and a direct rally towards 144.98. R3: 141.15 R2: 141.12 R1: 140.74 Pivot: 140.21 S1: 139.74 R2: 139.26 R1: 139.07 Trading recommendation: We will buy 50% GBP at 137.85 and 50% at 135.75 or we will buy 100% upon a break above 140.74 The material has been provided by InstaForex Company - www.instaforex.com |
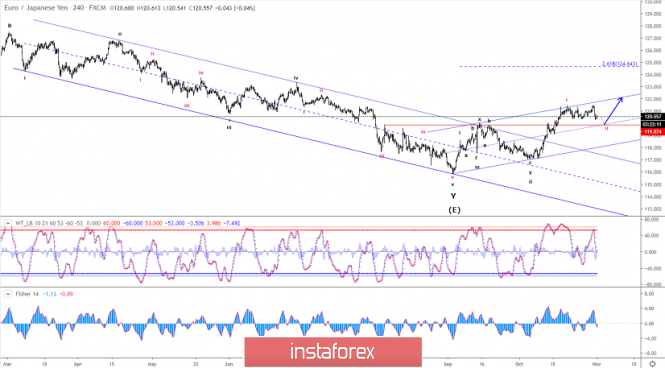
| Elliott wave analysis of EUR/JPY for November 1 - 2019 Posted: 31 Oct 2019 10:46 PM PDT
Resistance at 121.48 capped the upside and pushed EUR/JPY back below short-term key support at 120.55 indicating that red wave ii still was in motion. This means a dip towards our ideal corrective target at 119.87 is still possible before a new rally towards 124.64 should be expected. R3: 121.48 R2: 121.15 R1: 120.83 Pivot: 120.26 S1: 120.00 S2: 119.87 S3: 119.71 Trading recommendation: WE are long EUR from 117.25 and we will drop our stop back to 119.00. If you are not long EUR yet, then buy near 120.00 and use the same stop at 119.00 The material has been provided by InstaForex Company - www.instaforex.com |
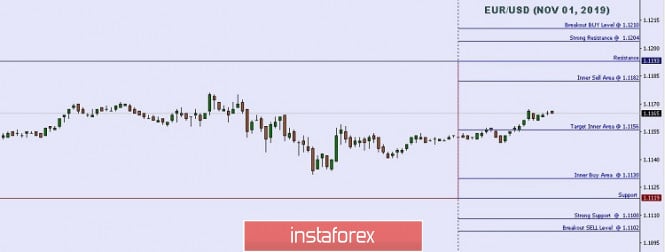
| Technical analysis: Important intraday Level For EUR/USD, November 01,2019 Posted: 31 Oct 2019 08:26 PM PDT
|
| Technical analysis: Important Intraday Levels for USD/JPY, November 01, 2019 Posted: 31 Oct 2019 08:23 PM PDT
|
| You are subscribed to email updates from Forex analysis review. To stop receiving these emails, you may unsubscribe now. | Email delivery powered by Google |
| Google, 1600 Amphitheatre Parkway, Mountain View, CA 94043, United States | |
No comments:
Post a Comment