
Forex analysis review |
- Forecast for EUR/USD on November 29, 2019
- Forecast for GBP/USD on November 29, 2019
- Forecast for USD/JPY on November 29, 2019
- GBP/USD approaching support, potential bounce!
- Drop expected on AUD/USD
- USD/JPY to drop from 1st resistance, potential drop!
- Fractal analysis of the main currency pairs on November 29
- #USDX vs AUD/USD vs USD/CAD vs NZD/USD - H4. Comprehensive analysis of movement options for November 29, 2019. APLs &
- What can we expect from Thanksgiving?
- Why didn't the oil go upwards? Volume analysis for oil
- Evening review 11/28/2019 EURUSD
- Euro is tired and the dollar hour has come
- GBP/USD: YouGov gave pound the hope for Conservatives to form a majority government
- How can the German consumer price index affect EUR/USD?
- GBPUSD and EURUSD: Eurozone household lending has shown growth. The pound's euphoria is over after regular polls
- Euro: wait and believe
- The game for a fall: it is difficult for the Australian dollar to grow
- EUR/USD. November 28. Results of the day. Germany's consumer price index has failed. China protests to the United States
- EUR/USD: an alarm from Germany and the Hong Kong factor
- GBP/USD. November 28. Results of the day. According to the global opinion poll, the Conservative Party will win the election
- Has BTCUSD bottomed?
- EUR/USD for November 28,2019 - Ichimoku analysis
- Gold 11.28.2019 - Intraday selll entry with confirmation of the longer frame chart
- BTC 11.28.2019 - End of the upward correction and bear cross on intraday Ichimoku
- EUR / USD on November 28: Revelations of Donald Tusk and optimism of Christine Lagarde
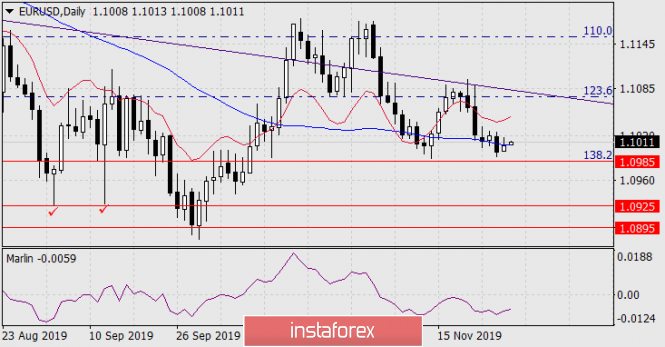
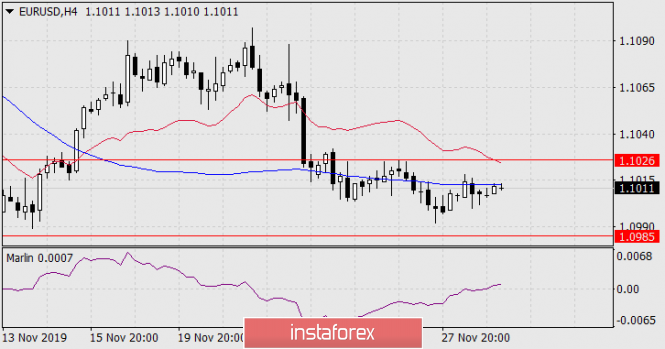
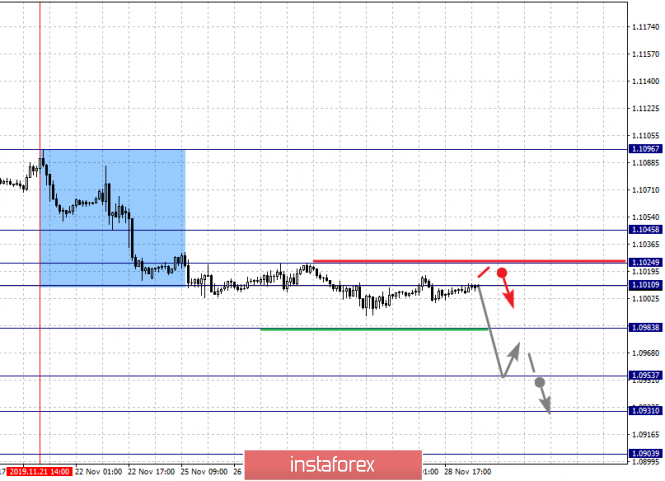
| Forecast for EUR/USD on November 29, 2019 Posted: 28 Nov 2019 07:09 PM PST EUR/USD Forex experienced reduced volatility in the thin market yesterday, due to the holiday in the US. Euro trading volumes were the smallest since August. The price was trading on the MACD line on the daily chart. The Marlin oscillator has slightly increased, but is in the negative trend zone On the four-hour chart, the price also developed below the MACD indicator line, but the signal line of the Marlin oscillator managed to infiltrate the growth zone. However, it's still not deep, the line will easily return with the (expected) price fall. During periods of consolidation, especially when the MACD line itself is located horizontally, the price can be wound on it as an axis without deviation far from it. Therefore, the consolidation range defined in yesterday's review at 1.0985-1.1026 remains today. The United States has a shorter working day today, so we do not expect the price to go out of the range today. The material has been provided by InstaForex Company - www.instaforex.com |
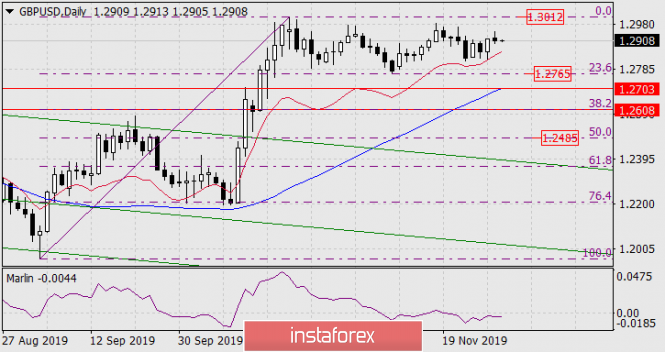
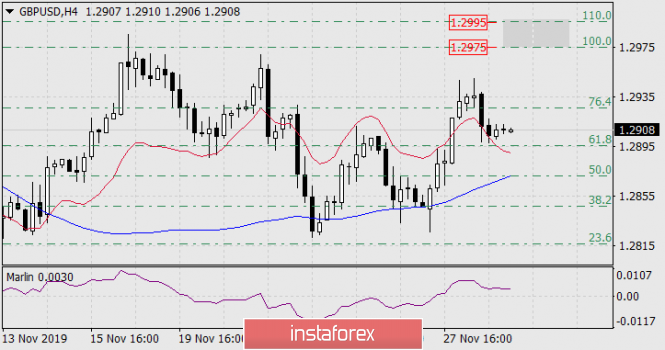
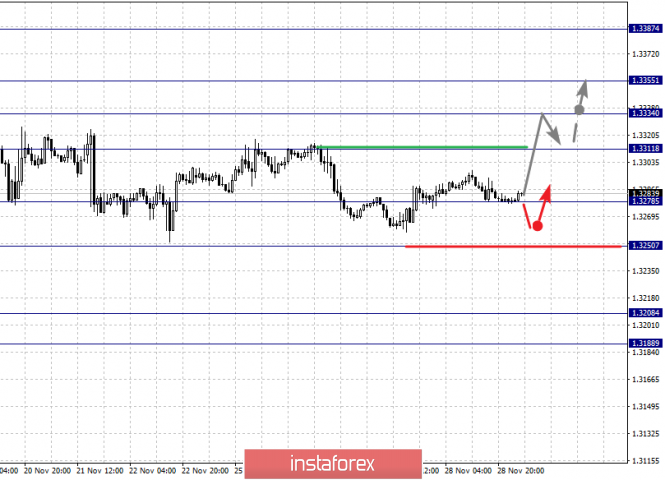
| Forecast for GBP/USD on November 29, 2019 Posted: 28 Nov 2019 07:01 PM PST GBP/USD The British pound slightly fell (by 11 points) amid the general calm background that was on the market yesterday, where it found support for a lower time frame. The signal line of the Marlin oscillator moves horizontally below the boundary with the growth territory, this increases its sensitivity to price changes, that is, the oscillator loses its leading function. The general trend continues to grow, the MACD line moves straight up. Target level at 1.3012 is becoming more tangible. The receipt of a powerful positive from the fundamental component can extend the growth to the price channel line in the region of 1.3144. On the four-hour chart, yesterday, the price found support at the Fibonacci level of 61.8% and on the balance indicator line. The Marlin signal line in the growth zone. We look forward to an attempt for the price to grow to the target range of 1.2975/95, given the Fibonacci levels of 100.0% and 110.0%. From this range, a price reversal is possible and the 1.3012 target will not be achieved. Unless, of course, the next "excellent" Brexit news (which are essentially ordinary, but speculators make a big deal out of them) doesn't interfere. The material has been provided by InstaForex Company - www.instaforex.com |
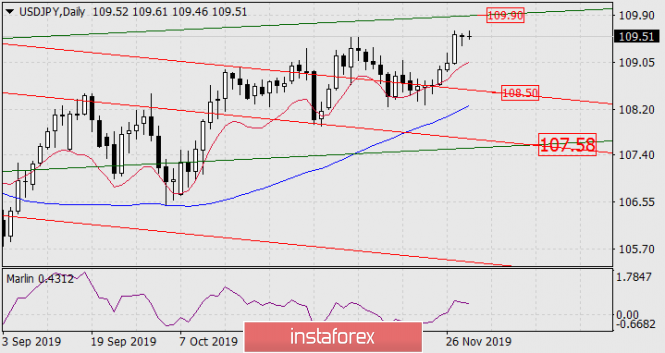
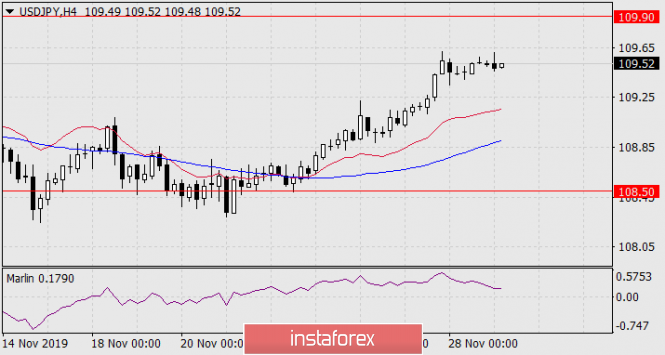
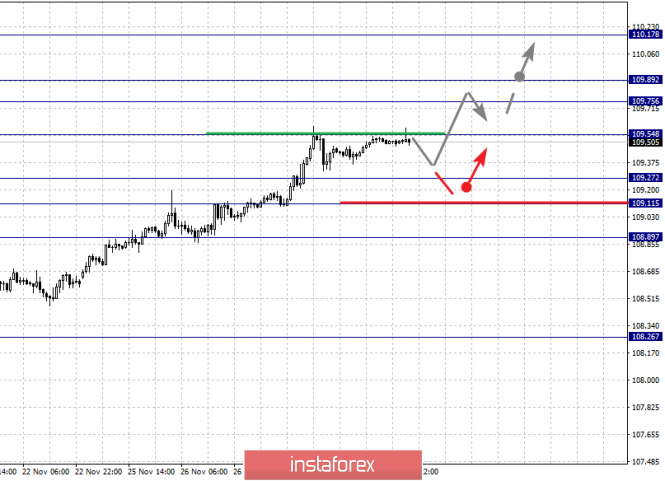
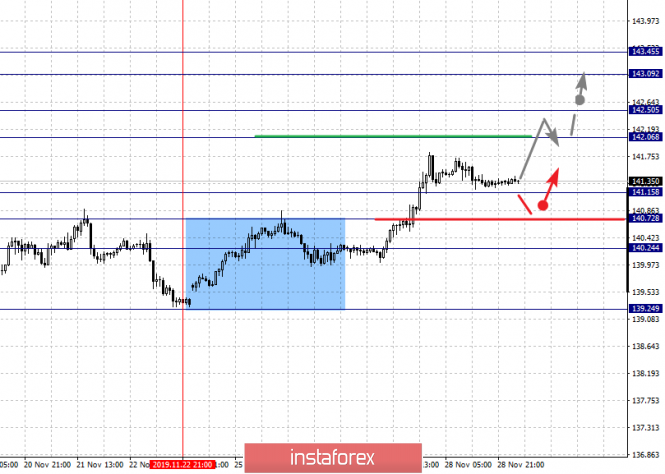
| Forecast for USD/JPY on November 29, 2019 Posted: 28 Nov 2019 06:54 PM PST USD/JPY The US/DJPY pair is trying its best to grow, but it is hindered by political events in China and the unstable situation in the stock market. Major Asian indices are trading just below zero, Hong Kong's Hang Seng is knocked out of this series, losing 1.61% due to US pressure to pass its own Human Rights and Democracy Act in Hong Kong. There is not much left until the target level of 109.90 - to the line of the green ascending price channel. Upon reaching the level, a decisive reduction in prices is possible, here the first goal will be to support the red price channel around 108.50. The MACD line is also striving for the same mark on the daily chart. With overcoming the first goal, the second opens - the intersection point of two lines of price channels - 107.58. On a four-hour chart, the price is above the indicator lines of balance and MACD, the line of the Marlin oscillator is falling, which may be preparation for the formation of divergence in case of price growth. Wait for the development of events - purchases, as well as sales from current levels, carry the same risks. |
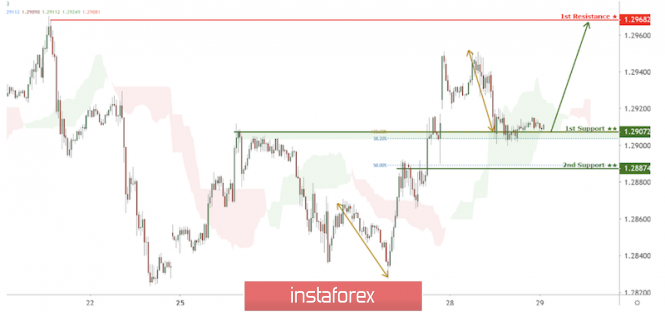
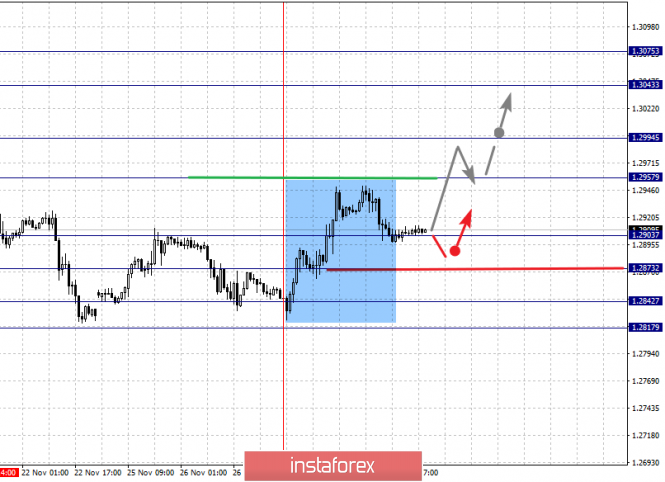
| GBP/USD approaching support, potential bounce! Posted: 28 Nov 2019 06:35 PM PST Price is approaching our first support at 1.29072 where we are expecting a bounce to our first resistance level at 1.29682 Entry: 1.29682 100% Fibonacci extension, 38.2% Fibonacci retracement, horizontal overlap support Take Profit : 1.29682 Why it's good : horizontal swing high resistance
|
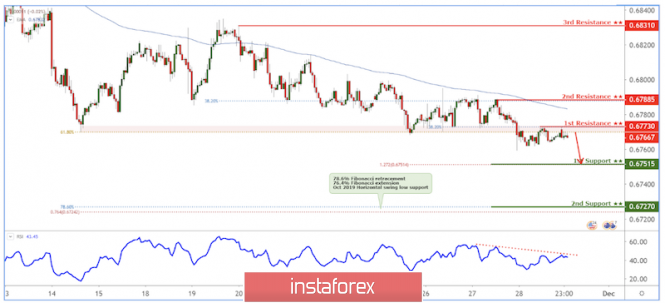
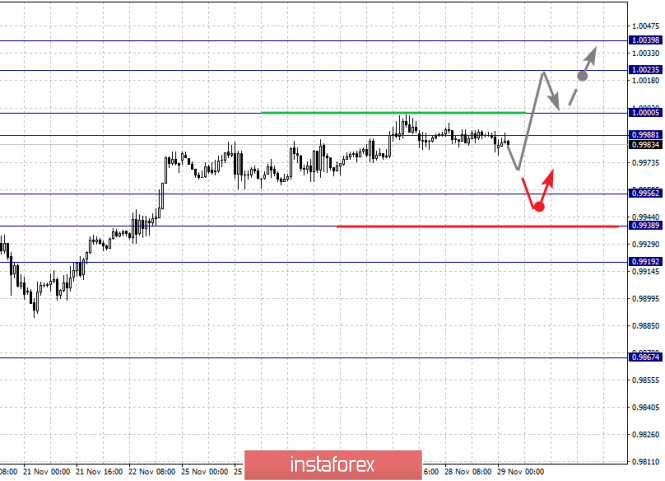
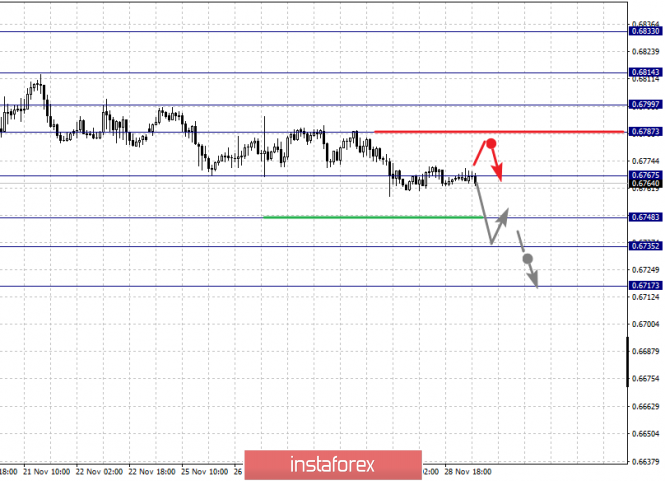
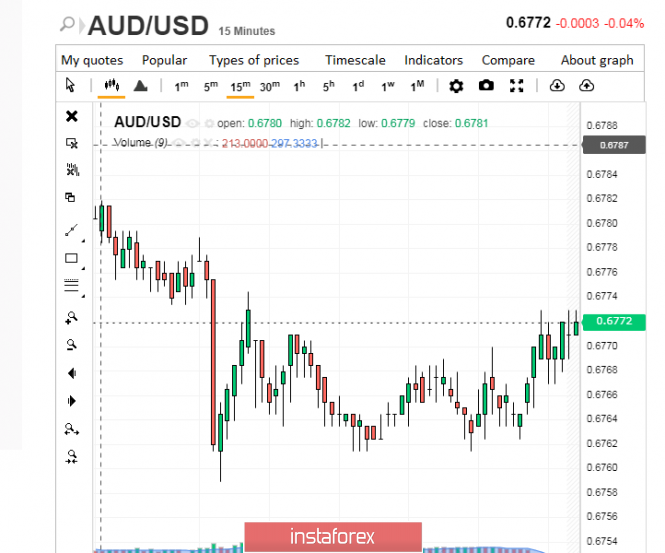
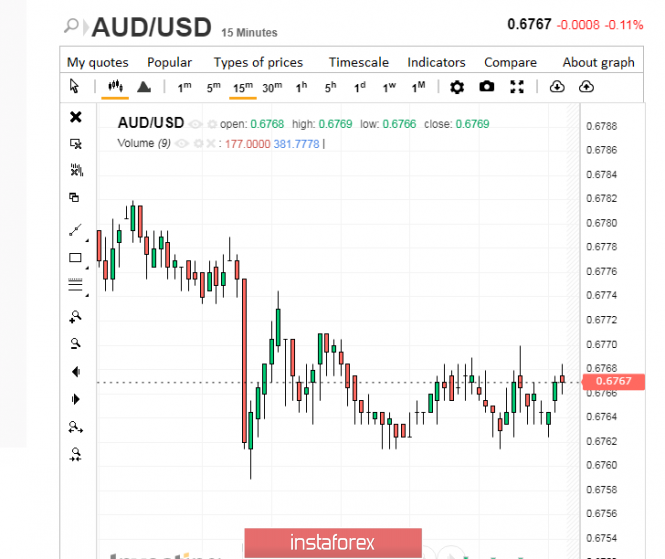
| Posted: 28 Nov 2019 06:34 PM PST AUDUSD to drop below resistance at 0.67730 Entry: 0.67730 61.8% Fibonacci Retracement Take Profit : 0.67515 Why it's good : 127.20% Fibonacci Extension
|
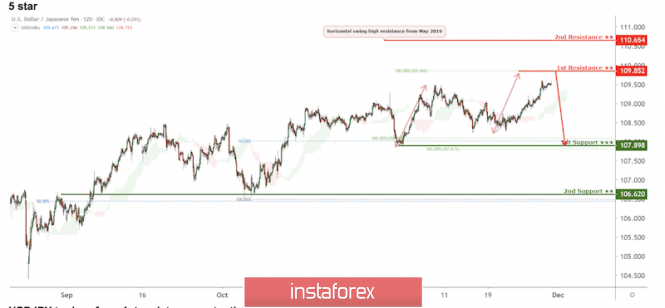
| USD/JPY to drop from 1st resistance, potential drop! Posted: 28 Nov 2019 06:32 PM PST Entry: 109.85 Why it's good: Horizontal swing high resistance 100% Fibonacci extension Take Profit : 107.898 Why it's good : 100% Fibonacci extension Horizontal swing low support 50% Fibonacci retracement
|
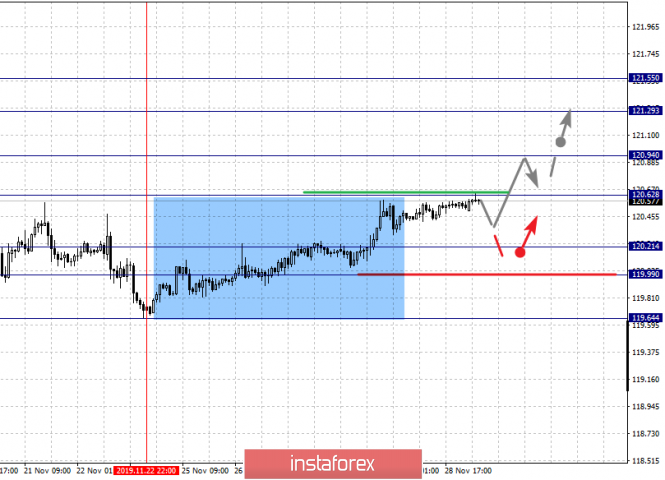
| Fractal analysis of the main currency pairs on November 29 Posted: 28 Nov 2019 05:38 PM PST Forecast for November 29: Analytical review of currency pairs on the scale of H1: For the euro / dollar pair, the key levels on the H1 scale are: 1.1045, 1.1024, 1.1010, 1.0983, 1.0953 and 1.0931. Here, we continue to monitor the development of the downward structure of November 21. The continuation of the movement to the bottom is expected after the breakdown of the level of 1.0983. In this case, the target is 1.0953. Price consolidation is near this level. For the potential value for the bottom, we consider the level of 1.0931. Upon reaching this value, we expect a rollback to the top. Short-term upward movement is expected in the range 1.1010 - 1.1024. The breakdown of the last value will lead to an in-depth correction. Here, the goal is 1.1045. This level is a key support for the downward structure. The main trend is the downward structure of November 21 Trading recommendations: Buy: 1.1010 Take profit: 1.1022 Buy: 1.1025 Take profit: 1.1045 Sell: 1.0983 Take profit: 1.0955 Sell: 1.0951 Take profit: 1.0931 For the pound / dollar pair, the key levels on the H1 scale are: 1.3075, 1.3043, 1.2994, 1.2957, 1.2903, 1.2873, 1.2842 and 1.2817. Here, we are following the formation of the initial conditions for the upward cycle of November 27. The continuation of the movement to the top is expected after the breakdown of the level of 1.2957. In this case, the target is 1.2994. Price consolidation is near this level. The breakdown of the level of 1.2995 should be accompanied by a pronounced upward movement. Here, the target is 1.3043. For the potential value for the top, we consider the level of 1.3075. Upon reaching this level, we expect consolidation, as well as a pullback to the bottom. Short-term downward movement is possibly in the range of 1.2903 - 1.2873. The breakdown of the latter value will lead to an in-depth correction. Here, the target is 1.2842. This level is a key support for the top. The main trend is the formation of the ascending structure of November 27 Trading recommendations: Buy: 1.2957 Take profit: 1.2992 Buy: 1.2996 Take profit: 1.3043 Sell: 1.2903 Take profit: 1.2875 Sell: 1.2870 Take profit: 1.2844 For the dollar / franc pair, the key levels on the H1 scale are: 1.0039, 1.0023, 1.0000, 0.9988, 0.9956, 0.9938 and 0.9919. Here, we are following the development of the ascending structure of November 18. Short-term upward movement is expected in the range 0.9988 - 1.0000. The breakdown of the last value will lead to a pronounced movement. Here, the target is 1.0023. We consider the level of 1.0039 to be a potential value for the top; upon reaching this level, we expect a pullback to the bottom. Short-term downward movement is possibly in the range of 0.9956 - 0.9938. The breakdown of the last value will lead to an in-depth correction. Here, the target is 0.9919. The main trend is the upward structure of November 18 Trading recommendations: Buy : 0.9988 Take profit: 1.0000 Buy : 1.0003 Take profit: 1.0023 Sell: 0.9956 Take profit: 0.9940 Sell: 0.9937 Take profit: 0.9920 For the dollar / yen pair, the key levels on the scale are : 110.17, 109.89, 109.75, 109.54, 109.27, 109.11 and 108.89. Here, we are following the development of the ascending structure of November 21. The continuation of the movement to the top is expected after the breakdown of the level of 109.54. In this case, the target is 109.75. Short-term upward movement, as well as consolidation is in the range of 109.75 - 109.89. We consider the level 110.17 to be the potential value for the top; we expect movement to this value after the breakdown of the level of 109.90. Short-term downward movement is expected in the range 109.27 - 109.11. The breakdown of the last value will lead to an in-depth correction. Here, the target is 108.89. This level is a key support for the top. The main trend: the development of the rising structure of November 21 Trading recommendations: Buy: 109.55 Take profit: 109.75 Buy : 109.77 Take profit: 109.88 Sell: 109.25 Take profit: 109.13 Sell: 109.08 Take profit: 108.92 For the Canadian dollar / US dollar pair, the key levels on the H1 scale are: 1.3404, 1.3387, 1.3355, 1.3334, 1.3311, 1.3298, 1.3278 and 1.3250. Here, we are following the ascending structure of November 19. The continuation of the movement to the top is expected after the breakdown of the level of 1.3311. In this case, the first target 1.3334. We expect short-term upward movement in the range of 1.3334 - 1.3355. The breakdown of the last value should be accompanied by a pronounced upward movement. Here, the target is 1.3387. Price consolidation is in the range of 1.3387 - 1.3404 and from here, we expect a correction. Short-term downward movement, as well as consolidation are possible in the range of 1.3298 - 1.3278. The breakdown of the latter value will lead to an in-depth correction. Here, the target is 1.3250. This level is a key support for the upward structure. The main trend is the upward structure of November 19, the correction stage. Trading recommendations: Buy: 1.3311 Take profit: 1.3333 Buy : 1.3335 Take profit: 1.3355 Sell: 1.3276 Take profit: 1.3252 Sell: 1.3248 Take profit: 1.3220 For the Australian dollar / US dollar pair, the key levels on the H1 scale are : 0.6833, 0.6814, 0.6799, 0.6787, 0.6767, 0.6748, 0.6735 and 0.6717. Here, we are following the development of the downward structure of November 19. The continuation of the movement to the bottom is expected after the breakdown of the level of 0.6765. In this case, we expect a pronounced movement to the level of 0.6748. Price consolidation is in the range of 0.6748 - 0.6735. We consider the level of 0.6717 to be a potential value for the bottom; upon reaching this value, we expect a correction. Short-term upward movement is expected in the range of 0.6787 - 0.6799. The breakdown of the latter value will lead to an in-depth correction. Here, the target is 0.6814. This level is a key support for the downward trend. The main trend is a local descending structure of November 19 Trading recommendations: Buy: 0.6787 Take profit: 0.6797 Buy: 0.6800 Take profit: 0.6814 Sell : 0.6766 Take profit : 0.6750 Sell: 0.6746 Take profit: 0.6736 For the euro / yen pair, the key levels on the H1 scale are: 121.55, 121.29, 120.94, 120.62, 120.21, 119.99 and 119.64. Here, we determined the subsequent goals from the local ascending structure of November 22. The continuation of the movement to the top is expected after the breakdown of the level of 120.62. In this case, the target is 120.94. Price consolidation is near this level. The breakdown of the level of 120.95 should be accompanied by a pronounced upward movement. Here, the goal is 121.29. For the potential value for the top, we consider the level of 121.55. Upon reaching which, we expect consolidation, as well as a pullback to the bottom. Short-term downward movement is expected in the range of 120.21 - 119.99. The breakdown of the latter value will have the potential to form a downward movement. Here, the potential target is 119.64. The main trend is the local ascending structure of November 22 Trading recommendations: Buy: 120.62 Take profit: 120.92 Buy: 120.96 Take profit: 121.27 Sell: 120.21 Take profit: 120.00 Sell: 119.96 Take profit: 119.66 For the pound / yen pair, the key levels on the H1 scale are : 143.45, 143.09, 142.50. 142.06, 141.15, 140.72 and 140.24. Here, we are following the development of the upward cycle of November 22. Short-term upward movement is expected in the range of 142.06 - 142.50. The breakdown of the last value will lead to a pronounced movement. Here, the goal is 143.09. For the potential value for the top, we consider the level of 143.45. Upon reaching this level, we expect a departure in the correction. Short-term downward movement is possibly in the range of 141.15 - 140.72. The breakdown of the latter value will lead to an in-depth correction. Here, the goal is 140.24. This level is a key support for the top. The main trend is the upward structure of November 22. Trading recommendations: Buy: 142.06 Take profit: 142.50 Buy: 142.52 Take profit: 143.07 Sell: 141.15 Take profit: 140.74 Sell: 140.70 Take profit: 140.26 The material has been provided by InstaForex Company - www.instaforex.com |
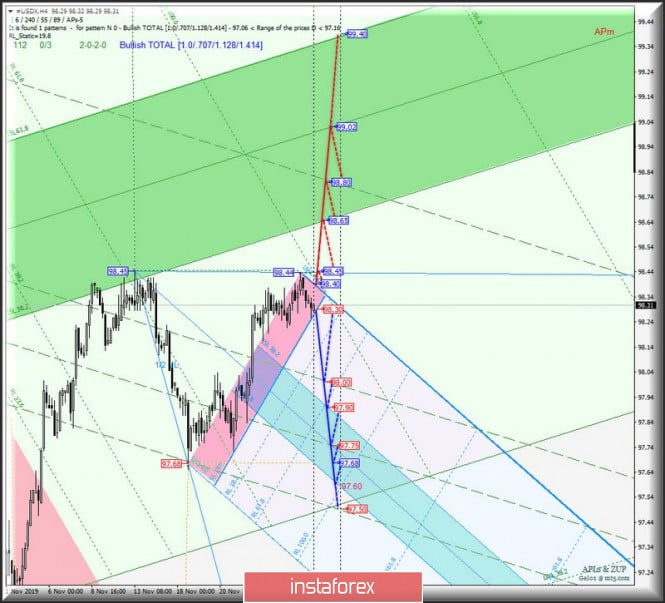
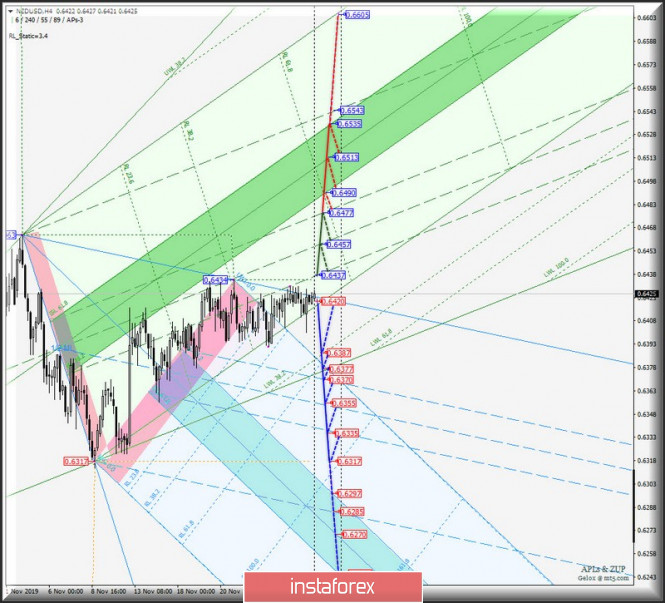
| Posted: 28 Nov 2019 05:00 PM PST Minuette operational scale (H4) Let's consider what will happen to the "raw" currency instruments on November 29, 2019 - Here's a comprehensive analysis of the development options for the movement #USDX vs AUD/USD vs USD/CAD vs NZD/USD. ____________________ US dollar Index From November 29, 2019, the dollar Index #USDX will continue to develop the movement depending on the direction of the breakdown range:
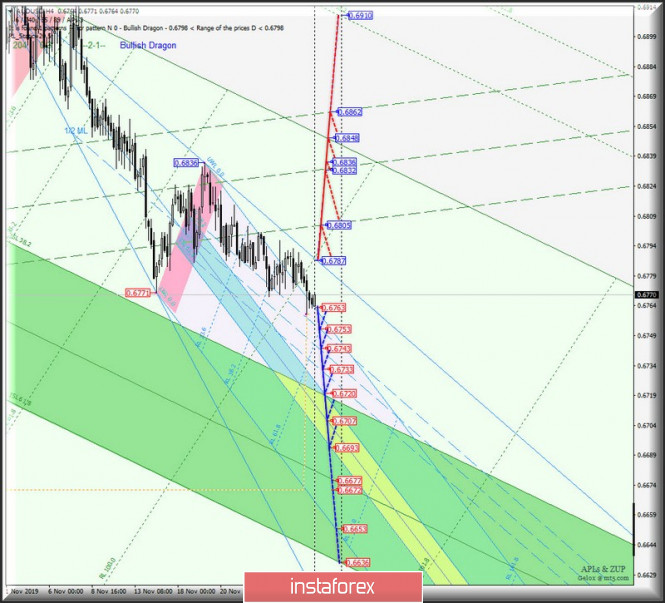
With a joint breakdown of the initial - SSL (resistance level of 98.40) and control - UTL (resistance level of 98.45) lines of the Minuette operational scale fork, the upward movement of #USDX can be continued to the boundaries of the equilibrium zone (98.65 - 99.02 - 99.40) of the Minuette operational scale fork. On the contrary, in case of breakdown of the RL23.6 Minuette reaction line (support level of 98.30), the downward movement of the dollar index can continue to the boundaries of the 1/2 Median Line channel (98.00 - 97.75 - 97.50) of the Minuette operational scale fork and the equilibrium zone (97.90 - 97.75 - 97.60) of the Minuette operational scale fork. The markup of #USDX movement options from November 29, 2019 is shown on the animated chart. ____________________ Australian dollar vs US dollar The development of the movement of the Australian dollar AUD / USD from November 29, 2019 will also be determined by the direction of the breakdown of the range :
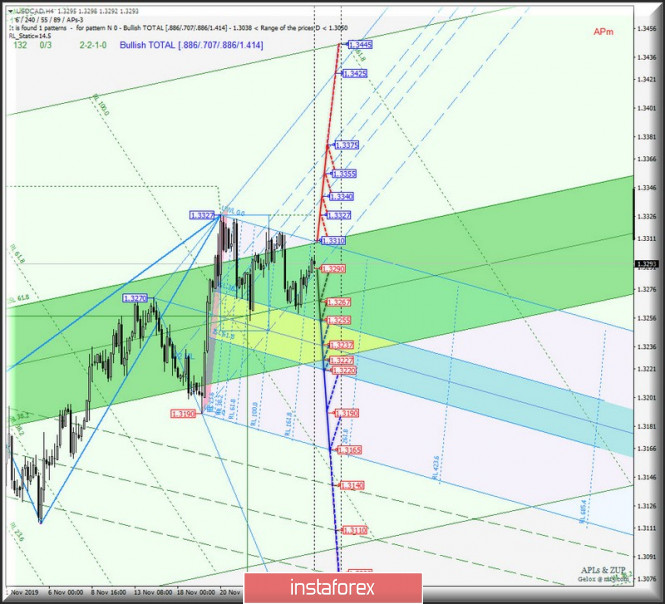
The breakdown of the SSL Minuette initial line (support level of 0.6763) is an option to continue the development of the downward movement of the Australian dollar to the boundaries of the 1/2 Median Line Minuette channel (0.6753 - 0.6743 - 0.6733) with the prospect of reaching the equilibrium zone (0.6720 - 0.6707 - 0.6693) of the Minuette operational scale. Alternatively, the breakdown of the UTL control line (resistance level of 0.6787) of the Minuette operational scale fork will direct AUD / USD movement to the boundaries of the 1/2 Median Line channel (0.6805 - 0.6832 - 0.6862) of the Minute operational scale fork. The marking options for movement AUD / USD from November 29, 2019 are presented in the animated chart. ____________________ US dollar vs Canadian dollar Range development and breakdown direction :
will begin to determine the development of the movement of the Canadian dollar USD / CAD from November 29, 2019. The breakdown of the upper boundary of ISL61.8 (resistance level of 1.3310) of the equilibrium zone of the Minuette operational scale fork - continuation of the development of the upward movement of USD / CAD to the local maximum 1.3327, and when updating it, it will become possible for the price to reach the channel boundaries of the 1/2 Median Line Minuette (1.3340 - 1.3355 - 1.3375). Meanwhile, the breakdown of the final Schiff Line Minuette (support level of 1.3290) will determine the movement of the Canadian dollar to the 1/2 Median Line Minuette (1.3267), during the breakdown of which, it will be possible to reach the boundaries of the equilibrium zone (1.3265 - 1.3237 - 1.3220) of the Minuette operational scale fork, and as an option - update the local minimum 1.3190. From November 29, 2019, we look at the layout of USD / CAD movement options on the animated chart. ____________________ New Zealand dollar vs US dollar From November 29, 2019, the development of the New Zealand dollar/ US dollar (NZD / USD) movement will depend on the development and the breakdown direction of the range :
If a breakdown of the support level of 0.6420 takes place on the initial line of SSL of the Minuette operational scale fork, then the development of the downward movement of the New Zealand dollar to the goals will become relevant : the warning line LWL38.2 Minuette (0.6387) - the control line LTL Minuette (0.6377) - 1/2 Median Line channel (0.6370 - 0.6355 - 0.6335) of the Minuette operational scale fork with the prospect of updating the local minimum 0.6317. In case of breakdown of the resistance level 0.6437, the movement of NZD / USD will continue in the 1/2 Median Line Minuette channel (0.6437 - 0.6457 - 0.6477), and when the upper boundary (0.6477) of this channel is broken, the price of the instrument will be directed to the boundaries of the equilibrium zone (0.6490 - 0.6513 - 0.6535) of the Minuette operational scale fork. From November 29, 2019, we look at the markup of the NZD / USD movement on the animated chart. ____________________ The review was compiled without taking into account the news background. Thus, the opening trading sessions of major financial centers does not serve as a guide to action (placing orders "sell" or " buy"). The formula for calculating the dollar index: USDX = 50.14348112 * USDEUR0.576 * USDJPY0.136 * USDGBP0.119 * USDCAD0.091 * USDSEK0.042 * USDCHF0.036. where the power coefficients correspond to the weights of the currencies in the basket: Euro - 57.6%; Yen - 13.6%; Pound Sterling - 11.9%; Canadian dollar - 9.1%; Swedish Krona - 4.2%; Swiss franc - 3.6%. The first coefficient in the formula leads the index to 100 at the start date of the countdown - March 1973, when the main currencies began to be freely quoted relative to each other. The material has been provided by InstaForex Company - www.instaforex.com |
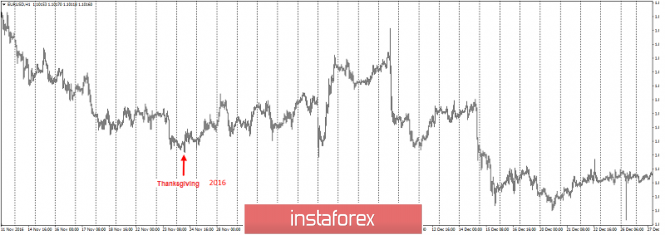
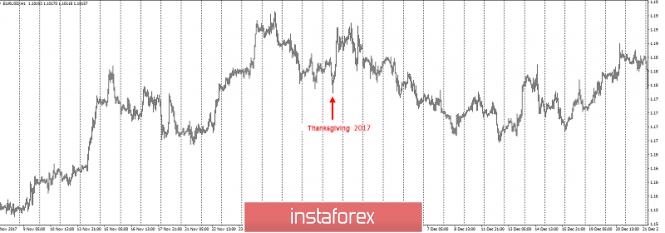
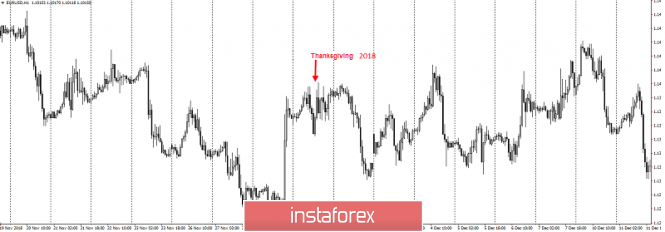
| What can we expect from Thanksgiving? Posted: 28 Nov 2019 03:35 PM PST Greetings, dear traders! Today, November 28, like every last Thursday of November, Thanksgiving is celebrated in the United States. A very respected holiday in the States Currency exchanges do not work on this day and thus, many analysts predict lower volatility on this day. On the one hand, this is logical, but I decided to conduct a comparative analysis of volatility on this holiday for American exchanges for the most popular currency pair for several years which is the EUR / USD currency pair. So, EUR / USD in 2016: The volatility of the pair is about 50p. This day was a local downward trend reversal. EUR / USD in 2017: The volatility is 120p. After this day, the trend changed direction for a week. EUR / USD in 2018: The volatility is 50 p, but it was already on the eve after it declined by 80 p in the market. These were Thanksgiving Days from 2016 to 2019. As you can see, volatility is not so low, especially in 2017. Now, it is up to you how to use it. In any case, be careful when the Asian session opened after this day. Good luck in trading! The material has been provided by InstaForex Company - www.instaforex.com |
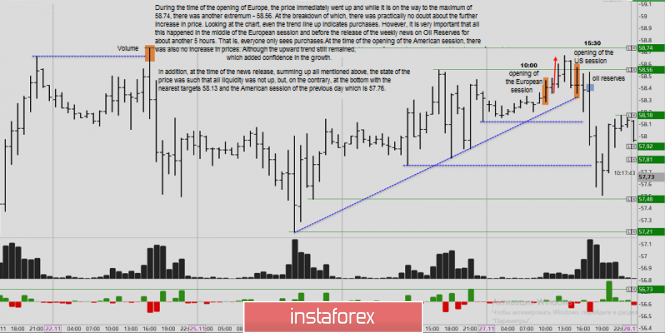
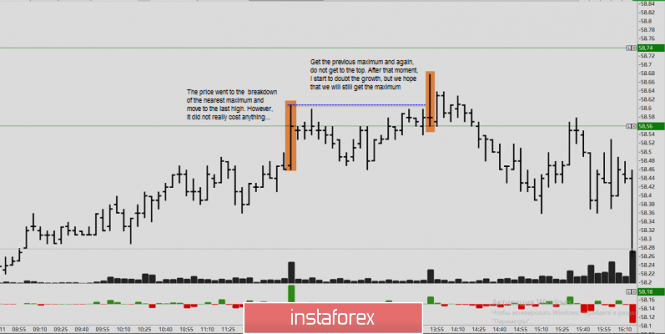
| Why didn't the oil go upwards? Volume analysis for oil Posted: 28 Nov 2019 03:35 PM PST Good evening, dear traders! Yesterday, we gave a trading idea for the growth of oil but paid attention to the evening news on oil reserves in the United States. Let's analyze this situation on volumes. During the time of the opening of Europe, the price immediately went up and while it is on the way to the maximum of 58.74, there was another extremum - 58.56. At the breakdown of which, there was practically no doubt about the further increase in price. Looking at the chart, even the trend line up indicates purchases. However, It is very important that all this happened in the middle of the European session and before the release of the weekly news on Oil Reserves for about another 5 hours. That is, everyone only sees purchases. At the time of the opening of the American session, there was also no increase in prices. Although the upward trend still remained, which added confidence in the growth. In addition, at the time of the news release, summing up all mentioned above, the state of the price was such that all liquidity was not up, but, on the contrary, at the bottom with the nearest targets 58.13 and the American session of the previous day which is 57.76. Oil's approach to the maximum in Europe: Thus, the Europeans simply didn't have the courage to collect stocks before the reserves. Nevertheless, the stocks themselves came out large, which led to the sales of black gold. This analysis is based on the US oil futures. The material has been provided by InstaForex Company - www.instaforex.com |
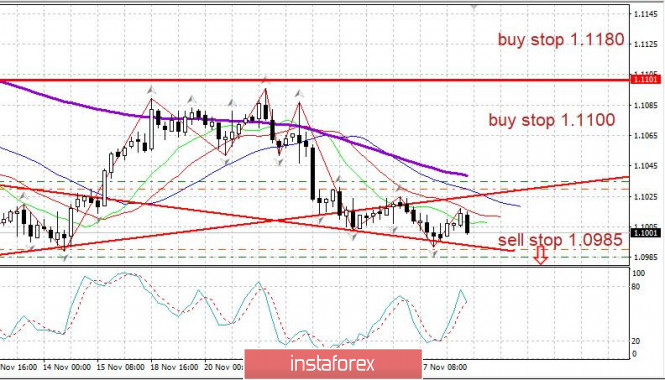
| Evening review 11/28/2019 EURUSD Posted: 28 Nov 2019 02:58 PM PST "Bets have been placed; no more bets." All news is thought out and incorporated into decisions. US traders leave for Thanksgiving. The issue of the EURUSD prospect has not yet been resolved - but perhaps it will be resolved in the very near future. Following three days of stagnation, the range became very narrow and the probability of a breakthrough is very high. EURUSD: We sell from 1.0985. We buy from 1.1035. May good luck accompany us. The material has been provided by InstaForex Company - www.instaforex.com |
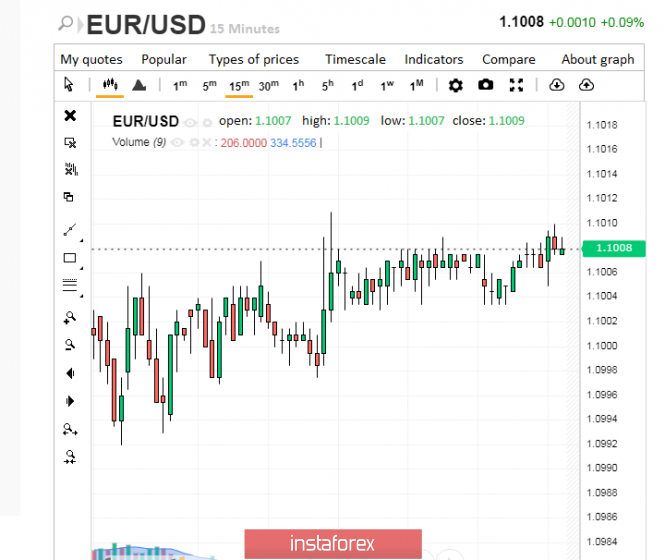
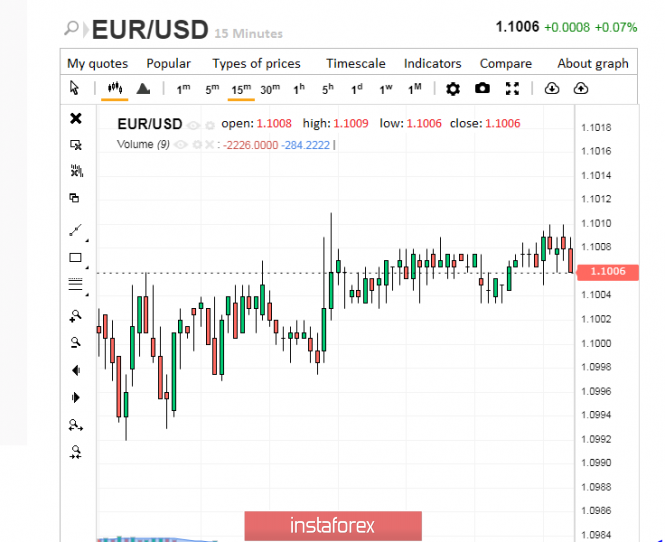
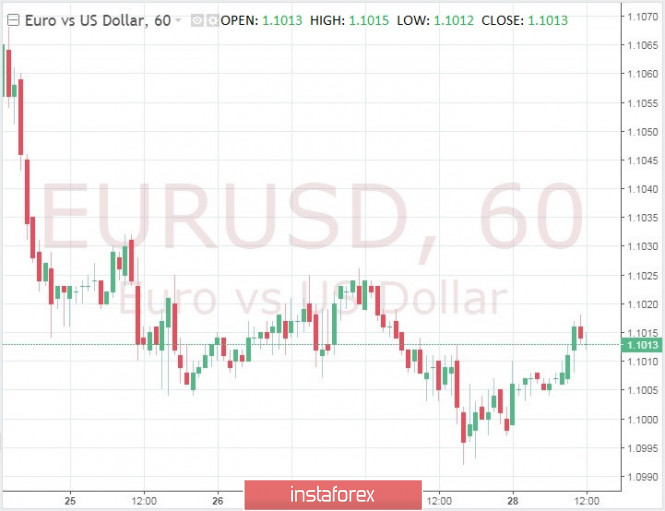
| Euro is tired and the dollar hour has come Posted: 28 Nov 2019 02:57 PM PST European currencies are again in their eternal confrontation, but the dollar is not trying to crush the euro. At the same time, the greenback cannot enjoy the taste of victory, because his opponent, who had previously been actively fighting for the championship in the EUR / USD pair, shows signs of fatigue. According to analysts, the apathy of the European currency is caused by the general fatigue of world markets. It is provoked by a number of factors, among which are the fatigue of investors and traders from protracted trade negotiations both between China and the United States, and about Brexit. Experts do not exclude that the market will continue to move towards constantly low volatility. A marked reduction in volatility is inherent in the single currency, especially in the EUR/USD pair. Economists record not only the widespread fatigue of the financial market, but also a significant narrowing of trading ranges in most currency pairs, in the classic EUR/USD in particular. This is expressed in the fall of the pair's quotes. The EUR/USD pair was trading in the low range of 1,1008–1,1009 on Thursday morning, November 28, occasionally making attempts to rise higher. A day earlier, the pair fell to 1.1000 and below, but then slightly gained momentum. The EUR/USD pair fell to 1.1006 on Thursday, which confirms the thesis of fatigue. The euro hardly reacted to timid attempts to rise, and the dollar tried to pull the pair out of its efforts. Against this apathetic background, the US currency feels more confident than ever. On Wednesday evening, November 27, exchange markets gave the greenback a green light, which it did not fail to take advantage of. The dollar was actively playing in the green zone, strengthening its position due to good macro statistics from the US. According to analysts, these data put an end to the issue of further Fed rate cuts. Analyzing the current state of the market and the dynamics of the EUR/USD pair, experts believe that both risks and high volatility will return to the markets in the near future. This is especially true for key currency pairs. Risks that could spur the movement in major pairs include the US elections in November 2020, the upcoming December elections in the UK, and the possible conclusion of a trade agreement between Washington and Beijing. Experts do not exclude that the current period of lull may drag out, and then abruptly give way to an explosion of volatility. The material has been provided by InstaForex Company - www.instaforex.com |
| GBP/USD: YouGov gave pound the hope for Conservatives to form a majority government Posted: 28 Nov 2019 02:57 PM PST The pound has sharply grown against the US dollar amid increasing chances that Conservatives will be able to get a confident majority in the December elections in the UK. The day before, the widely anticipated forecasting model of YouGov for the British parliamentary election was published. This model enjoys great confidence after it was able to accurately predict the "suspended" Parliament following the election in 2017. This time, according to the analysis, the Conservative Party should form a majority government. The Tories are expected to receive 359 out of 650 seats, and the Laborites - 211. If YouGov forecasts are confirmed, then this will be the best result for Conservatives since 1987. A majority government would be a favorable election outcome and help dispel continuing uncertainty about the future prospects of Britain and Brexit. In response to this news, the GBP/USD pair tested weekly highs around 1.2950 and is now trading around 1.2940. Since the second half of October, the 1.2970 mark has been a strong resistance level, through which the pair has not managed to break up. It is possible that GBP/USD will remain in the range of 1.2970–1.2800 until the election. It is assumed that the confident victory of the Conservatives will allow the pair to break through the current resistance and reach the level of 1.3100. Otherwise, a decrease to 1.2750 will follow. The material has been provided by InstaForex Company - www.instaforex.com |
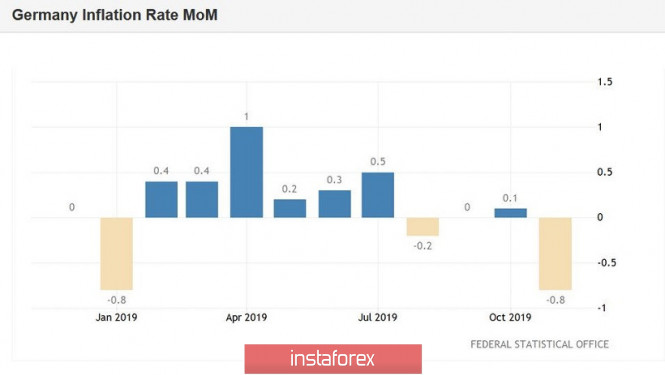
| How can the German consumer price index affect EUR/USD? Posted: 28 Nov 2019 02:57 PM PST The economic downturn in the eurozone underlines the importance of preliminary data on the consumer price index in Germany. Weak regional indicators point to the gloomy picture of CPI in Germany. It is expected that the general consumer price index will fall by 0.6% in November compared with the previous month, while the annual figure will increase by 1.3% compared with 1.1% in October. In Hesse, Brandenburg and Bavaria, inflation in November was -0.8% versus + 0.1% in October. Consumer price index in North Rhine-Westphalia reached -0.7% in November against +0.1% earlier. How can this affect EUR/USD? Of course, the euro will become cheaper against the background of these data. If you add to them also the current monetary policy of the ECB, the decline can be significant. Key technical levels for EUR/USD trading: Support is expected to reach 1.0990, followed by 1.0940 - October low. A drop to 1.0879 is possible towards the end of the year. The resistance of the pair can meet at the level of 1.1035, and a more significant limit is expected at the level of 1.1050. The 1.1100 mark is also a good level for observation. The German Consumer Price Index, published by Statistisches Bundesamt Deutschland, shows the change in the average price of all goods and services. It is the primary indicator for measuring inflation and changes in consumer trends. A high value is positive (or bullish) for the euro, and a low value is negative (or bearish). The material has been provided by InstaForex Company - www.instaforex.com |
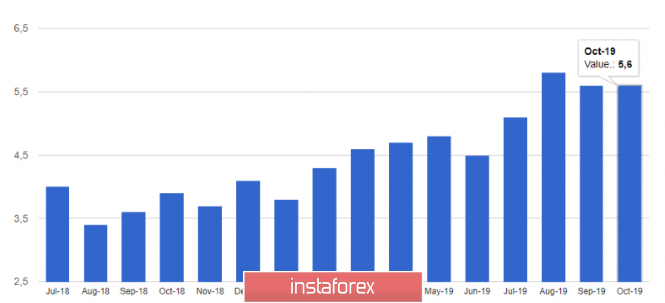
| Posted: 28 Nov 2019 02:57 PM PST The actions of the US president and the signing of the Hong Kong Democracy Support Act could be detrimental to US-China relations. However, the US dollar did not lose much of its position, even after the demand for risky assets, including the yen and the franc, increased. As it became known, the new law amends the 1992 United States Policy on Hong Kong Act. It more clearly clarifies the US position on Hong Kong and provides an assessment of the political events taking place in Hong Kong. During his speech, Donald Trump said that he signed these laws out of respect for President Xi, China and the people of Hong Kong. The American president also stressed that the leaders and representatives of China and Hong Kong will be able to peacefully resolve their differences, which will lead them to long-term peace and universal prosperity. Immediately afterwards, the Chinese Foreign Ministry condemned the signing of the new law and threatened to take retaliatory measures. The ministry did not specify what specific measures are in question. As for the fundamental data, the market calmly accepted reports on growth in lending to households, which will support the economy in the future. According to data, lending to households in the eurozone increased by 3.5% in October of this year against 3.4% in September. As for companies, there was also a growth in lending by 3.8% against 3.6% in September. The eurozone M3 monetary aggregate grew by 5.6% in October compared to last year with a forecast of 5.5%, and the moving average of the monetary aggregate from August to October increased by 5.6% against the forecast of 5.5%. The euro also ignored data on the consumer confidence index in the eurozone, which completely coincided with the forecasts of economists. Despite the improvement of the indicator, the value remains in the negative zone, which indicates restrained confidence. According to the data, the consumer confidence index rose to -7.2 points against -7.6 in October this year. The confidence index in the eurozone industry rose to -9.2 points in November, while the confidence index in the service sector increased to 9.3 points in November against October 9.0 this year. The technical picture of the EURUSD pair remains unchanged. The market continues to continue to be in a "suspended" state, relying either on data on the US economy, or on the news of US-Chinese trade negotiations. The demand for the euro may return if the bears miss the resistance of 1.1015, which will quickly lead to the renewal of the highs of 1.1040 and 1.1060. An unsuccessful attempt to return to a resistance of 1.1015 can maintain pessimistic views on the purchase of the euro, which will pull down the pair to a low of 1.0993 and lead to its breakout, making it possible for the bears to reach support at 1.0970. The British pound is falling against the US dollar after the euphoria that surged into the market in connection with the results of an election poll in the UK by YouGov. In the morning, I noticed that the report indicated the advantage of the Conservative Party following the results of the general early election, which could get 359 out of 650 parliamentary seats. Such a market reaction is not surprising, since the polling model used by YouGov allowed the company to correctly predict the results of the 2017 elections of the year. However, the elections themselves are still two weeks away, so it's still too early to talk seriously about the advantage of any party. The material has been provided by InstaForex Company - www.instaforex.com |
| Posted: 28 Nov 2019 02:57 PM PST Following a short pause, US President Donald Trump signed the bill on human rights and democracy in Hong Kong approved by the US Congress. China considered this an interference in the internal affairs of the country and promised to answer. However, it is hardly worth expecting another round of escalation of the trade war. With the slowdown in the national economy, China is interested in resolving trade disputes. A recent issue of $6 billion worth of Chinese government bonds denominated in dollars may speak in favor of this assumption. On the one hand, Beijing does not really need the US currency. In addition, it can easily get it if it sells a part of the treasuries. Another thing is the accumulation of dollars for interventions, which will become quite possible in the light of the currency pact of the United States and China. Thus, it is doubtful that the intervention of America in the internal affairs of China will force the latter to refuse to conclude a trade deal with the United States. If this is true, then the bulls on EUR/USD have only a little time to tolerate. In the short term, the bears' breakthrough of support near the bottom of the 10th figure may lead to a continuation of their movement down, however, fans of the euro still have hopes for an end to the trade war, the "soft" Brexit and the economic recovery in Germany, especially since the French economy, unlike the German, si doing pretty good. France consumer confidence in November jumped to the highest levels since Emmanuel Macron won the 2017 presidential election. Pressure on the euro as a funding currency has a decrease in volatility to record low levels. At the same time, mixed statistics for the United States are holding back the bears from taking action. US GDP expanded by 2.1% in the third quarter with a forecast of growth of 1.9%, however, the basic index of personal consumption spending slowed in October from 1.7% to 1.6%, which makes the chances of an interest rate hike by theFederal Reserve slim. Therefore, the bulls on EUR/USD have only one thing left - to wait and believe that if their opponents are not stopped by the level of 1.1000, then support will make 1.0960. The material has been provided by InstaForex Company - www.instaforex.com |
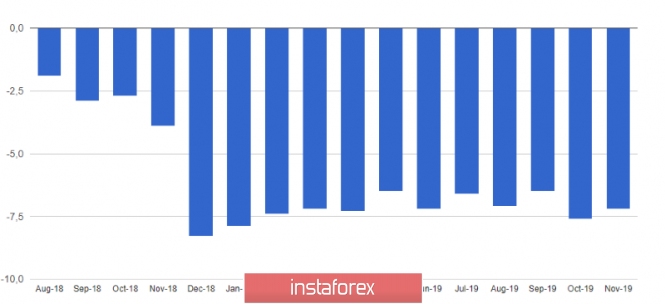
| The game for a fall: it is difficult for the Australian dollar to grow Posted: 28 Nov 2019 02:57 PM PST The Australian currency is experiencing significant difficulties during the week. The aussie is heading up, but its attempts are unsuccessful. Most analysts are pushing the Australian dollar to decline further, emphasizing that the AUD/USD pair is in a protracted downward trend. The fall of the aussie intensified following the statement of Reserve Bank of Australia Chief Philip Lowe. The central bank allows a twofold reduction in interest rates by June 2020, after which a quantitative easing program will be launched. The AUD/USD pair fell by 0.2% to 0.6772 on Wednesday, November 27, while Australia's three-year government bond yields lost 10 basis points. The pair reached this level again on Thursday, November 28. Today, the AUD/USD pair tried to find the bottom, from time to time dropping even lower. Quotes ran in the range of 0.6767–0.6768,slightly increasing. However, the current trend is aimed at going down in general, analysts say. Earlier this week, experts recorded strong volatility of the Australian dollar. It grew at times after a poll in the UK and the speech of the head of the RBA. Recall that Lowe announced the regulator's readiness to lower the key rate to 0.25%, and not to 0.5%, as previously assumed. In determining the current monetary policy of the RBA, indicators such as the situation on the labor market, inflation and consumer spending, as well as household debt are very important. In 2019, the central bank of Australia cut its key interest rate thrice, keeping it at a record low of 0.75%. However, this is not the limit: markets expect another decline in early 2020. The current situation negatively affects the dynamics of the Australian currency, analysts said. Fuel to the fire adds a drop in consumer confidence in Australia. It has fallen to its lowest level in four years. Consumers are also under pressure to assess the future prospects of the Australian economy. It sees the future in gloomy tones. According to analysts, theAUD/USD pair has been in a global downward trend for the past eight years, since August 2011. The Australian currency is experiencing huge growth problems that continue from year to year. Experts find it difficult to answer when a negative trend can be scrapped. They believe that the pair's fall will continue in the near future. Experts consider serious differences in the American and Australian economies and labor markets of these countries as the reason for this. The prolonged trade conflict between the The US China adds fuel to the fire. The Australian dollar is trying to withstand the pressure of these factors, but the forces are unequal. As a result, the Australian currency is weakening, rushing to a downward peak, analysts summarize. The material has been provided by InstaForex Company - www.instaforex.com |
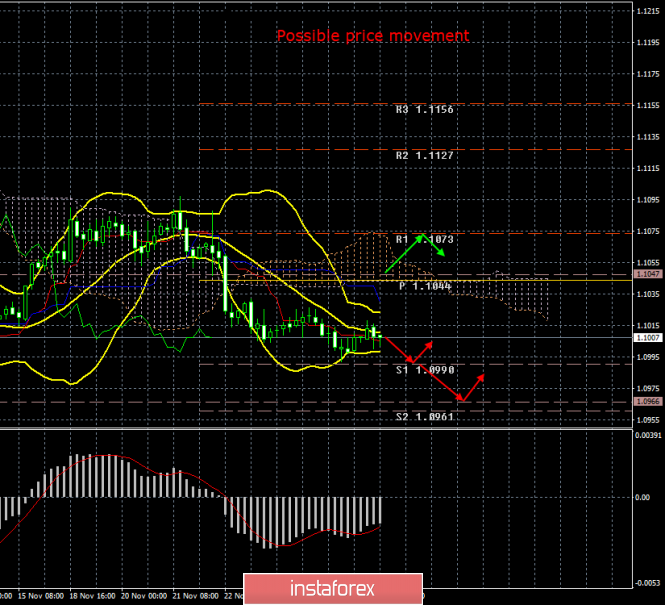
| Posted: 28 Nov 2019 02:56 PM PST 4-hour timeframe Amplitude of the last 5 days (high-low): 45p - 74p - 28p - 19p - 33p. Average volatility over the past 5 days: 40p (low). The EUR/USD currency pair continues a completely non-initiative movement on the penultimate trading day of the week. If a few days ago, although with low volatility, a trend movement was still observed, now there is no such movement. Traders seem to have left the market in full force, and the volatility of today is as much as 20 points. Is it worth it to pay attention to the technical picture in such a situation? How to tear off traffic in as many as 20 points per day? What to expect from a pair that shows such volatility? We believe that everything is to blame for the same paradoxical situation that we are talking about in almost every review, as that is now the key reason for what happens with the currency pair. We still believe that the bears simply refuse to continue selling the euro, being around 2-year lows for no good reason. We have already said that in order for the downward trend to resume, we need reasons like lowering the key interest rate by the European Central Bank or entering a major player on the foreign exchange market. Until this moment, such a movement can be maintained and nothing can be done about it. Today, November 28, the entire fundamental background came down to the publication of the preliminary November consumer price index in Germany. Experts expected to see inflation accelerate to 1.3% YOY, but in monthly terms allowed a loss of as much as 0.6%. Real numbers turned out to be much worse than forecasts. Inflation remains at the level of 1.1% YOY, while it immediately loses 0.8% in monthly terms. Thus, when a similar report on the European Union will be published tomorrow, we can also expect numbers worse than forecasted values, and the previous value of +0.7% YOY is unlikely to be exceeded. Well, what kind of growth of the European currency can be discussed if the ECB drove the deposit rate already at the level of -0.5% and revived the quantitative easing program with a monthly redemption worth 20 billion euros, and this is still not enough for the EU economy to stop showing signs of a slowdown? What else remains for the European regulator, except how to further lower the rate and expand the QE program? They can still apply the policy of helicopter money, but this is likely an extreme measure. Meanwhile, China made an official statement regarding Donald Trump signing the Hong Kong Democracy and Human Rights bills. "The signing by the US side of the so-called Hong Kong Democracy and Human Rights Law is a serious interference in Hong Kong's affairs and in China's internal affairs, a serious violation of international law and the basic norms of international relations. The government and people of China strongly protest," the report stated. What countermeasures Beijing will take is still unknown, but from our point of view, this step by Donald Trump could significantly complicate the process of further negotiations on a trade agreement and further aggravate the conflict between Beijing and Washington. There is no doubt that Beijing will answer Washington. Therefore, all news received by traders is potentially a negative for the European currency. An even greater slowdown in inflation, or not acceleration, will clearly not add optimism to euro buyers. The escalation of the trade conflict between China and the United States, which also affects the economy of the European Union, will not increase the demand for the euro. Thus, the fundamental background remains completely the same - a negative for the euro currency, but they still do not want to extract any dividends from the bears. As for the technical picture of the euro/dollar pair, everything is very simple at this time. The pair almost completed the first support level of 1.0990 and began a new round of correctional movement. Overcoming the level of 1.0990 can trigger a new downward movement, however, it is unlikely to be stronger than 20-30 points per day, and even such a downward movement will now require fundamental factors. And only if traders do not ignore them again. One single important report will be released tomorrow - preliminary inflation in the EU. Most likely, either the report will be ignored, or its value will not cause any emotions among market participants. Trading recommendations: The EUR/USD pair began a new round of correction against the downward trend, and the volatility in trading remains extremely low on Thursday. Thus, it is now recommended to wait until the correction is complete and sell the euro/dollar pair again with targets at 1.0990 and 1.0966. It is recommended to consider buying the euro no earlier than the reverse consolidation of traders above the critical Kijun-sen line and the level of 1.1047 with the first target resistance level of 1.1073. Explanation of the illustration: Ichimoku indicator: Tenkan-sen is the red line. Kijun-sen is the blue line. Senkou Span A - light brown dotted line. Senkou Span B - light purple dashed line. Chikou Span - green line. Bollinger Bands Indicator: 3 yellow lines. MACD indicator: Red line and bar graph with white bars in the indicator window. Support / Resistance Classic Levels: Red and gray dotted lines with price symbols. Pivot Level: Yellow solid line. Volatility Support / Resistance Levels: Gray dotted lines without price designations. Possible price movement options: Red and green arrows. The material has been provided by InstaForex Company - www.instaforex.com |
| EUR/USD: an alarm from Germany and the Hong Kong factor Posted: 28 Nov 2019 02:56 PM PST The euro-dollar pair continues to trade in the flat, without leaving a narrow price range. The contradictory fundamental background does not allow traders - neither buyers or sellers - to show character. In addition, Thanksgiving is currently being celebrated in the United States today, and there are adjustments: US trading floors are closed, so the remaining market participants are forced to trade in low liquidity. A similar picture will also be observed in late December and early January. I believe that by this time the pair will exit the price band of 1.09870-1.1090, in which it was stuck in early November. So far, traders are not able to create a large-scale price movement to leave the above price niche. For each positive is its negative and vice versa. This applies to both the euro and the dollar. For example, dollar bulls did not have time to be inspired by the growth of the US economy (indicators for the third quarter were revised upwards), as inflation indicators arrived right there, which seemed to fit in the red zone. The external fundamental background is also replete with conflicting news. Before negotiators exchanged pleasantries during a telephone conversation, Trump signed scandalous bills that actually support protesters in Hong Kong. Similar contradictions keep the EUR/USD pair at the bottom of the 10th figure, although bears and bulls tried to break through the price range: the price fell to 1.0990 yesterday, and today it rose to 1.1025. But the next round of the confrontation ended in a draw, the pair ends Thursday's trading day at their previous positions. The German inflation data released today left a negative impression. The general consumer price index came out worse than expected: on a monthly basis it collapsed to -0.8% (this is the weakest result since January of this year), and in annual terms it slowed to 1.1% (with a growth forecast of up to 1.2%) . Harmonized consumer price index on a monthly basis also found itself in the negative zone, showing the worst result in the last ten months. While in annual terms, the indicator unexpectedly grew to 1.2% - inflation has not been at this height since June this year. In general, the figures published today do not bode well in the context of tomorrow's release of data on the growth of pan-European inflation. Most likely, the forecasts of low growth will not be confirmed - the general index may reach 0.6%, and the core one - at the level of one percent or even 0.9%. In this case, the bearish pressure on the pair will increase significantly, in view of the dovish intentions of the ECB members. On the other hand, the dollar also does not feel completely confident. Despite some hesitation, Trump nevertheless signed bills today that actually support Hong Kong protesters. According to the first bill (which has already acquired the force of law), the US Department of State must confirm to Congress at least once a year that Hong Kong maintains sufficient autonomy to maintain favorable conditions for trade with the United States. Otherwise, the law provides for sanctions against city authorities for violating human rights. The second bill prohibits the Hong Kong police from supplying funds that can be used to disperse demonstrations: tear and pepper gases, rubber bullets and stun guns. As you know, China sees Hong Kong as its administrative unit, following the principle of "one country - two systems." Therefore, it is not surprising that the Chinese regarded the actions of Washington as interference in the internal affairs of the state. Even before the signing of the above documents, Beijing warned the United States that such steps would not be without consequences. And now that the bills have become laws, experts fear that the outbreak of conflict will negatively affect the negotiation process between the United States and China. The fact of signing these bills has already reduced the chances of signing a trade deal between the parties in the near future: after all, in any case, political passions must survive their peak period. Therefore, the visit of the American delegation to China, which according to some rumors was supposed to take place in early December, is now under big question. Another round of confrontation between China and the United States puts background pressure on the US currency, not allowing the dollar to dominate the market, including the pair with the euro. Thus, the system of checks and balances continues to keep the EUR/USD pair in flat, at the bottom of the 10th figure. In conditions of low liquidity and a contradictory fundamental background, the pair actually stomps on the spot. However, the European currency will have to pass a rather important exam tomorrow, in view of the release of data on inflation in the eurozone. The general consumer price index has been gradually decreasing since June, and reached 0.7% in October. A slight recovery is expected in November - according to analysts, the figure will rise to the level of 0.8%. Core inflation should also slightly grow - according to experts, the core index will be released in the green zone, at around 1.2%. But given the dynamics of German inflation, I would now warn traders from opening long positions in the pair at a fall in prices: European inflation may disappoint quite a lot, and this fact will allow the pair bears to finally settle in the ninth figure. The material has been provided by InstaForex Company - www.instaforex.com |
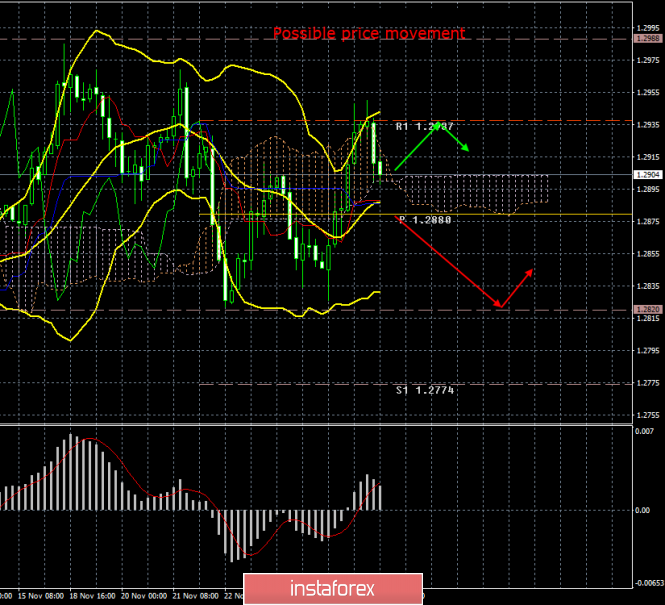
| Posted: 28 Nov 2019 02:56 PM PST 4-hour timeframe Amplitude of the last 5 days (high-low): 77p - 106p - 78p - 69p - 89p. Average volatility over the past 5 days: 84p (average). The GBP/USD currency pair continues to be traded inside the 200-point side channel and, as expected, having reached its upper boundary, began a round of downward movement. It's hard to say how strong this downward movement will be. Nevertheless, one cannot exclude the fact that the upward trend may nevertheless resume. However, until we confidently overcome the level of 1.3000, which is also a psychological mark, we still do not recommend seriously considering the further strengthening of the pound. Today, no economic news has been received from Great Britain, and all the news bulletins are full of the results of a new case study, in which more than 100,000 people took part and who predicted a confident victory for the Conservatives. So certain that the adoption of Brexit according to Boris Johnson's plan is almost a settled issue. However, we have already said that even this format and nature of the news now does not have the proper impact on the pound/dollar pair. We continue to believe that the fundamental data are now completely unimportant. The pound is in a flat, albeit in a very wide flat, as for a 4-hour timeframe, and until it gets out of it, it is not worth talking about any influence of the foundation on the technique. Thus, we still recommend either trading based on the side channel, that is, from the upper boundary to the lower and vice versa, or not trading the pair at all until the lateral movement is completed. As for the opinion poll, which predicted a confident victory for the party of Johnson, its results, of course, can no longer be called inaccurate, since the study involved one or two thousand people, and as many as 100,000. According to the results of the study, 359 out of 650 seats will go to the Conservatives. This number is more than enough to make Johnson's deal "on his own" and end the three-year epic of divorce from the European Union. In 2017, a similar study accurately predicted the loss of a majority in Parliament by Conservatives led by Theresa May. Such a big advantage of the Conservatives is explained by the fact that many residents of Great Britain who initially voted for the Labour Party no longer share the position of Jeremy Corbyn's party regarding Brexit, or rather its complete absence. The "hard" stance of Johnson, but at the same time providing for an agreement with the European Union, that is, the "soft" version of Brexit, attracts the electorate much more. Thus, now it is indeed possible to announce the likelihood of Conservative victory in elections by a large margin of not less than 80%. This means that Brexit will still take place before January 31, 2020, UK Prime Minister Johnson will still win his first victory, and we will witness a new epic in which the UK will negotiate trade agreements with the United States and the European Union, which , according to many experts, they can drag out just like Brexit for many years. Thus, after the euphoria after the completion of the "divorce" from the EU, the pound may again experience harsh everyday life, as now the UK economy will have to face a long period of life without the European Union. At the moment, the technical picture for the pound / dollar currency pair does not change at all, as traders continue to keep quotes inside the channel 1.2970 - 1.2780. Thus, now we expect a downward movement of 50-100 points, at least. The pair was also unable to overcome the resistance level of 1.2937 and rebounded from it, which is another factor in favor of a round of downward movement. Trading recommendations: GBP/USD resumed its downward movement as part of a sideways trend. Thus, traders are again encouraged to consider selling the pound while aiming for 1.2820, as the pound quotes rebounded from the level of 1.2937. Buying the pound/dollar pair is not yet recommended, as traders still can not overcome the strong resistance area of 1.2970 - 1.2780. Explanation of the illustration: Ichimoku indicator: Tenkan-sen is the red line. Kijun-sen is the blue line. Senkou Span A - light brown dotted line. Senkou Span B - light purple dashed line. Chikou Span - green line. Bollinger Bands Indicator: 3 yellow lines. MACD indicator: Red line and bar graph with white bars in the indicator window. Support / Resistance Classic Levels: Red and gray dotted lines with price symbols. Pivot Level: Yellow solid line. Volatility Support / Resistance Levels: Gray dotted lines without price designations. Possible price movement options: Red and green arrows. The material has been provided by InstaForex Company - www.instaforex.com |
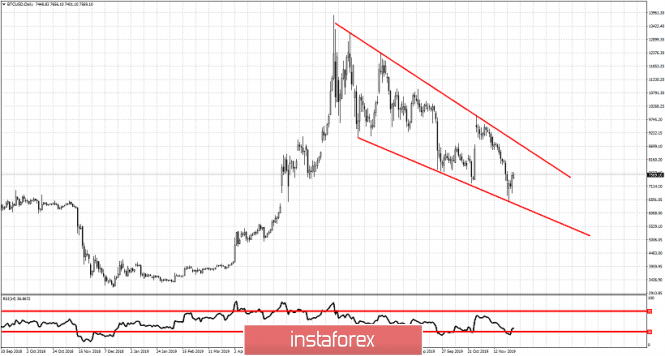
| Posted: 28 Nov 2019 01:48 PM PST BTCUSD has reached our target of $6,600 from our last analysis and is now bouncing $1,000 higher. The area of support at $6,600 has been tested and so far respected. This an early reversal sign.
BTCUSD continues to trade inside the downward sloping wedge pattern. Price has reached the lower wedge boundary as expected and is now moving above $7,500. Bulls need to see price break out and above the upper wedge pattern boundary. Resistance therefore is at $8,700 area.
|
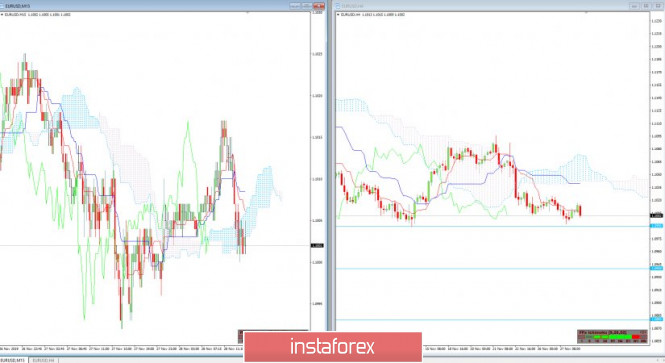
| EUR/USD for November 28,2019 - Ichimoku analysis Posted: 28 Nov 2019 05:14 AM PST EUR/USD has been trading sideways at the price of 1.1000. Anyway, I see for further downside due to short-term downward trend. Watch for selling opportunities. Ichimoku analysis:
15M time-frame The price just crossed below the Ichimoku cloud on the 15M time-frame that sellers took control from buyers. Intraday support levels are set at 1.0996 and 1.0992. H4 time-frame Based on the 4H time-frame, the price is trading below the Ichimoku cloud and bleow the Kijun and Tenkan sen lines, which is clear indication of the short-term downward trend. Downwrad targets are set at the price of 1.0990, 1.0940 and 1.0880 The material has been provided by InstaForex Company - www.instaforex.com |
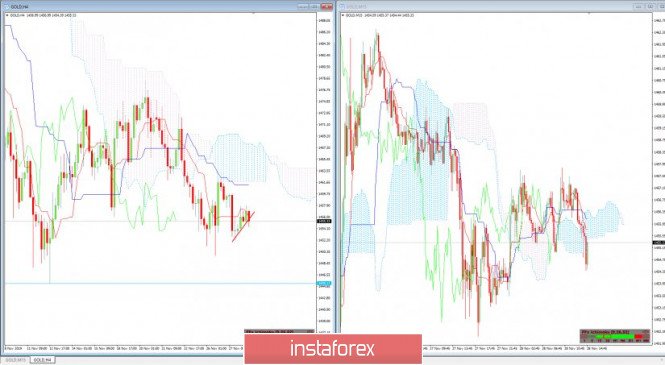
| Gold 11.28.2019 - Intraday selll entry with confirmation of the longer frame chart Posted: 28 Nov 2019 05:04 AM PST Gold has been trading sideways at the price of $1.454. Anyway, I see for further downside due to short-term downward trend. Watch for selling opportunities. Ichimoku analysis:
15M time-frame The price just crossed below the Ichimoku cloud on the 15M time-frame that sellers took control from buyers. Intraday support levels are set at $1.453 and $1.452. H4 time-frame Based on the 4H time-frame, the price is trading below the Ichimoku cloud and bleow the Kijun and Tenkan sen lines, which is clear indication of the short-term downward trend. Main downward target is set at the price of $1.445. The material has been provided by InstaForex Company - www.instaforex.com |
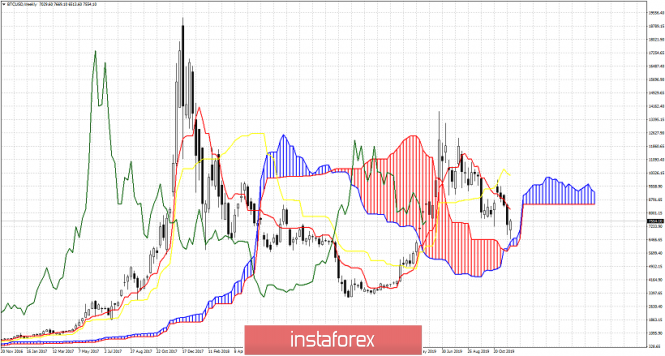
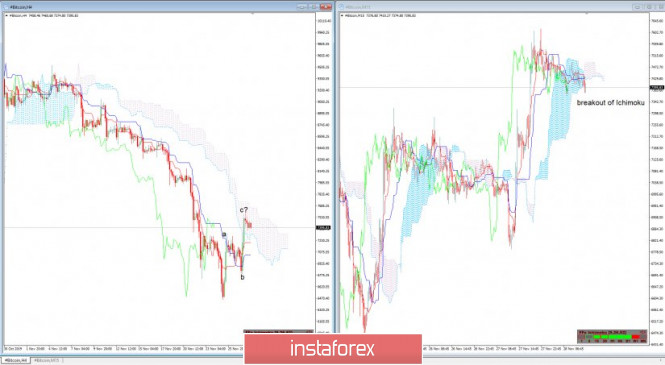
| BTC 11.28.2019 - End of the upward correction and bear cross on intraday Ichimoku Posted: 28 Nov 2019 04:53 AM PST BTC has been trading sideways at the price of $7.396. Anyway, I see potential for the end of the upward correction (ABC) and potential beginning of the new downside leg. Watch for selling opportunities. Ichimoku analysis:
15M time-frame The price just crossed below the Ichimoku cloud on the 15M time-frame, which is sign that sellers took control from buyers. Intraday support levels are set at $7.306 and $6.800. The 15MIN time-frame produced sell signal. H4 time-frame Based on the 4H time-frame, the price reached Ichimoku cloud but the overall trend is still bearish. My advice is still to watch for selling opportunities with the targets at $6.800 and $6.450. The material has been provided by InstaForex Company - www.instaforex.com |
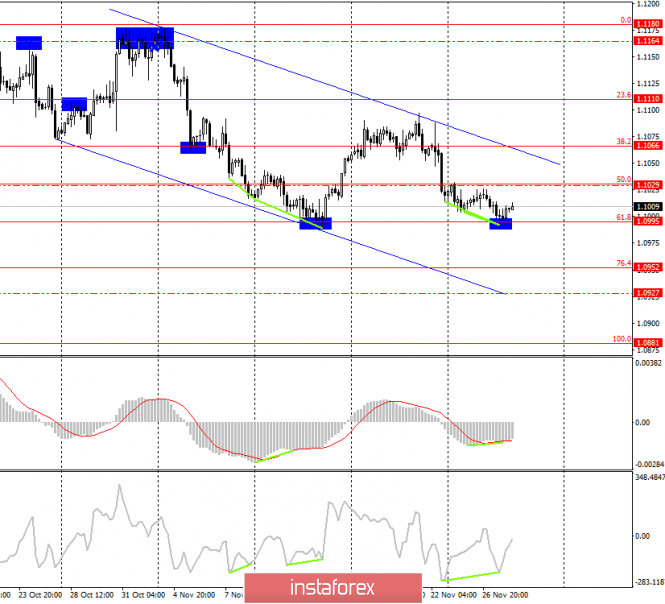
| EUR / USD on November 28: Revelations of Donald Tusk and optimism of Christine Lagarde Posted: 28 Nov 2019 02:58 AM PST EUR / USD - 4H.
On November 4, the EUR / USD pair fell to the correctional level of 61.8% - 1.0995 on the 4-hour chart and, after the formation of two bullish divergences at the CCI and MACD indicators, reversed in favor of the European currency and began the growth process in the direction of the level corrections 50.0% - 1.1030. However, the general mood of traders has not changed for a long time, as eloquently indicated by the downtrend corridor, within which the pair continues to trade. It makes no sense to review the entire background of the previous day, as traders did not pay any attention to the reports. All economic reports from America in no way helped the American currency, moreover, today the euro-dollar pair began to grow, which, unlike yesterday's miserable fall, was not caused by any news. Today, traders do not expect any economic news from the European Union or the United States at all. The activity of traders is likely to remain low, since yesterday, even quite important news could not stir up the market. Earlier, I wrote that Donald Trump is sleeping and sees the EU collapse, which is why he strongly supports Boris Johnson and Nigel Faraj and even openly declares that he supports Brexit and preferably without any agreements between London and Brussels. Thus, the motivation of Donald Trump is obvious to many traders and simple "viewers". EU officials have not spoken about this, only Jeremy Corbyn, who has long fallen out of favor with Trump and is Johnson's main opposition opponent, has several times declared Trump's unhealthy interest in diverging the ways of the UK and the EU. Now, finally, comments from the European Union followed, where European Council President Donald Tusk said in an interview that the US leader openly welcomes Britain's exit from the EU. The question is why? In addition to this, Tusk calls Europe a "trade enemy" and questions the value of NATO. According to Tusk, "for the first time in history, the American president openly supports the collapse of the European Union, and for the EU this is perhaps the most difficult challenge." This concern of Tusk is also of concern to traders. Firstly, this wording from the President of the European Council significantly increases the likelihood of a trade war between the European Union and the United States, which is currently paused due to the ongoing trade war between the United States and China. However, in the future, it will be quite possible to expect a conflict between Brussels and Washington. Secondly, EU leaders themselves do not hide their attitude towards the American president and, consequently, towards America itself, which, in their opinion, as in China's opinion, often "gets into trouble." At the same time, Christine Lagarde declares that confidence in the euro is now at maximum values. About 76% of Europeans support the idea of a single currency, and, according to Ms. Lagarde, this is the cement that holds our economic space together. Given the complication of relations with America and the possible loss of Britain, the EU really needs to remain as united as possible. Forecast on EUR / USD and recommendations to traders: On November 28, traders can continue to move the pair up, in favor of this, there are rebounds from the Fibo level of 61.8% and bullish divergence. I consider the information background to be quite strong, but, unfortunately, the activity of traders remains very low. Thus, I recommend further selling the pair if consolidation occurs under the correction level of 61.8% with a target of Fibo level of 76.4% - 1.0952. The Fibo grid was built at the extremes of October 1, 2019, and October 21, 2019. The material has been provided by InstaForex Company - www.instaforex.com |


| You are subscribed to email updates from Forex analysis review. To stop receiving these emails, you may unsubscribe now. | Email delivery powered by Google |
| Google, 1600 Amphitheatre Parkway, Mountain View, CA 94043, United States | |
No comments:
Post a Comment