
Forex analysis review |
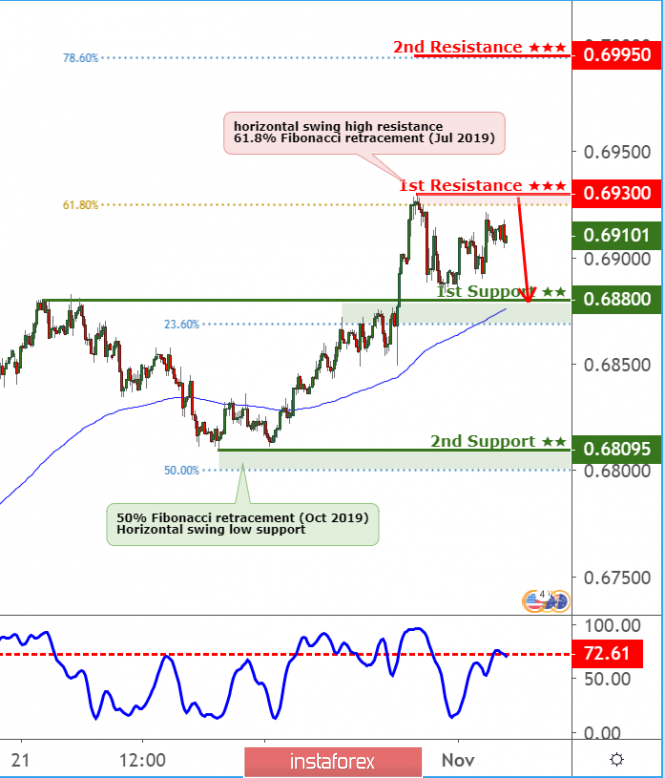
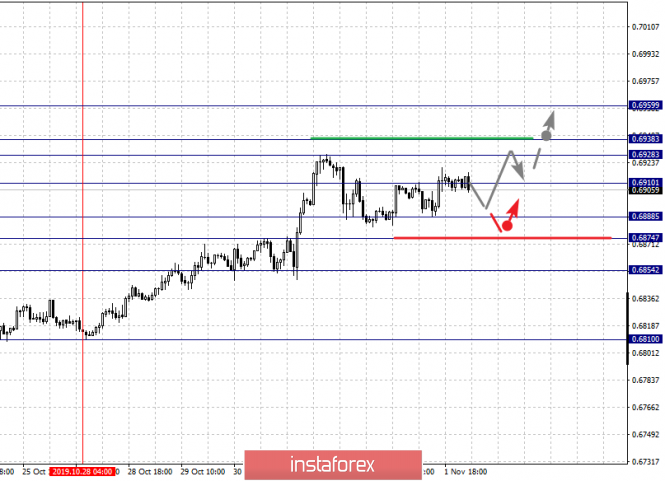
- AUDUSD pullback below resistance
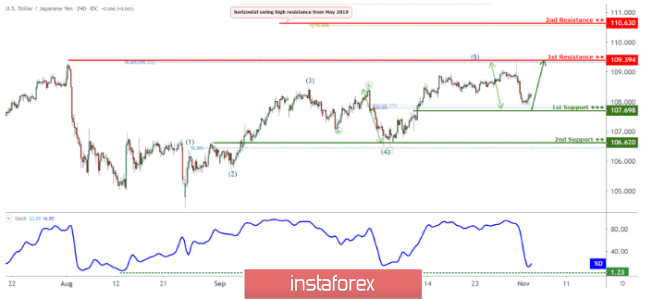
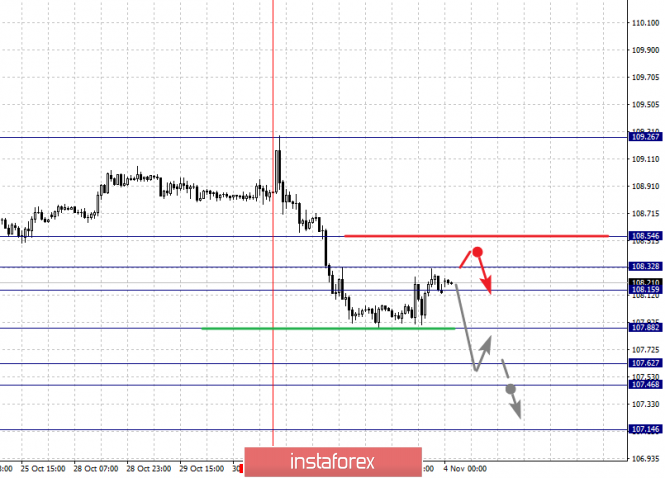
- USDJPY to reach 1st support at 107.69, potential to bounce!
- GBPUSD approaching support, potential bounce!
- Fractal analysis of the main currency pairs on November 4
- Control zones EURUSD 11/04/19
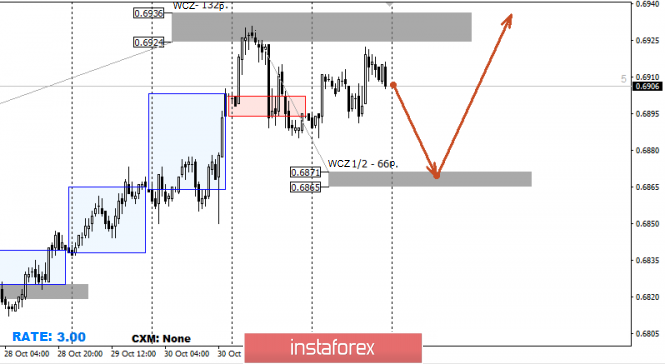
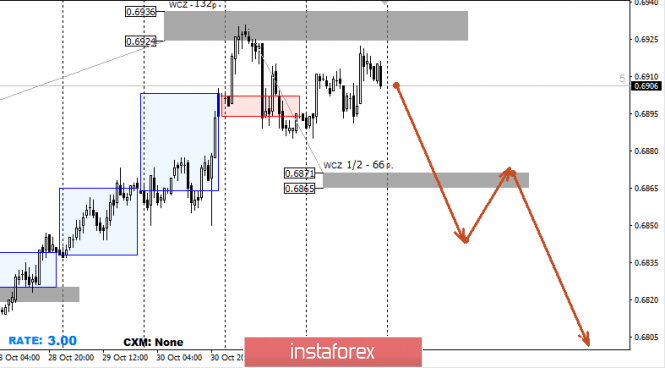
- Control zones AUDUSD 11/4/19
| AUDUSD pullback below resistance Posted: 03 Nov 2019 05:34 PM PST
Entry: 0.69300 61.8% Fibonacci retracement Take Profit : 0.6880 Why it's good : 23.6% Fibonacci retracement. The material has been provided by InstaForex Company - www.instaforex.com |
| USDJPY to reach 1st support at 107.69, potential to bounce! Posted: 03 Nov 2019 05:30 PM PST
|
| GBPUSD approaching support, potential bounce! Posted: 03 Nov 2019 05:27 PM PST Entry: 1.29057 Why is it good: horizontal pullback support, 100% fibonacci extension, 38.2% fibonacci retracement Stop Loss: 1.28798 Why is it good: 50% fibonacci retracement Take Profit: 1.29672 Why is it good: 78.6% fibonacci retracement, horizontal swing high resistance The material has been provided by InstaForex Company - www.instaforex.com |
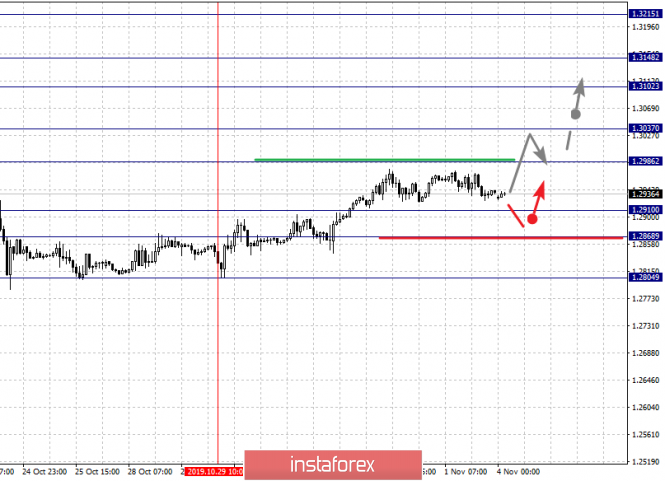
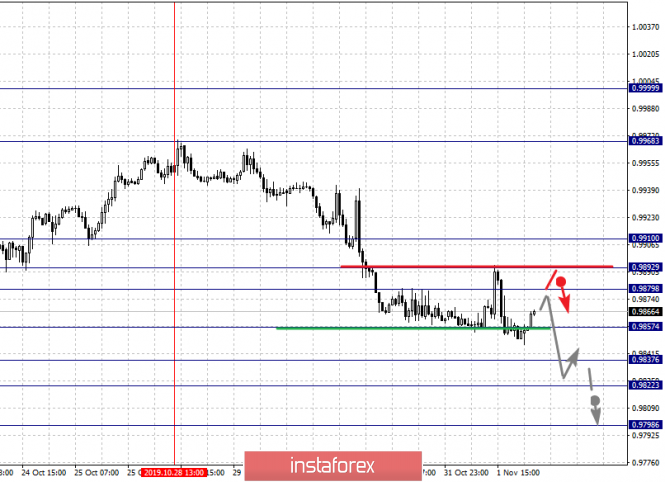
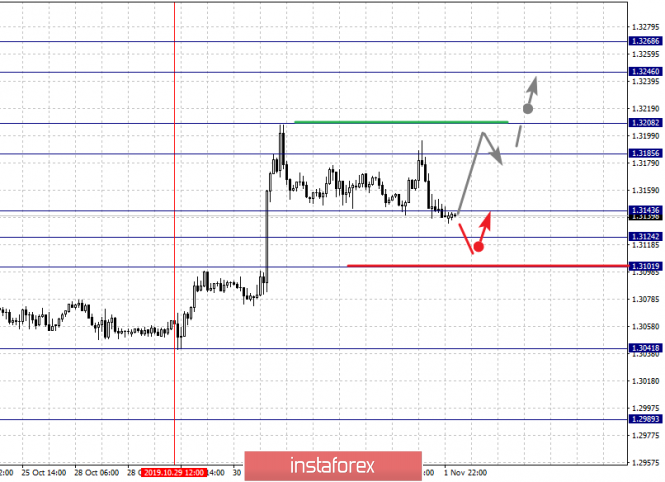
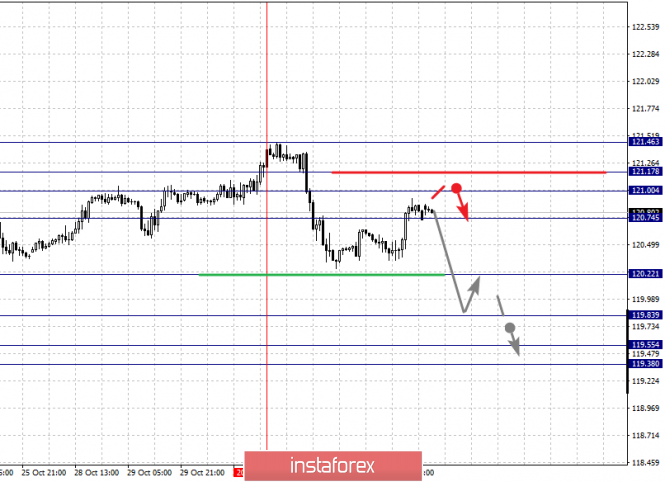
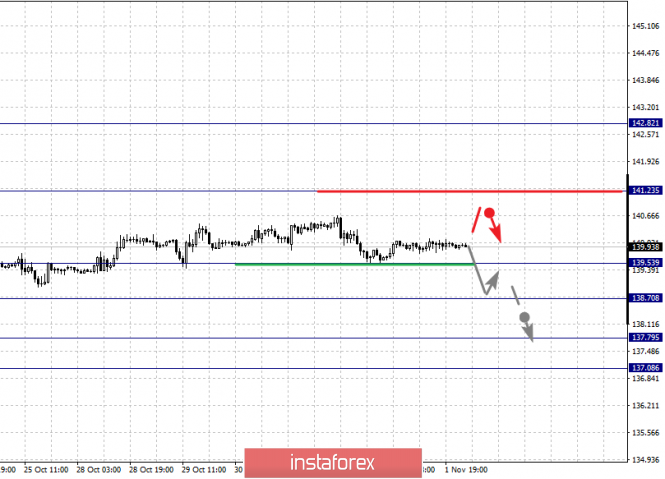
| Fractal analysis of the main currency pairs on November 4 Posted: 03 Nov 2019 05:15 PM PST Forecast for November 4: Analytical review of currency pairs on the scale of H1: For the euro / dollar pair, the key levels on the H1 scale are: 1.1251, 1.1212, 1.1198, 1.1181, 1.1140, 1.1123, 1.1096 and 1.1072. Here, the price issued a pronounced medium-term initial conditions for the top of October 29. The continuation of the movement to the top is expected after the breakdown of the level of 1.1181. In this case, the target is 1.1198. Price consolidation is in the range of 1.1198 - 1.1212. For the potential value for the top, we consider the level of 1.1251, expressed movement to which, is expected after the breakdown of the level of 1.1212. Short-term downward movement is expected in the range 1.1140 - 1.1123. The breakdown of the latter value will lead to an in-depth correction. Here, the goal is 1.1096. This level is a key support for the upward structure. The main trend is the initial conditions for the top of October 29. Trading recommendations: Buy: 1.1181 Take profit: 1.1198 Buy: 1.1212 Take profit: 1.1250 Sell: 1.1140 Take profit: 1.1125 Sell: 1.1120 Take profit: 1.1098 For the pound / dollar pair, the key levels on the H1 scale are: 1.3148, 1.3102, 1.3037, 1.2986, 1.2910, 1.2868 and 1.2804. Here, we are following the initial conditions for the top of October 29. The continuation of the movement to the top is expected after the breakdown of the level of 1.2986. In this case, the target is 1.3037. Price consolidation is near this level. The breakdown of the level of 1.3040 should be accompanied by a pronounced upward movement. Here, the target is 1.3102. For the potential value for the top, we consider the level of 1.3148. Upon reaching which, we expect consolidation, as well as a pullback to the bottom. Short-term downward movement is expected in the range of 1.2910 - 1.2868. Hence, the high probability of a reversal to the top and a breakdown of the level of 1.2868 will lead to the development of a downward trend. In this case, the potential target is 1.2804. The main trend is the upward structure of October 29 Trading recommendations: Buy: 1.2986 Take profit: 1.3035 Buy: 1.3040 Take profit: 1.3102 Sell: 1.2910 Take profit: 1.2870 Sell: 1.2865 Take profit: 1.2805 For the dollar / franc pair, the key levels on the H1 scale are: 0.9910, 0.9892, 0.9879, 0.9857, 0.9837, 0.9822 and 0.9798. Here, we are following the development of the descending structure of October 28. The continuation of the movement to the bottom is expected after the breakdown of the level of 0.9855. In this case, the target is 0.9837. Short-term downward movement, as well as consolidation is in the range of 0.9837 - 0.9822. For the potential value for the bottom, we consider the level of 0.9798. Upon reaching which, we expect a pullback to the top. Short-term upward movement is possibly in the range of 0.9879 - 0.9892. The breakdown of the last value will lead to an in-depth correction. Here, the target is 0.9910. This level is a key support for the downward structure. The main trend is the descending structure of October 28. Trading recommendations: Buy : 0.9879 Take profit: 0.9890 Buy : 0.9893 Take profit: 0.9910 Sell: 0.9855 Take profit: 0.9838 Sell: 0.9835 Take profit: 0.9822 For the dollar / yen pair, the key levels on the scale are : 108.54, 108.32, 108.15, 107.88, 107.62, 107.46 and 107.14. Here, we are following the development of the downward structure of October 30. At the moment, the price is in correction. The continuation of movement to the bottom is expected after the breakdown of the level of 107.88. In this case, the target is 107.62. Price consolidation is in the range of 107.62 - 107.46. For the potential value for the bottom, we consider the level of 107.14. Upon reaching which, we expect a rollback to the top. Consolidated movement is expected in the range of 108.15 - 108.32. The breakdown of the last value will lead to an in-depth correction. Here, the goal is 108.53. This level is a key support for the downward structure. The main trend: the downward cycle of October 30. Trading recommendations: Buy: 108.15 Take profit: 108.30 Buy : 108.33 Take profit: 108.52 Sell: 107.86 Take profit: 107.62 Sell: 107.46 Take profit: 107.15 For the Canadian dollar / US dollar pair, the key levels on the H1 scale are: 1.3268, 1.3246, 1.3208, 1.3185, 1.3143, 1.3124 and 1.3101. Here, the price forms the long-term initial conditions for the upward cycle of October 29. Short-term movement to the top is expected in the range of 1.3185 - 1.3208. The breakdown of the latter value will lead to a pronounced movement. Here, the target is 1.3246. For the potential value for the top, we consider the level of 1.3268. Upon reaching this level, we expect a pullback to the bottom. Short-term downward movement is possibly in the range of 1.3143 - 1.3124. The breakdown of the latter value will lead to an in-depth correction. Here, the target is 1.3101. This level is a key support for the upward structure. The main trend is the formation of initial conditions for the top of October 29. Trading recommendations: Buy: 1.3185 Take profit: 1.3206 Buy : 1.3209 Take profit: 1.3246 Sell: 1.3143 Take profit: 1.3126 Sell: 1.3122 Take profit: 1.3101 For the Australian dollar / US dollar pair, the key levels on the H1 scale are : 0.6959, 0.6938, 0.6928, 0.6910, 0.6888, 0.6874 and 0.6854. Here, we are following the development of the local upward cycle of October 28. The continuation of the movement to the top is expected after the breakdown of the level of 0.6910. In this case, the target is 0.6928. Price consolidation is in the range of 0.6928 - 0.6938. For the potential value for the top, we consider the level of 0.6959. Upon reaching this level, we expect a pullback to the bottom. Short-term downward movement is possibly in the range of 0.6888 - 0.6874. The breakdown of the latter value will lead to an in-depth correction. Here, the target is 0.6854. This level is a key support for the top. The main trend is the local structure for the top of October 28. Trading recommendations: Buy: 0.6910 Take profit: 0.6928 Buy: 0.6938 Take profit: 0.6959 Sell : 0.6888 Take profit : 0.6875 Sell: 0.6873 Take profit: 0.6855 For the euro / yen pair, the key levels on the H1 scale are: 121.46, 121.17, 121.00, 120.74, 120.22, 119.83, 119.55 and 119.38. Here, we monitor the downward potential of October 30. At the moment, the price is in the correction zone. The continuation of movement to the bottom is expected after the breakdown of the level of 120.22. In this case, the first goal is 119.83, before this value, we expect expressed initial conditions for the downward cycle. The breakdown of the level of 119.80 will lead to the development of the cycle. In this case, the goal is 119.55. Price consolidation is in the range of 119.55 - 119.38. Consolidated movement is expected in the range of 120.74 - 121.00, The range of 121.00 - 121.17 is the key support for the descending structure of October 30. Its passage at a price will lead to the development of an upward trend. Here, the goal is 121.46. The main trend is the downward potential of October 30. Trading recommendations: Buy: Take profit: Buy: 121.18 Take profit: 121.44 Sell: 120.20 Take profit: 119.85 Sell: 119.80 Take profit: 119.55 For the pound / yen pair, the key levels on the H1 scale are : 142.82, 141.23, 139.53, 138.70, 137.79 and 137.08. Here, the price is still in the equilibrium. The continuation of movement to the top is expected after the breakdown of the level of 141.23. In this case, the potential target is 142.82. Upon reaching which, we expect consolidation, as well as a pullback to the bottom. Short-term downward movement, as well as consolidation, are possible in the range of 139.53 - 138.70. The breakdown of the last value will lead to a long correction. Here, the target is 137.79. The range of 137.79 - 137.08 is the key support for the top. The main trend is the medium-term upward structure of October 8, the formation of potential for the downward movement of October 21. Trading recommendations: Buy: Take profit: Buy: 141.25 Take profit: 142.80 Sell: 139.50 Take profit: 138.75 Sell: 138.65 Take profit: 137.80 The material has been provided by InstaForex Company - www.instaforex.com |
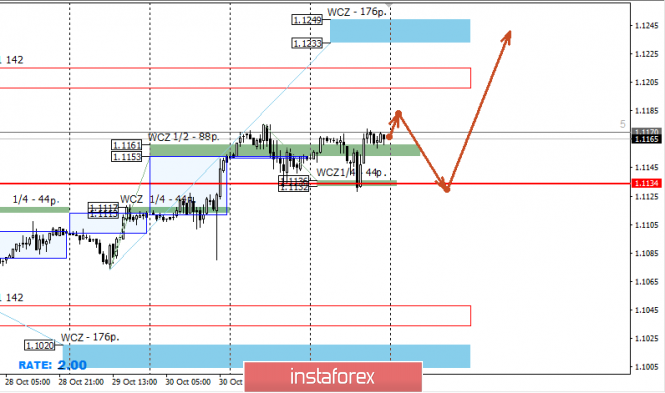
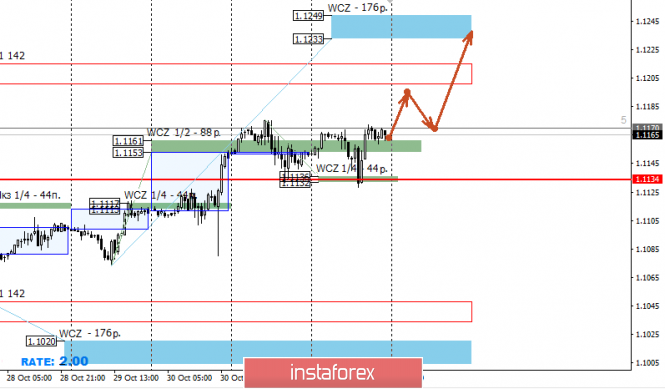
| Posted: 03 Nov 2019 04:13 PM PST At the end of last week, the defining resistance was the Weekly Control Zone 1/2 1.1161-1.1153. At the same time, the closing of trading on Friday occurred above this zone. This opens up opportunities for further growth of the pair to weekly control zone 1.1249-1.1233. The euro purchases come to the fore, however, favorable prices are located just below the level of 1.1134. At the moment, the pair is trading near the maximum of the last month, which increases the possibility of the proposal and the continuation of the formation of the accumulation zone. Work within the accumulation zone will be relevant until the closure of one of the active sessions occurs above the weekly maximum. If this happens, then the growth rate will increase and a weekly test will take one to two days. In the event of a major offer after updating the monthly maximum, the target will be the level of 1.1134, where a new priority will be determined. Daily CZ - daily control zone. The zone formed by important data from the futures market that changes several times a year. Weekly CZ - weekly control zone. The zone formed by the important marks of the futures market, which change several times a year. Monthly CZ - monthly control zone. The zone that reflects the average volatility over the past year. The material has been provided by InstaForex Company - www.instaforex.com |
| Posted: 03 Nov 2019 04:13 PM PST On Thursday, the pair tested the weekly control zone 0.6936-0.6924, which led to a halt in growth. The defining support is the Weekly Control Zone 1/2 0.6871-0.6865. As long as the pair is trading above the specified zone, the bullish movement will remain an impulse. On the other hand, purchasing with the WCZ 1/2 test is profitable, since the probability of updating the November maximum is 75%. Work between the two control zones will allow to form a flat range. This will provide an opportunity to work from weekly extremes. An alternative model will be developed if the closure of one of the next American sessions occurs below the Weekly Control Zone 1/2. This will indicate the completion of the upward impulse phase and will allow you to search for sales after the formation of the correctional model. Thus, the probability of implementing this model is 25%. Daily CZ - daily control zone. The zone formed by important data from the futures market that changes several times a year. Weekly CZ - weekly control zone. The zone formed by the important marks of the futures market, which change several times a year. Monthly CZ - monthly control zone. The zone that reflects the average volatility over the past year. The material has been provided by InstaForex Company - www.instaforex.com |
 C:\Users\user\Downloads\2019-11-04_0929.png
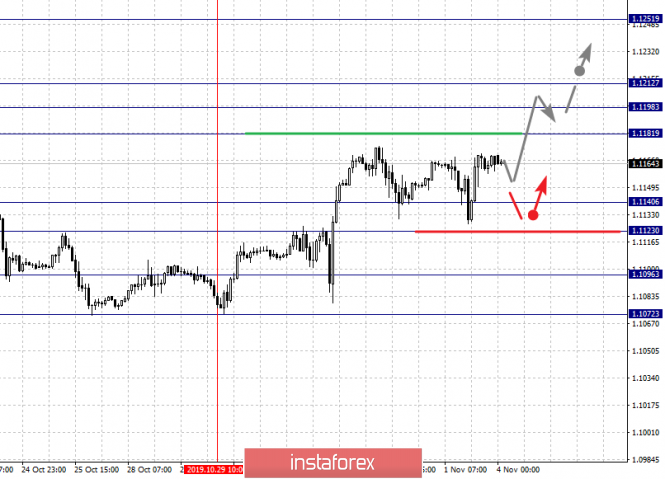
| You are subscribed to email updates from Forex analysis review. To stop receiving these emails, you may unsubscribe now. | Email delivery powered by Google |
| Google, 1600 Amphitheatre Parkway, Mountain View, CA 94043, United States | |
No comments:
Post a Comment