
Forex analysis review |
- Forecast for EUR/USD on November 8, 2019
- Forecast for GBP/USD on November 8, 2019
- Forecast for AUD/USD on November 8, 2019
- Control zones USDJPY 11/08/19
- EUR/USD approaching resistance, potential for big drop!
- USD/CAD Bullish breakout of channel!!
- USD/CHF to reach 1st resistance at 0.9971, potential to drop!
- Fractal analysis of the main currency pairs for November 8
- #USDX vs EUR / USD vs GBP / USD vs USD / JPY (H4). Comprehensive analysis of movement options from November 08, 2019 APLs
- EUR/USD. November 7. Results of the day. Industrial production in Germany sends euro to a knockout
- The dollar has faced difficulties
- GBP/USD: the pound is included in the election race
- GBPUSD. Bank of England dissidents, predictions and phlegmatic pound
- GBP/USD. November 7. Results of the day. The Bank of England is moving towards easing money
- USDJPY confirms cloud support and bounces to new higher highs
- EURUSD continues lower as price breaks 1.1070 support area
- You shouldn't be surprised with Gold's break down
- November 7, 2019 : EUR/USD Intraday technical analysis and trade recommendations.
- BTC 11.07.2019 - Broken support trendline, potential for more downside
- November 7, 2019 : GBP/USD Intraday technical analysis and trade recommendations.
- GBP/USD 11.07.2019 - Important support level at the price of 1.2800 is on the test, big decision level
- Gold 11.07.2019 - Gold near multi pivot support at $1.481-$1.476, big decision level
- The dollar risks becoming the main victim in case of resolution of the protracted trade war between the United States and
- Trading plan for EUR/USD for November 07, 2019
- GBP/USD: plan for the American session on November 7th. The Bank of England left the interest rate unchanged at 0.75%, but
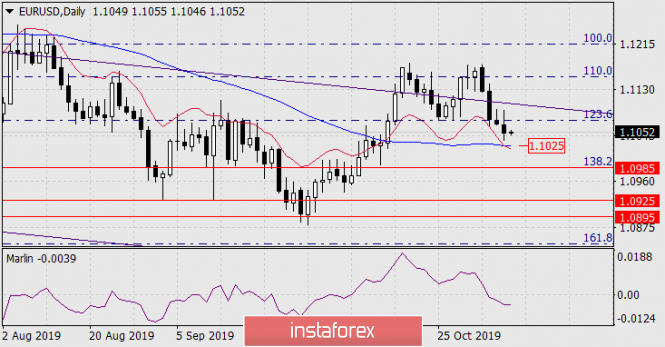
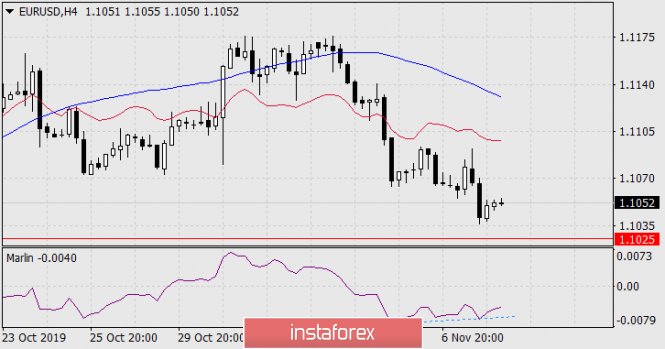
| Forecast for EUR/USD on November 8, 2019 Posted: 07 Nov 2019 07:56 PM PST EUR/USD On Thursday, the main news of the market was a statement by the Chinese authorities about the upcoming agreement with the United States of the "first stage" on the mutual abolition of prohibitions. Representatives of China announced the possible signing of the agreement within two weeks. The American side, however, has not yet confirmed or clarified either the schedule of negotiations or the scope of agreements. The euro lost 15 points at the end of the day. We have repeatedly expressed the idea that, regardless of the success of the US-Chinese negotiations, the dollar will mainly strengthen in its direction, in only one case it will grow as investors move away from risk, and in the other case on expectations of a stronger US economy. The price slightly fell yesterday to support the MACD line on the daily chart, accordingly, the 1.1025 target is postponed to today. Consolidation below the line opens the target at the Fibonacci level of 138.2% at the price of 1.0985. The Marlin oscillator in the zone of negative numbers. A slight convergence formed on the four-hour chart for Marlin. A potential correction may develop if positive economic indicators across Europe emerge. Germany's trade balance for September is projected to grow from 18.1 billion to 19.3 billion euros, France's trade balance could improve from -5.02 billion euros to -4.90 billion. The correction may stop with the release of the consumer confidence index in the US in the assessment University of Michigan - November rate is expected to rise from 95.5 to 96.0. The material has been provided by InstaForex Company - www.instaforex.com |
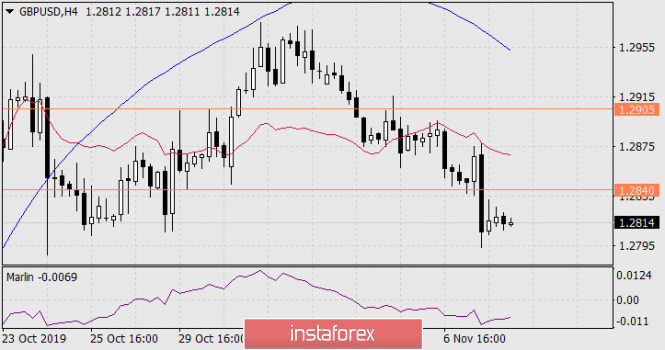
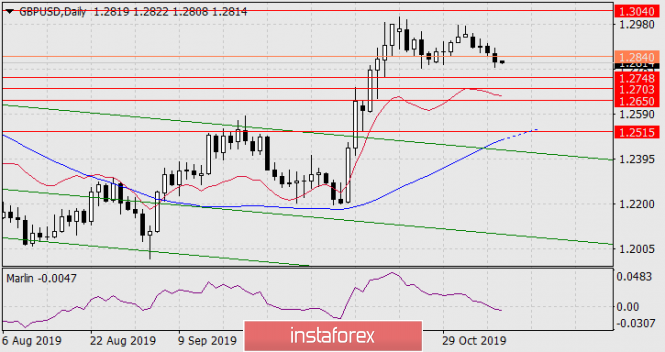
| Forecast for GBP/USD on November 8, 2019 Posted: 07 Nov 2019 07:56 PM PST GBP/USD The British pound lost 34 points yesterday on the news that two members of the Bank of England Monetary Policy Committee voted to lower the rate. The head of the BoE, Mark Carney, hastened to assure the investment community that the regulator would not change policy until there was so much uncertainty in the world, the rate could be lowered in the future for three years, and the central bank's economic forecasts, although weak, were all due to Boris Johnson's Brexit scenario. The BoE lowered next year's GDP from 1.3% to 1.2%. And even in the event of a "hard" Brexit, the regulator will not rush to adjust, preferring to wait for the reaction of the economy. The pair quotes went below the signal level of 1.2840, the signal line of the Marlin oscillator, as we expected, at the same moment has crossed the boundary of the bear territory. Target levels can be taken sequentially: 1.2748 (October 17 low), 1.2703 (October 11 high), 1.2650 (October 14 high). On the four-hour chart, a decrease in the price is expected for all indicators, there are no signs of a reversal or deep correction. The material has been provided by InstaForex Company - www.instaforex.com |
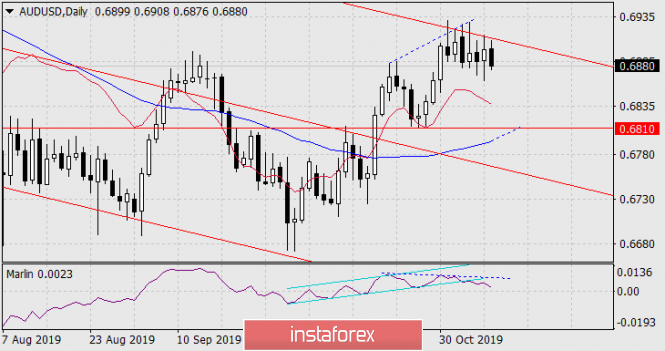
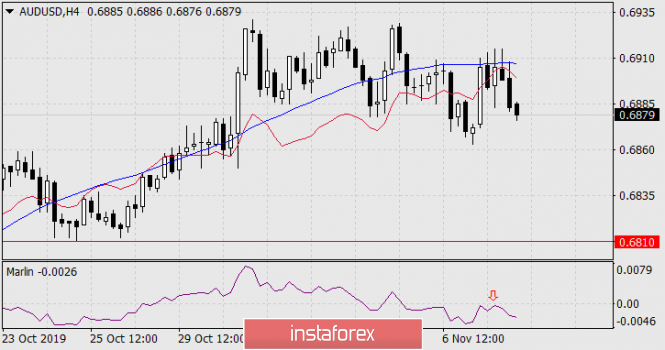
| Forecast for AUD/USD on November 8, 2019 Posted: 07 Nov 2019 07:45 PM PST AUD/USD Over the past two days, the technical picture of the Australian dollar has strengthened the reversal conditions to fall to the nearest target at 0.6810 - to the level where the MACD line of the daily scale can meet, the price and lows on October 24-28. First of all, this gain is expressed by the output of the signal line of the Marlin oscillator from its own upward channel (azure). Marlin divergence has been strengthened. Also, the price, having tested the price channel line yesterday (probably for the last time), turned down from it. On the four-hour chart, the price of growth was kept by the MACD line, there was a downward reversal. Synchronously with it, the signal line of the Marlin oscillator turned around from the boundary with the growth territory. We are waiting for the aussie at the target level of 0.6810.  |
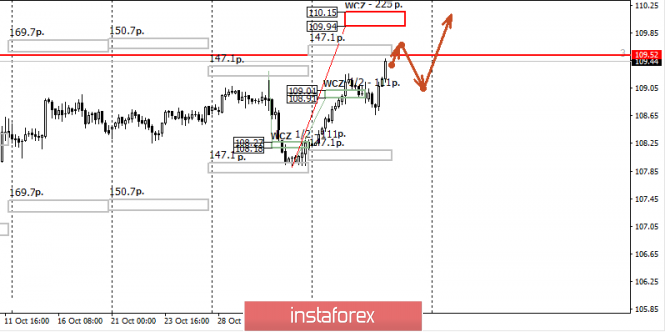
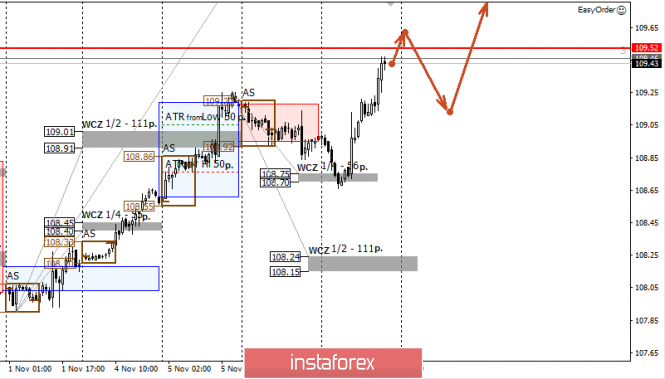
| Posted: 07 Nov 2019 07:32 PM PST On November 7, the pair tested the Weekly Control Zone 1/4 108.75-108.70, which allowed them to enter the purchase. The target for growth is the weekly control zone 110.15-109.94. Reaching this zone will allow you to close most of the purchases, and transfer the balance to breakeven. Thus, it is important to understand that the middle course zone, which is above the level of 109.52, will become an obstacle this week, so the implementation of the priority model may happen next week. With the test level of 109.52, it is possible to partially fix the position, because on Friday, there will be an expiration of option contracts, which can increase the volatility in the market. This will form a corrective downward pattern. This correction may become protracted and will provide an opportunity to get favorable prices for repeated purchases. It is important to understand that the probability of continued growth is above 70%. This makes purchases profitable, but purchases require a reduction in price and moving it away from the average weekly move. Daily CZ - daily control zone. The zone formed by important data from the futures market that changes several times a year. Weekly CZ - weekly control zone. The zone formed by the important marks of the futures market, which change several times a year. Monthly CZ - monthly control zone. The zone that reflects the average volatility over the past year. The material has been provided by InstaForex Company - www.instaforex.com |
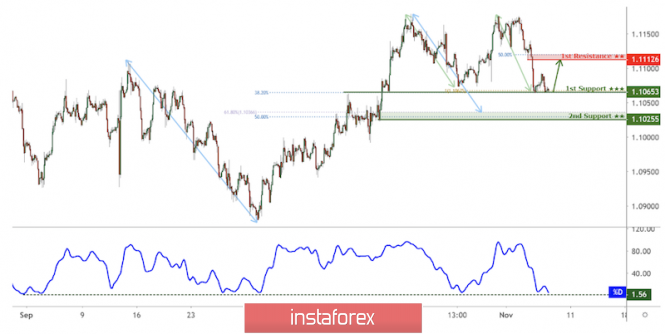
| EUR/USD approaching resistance, potential for big drop! Posted: 07 Nov 2019 06:42 PM PST Price is approaching our first resistance at 1.10654 where we are expecting a drop to our first support level at 1.09994 Entry: 1.10654 Previous breakout level, 23.6% Fibonacci retracement Take Profit : 1.09994 Why it's good : 61.8% Fibonacci retracement, 78.6% Fibonacci extension, horizontal pullback support
 |
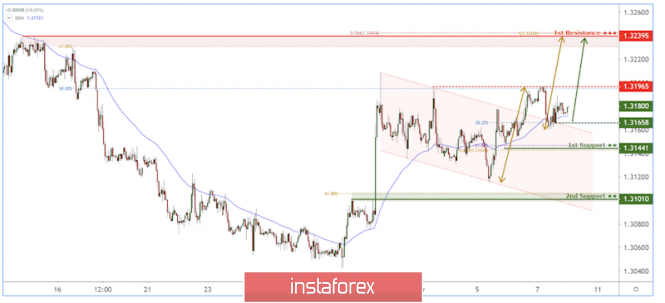
| USD/CAD Bullish breakout of channel!! Posted: 07 Nov 2019 06:41 PM PST USDCAD broke out of channel to the upside. Bullish above support at 1.31441 Entry: 1.31658 38.2% Fibonacci retracement, channel pullback support Take Profit : 1.32395 Why it's good : 61.8% Fibonacci retracement, 100% Fibonacci extension
 |
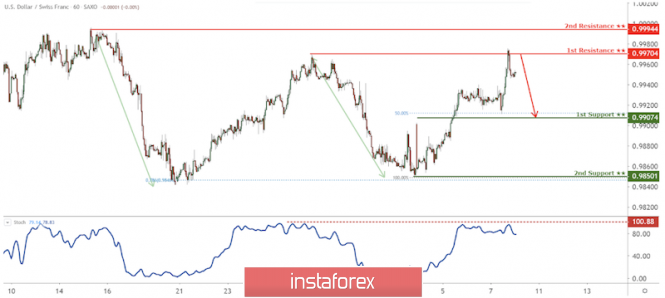
| USD/CHF to reach 1st resistance at 0.9971, potential to drop! Posted: 07 Nov 2019 06:39 PM PST Entry: 0.9970 Why it's good: Horizontal swing high resistance Take Profit : 0.9907 Why it's good : horizontal overlap support 50% Fibonacci retracement
 |
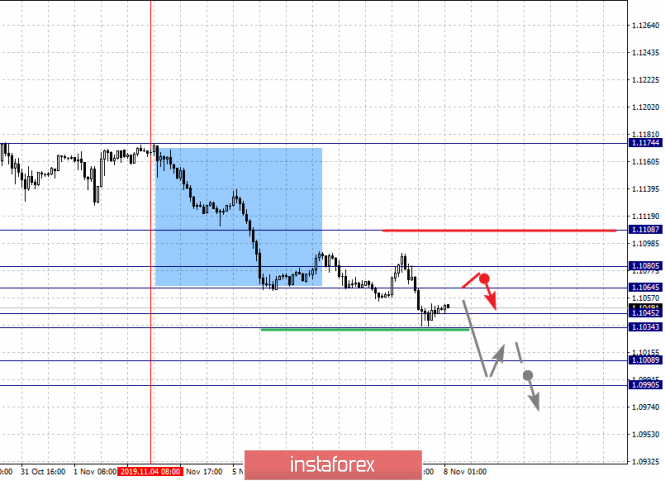
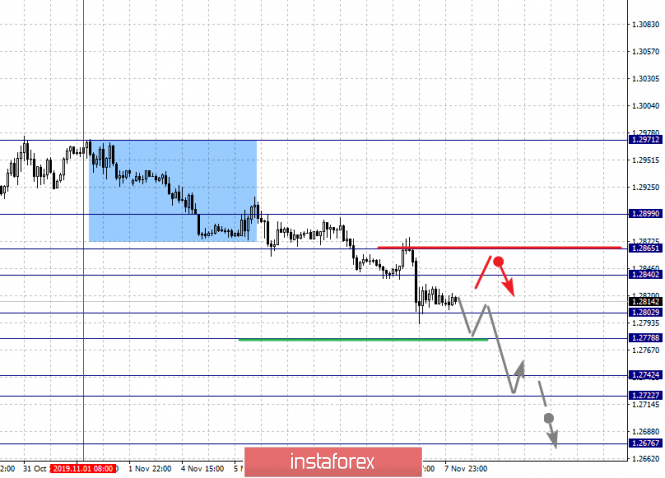
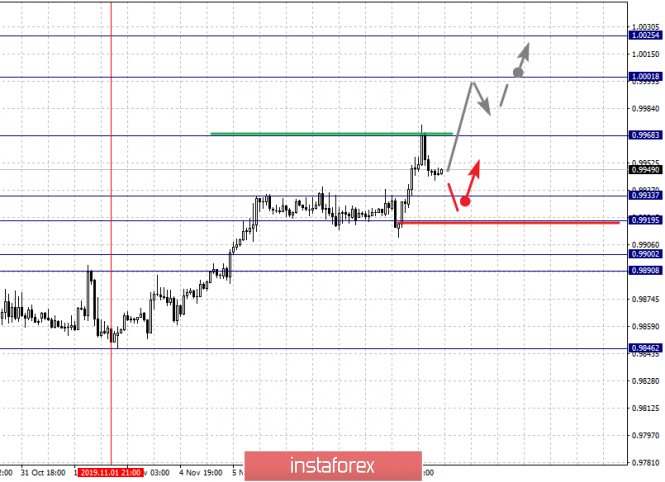
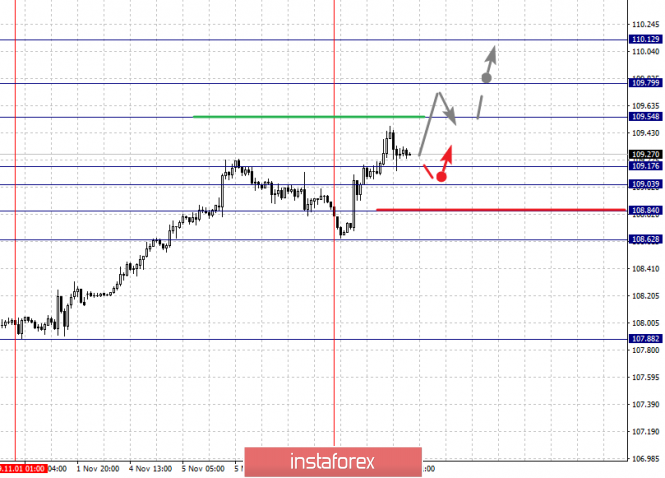
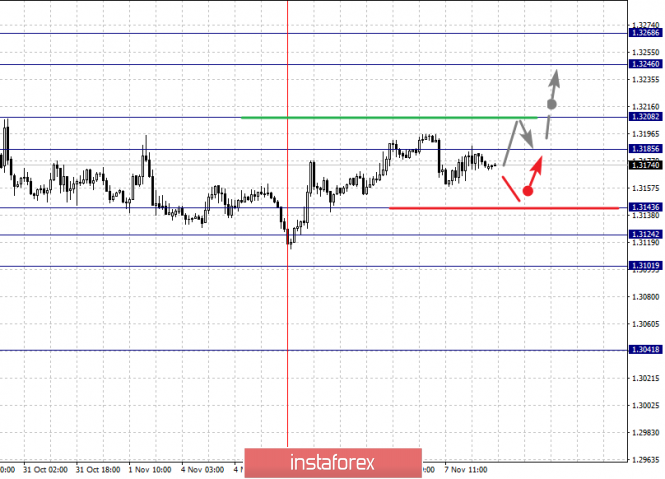
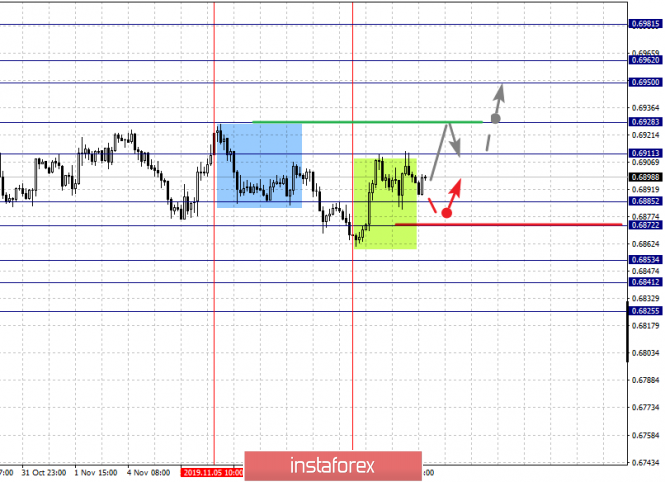
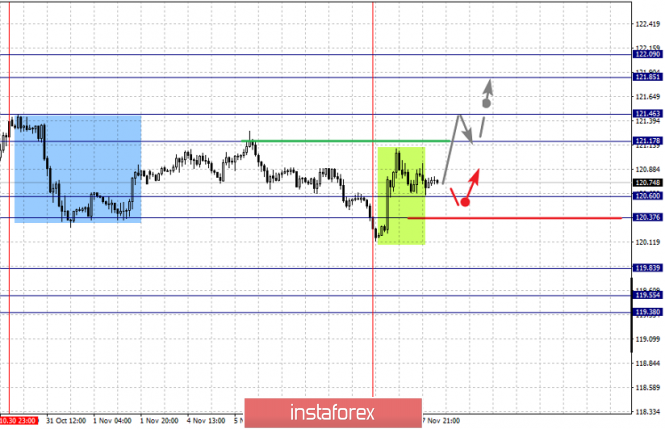
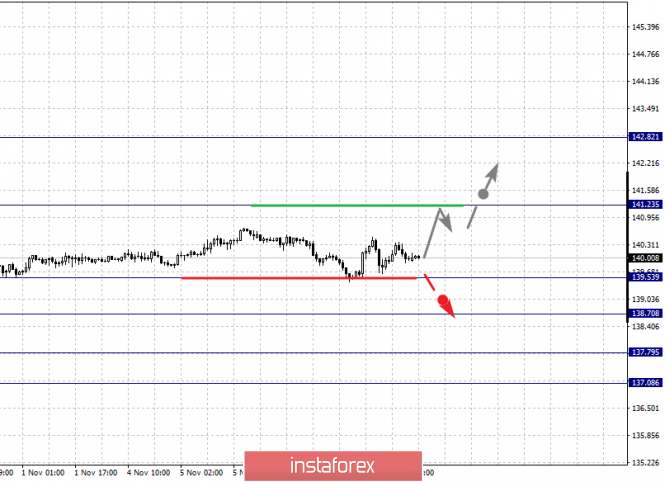
| Fractal analysis of the main currency pairs for November 8 Posted: 07 Nov 2019 05:07 PM PST Forecast for November 8: Analytical review of currency pairs on the scale of H1: For the euro / dollar pair, the key levels on the H1 scale are: 1.1108, 1.1080, 1.1064, 1.1045, 1.1034, 1.1008 and 1.0990. Here, we are following the development of the downward cycle of November 4. The continuation of the movement to the bottom is expected after the price passes the noise range 1.1045 - 1.1034. In this case, the target is 1.1008. For the potential value for the bottom, we consider the level of 1.0990. Upon reaching this value, we will consider the downward structure of November 4 as a medium-term. Short-term upward movement is expected in the range 1.1064 - 1.1080. The breakdown of the latter value will lead to an in-depth correction. Here, the target is 1.1108. This level is a key support for the downward structure. The main trend is the downward structure of November 4. Trading recommendations: Buy: 1.1065 Take profit: 1.1080 Buy: 1.1082 Take profit: 1.1106 Sell: 1.1032 Take profit: 1.1010 Sell: 1.1008 Take profit: 1.0990 For the pound / dollar pair, the key levels on the H1 scale are: 1.2899, 1.2865, 1.2840, 1.2802, 1.2778, 1.2742, 1.2722 and 1.2676. Here, we are following the downward cycle of November 1. Short-term downward movement is expected in the range 1.2802 - 1.2778. The breakdown of the last value should be accompanied by a pronounced downward movement. Here, the target is 1.2742. Price consolidation is in the range of 1.2742 - 1.2722 . For the potential value for the bottom, we consider the level of 1.2676. The movement to this level is expected after the breakdown of the level of 1.2722. Short-term upward movement is expected in the range of 1.2840 - 1.2865. The breakdown of the latter value will lead to an in-depth correction. Here, the target is 1.2899. This level is a key support for the downward structure. The main trend is the downward structure of November 1. Trading recommendations: Buy: 1.2840 Take profit: 1.2865 Buy: 1.2867 Take profit: 1.2897 Sell: 1.2802 Take profit: 1.2780 Sell: 1.2776 Take profit: 1.2743 For the dollar / franc pair, the key levels on the H1 scale are: 1.0025, 1.0001, 0.9968, 0.9933, 0.9919, 0.9900 and 0.9890. Here, we are following the medium-term ascending structure of November 1. The continuation of the movement to the top is expected after the breakdown of the level of 0.9940. In this case, the target is 0.9968. Price consolidation is near this level. The breakdown of the level of 0.9968 will lead to a pronounced movement. Here, the target is 1.0001. We consider the level of 1.0025 to be a potential value for the top. Upon reaching this level, we expect a pullback to the bottom. Short-term downward movement is possibly in the range 0.9933 - 0.9919. The breakdown of the last value will lead to an in-depth correction. Here, the target is 0.9900. The range 0.9900 - 0.9890 is the key support. The main trend is the medium-term upward structure from November 1. Trading recommendations: Buy : 0.9970 Take profit: 1.0000 Buy : 1.0002 Take profit: 1.0025 Sell: 0.9933 Take profit: 0.9920 Sell: 0.9917 Take profit: 0.9900 For the dollar / yen pair, the key levels on the scale are : 110.12, 109.79, 109.54, 109.17, 109.03, 108.84 and 108.62. Here, we determined the next goals from the local ascending structure on November 7. The continuation of the movement to the top is expected after the breakdown of the level of 109.54. In this case, the target is 109.79. Price consolidation is near this level. For the potential value for the top, we consider the level of 110.12. Short-term downward movement is expected in the range of 109.17 - 109.03. The breakdown of the last value will lead to an in-depth correction. Here, the target is 108.84. This level is a key support for the local upward structure. Its breakdown will lead to a movement to the first potential target - 108.62. The main trend: the upward cycle of November 1, the local structure of November 7. Trading recommendations: Buy: 109.55 Take profit: 109.77 Buy : 109.80 Take profit: 110.10 Sell: 109.03 Take profit: 108.85 Sell: 108.82 Take profit: 108.62 For the Canadian dollar / US dollar pair, the key levels on the H1 scale are: 1.3268, 1.3246, 1.3208, 1.3185, 1.3143, 1.3124 and 1.3101. Here, we are following the medium-term upward structure from October 29, as well as the local structure for the top from November 5. Short-term movement to the top is expected in the range of 1.3185 - 1.3208. The breakdown of the latter value will lead to a pronounced movement. Here, the target is 1.3246. For the potential value for the top, we consider the level of 1.3268. Upon reaching this level, we expect a pullback to the bottom. Short-term downward movement is possibly in the range of 1.3143 - 1.3124. The breakdown of the latter value will lead to an in-depth correction. Here, the target is 1.3101. This level is a key support for the upward structure. The main trend is the medium-term initial conditions for the upward movement of November 29. Trading recommendations: Buy: 1.3185 Take profit: 1.3206 Buy : 1.3209 Take profit: 1.3246 Sell: 1.3143 Take profit: 1.3126 Sell: 1.3122 Take profit: 1.3101 For the Australian dollar / US dollar pair, the key levels on the H1 scale are : 0.6981, 0.6962, 0.6950, 0.6928, 0.6911, 0.6885, 0.6872, 0.6853, 0.6841 and 0.6825. Here, the price is in equilibrium: the downward structure from November 5, as well as the upward potential from November 7. The development of the ascending structure is expected after the breakdown of the level of 0.6911. Here, the target is 0.6928. Price consolidation is near this level. The breakdown of the level of 0.6928 should be accompanied by a pronounced upward movement. In this case, the target is 0.6950. Price consolidation is in the range of 0.6950 - 0.6962. For the potential value for the top, we consider the level of 0.6981. Upon reaching this value, we expect a pullback to the bottom Short-term downward movement is possibly in the range of 0.6885 - 0.6872. The breakdown of the latter value will lead to the development of a downward trend. Here, the target is 0.6853. Price consolidation is in the range of 0.6853 - 0.6841. For the potential value for the bottom, we consider the level of 0.6825. The main trend is the equilibrium situation. Trading recommendations: Buy: 0.6911 Take profit: 0.6926 Buy: 0.6930 Take profit: 0.6950 Sell : 0.6885 Take profit : 0.6873 Sell: 0.6870 Take profit: 0.6855 For the euro / yen pair, the key levels on the H1 scale are: 122.09, 121.85, 121.46, 121.17, 120.60, 120.37, 119.83, 119.55 and 119.38. Here, the price registered the potential for the top of November 7. The development of this structure is expected after the breakdown of the level of 121.17. In this case, the target is 121.46. Price consolidation is near this level. The breakdown of the level of 121.47 will lead to a pronounced movement. Here, the goal is 121.85. For the potential value for the top, we consider the level of 122.09. Short-term downward movement is expected in the range of 120.60 - 120.37. The breakdown of the latter value will lead to the subsequent development of the downward structure of October 30. Here, the goal is 119.83. For the potential value for the bottom, we consider the level of 119.38, and near which, we expect a consolidated movement. The main trend is the downward potential of October 30, the potential for the top of November 7. Trading recommendations: Buy: 121.17 Take profit: 121.44 Buy: 121.47 Take profit: 121.85 Sell: 120.60 Take profit: 120.40 Sell: 120.35 Take profit: 119.85 For the pound / yen pair, the key levels on the H1 scale are : 142.82, 141.23, 139.53, 138.70, 137.79 and 137.08. Here, the price is still in the equilibrium. The continuation of movement to the top is expected after the breakdown of the level of 141.23. In this case, the potential target is 142.82. Upon reaching which, we expect consolidation, as well as a pullback to the bottom. Short-term downward movement, as well as consolidation, are possible in the range of 139.53 - 138.70. The breakdown of the last value will lead to a long correction. Here, the target is 137.79. The range of 137.79 - 137.08 is the key support for the top. The main trend is the medium-term upward structure from October 8, the formation of potential for the downward movement from October 21. Trading recommendations: Buy: Take profit: Buy: 141.25 Take profit: 142.80 Sell: 139.50 Take profit: 138.75 Sell: 138.65 Take profit: 137.80 The material has been provided by InstaForex Company - www.instaforex.com |
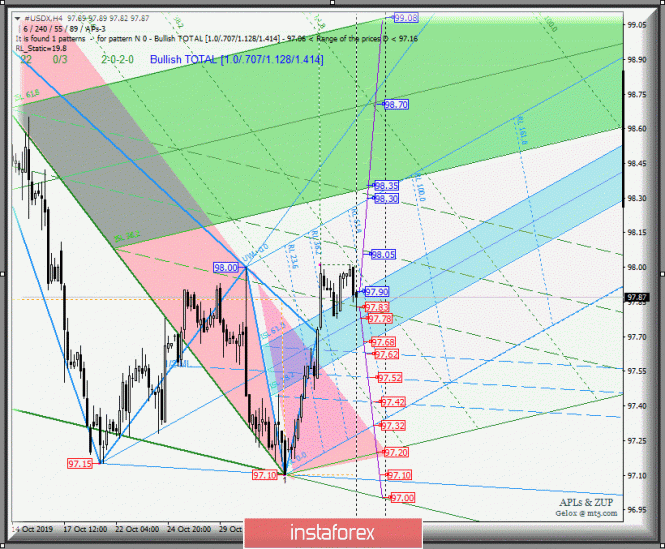
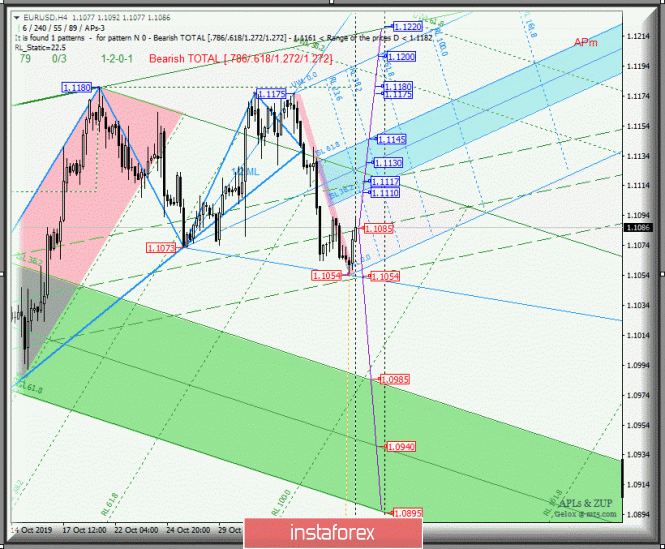
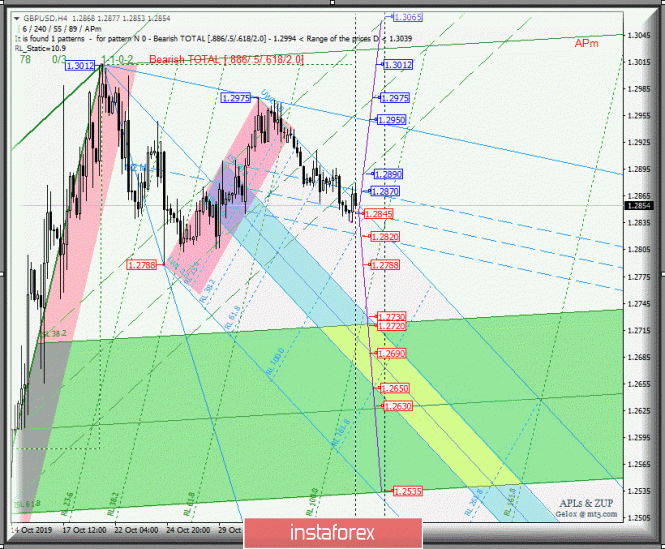
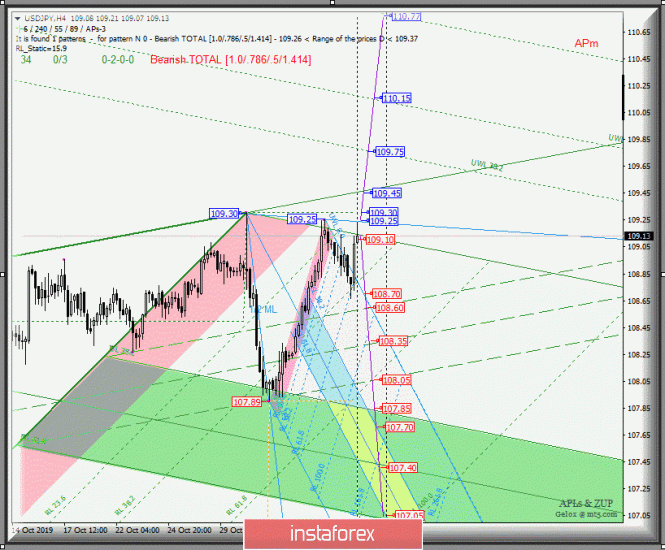
| Posted: 07 Nov 2019 04:26 PM PST Let me bring to your attention a comprehensive analysis of movement options (h4 timeframe) of currency instruments - #USDX, EUR / USD, GBP / USD and USD / JPY from November 08, 2019 ____________________ US dollar index Starting from November 08, 2019, the development of the #USDX dollar index movement will be determined by the development and direction of the breakdown of the equilibrium zones (97.90 - 97.78 - 97.68) of the Minuette operational scale. Look at the chart for details. The breakdown of the resistance level of 97.90 at the upper boundary of ISL61.8 of the equilibrium zone of the Minuette operational scale forks will determine the continuation of the development of the upward movement dollar index to targets - 1/2 Median Line Minuette (98.05) - the upper boundary of the 1/2 Median Line Minuette channel (98.30) with the prospect of reaching the boundaries of the equilibrium zone (98.35 - 98.70 - 99.08) of the Minuette operational scale forks On the contrary, the breakdown of the support level of 97.68 at the lower boundary of the ISL38.2 of the Minuette operational scale forks will direct the movement #USDX to the boundaries of the 1/2 Median Line Minuette channel (97.62 - 97.52 - 97.42) with the prospect of reaching the initial SSL Minuette line (97.32). The details of the #USDX movement are presented in the animated chart. ____________________ Euro vs US dollar The development of the movement of the single European currency EUR / USD from November 08, 2019 will be determined by the development and direction of the breakdown of the boundaries 1/2 Median Line channel (1.1117 - 1.1085 - 1.1054) of the Minuette operational scale forks. The details of this movement are shown on chart. The breakdown of the support level of 1.1054 will make it possible to develop the downward movement of EUR / USD which can be continued to the boundaries of the equilibrium zone (1.0985 - 1.0940 - 1.0895 ) of the Minuette operational scale forks. In case of breakdown of the upper boundary of the 1/2 Median Line channel (resistance level of 1.1117) of the Minuette operational scale forks, the development of the EUR / USD movement will continue in the equilibrium zone (1.1110 - 1.1130 - 1.1145) of the Minuette operational scale forks, while in case of breakdown ISL61.8 Minuette (1.1145) the upward movement of this instrument will be directed to the maximum`s (1.1175 - 1.1180). The details of the EUR / USD movement options are shown on the chart. ____________________ Great Britain pound vs US dollar From November 8, 2019, the development of Her Majesty's GBP / USD currency movement will depend on the development and direction of the breakdown of the 1/2 Median Line (1.2870 - 1.2845 - 1.2820) of the Minuette operational scale forks. The movement details inside 1/2 ML channel are presented in the chart. In case of breakdown of the lower boundary of the 1/2 Median Line Minuette channel (support level of 1.2820) the downward movement of GBP / USD can continue to the boundaries of the equilibrium zones of the Minuette operational scale forks (1.2730 - 1.2690 - 1.2650) and Minuette (1.2720 - 1.2630 - 1.2535). Combined breakdown of resistance levels : - 1.2870 (the upper boundary of the 1/2 Median Line channel of the Minuette operational scale forks); - 1.2890 (lower boundary of the 1/2 Median Line Minuette channel); will make the development of Her Majesty's currency movement relevant within the boundaries of the 1/2 Median Line channel (1.2890 -1.2975 - 1.3065) of the Minuette operational scale forks. The details of the GBP / USD movement can be seen at the chart.. ____________________ US dollar vs Japanese yen Further development of the USD / JPY currency movement of the "country of the rising sun" from November 08, 2019 will be determined by the direction of the breakdown of the range : - resistance level of 109.25 (control line UTL of the Minuette operational scale forks); - support level of 109.10 (the initial line of SSL forks of the Minuette operational scale forks). The breakdown of the UTL control line (resistance level of 109.25) of the Minuette operational scale forks, followed by updating the maximum 109.30 and breakdown of the UTL Minuette control line (109.45) will determine the continuation of the development of the upward movement of USD / JPY to the warning lines - UWL38.2 (109.75) - UWL61.8 (110.75) of the Minuette operational scale forks. In case of breakdown of the SSL start line (support level of 109.10) of the Minuette operational scale forks, the development of the USD / JPY movement will be directed to the SSL start line (108.70) of the Minuette operational scale forks and the boundaries of the 1/2 Median Line Minuette channel (108.60 - 108.35 - 108.05) with the prospect of reaching the upper boundary of ISL38.2 (107.85) equilibrium zone of the Minuette operational scale forks. We look at the details of the USD / JPY movement on the chart. ____________________ The review is made without taking into account the news background. Thus, the opening of trading sessions of the main financial centers does not serve as a guide to action (placing orders "sell" or "buy"). The formula for calculating the dollar index : USDX = 50.14348112 * USDEUR0.576 * USDJPY0.136 * USDGBP0.119 * USDCAD0.091 * USDSEK0.042 * USDCHF0.036. where the power coefficients correspond to the weights of the currencies in the basket: Euro - 57.6% ; Yen - 13.6% ; Pound Sterling - 11.9% ; Canadian dollar - 9.1%; Swedish krona - 4.2%; Swiss franc - 3.6%. The first coefficient in the formula leads the index to 100 at the start date of the countdown - March 1973, when the main currencies began to be freely quoted relative to each other. The material has been provided by InstaForex Company - www.instaforex.com |
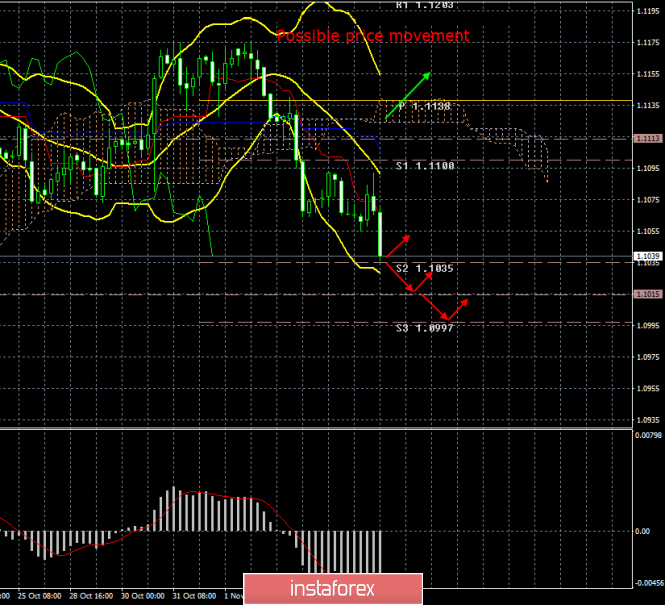
| EUR/USD. November 7. Results of the day. Industrial production in Germany sends euro to a knockout Posted: 07 Nov 2019 03:07 PM PST 4-hour timeframe Amplitude of the last 5 days (high-low): 44p - 44p - 51p - 76p - 28p. Average volatility over the past 5 days: 49p (average). The fourth trading day of the week was again in a downward movement for the EUR/USD pair. The pair tried to start a new round of upward correction at the beginning of the European trading session, but very soon the mood of traders changed to a downward one. We have already said that now the general economic picture and technical factors speak in favor of continuing the fall of the euro and the growth of the US dollar. The bulls showed extreme weakness after October 21, and the bears simply waited for their moment and calmly moved to new short positions. The euro/dollar has already fallen to the second support level of 1.1035 today. A price rebound from this level may trigger a round of corrective movement, but there are still no prerequisites for the start of an upward trend or strong growth of the European currency. The only macroeconomic report of the day - industrial production in Germany - can be confidently called a secondary report. Firstly, even a report on industrial production in the entire eurozone could never be called a report of the first degree of significance. Secondly, this is just one country out of 27, one indicator out of 27, of which the total indicator for the EU is formed. However, it has long been known to everyone that the German economy is the locomotive of the European Union. If industrial production is reduced by 4.0% in September, and by 4.3% in October, this means that the problems are not only in Germany, but throughout the European Union. The most optimistic forecasts predicted a decline of 2.9%. As you can see, they were not destined to come true. Thus, the fall of the euro on November 7 is absolutely justified. At the same time, the European Commission significantly, from our point of view, lowered its forecasts for GDP and inflation for 2019, 2020 and 2021. According to the organization's report, in 2019, eurozone GDP will increase by 1.1% (previously + 1.2% YOY), and in the next two years, growth will amount to 1.2%. According to the same report, the main reasons for the decline in forecasts and, in fact, the slowdown in all macroeconomic indicators of the EU lie in trade tension between China and the United States, which has a pronounced negative reflection on the entire world trade, as well as in geopolitical uncertainty. It is expected that global GDP growth will remain weak, respectively, the stability of the EU economy will depend more on the domestic market. The state of the domestic market will depend on the labor market and financial conditions. As for inflation, it is expected that this year it will not exceed 1.2% YOY, in the next two years it may accelerate to +1.3%. What can I say? Regarding inflation ... We recall that the target inflation rate of the ECB is 2.0% and the unattractiveness of the euro in global currency markets is already becoming clear. We look at the current inflation rate (+ 0.7% YOY) and understand that the indicator may significantly fall short even before the forecasts of the European Commission. We look at the current parameters of the ECB monetary policy and understand that it is becoming more and more difficult to stimulate the economy, as there are not so many tools for this. What should the regulator do next? To further reduce the key rate? Further expand the quantitative easing program? Apply a helicopter money policy? All these questions can now be addressed to Christine Lagarde. But the question "why the euro is falling and will it fall in the future?" can be answered by almost any trader. The hope of salvation, as usual, lies somewhere overseas. It is the United States that has to significantly worsen their macroeconomic indicators, lower the Federal Reserve rate to a negative value, print dollars in tons to overtake the EU economy in weaknesses. It is in this case that we can expect a strong strengthening of the European currency against the American one. But since such an outcome is not expected in the near future, it is likely that the decline will continue slowly but surely. From a technical point of view, all indicators are directed downward, which indicates a downward trend. This week, even hypothetically, due to what the mood of traders will change to the upward. Not a single report will be published today. The University of Michigan consumer confidence index (preliminary value) will be released tomorrow. Trading recommendations: EUR/USD continues to move down. Thus, it is now recommended to sell the currency pair with targets of 1.1035, 1.1015 and 1.0997. Turning the MACD indicator up may indicate a round of correction, but it seems that traders are set for large and long-term sales of the euro, so a strong correction is not expected. It is recommended to return to purchases of the euro currency no earlier than the bulls breaking the Kijun-sen critical line. Explanation of the illustration: Ichimoku indicator: Tenkan-sen is the red line. Kijun-sen is the blue line. Senkou Span A - light brown dotted line. Senkou Span B - light purple dashed line. Chikou Span - green line. Bollinger Bands Indicator: 3 yellow lines. MACD indicator: Red line and bar graph with white bars in the indicator window. Support / Resistance Classic Levels: Red and gray dotted lines with price symbols. Pivot Level: Yellow solid line. Volatility Support / Resistance Levels: Gray dotted lines without price designations. Possible price movement options: Red and green arrows. The material has been provided by InstaForex Company - www.instaforex.com |
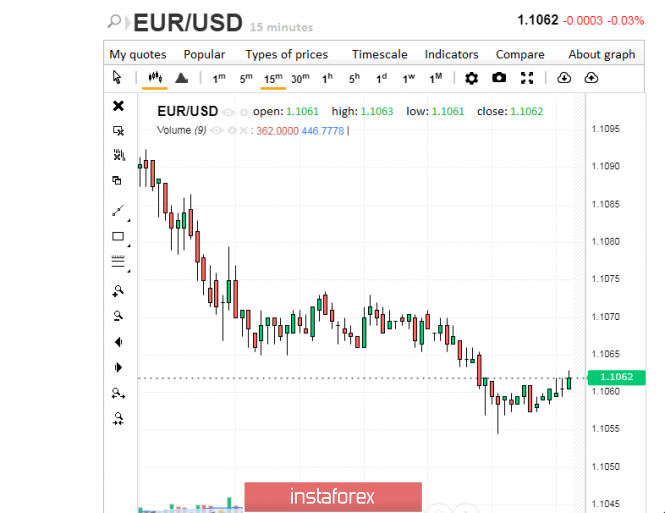
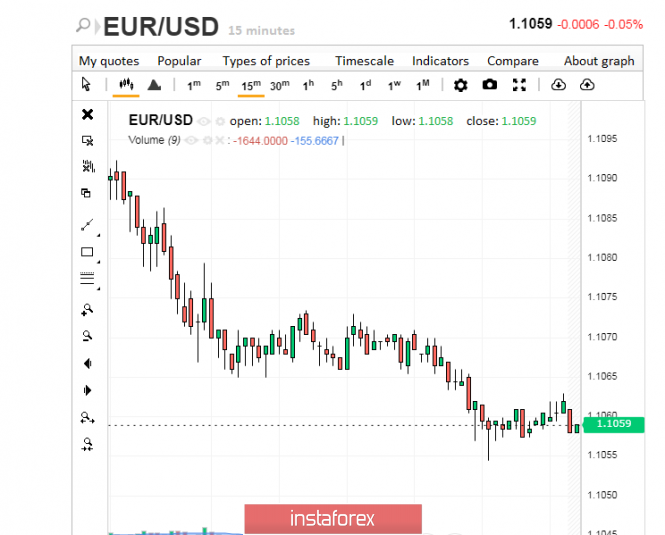
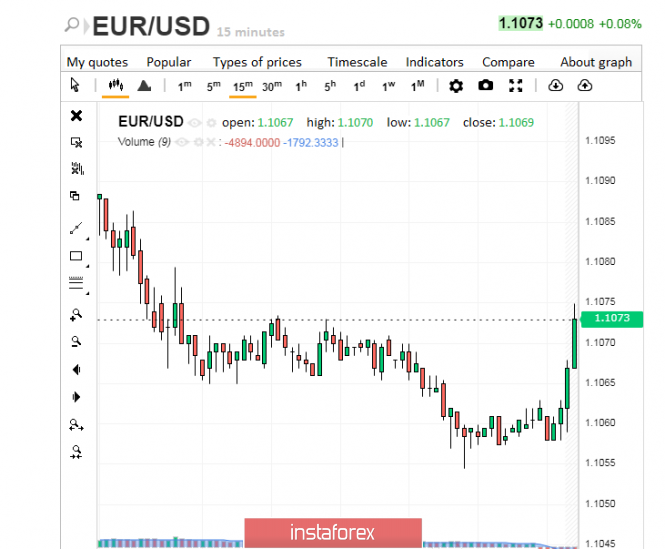
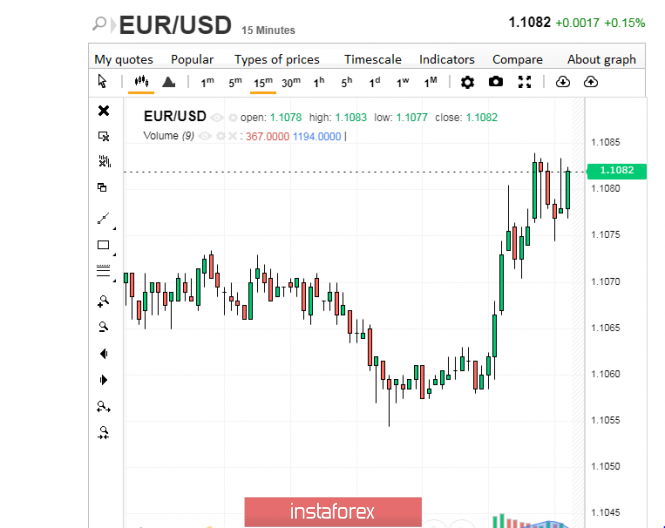
| The dollar has faced difficulties Posted: 07 Nov 2019 03:05 PM PST The US currency once again found itself in the grip of conflicting factors. The greenback is under pressure from both the easing of the Fed's monetary policy and geopolitical problems. However, the market is not discouraged and still believes in the dollar, since the global currency has long established itself as resistant to any difficulties. Opposition to negative factors on the part of the dollar began with the moment of a radical change in the strategy of the Federal Reserve. Previously, the regulator raised the interest rate, maintaining equilibrium in the US economy. Last year, after the strongest 20% correction in the country's stock market, which lasted from October to December 2018, the Fed policy changed 180 degrees. Earlier, before the correction, the Fed adhered to the policy of raising the key rate, but under the pressure of negative factors was forced to reconsider its views. Large-scale correction in the US stock market was the strongest driver of this change. The caustic comments of US President Donald Trump, who criticized the Fed for its inability to quickly cut rates and provide additional liquidity to the country's financial system, added fuel to the fire. The regulator surrendered under the pressure of these circumstances, starting the process of easing monetary policy. Active reduction in interest rates was not in vain for the US currency. The dollar began to sag, losing stability and gaining ground. Its traditional status as a safe haven currency has also been called into question. The situation improved in the future, but anxiety remained. Analysts were concerned about the fact that the greenback has increased by 0.7% against a basket of leading world currencies since the beginning of this week. What is the faith of investors in the dollar based on? Mainly on the expectation of a positive outcome of trade negotiations between Washington and Beijing, as well as on the traditional ability of the greenback to rise from the ashes. According to experts, the greenback's current rise was significantly affected by strong macroeconomic data from the United States. Many analysts believe that this margin of safety is enough for some time to adjust the Fed's immediate plans and let it not chase the cuts in rates. However, a small percentage of analysts still bet on another decline in December 2019. The staggering dollar was supported not only by positive statistics on the US economy, but also by a decrease in appetite for risky assets. The greenback was extended by investors who continue to invest in the US economy amid long-term geopolitical risks. On Wednesday, November 6, the greenback strengthened against major world currencies, including the euro, which is balancing on the verge of falling for the third consecutive day. On Thursday morning, November 7, the EUR/USD pair pushed near the levels of 1.1061–1.1062, making timid attempts to rise. After a while, the pair slid to the level of 1.1059. The market flinched, carefully following the dynamics of the pair. There was still hope for growth. Further attempts at recovery were successful. The EUR/USD pair leveled off, showing an upward trend. The pair reached the 1.1072–1.1073 bar, but did not stop there. Having made a spectacular reversal, the EUR/USD pair soared to 1.1082–1.1083. At the moment, the pair is trying to conquer the next peaks. Analysts draw attention to a number of technical factors contributing to the dollar's potential growth. Its weakening, recorded last month, sent the greenback to the lower boundary of the upward trend. Yesterday, the greenback stormed the long-term line of this trend at the price level with which the process of lowering rates began. If the current trend changes, the driver of which may be a positive outcome of trade negotiations between the US and China, the situation will not be in favor of the greenback. The implementation of such a scenario will give odds to the European currency, analysts are certain. It will strengthen, pushing the dollar and, perhaps, try to push it off the pedestal. The potential advantage of the euro revived the market, providing food for thought and analytical calculations. Most analysts agree that now is the right time to sell the dollar and buy the euro. Specialists at Morgan Stanley, the largest bank, are confident that economic growth in the United States has exhausted itself, which cannot but affect the greenback dynamics. These changes will be with a negative sign, experts said. They emphasize that the current differential in interest rates in the United States and the level of profitability do not play in favor of the dollar. Many analysts are confident that in the next two years, the dynamics of the US currency may change so much that the greenback will lose its status as a safe haven currency. The material has been provided by InstaForex Company - www.instaforex.com |
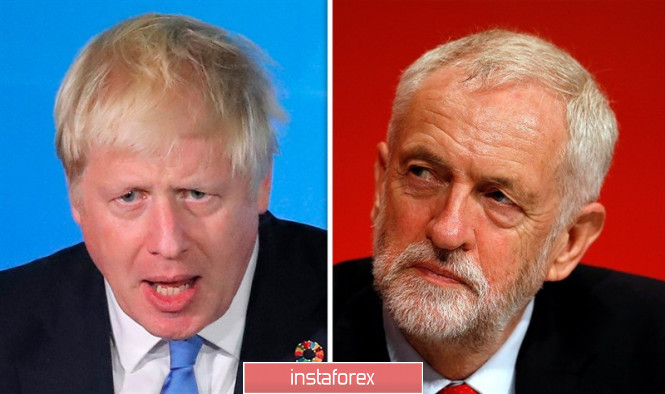
| GBP/USD: the pound is included in the election race Posted: 07 Nov 2019 03:04 PM PST GBP/USD continues to trade between the local support levels of 1.2800 and resistance of 1.3000. The data on business activity in the UK manufacturing sector released last Friday pleasantly surprised investors. The indicator rose to a six-month high - 49.6 in October against 48.3 recorded in September. Another important indicator of the state of the British economy was released at the beginning of this week - the PMI for the UK services sector, which rose to 50.0 in October from 49.5 in September. Despite the growth of indicators, economists believe that the continuing uncertainty around Brexit will restrain activity in British business. A regular meeting of the Bank of England took place today, as a result of which it left the interest rate at the same level - 0.75%. At the same time, there were surprises. Two members of the Monetary Policy Committee - Michael Saunders and Jonathan Haskel - unexpectedly voted to cut the rate by a quarter point, citing risks for the forecast and signs of a reversal in the labor market. These are the first voices in favor of easing monetary policy since 2016. Against this background, the pound depreciated against the US dollar by 0.25% to $1.2805, reaching the lowest level in almost two weeks. The UK received a deferral of Brexit until January 31, 2020. The Bank of England is expected to abstain from active actions until the end of this period. In anticipation of the early parliamentary elections scheduled for December 12, the results of public opinion polls for the pound could be much more important than monetary policy or economic data. The election campaign officially started in the country the day before. According to a consensus forecast by analysts recently surveyed by Reuters, the victory of the Conservative Party will lead to a "divorce" agreement between London and Brussels, resulting in a GBP/USD pair growth by 3%, while Labour will cause the pair to fall by 2%. According to various estimates, the advantage of Conservatives over Labour is now from 12 to 17%. However, as analysts warn, this may not be enough for Boris Johnson to guarantee his party more than half of the 650 seats in the House of Commons. According to them, amid the dissatisfaction of voters with the actions of the leadership of the Conservative Party and the absence of a clear program for the Labour Party, the outcome of the upcoming elections and the fate of Brexit will also depend on how widely the British support the parties supporting the preservation of EU membership. The current correction of GBP/USD in the context of the political landscape of Great Britain, which remains unsteady, seems quite logical. It should be noted that November is far from the best month for the pound. According to its results, in 1975-2018, the British currency against the US dollar depreciated in 28 cases out of 44. It is assumed that the lower the pair starts to fall, the more there will be those who want to buy it cheaper. The odds of a disordered Brexit have fallen to nearly zero. Based on the fact that according to the results of the early elections, the UK will leave the EU on the basis of an agreement or even remain part of the EU, it makes sense to form longs for GBP/USD to reduce support quotes by 1.2725–1.275 and 1.259–1.261 . The material has been provided by InstaForex Company - www.instaforex.com |
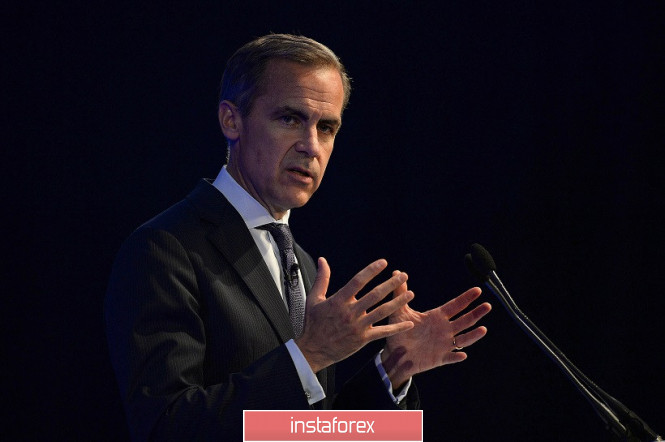
| GBPUSD. Bank of England dissidents, predictions and phlegmatic pound Posted: 07 Nov 2019 03:04 PM PST The results of "Super Thursday" were expectedly not in favor of the British currency, although the first violin in the downward pressure on the pound was played not by the head of the Bank of England Mark Carney, but by two members of the English regulator who unexpectedly called for easing monetary policy. Traders were clearly discouraged by this fact, since the prospects of monetary policy have recently been discussed in a slightly different aspect. Experts discussed - will the BoE raise the rate in the first half of next year or will it still take a wait-and-see attitude? Now this discussion has been supplemented with one more question - will the English regulator resort to a preventive reduction in the rate? The culprits of the bearish triumph were two members of the Committee - Michael Saunders and Jonathan Haskel. It is worth noting that Saunders is not the first to vote "against the grain", that is, contrary to the general opinion of most colleagues. A little over a year ago, he, along with Ian McCafferty, voted to raise the rate, while the remaining seven members of the Committee voted to maintain the status quo. This went on for three meetings, but then Saunders again joined the majority, voting in a general rhythm. Now there is a mirror situation. Saunders and Haskel voted to reduce interest rates, violating the expected balance of power (0-2-7 instead of the predicted 0-0-9). For the first time in three years (that is, since August 2016), members of the Committee, albeit not in the majority, voted in favor of easing monetary policy. Moreover, Saunders and Haskell said that the regulator needs to introduce additional incentives as soon as possible, since recent releases indicate a weakening of the British labor market amid increasing risks from the global trade conflict. The BoE did not support the peculiar "dissidents" in its conclusions, but also did not exclude the realization of such a scenario in the future. The rhetoric of the accompanying statement left a double impression. On the one hand, the English regulator made it clear that if global economic growth does not stabilize, Brexit uncertainty will continue, and key economic indicators will continue downward trend, then the central bank may have to intervene. But then the regulator hastened to declare the likelihood of an alternative scenario. If these risks do not materialize, then the issue of a gradual increase in the rate will again be on the agenda. In other words, the prospects for monetary policy in the UK again depend on external factors. The Bank of England made it clear that it is ready to tighten monetary policy, but in the conditions of a "soft" Brexit and at least a conditional trade truce between the US and China. And of course, given the growth of key macroeconomic indicators in Britain, especially in the labor market and inflation. Unfortunately for the GBP/USD bulls, the English regulator lowered its forecasts for the main economic indicators. So, GDP growth for the next year was reduced from 1.3% to the lowest level over the past ten years, 1.2%, and in 2021 - from 2.3% immediately to 1.8%. The BoE also lowered its inflation forecast - according to regulator members, its growth will slow by 1.2% by mid-2020, due to lower prices for black gold and regulatory restrictions on electricity and water tariffs. Summing up the November meeting, Mark Carney confirmed that the central bank's next likely move would be a reduction in interest rates, as the Bank of England's updated economic forecasts were revised negatively. He also expressed concern that weak investment is detrimental to industrial production, thereby limiting the growth of the British economy and slowing inflation. Nevertheless, it cannot be said that Carney announced a rate cut in the near future. He just did not rule out a similar scenario, linking it primarily with a possible "hard" Brexit and a general slowdown in the global economy. He voiced such rhetoric more than once, just in this case, Carney's position was reinforced by updated forecasts of the central bank of a negative nature. The two members of the Committee who voted in favor of lowering the rate only added fuel to the fire, putting additional pressure on the pound. Thus, the November meeting of the Bank of England was by no means "passing". But despite the dovish tone of the regulator, the downward impulse of the GBP/USD pair was limited. Bears could not even gain a foothold in the 27th figure, and the price actually returned to its previous positions during the US session on Thursday. Apparently, traders are still tuned for a Conservative victory in December, and, accordingly, for the soft Brexit, with all the ensuing consequences. Given this market reaction, it can be assumed that the GBP/USD pair will continue to trade flat, reacting violently only to political news. The pound turned out to be stress-resistant to dovish threats from the Bank of England, so the further dynamics of the pair will be determined only by the political prospects of the "divorce proceedings" between London and Brussels. The material has been provided by InstaForex Company - www.instaforex.com |
| GBP/USD. November 7. Results of the day. The Bank of England is moving towards easing money Posted: 07 Nov 2019 03:04 PM PST 4-hour timeframe Amplitude of the last 5 days (high-low): 76p - 46p - 67p - 58p - 53p. Average volatility over the past 5 days: 60p (average). Wednesday, November 7, takes place in relatively quiet trading for the GBP/USD pair with the same weak downward bias. The average volatility of the pair over the past five days is 60 points. To date, the pair has passed 85. Thus, we are not entitled to say that there has been a surge in volatility in the market, and traders returned to the market in full force. There was only a very weak reaction to the meeting of the Bank of England, to its results. Thus, the downward trend persists, the Bollinger bands are directed downward and do not expand, which once again indicates the weakness of the trend, but there may be some problems with overcoming the level of 1.2794. While campaigns were officially launched in the UK, the BoE held its next meeting in 2019. The rate and the planned monthly volume of repurchased assets remained unchanged, but there were some surprises. In the vote to change the key rate, two members of the nine monetary committee voted to lower. Michael Saunders and Jonathan Haskel voted to ease monetary policy, citing growing threats to economic prospects. In principle, it's quite a popular rhetoric lately. In other words: geopolitical risks are growing, protectionist policies are on the alert, the China-US trade conflict is negatively affecting the global economy, but the UK also has its own national problem - Brexit. In the general opinion, the BoE will not accept any change in the key rate (until today even a rate increase was supposed in case of Brexit with a deal), until the situation with Brexit is clarified. However, against this background, one question arises: what if the situation with Brexit does not clear up in January 2020? After all, no one gives a guarantee that the election results will give unequivocal support to Conservatives or Laborites. Accordingly, purely hypothetically, the composition of the Parliament may not change at all compared with the current one. What then? Another delay of Brexit. But economic indicators are falling not only in the EU, but also in the UK. Industrial production, inflation, GDP are the problems of both the British authorities and the Central Bank. Thus, a decrease in the rate can happen even if Brexit takes longer than before the end of January 2020. Monetary policy easing by the British regulator can occur even if there is no "hard" Brexit at all. As a rule, the harbinger of a change in the key rate is just such a vote, where suddenly the balance of votes from "unanimous" is reversed. Now two members of the committee have voted in favor of reducing the rate; at the next meeting, there may be 4 or 5 ... This is very bad news for the British pound, which showed a frankly restrained reaction today. Despite the fact that Brexit remains the number one topic for traders, the potential and possible lowering of the key rate cannot be left without attention of traders. And if the rate is lowered before Brexit, this will mean that the economic situation is deteriorating at a very high rate in the UK, and after the long-awaited Brexit (any option), the situation may deteriorate to critical values. Earlier, the BoE held this trump card (easing monetary policy) precisely in case of disordered Brexit. If you have to start it in the course earlier, it will narrow the variability of the regulator in the future. By the way, the speech of Mark Carney, or rather his rhetoric, was also perceived by many traders as very specific hints of lowering the key rate at the next meeting. Mark Carney said that "the risks associated with the latest economic forecasts of the central bank are distorted in a negative direction." Carney also said that the central bank assumes that the country will leave the EU under Boris Johnson's deal. It is on the basis of this option that the forecasts of the British regulator are built. From a technical point of view, the currency pair continues a slight downward movement. All indicators are directed downward, although volatility remains rather weak. The support level of 1.2836 has been overcome, which can provide confidence to the bears, along with today's results of the BoE meeting, which can safely be called moderately dovish. The last trading day of the week will be deprived of any macroeconomic publications in the UK, so all attention is paid to the political sphere of the country. Trading recommendations: GBP/USD is in a downward correction, which may develop into a downward trend. Thus, it is best now to still wait for the completion of the low volatility segment of the trend. Long positions have lost their relevance, as the pair has consolidated below the critical line. You can sell the pound with targets at 1.2736 and 1.2667, but in small volumes. Explanation of the illustration: Ichimoku indicator: Tenkan-sen is the red line. Kijun-sen is the blue line. Senkou Span A - light brown dotted line. Senkou Span B - light purple dashed line. Chikou Span - green line. Bollinger Bands Indicator: 3 yellow lines. MACD indicator: Red line and bar graph with white bars in the indicator window. Support / Resistance Classic Levels: Red and gray dotted lines with price symbols. Pivot Level: Yellow solid line. Volatility Support / Resistance Levels: Gray dotted lines without price designations. Possible price movement options: Red and green arrows. The material has been provided by InstaForex Company - www.instaforex.com |
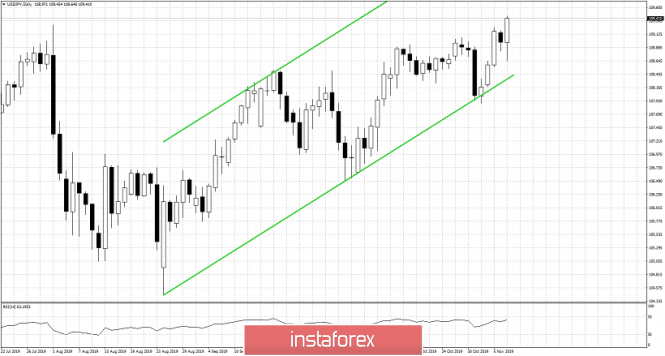
| USDJPY confirms cloud support and bounces to new higher highs Posted: 07 Nov 2019 09:10 AM PST USDJPY remains inside a bullish channel and making higher highs and higher lows. Trend is clearly bullish as we explained in previous analysis. Today we see why price bounced off 108.65 to new short-term highs.
So far USDJPY has respected the lower channel boundary. Price has remained inside the bullish channel and that is another reason why we remained bullish as well. Price is making new higher highs but we have a slight bearish divergence in the Daily RSI.
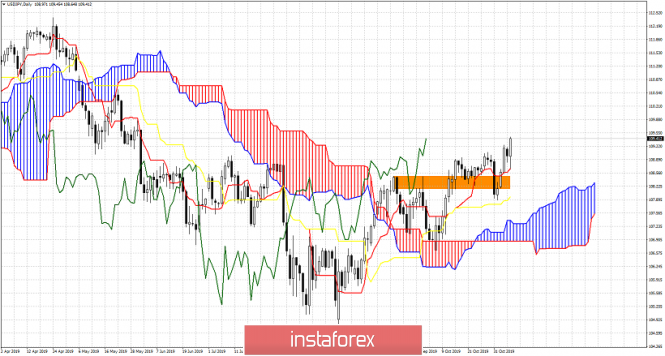
USDJPY pulled back towards the tenkan-sen (red line indicator) and held above it. Price bounced off this support area and is making new highs. In Ichimoku cloud terms trend remains bearish and today's low is important for the short-term trend and could be used as stop from traders. The material has been provided by InstaForex Company - www.instaforex.com |
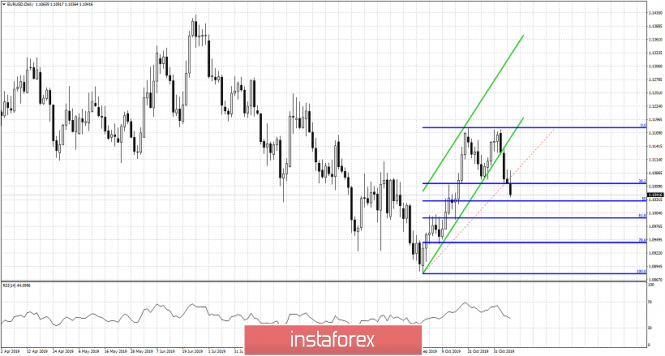
| EURUSD continues lower as price breaks 1.1070 support area Posted: 07 Nov 2019 09:05 AM PST EURUSD remains in a short-term bearish trend. Price is now below Fibonacci support at 1.1070 and I expect price to move towards 1.1020-1.10 as we explained in our last analysis yesterday.
EURUSD is breaking below the 38% Fibonacci retracement and is approaching our next target at the 50% retracement at 1.1020 area. However the next most important Fibonacci level is at 1.0993 at the 61.8% Fibonacci level. Bulls will try and stop the decline around 1.10 I believe and not sooner. Traders wanting to go long need to be very patient now as we could see much lower levels. The RSI is far from oversold. Trend remains bearish. The material has been provided by InstaForex Company - www.instaforex.com |
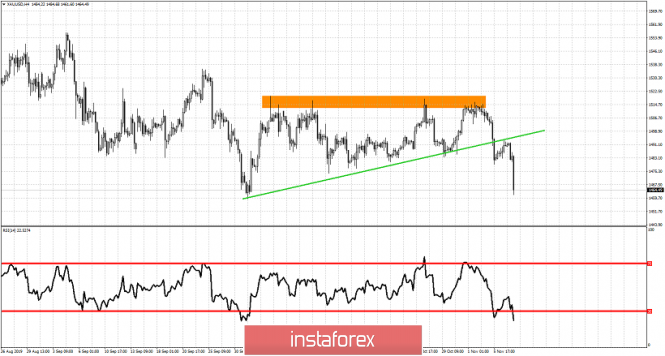
| You shouldn't be surprised with Gold's break down Posted: 07 Nov 2019 09:00 AM PST In our last analysis we mentioned that Gold was most probably back testing the break down area. Breaking below $1,490 was a bearish sign and we considered yesterday's bounce to $1,493 from $1,479 as a back test that would be followed by a rejection.
Orange rectangle -resistance Green line - important trend line support now resistance Gold price is making new lower lows. Trend remains bearish and so do we as long as price is below $1,520-25. I have said this many times. The fact that price has tested $1,525-20 several times and it did not break above it has a twofold meaning. First resistance is very important in that area. Second, this is a bearish sign. Inability to break resistance combined with a break below $1,500 were clear bearish signs. Breaking below the green trend line support confirmed our bearish view. Now that price back tested the trend line that it broke and got rejected, we see lower prices as we previously said. $1,460 was our first support area and we are now very close. Trend remains bearish as long as price is below $1,493 and I expect to see lower levels towards $1,440. The RSI provides confirmation for the new lows, so no warning signs from this oscillator. The material has been provided by InstaForex Company - www.instaforex.com |
| November 7, 2019 : EUR/USD Intraday technical analysis and trade recommendations. Posted: 07 Nov 2019 07:54 AM PST
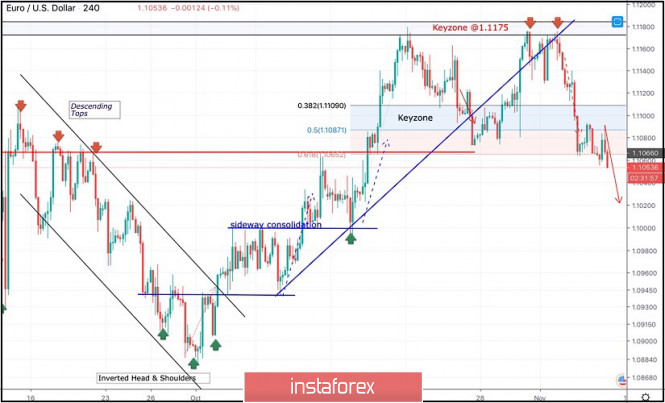
On September 13, the EUR/USD started trending-down within the previous short-term bearish channel until an Inverted Head & Shoulders Pattern was demonstrated around 1.0880 on October 1. Shortly After, a bullish breakout above 1.0940 confirmed the mentioned reversal Pattern which opened the way for further bullish advancement towards (1.1000 -1.1020) maintaining bullish movement above the depicted bullish trend. On October 7, a sideway consolidation range was demonstrated around the price zone of (1.1000 -1.1020) before the bullish movement was resumed towards 1.1175 where the previous bearish movement was recently originated. Last week, the short-term technical outlook has temporarily turned into bearish after breakdown below 1.1090 was achieved (the depicted uptrend line and 50% Fibonacci Retracement Level). On the other hand, the price zone around 1.1175 - 1.1190 stood as a significant SUPPLY-Zone that demonstrated bearish rejection for two consecutive times in a short-period. Hence, a long-term Double-Top pattern is being demonstrated with neckline located around 1.1075-1.1090 which is currently being breached to the downside. Quick bearish decline should be expected towards 1.1025 and 1.0995 provided that the current bearish breakout below 1.1090-1.1070 is maintained on a daily basis. Any bullish pullback towards 1.1085-1.1100 should be watched for early bearish rejection and another valid SELL entry. The material has been provided by InstaForex Company - www.instaforex.com |
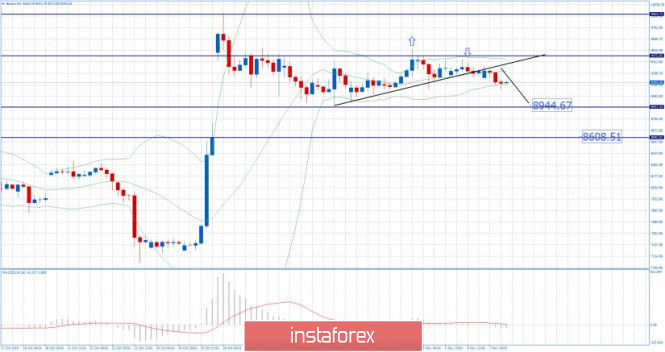
| BTC 11.07.2019 - Broken support trendline, potential for more downside Posted: 07 Nov 2019 07:50 AM PST BTC is still trading inside of the few-day balance and near the resistance at $9.500. Anyway, there is the breakout of the most recent upward trendline, which is sign that sellers won the battle for now. I would prefer selling opportunities on the rallies.
The important support levels and downward targets to watch are set at $8.945 and at $8.608. MACD is showing contraction and very low volatility. Anyway, MACD is in negative territory below the zero line, which his sign that sellers are in control. Bollinger Band is showing contraction and the best thing to do is to watch for potential breakout of contraction (trading range) in order to confirm further direction.The material has been provided by InstaForex Company - www.instaforex.com |
| November 7, 2019 : GBP/USD Intraday technical analysis and trade recommendations. Posted: 07 Nov 2019 07:47 AM PST
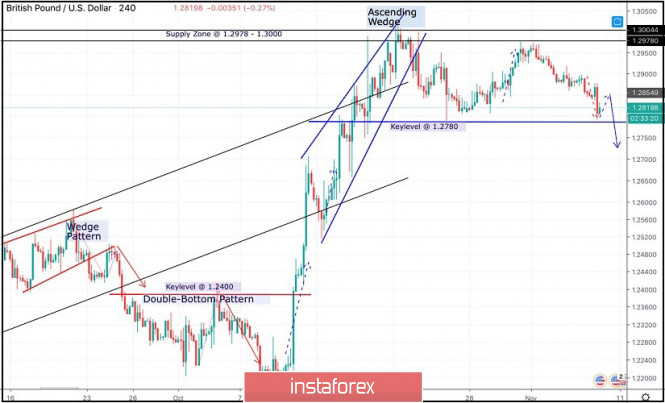
Few weeks ago, Bullish advancement was demonstrated towards 1.2800 then 1.3000 shortly after the neckline of the depicted Double-Bottom pattern (1.2400-1.2415) was breached to the upside. Since October 21, the GBP/USD pair has failed to achieve a persistent bullish breakout above the depicted SUPPLY-zone (1.2980-1.3000) which corresponds to a previous Prominent-TOP that goes back to May 2019. Moreover, the depicted ascending wedge reversal pattern has been confirmed indicating a high probability of bearish reversal around the price levels of 1.2950-1.2970. That's why, a quick bearish movement was anticipated towards 1.2780 (Key-Level) where some bullish recovery was recently initiated on October 24. The recent Bullish rejection around the price levels of 1.2780, indicated another temporary bullish movement towards 1.2980-1.3000 where another long-term bearish swing was initiated as expected. Today, signs of bullish recovery have been demonstrated around 1.2780. The short-term outlook remains bearish as long as consolidations are maintained below 1.2850. On the other hand, a quick bearish breakout below 1.2780 should be achieved to enable further bearish decline towards 1.2600-1.2650 where some bullish recovery should be anticipated. Trade Recommendations: Intraday traders can look for valid SELL entries when bearish closure below 1.2780 is achieved. Expected Bearish target is projected towards 1.2650-1.2650. The material has been provided by InstaForex Company - www.instaforex.com |
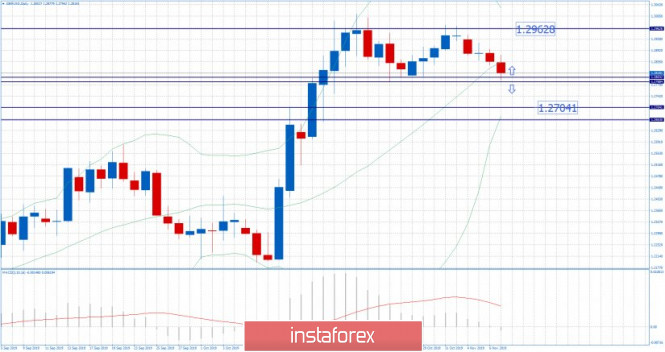
| Posted: 07 Nov 2019 07:23 AM PST GBP is at the major multi pivot support at the price of 1.2800. The zone from 1.2800-1.2780 would be critical for the direction of GBP. Watch for the price action reaction around this critical multi-pivot support in order to confirm further direction.
For the downside you would need: I would like to see the breakout below 1.2788 and consolidation after the breakout in order to confirm eventual test of 1.2705 . For the upside you would need: I would watch for potential bull divergence on the lower frames in order to confirm potential upside rotation and test of 1.2960 MACD oscillator is showing neutral stance and contraction in momentum The material has been provided by InstaForex Company - www.instaforex.com |
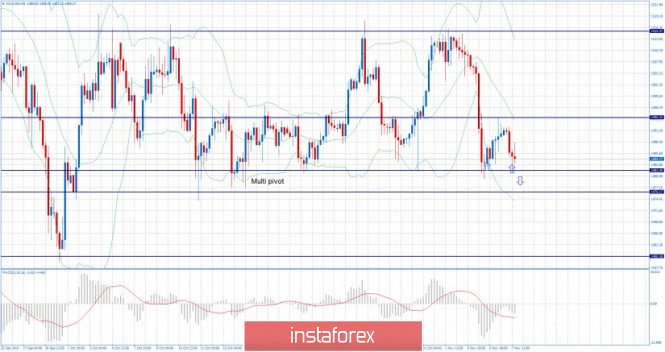
| Gold 11.07.2019 - Gold near multi pivot support at $1.481-$1.476, big decision level Posted: 07 Nov 2019 07:11 AM PST Gold is at the major multi pivot support at the price of $1.481. The zone from $1.481-$1.476 would be critical for the direction of Gold. Watch for the price action reaction around this critical multi-pivot support .
For the downside you would need: I would like to see the breakout below $1.476 and consolidation after the breakout in order to confirm eventual test of $1.460 (main pivot low) For the upside you would need: I would watch for potential bull divergence on the lower frames in order to confirm potential upside rotation and test of $1.494. MACD oscillator is showing decreasing moment on the most recent down movement. The material has been provided by InstaForex Company - www.instaforex.com |
| Posted: 07 Nov 2019 04:50 AM PST
Since the beginning of the week, the greenback has risen by more than 0.7% against the basket of major currencies. The USD index received support on the decline below the 200-day average, as some players continue to defend the prevailing upward trend. Some analysts attribute the dollar's appreciation to hopes for progress in trade talks between Beijing and Washington, but it is likely to become cheaper rather than stronger on the news. It is possible that behind the growth of the dollar are strong macroeconomic indicators for the United States, which convince the market that the Fed is going to take a break in easing monetary policy. In recent days, the chances of a federal funds rate cut in December have dropped from 20% to 5%. This reassessment of expectations seems to have provided the most tangible support for the greenback. In addition, there are technical factors. The weakening of the US currency in October sent it to the bottom of the upward trend. A further decline would indicate a breakdown of the upward trend, which arose along with trade disputes in the United States and China. Apparently, players are in no hurry to bet on breaking the trend without any form of trade transaction or cancellation of existing bilateral duties. It is possible that only real shifts in this direction will become the final signal in the reversal of the trend for USD growth. "Now the market is waiting for confirmation that the first phase of the transaction will be signed," Rabobank said. According to MUFG experts, weakening or resolving the protracted trade war between the USA and China will have a positive impact on the euro, and the dollar will become the main victim in this case. "Since the beginning of the escalation of trade tension at the end of the first quarter of 2018, the euro has seen a clear downward trend. Any de-escalation of the trade conflict could lead to some revaluation of Eurozone assets," they said. Standard Chartered experts believe that the time has come to buy the bottom of the euro amid signs of a revival in the European economy. They noted a number of positive points: improved data on business activity in the EU, as well as on production orders in Germany. "Medium-term drivers have also improved in favor of the growth of the single currency. The risk of the UK leaving the alliance without a deal has been significantly reduced, while the potential for tax incentives in the EU has increased. An interim trade agreement between the US and China could also benefit the euro," Standard Chartered strategists said. They recommend long positions on EUR/USD with a target at 1.1500 and a stop order at 1.0950. The material has been provided by InstaForex Company - www.instaforex.com |
| Trading plan for EUR/USD for November 07, 2019 Posted: 07 Nov 2019 04:40 AM PST
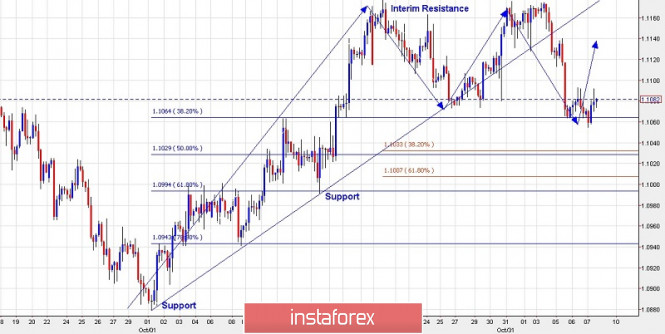
Technical outlook: The EUR/USD pair dropped to 1.1055 intraday, before pulling back to 1.1090 levels, as expected and discussed yesterday. It should be noted that EUR/USD has bounced from the fibonacci 0.382 retracement of a rally between 1.0879 and 1.1180 respectively. It is possible that the correction might be over, and euro bulls are back in control to push prices higher above 1.1180, going forward. On the flip side, possibility remains for a much deeper correction towards the fibonacci 0.618 retracement around 1.1000 levels, before the corrective drop could be declared complete. For the short term at least, a rally is expected towards 1.1130. We shall re-evaluate then and decide the next course of action, but a safe trading strategy could be to buy on dips, against 1.0879. Trading plan: Remain long against 1.0879, target is 1.1500 at least. Good luck! The material has been provided by InstaForex Company - www.instaforex.com |
| Posted: 07 Nov 2019 04:39 AM PST To open long positions on GBP/USD, you need: The British pound resumed its fall after the Bank of England left the interest rate unchanged at 0.75%. However, not all members of the committee agreed with this decision. Some voted for a further rate cut, which led to a decline in the pound. At the moment, the pair has rushed to the support level of 1.2807, from which I recommend opening long positions only if a false breakdown is formed there. Buying GBP/USD on the rebound is best at a minimum of 1.2735. The task of buyers for the second half of the day will be a return to the resistance of 1.2838, which will limit the downward potential of the pound, again locking it in the side channel. In this scenario, we can expect a re-update of the maximum of 1.2874, where I recommend taking the profits. To open short positions on GBP/USD, you need: Bears waited for the decision of the Bank of England and resumed sales, taking advantage of good prices after the morning upward correction. At the moment, the return of the pair under the support of 1.2838 only increased the pressure on the pair, but the main goal is to break and consolidate below the minimum of 1.2807, which will lead to a larger sell-off of GBP/USD with an update of the area of 1.2735, where I recommend taking the profits. Statements by Bank of England Governor Mark Carney could also push the pound even lower. In the scenario of growth and return of the pair to the resistance level of 1.2838 in the afternoon, it is best to consider new short positions on the rebound from the highs of 1.2874 and 1.2910. Indicator signals: Moving Averages Trading is below the 30 and 50 daily averages, which indicates a further decline in the pound. Bollinger Bands The breakthrough of the lower border of the indicator in the area of 1.2835 only increased the pressure on the British pound.
Description of indicators
 |







| You are subscribed to email updates from Forex analysis review. To stop receiving these emails, you may unsubscribe now. | Email delivery powered by Google |
| Google, 1600 Amphitheatre Parkway, Mountain View, CA 94043, United States | |

No comments:
Post a Comment