
Forex analysis review |
- December 20, 2019 : EUR/USD Intraday technical analysis and trade recommendations.
- December 20, 2019 : GBP/USD Intraday technical analysis and trade recommendations.
- GBP/USD 12.20.2019 - Major multi-pivot support at 1.3000 got protected, watch for buying opportunities
- EUR/USD for December 20,2019 - Intraday oversold condition and bullish divergence on the MACD, possible rally till end of
- BTC 12.20.2019 - Broken supply trendline in the background, buying opportuntiies preferable
- Technical analysis of EUR/USD for December 20, 2019
- Trading recommendations for GBPUSD for December 20
- Trading plan for GBPUSD for December 20, 2019
- Analysis of EUR/USD and GBP/USD for December 20. Bank of England helps the pound continue to fall
- Trading plan for Bitcoin for December 20, 2019
- Indicator analysis: Daily review on GBP / USD on December 20, 2019
- Technical analysis of ETH/USD for 20/12/2019:
- Markets don't believe in Trump's impeachment; weak positivity supports CAD and contributes to the sales of JPY
- Technical analysis of BTC/USD for 20/12/2019:
- EUR / USD, Dollar ignores negative statistics and grows on news from China
- Positive statistics from the US will support the dollar, but not for long (we expect a local decline in the EUR/USD pair
- Technical analysis of GBP/USD for 20/12/2019:
- Trading plan for EURUSD for December 20, 2019
- Technical analysis of EUR/USD for 20/12/2019:
- Indicator analysis: Daily review on EUR / USD on December 20, 2019
- Hot forecast for GBP/USD on 12/20/2019 and trading recommendation
- Trading plan on EUR/USD for December 20. The euro is under pressure.
- EUR/USD and GBP/USD: The US passed a spending bill of 1.4 trillion dollars. The euro will remain under pressure, and the
- GBP/USD: plan for the European session on December 20. Buyers are not satisfied with the statements of the Bank of England,
- EUR/USD: plan for the European session on December 20. The breakthrough of the lower border of the triangle will increase
| December 20, 2019 : EUR/USD Intraday technical analysis and trade recommendations. Posted: 20 Dec 2019 08:21 AM PST
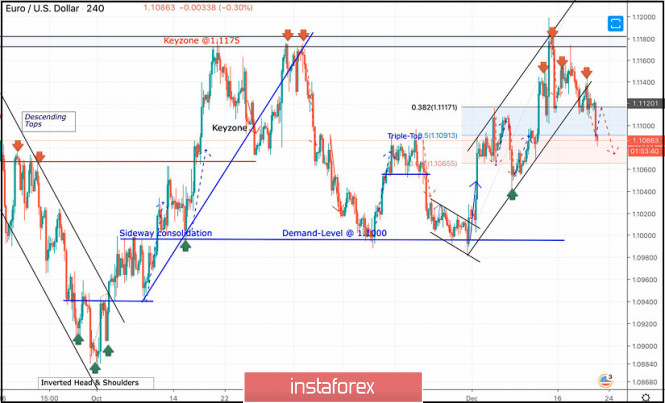
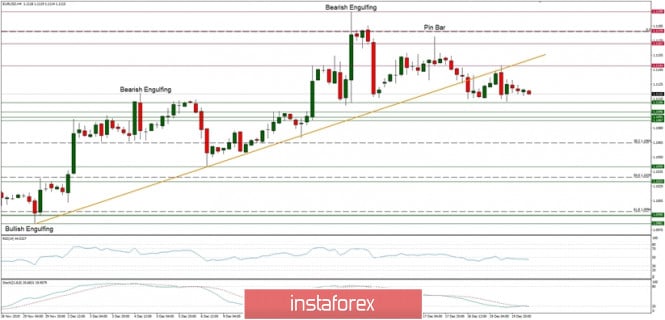
Since October 2, the EURUSD pair has been trending-up until October 21 when the pair hit the price level of 1.1175. The price zone of (1.1175 - 1.1190) stood as a significant SUPPLY-Zone that demonstrated bearish rejection for two consecutive times in a short-period. Hence, a long-term Double-Top pattern was demonstrated with neckline located around 1.1075-1.1090 which got broken to the downside on November 7. On the other hand, the price levels around 1.1000-1.0995 stood as significant DEMAND zone which has been offering adequate bullish SUPPORT for the pair so far. Shortly-after, the EUR/USD pair has been trapped within a narrower consolidation range between the price levels of 1.1000 and 1.1085-1.1100 (where a cluster of supply levels and a Triple-Top pattern were located) until December 11. That's when significant bullish swing was initiated around 1.1040 allowing the current recent bullish breakout above 1.1110 to pursue towards 1.1175 within the depicted newly-established bullish channel. Intraday bearish rejection was expected around the price levels of (1.1175). Quick bearish decline was demonstrated towards 1.1115 (38.2% Fibonacci level). Recently, the price level of 1.1115 stood as a temporary Intraday demand level that prevented further bearish decline for a while before further bearish decline was demonstrated earlier Today. Bearish breakout below 1.1080 probably indicates further bearish decline to be anticipated towards 1.1065. On the other hand, any bullish pullback towards 1.1115 should be watched for bearish rejection and another SELL entry. If earlier bearish decline is demonstrated, next bearish projection target would be located around 1.1010. Trade recommendations : Conservative traders should wait for a bullish pullback towards 1.1115 ( reversal pattern neckline ) as a valid SELL signal. Bearish projection target to be located around 1.1090, 1.1040 and 1.1010. The material has been provided by InstaForex Company - www.instaforex.com |
| December 20, 2019 : GBP/USD Intraday technical analysis and trade recommendations. Posted: 20 Dec 2019 07:39 AM PST
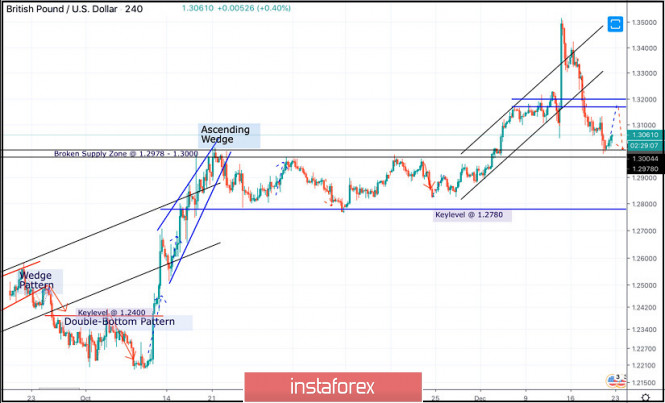
In the period between October 17 to December 4, the GBP/USD pair has been trapped between the price levels of 1.2780 and 1.3000 until December 4 when bullish breakout above 1.3000 was achieved. Moreover, a newly-established short-term bullish channel was initiated on the chart. In which, the GBPUSD has recently hit the price level of 1.3500. Technical outlook was bullish as long as consolidations were maintained above 1.3170-1.3190 on the H4 chart. On the other hand, the GBPUSD has recently exceeded the upper limit of the depicted bullish channel on its way towards 1.3500 where the pair looked quite overpriced. This was followed by successive bearish-engulfing H4 candlesticks which brought the pair back towards 1.3300 quickly. Further bearish decline was pursued towards 1.3170-1.3190 which was broken to the downside as well. Short-term outlook remains bearish as long as bearish persistence below 1.3190 is maintained on the H4 chart. Initial Bearish projection target was already reached around 1.2980-1.3000 where early signs of bullish recovery is manifested. Intraday bullish pullback is anticipated to occur towards 1.3170-1.3190 where bearish rejection and another bearish swing can be initiated. On the other hand, early bearish breakout below 1.3170 is needed to enhance further bearish decline towards 1.2840. The material has been provided by InstaForex Company - www.instaforex.com |
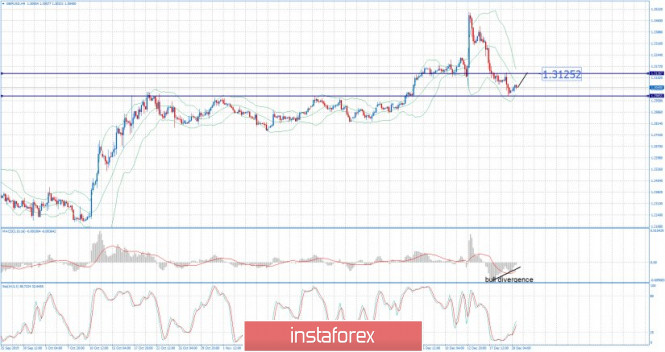
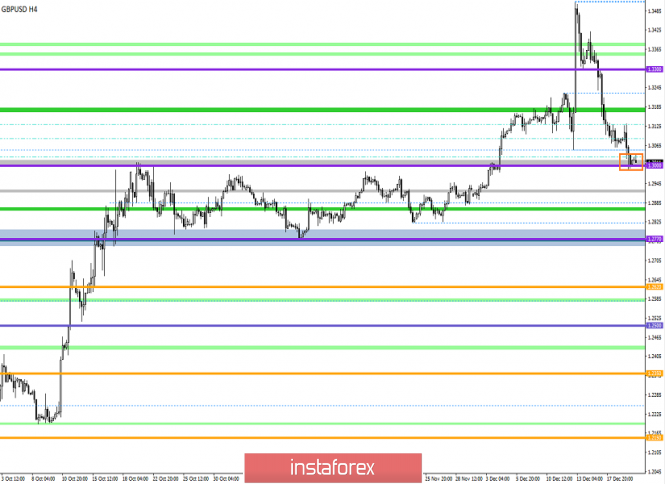
| Posted: 20 Dec 2019 07:08 AM PST GBP/USD has been trading downwards in the past 24 hours but it found solid support at 1.3000. Due to oversold condition on the 4H time-frame, my advice is to watch for buying opportunities with the target at the price of 1.3125.
Watch for intraday buying opportunities due to oversold condition... MACD oscillator is showing bullish divergence, which is another sign of the exhaustion from sellers. Stochastic is in oversold condition Resistance level is seen at the price of 1.3125 Intraday support is seen at 1.3000 The material has been provided by InstaForex Company - www.instaforex.com |
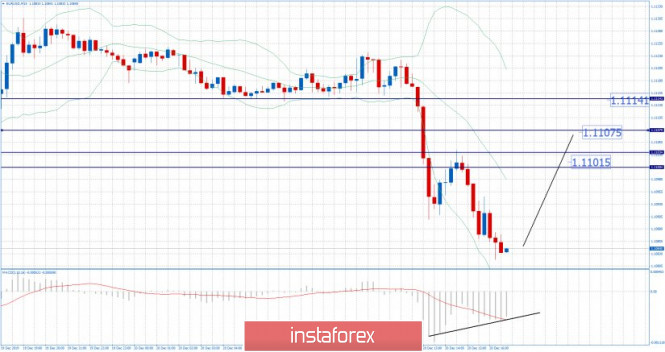
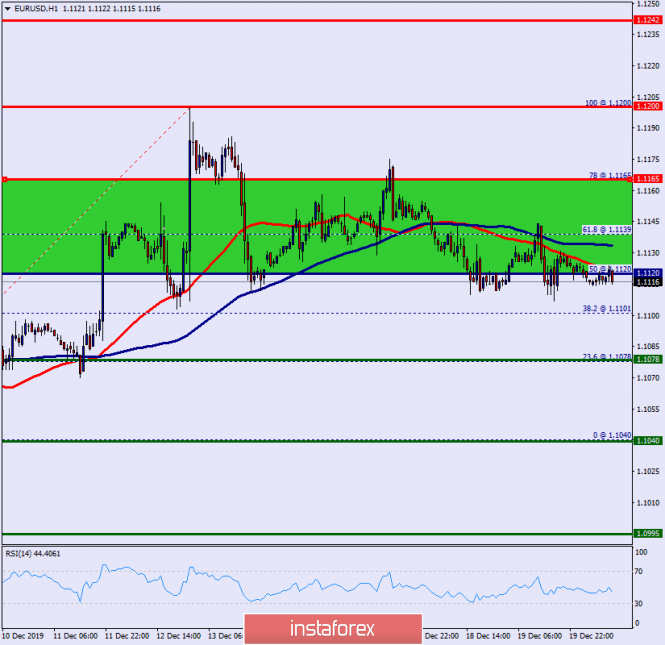
| Posted: 20 Dec 2019 06:59 AM PST EUR/USD has been trading downwards on intraday prospective and the price reached the level of 1.1083. Anyway, I found that sellers might be oversold for today and that there is potential for the rally till end of the day. Upside intraday targets are set at the price of 1.1100, 1.1107 and 1.1114.
Watch for intraday buying opportunities due to oversold condition... MACD oscillator is showing bullish divergence, which is another sign of the exhaustion from sellers. Resistance levels are seen at 1.1000, 1.1107 and 1.1114 Intraday support is seen at 1.1080 In case of the stronger down break, next support is seen at 1.1075 The material has been provided by InstaForex Company - www.instaforex.com |
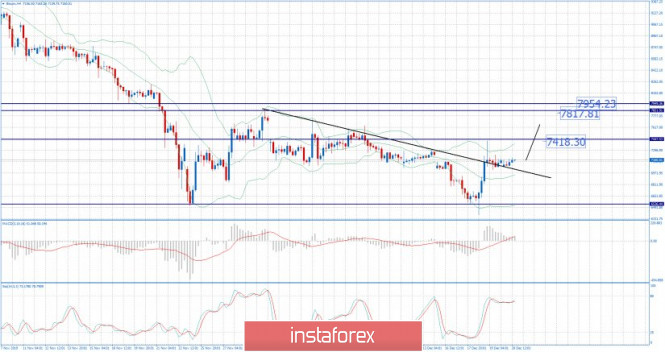
| BTC 12.20.2019 - Broken supply trendline in the background, buying opportuntiies preferable Posted: 20 Dec 2019 06:37 AM PST Crypto Industry News: The successful recipient of the AMF "ICO visa" – a cryptocurrency fundraising platform called French-ICO – met the minimum guarantees required by law, including a white paper investors could understand, according to a statement from the regulator. ICO visas are a means to ensure sales do not bring investors undue risk. Applicants must show the AMF they have provided all relevant information about the sale, as well as the risks involved. Approval is not an endorsement for the company. The regulator can only approve public offerings for utility tokens, and an applicant must be a registered entity in France. They must also have procedures for securing investor funds and comply with strict anti-money laundering (AML) requirements. Once approved, the ICO must take place within six months. Technical Market Overview: Since the new local high on the BTC/USD was made at the level of $7,430 which is above the key technical resistance trend line at $7.14, the market has entered a bullish phase. Please notice, the move up was very aggressive and impulsive, which may lead BTC into the upward movement. Weekly Pivot Points: WR3 - $8,525 WR2 - $7,870 WR1 - $7,466 Weekly Pivot - $7,238 WS1 - $6,823 WS2 - $6,594 WS3 - $5,950 Trading Recommendations: The best strategy in the current market conditions is to trade with the larger timeframe trend, which is up. I found the bull flag on the 4H time-frame and there is chance for re-test of the resistances at $7.418, $7.817 and $7.950.
|
| Technical analysis of EUR/USD for December 20, 2019 Posted: 20 Dec 2019 01:24 AM PST Overview: The pivot point: 1.1120. Trend: sideways. The trend of EUR/USD pair movement was controversial as it took place in a narrow sideways channel, the market showed signs of instability. Amid the previous events, the price is still moving between the levels of 1.1120 and 1.1165. Also, the daily resistance and support are seen at the levels of 1.1165 and 1.1200 respectively. Therefore, it is recommended to be cautious while placing orders in this area. So, we need to wait until the sideways channel has completed. The market will probably be moving from its bottom at 1.1120 to rise towards the top of 1.1165 sooner. Today, in the one-hour chart, the current rise will remain within a framework of correction. However, if the pair fails to pass through the level of 1.1165, the market will indicate a bearish opportunity below the strong resistance level of 1.1165 (the level of 1.1200 coincides with the double top too). Since there is nothing new in this market, it is not bullish yet. Sell deals are recommended below the level of 1.1165 with the first target at 1.1100. If the trend breaks the support level of 1.1100, the pair is likely to move downwards continuing the development of a bearish trend to the level 1.1040 in order to test the daily support 2 (horizontal green line). However, stop loss should always be taken into account, accordingly, it will be of beneficial to set the stop loss above the last bullish wave at the level of 1.1200. The material has been provided by InstaForex Company - www.instaforex.com |
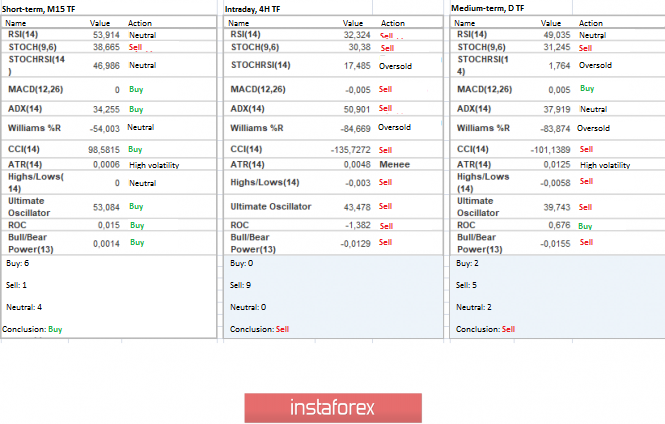
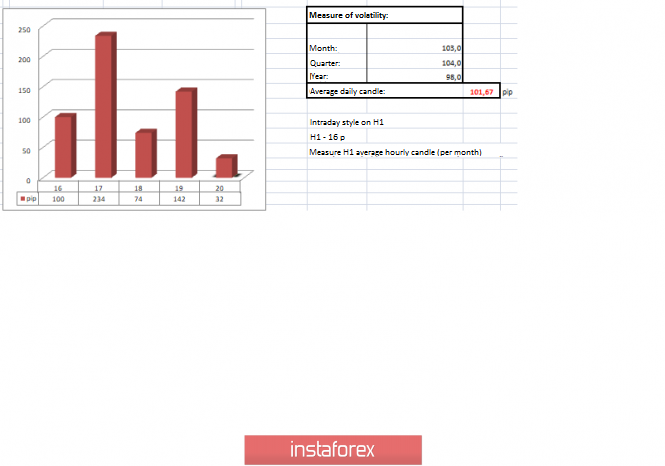
| Trading recommendations for GBPUSD for December 20 Posted: 20 Dec 2019 12:14 AM PST From the point of view of a comprehensive technical analysis, what happened was what many were waiting for, the return of the price back to the psychological level of 1.3000, from where it all started. In fact, in one trading week, the quotes managed to go over 500 points, leaving behind the entire impulsive upward movement and replacing it with an inertial, but in the opposite direction. Analyzing December, one is amazed at the scale of jumps and potential profit, where the tactics of work were not complicated, and the speed of the formation of jumps did not force traders to stay in positions for too long. I think that we are still waiting for the continuation and that 2020 will not be boring. Continuing consideration of the existing fluctuations, traders agree that such a rapid return of prices back to the long-playing flat 1.2770 / 1. 3000 suggests that bearish interest still prevails in the market. as well as indecision in terms of changing global trends. That is, the chance of the price returning back to 1.2770 / 1.3000 has reached a high coefficient, and only a local information background can make adjustments to this scenario. In terms of volatility, we see that the assumption of acceleration, after the conditional stagnation of the environment, coincided 100%. The quotes managed to draw an amplitude of 142 points from low to high, and the movement was holistically directed downward. In turn, speculative interest continues to gain new heights, as evidenced by the volatility and structure of trading candles. Analyzing the past hourly chart, we see that the morning consolidation, with an extremely low amplitude, confirmed the willingness of market participants to take action where price jumps began to appear after the start of the European trading session. In fact, 80% of the movement was directed downward. As discussed in the previous review, many speculators adhered to a risky, but still profitable tactic of holding short positions, which ultimately paid off. Within the psychological level of 1.3000, profit-taking occurred due to the risk of a rebound from the control level. Considering the trading chart in general terms [the daily period], we see that in the existing upward trend the prerequisites for a fracture arise, but confirmation of this will only come when the quotation returns to the area of 1.2770 / 1.3000. In terms of trends, we see that 2019 was a big V-shaped formation, which is in the structure of the global downtrend. The news background of the past day contained data on retail sales in the UK, where there was a more significant slowdown than previously expected, from 3.1% to 1.0%, [forecast was 2.1%]. Market reaction to statistics was in the phase of a general weakening of the pound. After the statistics, happened the meeting of the Bank of England, where, without further surprise, the interest rate was left at the same level which is at 0.75%. At the same time, two out of nine members of the Monetary Policy Committee, Jonathan Haskel and Michael Saunders, respectively, once again voted to reduce the rate from 0.75% to 0.5%, arguing that the growth of the British economy is still weaker than expected while the labor market is cooling. At the same time, during the last meeting, it was decided to elect the new head of the Bank of England, Andrew Bailey, the current head of the Office of Financial Regulation and Supervision of the United Kingdom. Let me remind you that Mark Carney will leave his post on January 31, 2020. In terms of informational background, we had the official opening of the session of the new British parliament, where the Queen of Great Britain, Elizabeth II, addressed the deputies. The Queen welcomed the new House of Representatives, and also called a number of bills proposed for consideration by the government. Prime Minister Boris Johnson, in turn, said during the first parliamentary meeting that it was time to implement the promises during the election campaign. "We must justify the trust of those who made it here. We must solve the problems that the queen spoke about in her speech. The main lesson of this election campaign, the message that I heard in different parts of the UK, is not only that people want their government to complete the Brexit story, although this too, they want us to move the country forward. "Johnson. What the Labor leader Jeremy Corbyn criticized, stating that Johnson has now intentionally resurrected the Brexit threat without a deal. This can knock down the industry and adversely affect employment. And this threat is now included in the bill on the country exit from the EU. The Prime Minister has repeatedly demonstrated that his priority is an agreement with Donald Trump. In fact, this isn't so surprising as Corbyn spent the entire election campaign in the same passage. Today, in terms of the economic calendar, data on Britain's GDP is expected to decrease from 1.3% to 1.0%, which will put local pressure on the pound. In the afternoon, data on the GDP of the United States will be released, but there is also a decrease from 2.3% to 2.1%, which to some extent can restrain the persistently strengthening of the US dollar. At the same time, the Brexit deal, which is likely to be approved by 99%, is being submitted to the British Parliament today. I'm not sure whether the market will react to such a grand event, even during the election, the deputies made a promise to Johnson that they would vote for approval. "Today we will fulfill the promise we made to the people and get a vote on Brexit, on Christmas Day," Johnson said The upcoming trading week in terms of the economic calendar contains only data on orders for durable goods, and nothing more. It is worth considering that in connection with the holidays the market will not work on December 25, but on 24 and 26 trading volumes will also be reduced, which will affect the dynamics of the market. The most interesting events displayed below ---> Monday, December 23 USA 12:30 Universal time - New Home Sales (Nov): Prev 733K ---> Forecast 728K Tuesday, December 24th USA 13:30 Universal time - Orders for durable goods (Nov): Prev 0.5% ---> Forecast 1.9% Further development Analyzing the current trading chart, we see that the psychological level of 1.3000 plays a support, where traders, due to risk, fix short positions and work locally on the rebound. In fact, there are no sharp changes in quotes, which cannot but rejoice the supporters of the bearish move, since even in the case of a small rollback, there will be a chance of a breakdown of the level of 1.3000. In terms of volatility, there is a chance of local acceleration, just at the breakdown phase of the level of 1.3000, as well as the acceleration of speculative positions. By detailing the per minute portion of time, we see a characteristic stagnation / pullback, where the amplitude of the oscillation is still extremely small. In turn, traders, as mentioned above, recorded trade deals, with the risk of a rebound and observe the behavior of quotes and points of possible price fixations below the control level. In turn, speculators are trying to make money on a rebound from the level, opening local long positions. Having a general picture of actions, we can assume that while temporary stagnation / rollback looks like a realistic development of the plot, it's worthwhile to be vigilant and carefully analyze the area of 1,2990-1,2980 for clear price fixations. In fact, there is still a possibility of a further price drop. Based on the above information, we derive trading recommendations: - We consider purchase positions in case of price fixing higher than 1.3050 / 55. - We consider selling positions in case of price fixing lower than 1.2885-80. Indicator analysis Analyzing a different sector of timeframes (TFs), we see that the indicators' indicators in most of the time sections retain downward interest. At the same time, short-term segments signal support, alternately reflecting purchases. Volatility per week / Measurement of volatility: Month; Quarter Year Measurement of volatility reflects the average daily fluctuation, calculated for Month / Quarter / Year. (December 20 was built taking into account the time of publication of the article) The current time volatility is 32 points, which is a low value for this time section. It is likely to suggest that, against the background of the information flow, acceleration may occur along with general market ticks. Key levels Resistance zones: 1.3180 **; 1.3300 **; 1.3600; 1.3850; 1.4000 ***; 1.4350 **. Support Areas: 1,3000; 1.2885 *; 1.2770 **; 1.2700 *; 1.2620; 1.2580 *; 1.2500 **; 1.2350 **; 1.2205 (+/- 10p.) *; 1.2150 **; 1,2000 ***; 1.1700; 1.1475 **. * Periodic level ** Range Level *** Psychological level **** The article is built on the principle of conducting a transaction, with daily adjustment The material has been provided by InstaForex Company - www.instaforex.com |
| Trading plan for GBPUSD for December 20, 2019 Posted: 20 Dec 2019 12:00 AM PST
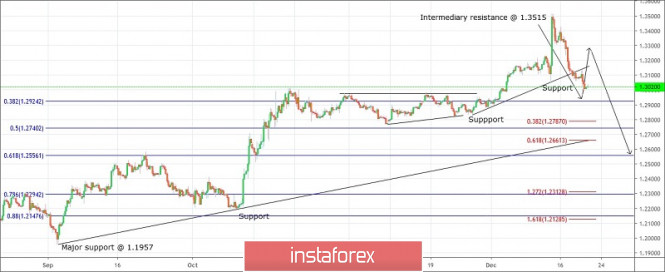
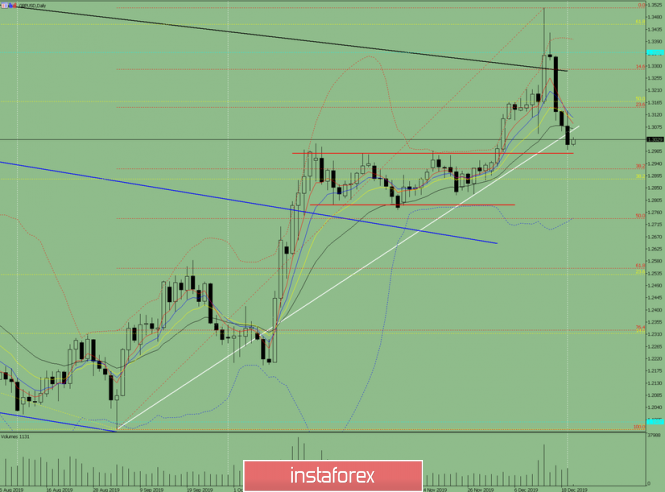
Technical outlook: GBPUSD dropped below initial support at 1.3050, and printed lows at 1.2997 levels yesterday before pulling back higher again. This was expected and discussed here earlier this week. At the moment, GBPUSD is seen to be trading around 1.3012 levels. It may produce a counter trend rally to 1.3300/50 levels. Please note that counter trend rally might resume from current levels or from 1.2930 level, which is Fibonacci 0.382 support of the previous rally. Looking at the short term structure, a counter trend drop is expected towards 1.2550/1.2600 levels close to the Fibonacci 0.618 retracement of the previous rally (1.1950 through 1.3515) before the uptrend could resume. Immediate trade direction could be towards 1.3300/50 then lower again towards 1.2550/1.2600 against 1.3515 levels. Opportunities are seen on both sides until prices find a bottom near 1.2600 level. Trading plan: 1. Buy @ 1.2950/1.3000, stop 1.2900, target is 1.3300/1.3400 2. Sell @ 1.3350/1.3400, stop at 1.3515, target is 1.2600 3. Buy @ 1.2600, stop at 1.1950 target is open. Good luck! The material has been provided by InstaForex Company - www.instaforex.com |
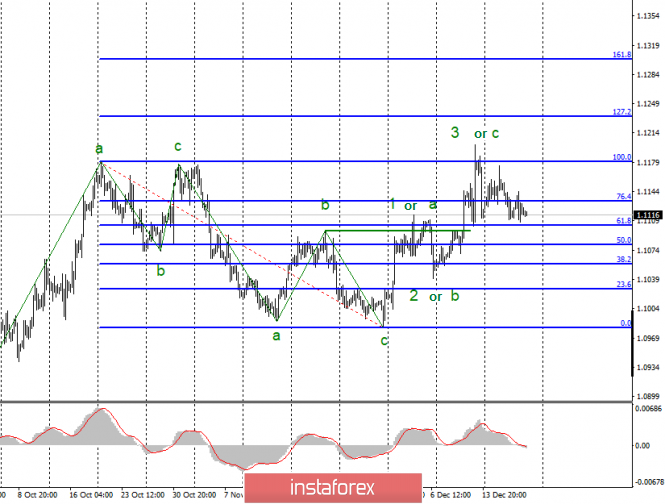
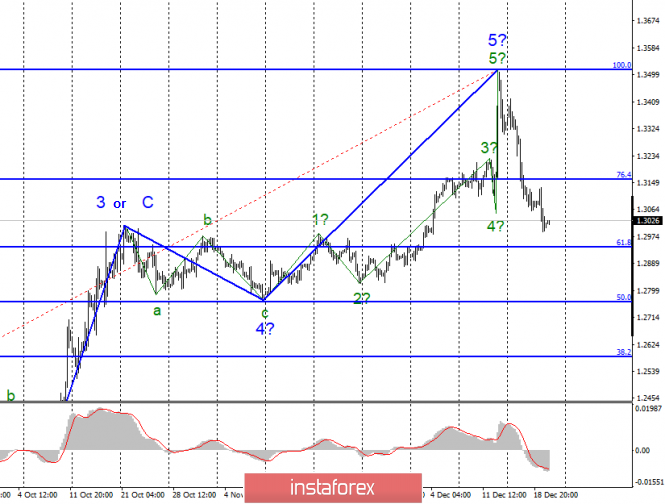
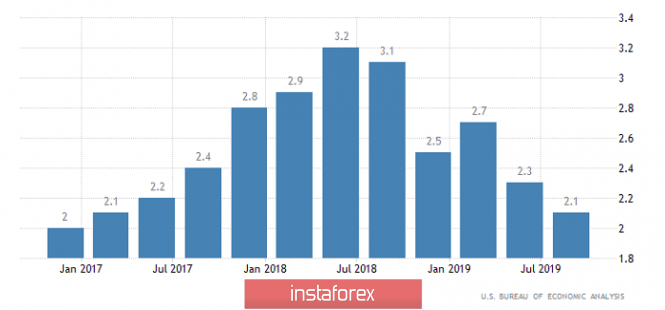
| Analysis of EUR/USD and GBP/USD for December 20. Bank of England helps the pound continue to fall Posted: 19 Dec 2019 11:54 PM PST EUR / USD On December 19, the EUR / USD pair completed with an increase of several base points, which does not affect the current wave marking in any way again, which still involves the completion of the ascending 3-wave trend section near the Fibonacci level of 100.0%. At the same time, the probability of complicating the upward trend section and its transformation into a 5-wave one with the prospect of leaving much higher than 12 figures remains until a successful attempt to break through the 61.8% Fibonacci level. Fundamental component: There was practically no news background for the euro-dollar instrument on Thursday. This explains the weak activity of the currency market and the inability of the instrument to continue to decline below the level of 61.8% Fibonacci or to start building wave 5. Moreover, there was only data from the US Department of Labor on applications for unemployment benefits. The total number of which amounted to 234,000, which is slightly higher than market expectations. There was also data on sales in the secondary housing market in November, which also turned out to be slightly worse than forecasts. Today, there will be several interesting economic reports in America that will undoubtedly attract the attention of the market. First of all, we are talking about the report on GDP for the third quarter. According to market expectations, GDP should increase by 2.1%, and any value below this will be regarded as negative for the dollar. In addition, markets will closely monitor data on personal income and expenses of the American population, which should grow by 0.3% and 0.4%, respectively. You should also pay attention to the University of Michigan consumer confidence index, which may exceed the value of November 99.2. Thus, these three reports will be called upon today to help the US dollar reach breaking through the 61.8% Fibonacci, which will allow markets to continue to participate in the construction of a new downward trend. General conclusions and recommendations: The euro-dollar pair presumably completed the construction of the upward trend section. Thus, I would recommend buying an instrument with targets near the calculated levels of 1.1233 and 1.1303, which equates to 127.2% and 161.8% Fibonacci, only in case of a successful attempt to break through the level of 100.0%. At the same time, I also recommend selling the instrument after a successful attempt at a breakthrough of 1.1109, which will confirm the willingness of the markets to continue selling Eurocurrencies. GBP / USD On December 19, GBP / USD pair lost another 70 basis points and, thus, continues to build the proposed bearish section of the trend and its wave 1 or a. Thus, the decline in quotes of the instrument can continue today, on Friday, with targets located around 61.8% Fibonacci. On the other hand, the upward trend section is currently considered complete. Therefore, I expect to see at least a three-wave descending wave structure. However, an unsuccessful attempt to break through the 61.8% Fibonacci level may lead to the start of building wave 2 or b. Fundamental component: On Thursday, the news background for the GBP / USD instrument was very important. The Bank of England meeting, which is the last for 2019, was designed to answer the question "when is the Central Bank preparing to change its key rate?" Many believed that a reduction to the level of 0.5% would be carried out in the coming months, and thus, someone believed that the rate should not be reduced. In addition, the Bank of England itself has taken the most neutral position, and its accompanying statements can be interpreted as you like. In turn, representatives of the Central Bank did not give a clear answer to the question of when to expect changes in monetary policy. It was only noted that economic reports in the UK do have a tendency to decline and this worries the members of the monetary policy committee. However, nothing less exciting is the upcoming Brexit uncertainty, related to future negotiations between London and Brussels on various agreements, in particular trade, which will determine the relationship between them after Brexit. The Bank of England is also worried about possible new trade wars or an escalation of existing ones that have a negative impact on the entire world economy and the UK economy in particular. Thus, the British Central Bank took a wait-and-see position and intends to intervene only in case of emergency. General conclusions and recommendations: The pound / dollar instrument supposedly completed the construction of the upward trend section. Thus, I recommend continuing to sell the instrument with targets near 1.2950, which roughly corresponds to the 61.8% Fibonacci level. The departure of quotes from the reached lows in the framework of building correctional wave 2 can be considered for the possibility of new sales of the instrument. The material has been provided by InstaForex Company - www.instaforex.com |
| Trading plan for Bitcoin for December 20, 2019 Posted: 19 Dec 2019 11:41 PM PST
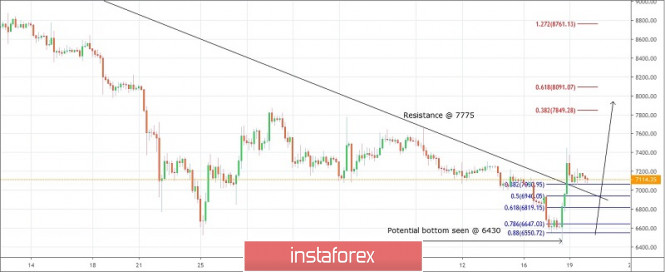
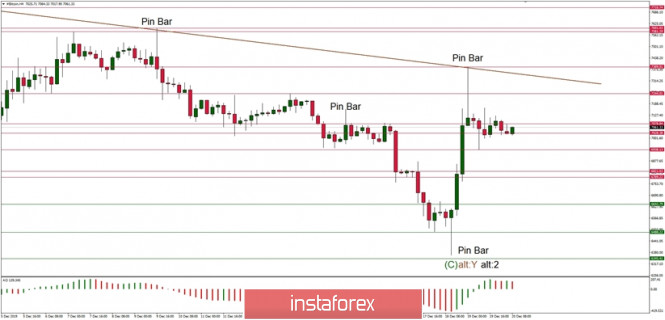
Technical outlook: Bitcoin is testing the backside of resistance trend line which is support around the 7044 level before bouncing back. Please note that the cryptocurrency may drop further towards the Fibonacci retracement at 6819. It may move higher towards 7850 and 8100 levels as presented here. Ideally, a minimum required retracement has been reached (towards 0.382 support at 7050), and a rally could start from here as well. Please note that Bitcoin should stay above 6430 levels to keep the above projected bullish structure intact. Also note that immediate price resistance is seen at 7775 level. It falls in line with bulls targeting 7850 level. Trading point of view, Bitcoin remains a buy on dip towards 6820 levels while risk remains at 6430 level, respectively. Trading plan: Remain bullish and add further on dips towards 6820 levels, stop at 6430 an target 7850, 8100 at least. Good luck! The material has been provided by InstaForex Company - www.instaforex.com |
| Indicator analysis: Daily review on GBP / USD on December 20, 2019 Posted: 19 Dec 2019 11:41 PM PST The pair continued to move down on Thursday, breaking through the support line of 1.3046 presented in a white bold line. Today, strong calendar news is expected for the pound at 09:30 UTC and for the dollar at 13:30 UTC. Also, the market may move up with the upper target of 1.3064 the resistance line presented in a white bold line. Breaking up this line is unlikely. Trend analysis (Fig. 1). Today, the price can make a pullback of an upward movement with the first target 1.3058 the resistance lines presented in a white bold line. If this line is reached, work down to the next target 1.2979 the support line presented in a red bold line.
Fig. 1 (daily chart). Comprehensive analysis: - Indicator analysis - up; - Fibonacci levels - up; - Volumes - down; - Candlestick analysis - up; - Trend analysis - down; - Bollinger Lines - down; - Weekly schedule - down. General conclusion: On Friday, the price may roll back up. Another scenario is also possible, where, from the resistance line of 1.3058 presented in a white bold line, work up with the target of 1.3134 at the upper fractal. The material has been provided by InstaForex Company - www.instaforex.com |
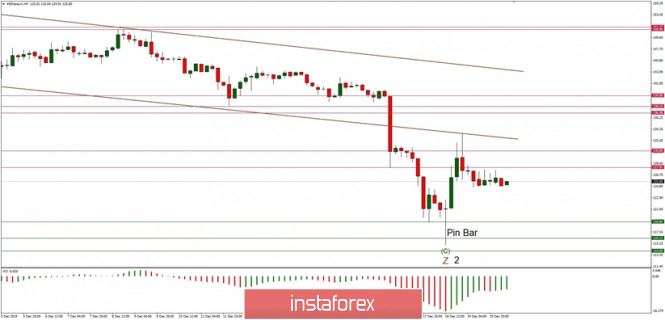
| Technical analysis of ETH/USD for 20/12/2019: Posted: 19 Dec 2019 11:38 PM PST Crypto Industry News: The US Securities Commission has announced that it is looking for ways to expand the "accredited investor" classification, which may have serious implications for capital creation by companies that are not determined to meet the full public reporting requirements. According to the announcement published on the SEC website, the regulatory authority is awaiting opinions on changes in its category of accredited investor. Currently, the SEC defines an accredited investor as a person with assets over USD 1 million or an entity controlling assets worth over USD 5 million. Other classification methods include being a board member of a company making an offer. The question of who qualifies as an accredited investor has long been controversial. SEC's exemptions allow companies to offer shares to such investors without having to meet all requirements. Theoretically, this is to protect everyday investors from predatory offers, but criticism of these classifications says that such exclusions simply help the rich get rich while prohibiting investors from making money. The new changes would basically open the classification for new investors, including those whose professional qualifications and certificates suggest that they have sufficient knowledge to invest in private offers. Similarly, "competent employees" may have the same access to their companies' offers as management currently has. Technical Market Overview: The ETH/USD has made a low at the level of $115.05 that ended up in a form of a Pin Bar/ Hammer candlestick pattern and might be labeled as a bottom for the wave (C) of the wave 2. Then the up wave has extended the move to the level of $133.62 and it was terminated by Bearish Engulfing candlestick pattern. From the Elliott wave point of view, it means the end of the corrective cycle at the mentioned level and a possibility for a new uptrend to start unfolding soon. So far, the bulls have managed to hit the level of $130.60 with a high made just at the level of the lower channel line at $133.62. If the uptrend resumes, the next target for bulls is seen at the level of $139.90. Weekly Pivot Points: WR3 - $160.13 WR2 - $155.12 WR1 - $147.83 Weekly Pivot - $142.21 WS1 - $135.13 WS2 - $130.72 WS3 - $123.35 Trading Recommendations: The best strategy in the current market conditions is to trade with the larger timeframe trend, which is down. All the shorter timeframe moves are still being treated as a counter-trend correction inside of the downtrend. When the wave 2 corrective cycles are completed, the market might will ready for another wave up.
|
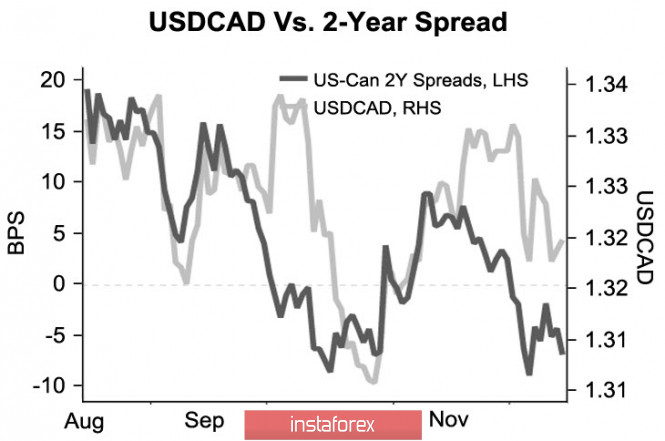
| Posted: 19 Dec 2019 11:32 PM PST On Thursday, economic data for the United States came out generally disappointing. The Philadelphia manufacturing index was only 0.3% against the expected 8%, while the number of unemployment claims rose 234 thousand against expectations of 225 thousand. At the same time, news about Trump's impeachment has little effect on quotes, primarily because there are no chances for impeachment to pass through the Republican-controlled Senate. In general, market sentiment remains positive. US Treasury Secretary Mnuchin said on Thursday that the first phase of a trade agreement with China could be signed in early January, which is seen by markets as a sign of positive momentum in the negotiations. Moreover, US stock exchanges closed in the green zone, Asian indices are trading higher on Friday morning, and gold is stable - all these signs point to a slightly positive background, which gives an advantage to profitable assets. USD/CAD The Canadian dollar continues to feel confident, winning back a number of positive factors. These primarily include the reduction of global uncertainty, oil prices remain steadily above $ 60 per barrel, the dynamics of the yield spread of T-bills of the USA and Canada support the Canadian at least in the short term. On the other hand, disappointment from a labor market report released last week was temporary, with Loonie staying in a downward range and updating a 1.5-month high against the dollar. There are also other negative factors, for example, the updated USMCA trade agreement between the USA, Canada and Mexico was approved by the US House of Representatives. For Canada, its benefits are far from as obvious as for the USA, but political arguments in this case outweigh the economic ones. In general, short-term factors affecting the loonie look positive. The Bank of Canada's lack of intent to cut interest rates in the foreseeable future supports bond yields, while OPEC +'s reduced production raises oil prices, which in total provides CAD short-term support. USD/CAD is targeted at 1.3042, and thus, a decline in support will mean the vulnerability of the annual minimum of 1.3015. Therefore, a further decline is still unlikely without a correctional rollback. USD/JPY Inflation in November rose by 0.5% y / y, which is better than 0.2% a month earlier, but still hopelessly far from the target level of 2%. At the same time, a number of publications, for example, Mizuho Bank, hold pessimistic views on the prospects for the Japanese economy, while the increase in consumer tax does not produce the expected effect. Both Japan's imports and exports fell markedly in November - by 15.7% and 7.9%, respectively, activity in the manufacturing sector was steadily below 50p, and output did peak at levels lower than 5 years ago before launching a large-scale reform. On Thursday, the Bank of Japan left monetary policy unchanged, however, the sliding economy into a recession is becoming too obvious to ignore. As a result, there are more and more votes in favor of the Bank of Japan and the Abe government taking coordinated measures both in monetary and fiscal policies, since a drop in real interest rates threatens a large-scale banking crisis. Now, USD/JPY continues to trade in a range. Most analysts are inclined to expect a breakthrough as global uncertainty is reduced. At the same time, it is obvious that the wave of positive in recent days has no serious basis, since it is based on political rather than economic factors. If the positive is not offset by any unexpected factor, then USD/JPY breaking through the resistance zone 109.60 / 71 seems inevitable, even a weak dollar will not be able to prevent the yen from selling. However, if euphoria declines, then trading will continue in the range. The material has been provided by InstaForex Company - www.instaforex.com |
| Technical analysis of BTC/USD for 20/12/2019: Posted: 19 Dec 2019 11:31 PM PST Crypto Industry News: The Iranian president proposed the creation of a Muslim cryptocurrency as one of many ways to oppose US economic dominance. Speaking at an Islamic conference in Malaysia, Iranian President Hassan Rouhani called on Muslim nations to strengthen financial and trade cooperation and to reduce dependence on the US dollar, according to a report by the financial media. As Rouhani argued, US economic sanctions are "the main tools for dominating hegemony and intimidation" of other nations. Rouhani proposed establishing a special banking and financial system among Muslim nations that use local currencies to trade. Local reports confirm that Rouhani proposed creating a cryptocurrency as part of this effort. "The Muslim world should develop measures to protect against the dominance of the US dollar and the US financial regime," he said. The conference was also attended by leaders of major Muslim countries, including Turkey, Qatar and Malaysia, while Saudi Arabia and Pakistan withdrew from the conference. The idea of the Iranian president has reportedly met with support from Malaysia itself, because the country's prime minister, Mahathir Mohamad, supported the initiative, according to a local press release. The official noted that for the first time Iran and Turkey are considering the possibility of creating an alternative to the US dollar. "We can use our own currencies or have a common currency," he said. Meanwhile, Turkish President Recep Tayyip Erdogan has clearly criticized the Islamic Cooperation Organization, arguing that the platform connecting the Muslim world has shown "lack of implementation." Erdogan also emphasized that Muslim countries should focus on Islamic financing, suggesting the creation of a special working group. Technical Market Overview: From the Elliott wave point of view, the last impulsive rally might be labeled as wave 1 of the new upward move. If it is so, then the most important level is the low of the Pin Bar located at $6,365 and this level can not be violated by bears. Currently, the market is developing the corrective structure and it is consolidating the recent gains in a narrow range located between the levels of $6,938 - $7,162. The moves up should be continued once the correction is over. Weekly Pivot Points: WR3 - $8,020 WR2 - $7,786 WR1 - $7,335 Weekly Pivot - $7,151 WS1 - $6,714 WS2 - $6,500 WS3 - $6,073 Trading Recommendations: The best strategy in the current market conditions is to trade with the larger timeframe trend, which is still down. All the shorter timeframe moves are still being treated as a counter-trend correction inside of the uptrend. When the wave 2 corrective cycles are completed, the market might will ready for another impulsive wave up of a higher degree and uptrend continuation.
|
| EUR / USD, Dollar ignores negative statistics and grows on news from China Posted: 19 Dec 2019 11:25 PM PST The dollar index returned to the area of 97 points, reflecting the demand for US currency throughout the market. Such dynamics look somewhat unusual, given the weak US macroeconomic reports that were published yesterday. And although we are talking about indicators of the "second plan", they still had to alert dollar bulls, especially in light of the mixed results of the December meeting of the Fed. But the market focused on other aspects, such as on the prospects for US-Chinese trade relations where Beijing, yesterday, took another friendly step towards the Americans, and this fact provided significant support to the dollar, preventing the EUR / USD bulls from continuing their upside movement. Let me remind you that later on last week, China and the United States reached a compromise solution and agreed on the first phase of the trade agreement, thereby preventing the development of a trade war. Washington pledged not to introduce "December duties" on Chinese imports worth $ 160 billion a year. In addition, the US promised to halve 15 percent duties on $ 120 billion Chinese goods. At the same time, 25 percent of duties on $ 250 billion in imports remain in force. Beijing, in turn, pledged to increase purchases of US goods. Both parties did not comment in detail on the deal, including Chinese commitments under the agreement. That is why yesterday's news from China could "detonate" among dollar pairs in this way: Beijing finally announced its share of obligations. The State Council of China approved the first part of the second list of American goods that will not be subject to additional duties. This decision will not be valid on an ongoing basis where the "preferential treatment" is introduced from December 26 of this year and ends on December 25, 2020, with a possibility of further extension.
The first batch of the second list included white oil - a colorless transparent liquid that consists of a mixture of liquid hydrocarbons-- food grade microcrystalline paraffin, high density polyethylene, metallocene, ethylene-propylene copolymer and "some other products". According to a statement issued by the State Council of the PRC, the Committee on Customs Duties and Tariffs will continue to compile new lists of goods that will not be subject to additional duties. However, the Chinese did not limit themselves to any time frame and according to them, the list of the second batch of the second list of goods from the United States will be published "in a timely manner". The implementation of the first phase of the trade agreement is certainly an important signal for the foreign exchange market. The beneficiary of this situation was the American dollar, which yesterday rose in price throughout the market. Indeed, this "thaw" in relations between the USA and China will probably not be left without attention of the members of the Federal Reserve. Apparently, the regulator will continue to hold a pause in the issue of easing monetary policy. Nevertheless, it is difficult to predict how long the optimism between the US and China's relation will last on the market. The fact is that the most complex and strategically important issues will be discussed by the parties in the framework of the second phase of negotiations. Sooner or later, dollar bulls will come to the obvious conclusion that the risk of a trade war is still high, especially in light of the upcoming US presidential election. Furthermore, the EUR / USD traders unjustifiably, in my opinion, ignored yesterday's macroeconomic reports, which were published in the USA and which appeared in the "red zone". And although we are talking about secondary indicators, their impact should not be minimized anyway. For example, the Fed-Philadelphia manufacturing index fell sharply in December, showing the worst growth rate for the whole year. The indicator, which is based on a survey of manufacturing companies in this region, reached 0.3 points with a growth forecast of 8.1 and a previous result of 10.4 points (the employment component grew by 17 points, whereas in November it reached 21 paragraph). In addition to this, the rate of initial applications for unemployment benefits was also disappointing. After several months, this weekly indicator came out at the same level within the range of 210-220 thousand, although, this week he jumped to 234 thousand while last week the result was 252 thousand, which is even worse. The growth of this indicator is a negative signal for the US labor market where at the same time bad news came from the US real estate market as home sales in the secondary market collapsed to -1.7% in November while there was 1.5% growth recorded in October Experts expected negative dynamics as the forecast announced -0.4%, but real numbers are worse than expected. But the market ignored the above releases, focusing on the news of the external fundamental background. Nevertheless, I believe that today traders will turn their eyes to macroeconomic statistics. The fact is that during the American session, the main index of personal consumption spending will be published, which measures the core level of spending and indirectly affects the dynamics of inflation in the United States. It is believed that this indicator is carefully monitored by regulator members.
According to forecasts, the index will show contradictory dynamics, where, it will grow to 0.2% on a monthly term, while it will decrease to 1.5% annually. This release may have a corresponding effect on the EUR / USD pair if it deviates from the forecast values. The support level for the pair is located at 1.1080 presented by the middle line of the Bollinger Bands indicator, which coincides with the upper border of the Kumo cloud on the daily chart. The resistance line is the upper line of the above indicator, which corresponds to the price of 1.1180. The material has been provided by InstaForex Company - www.instaforex.com |
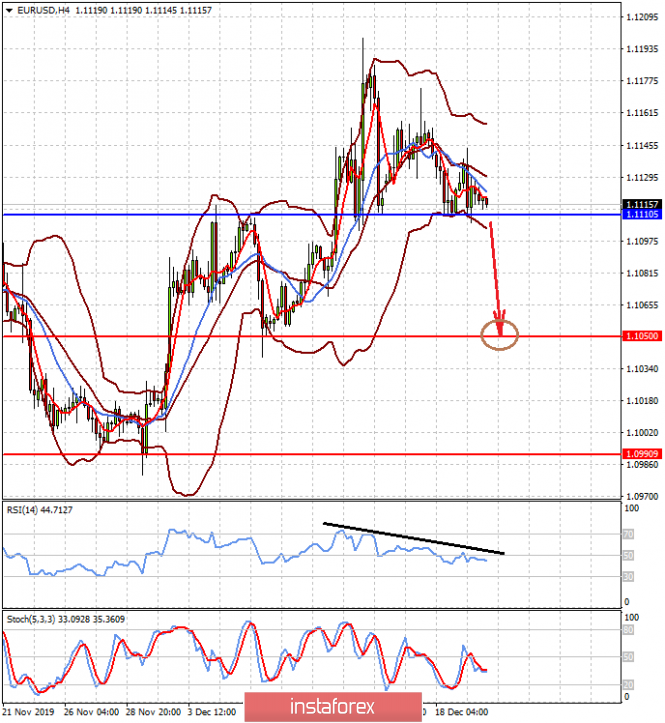
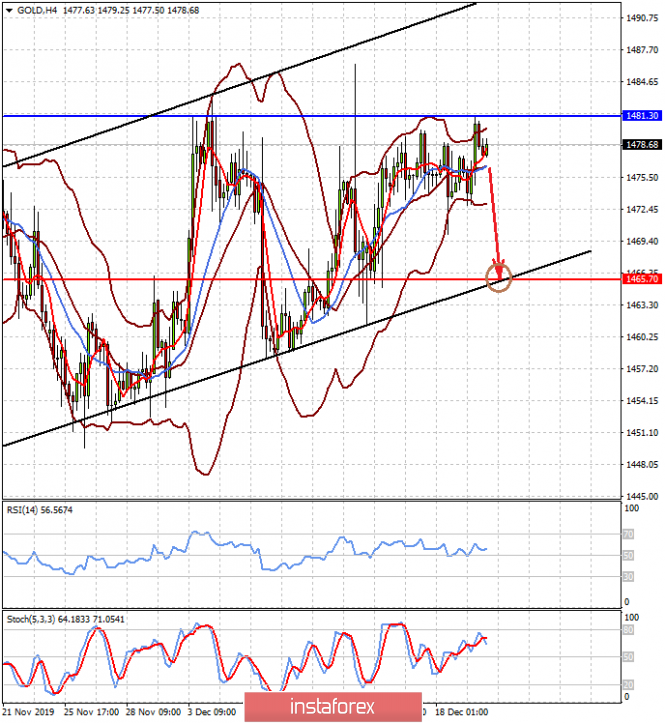
| Posted: 19 Dec 2019 11:23 PM PST The US dollar remains generally under pressure in the wake of two main factors. On the one hand, these are the problems of the impeachment of D. Trump by the democrats, and although few people believe in his success, he remains as a potential negativity in the minds of investors. On the other hand, oddly enough, it is still the result of the last meeting of the Federal Reserve on monetary policy. Regarding the prospects for impeachment of Trump, we note that its effect on the dollar is happening through the dynamics of the yield of US government bonds of the US Treasury. They continue to show slurred movement. But the consequences of the December meeting of the regulator really turned out to be more important than anticipated. At the same time, the Fed made it clear in the face of its leader J. Powell that it was stopping the rate cuts, which in theory should, on the contrary, stimulate the growth of the dollar, but this led to the opposite, which is to an increase in demand for risk and, as a result, to an increase in the purchase of shares of companies and other assets. As the consequences of the 2008-09 crisis showed, it is the dollar that remains an outsider in this situation, and it does not matter what kind of economic statistics come out, positive or not. In addition, the epic with the US-Chinese trade war is not over yet, which leads to a weakening dollar, but so far, only limited. Today, investors will focus on the publication of US GDP data for the third quarter. It is assumed that it will maintain a growth rate of 2.1%, while the deflator will add up to 1.6% against 1.7%. We believe that such figures can give a positive impulse to demand for shares of American companies, as well as support the dollar, if they do not turn out worse, together with the values of the basic price index for personal consumption (RFE), which should also maintain a growth rate of 1.6%. Another important supporting factor may be the data of the index of expectations and consumer sentiment from the University of Michigan for the month of December. It is assumed that the indicators will rise respectively to 89.7 points and 99.2 points, and their November values will be revised upward. In general, we do not expect anything considering the situation in the currency exchange market, Moreover, after a surge in activity in the wake of the publication of statistics, its continuation is noticeable until the end of this year. Forecast of the day: EUR/USD remains under pressure. Strong US economic statistics may push the pair below 1.1110. Against this background, it can decline to 1.1050. Gold quotes continue to balance, "not knowing" where to move. But today, they may be under pressure if economic data from America does not disappoint. Thus, we expect a limited decline to 1465.70. |
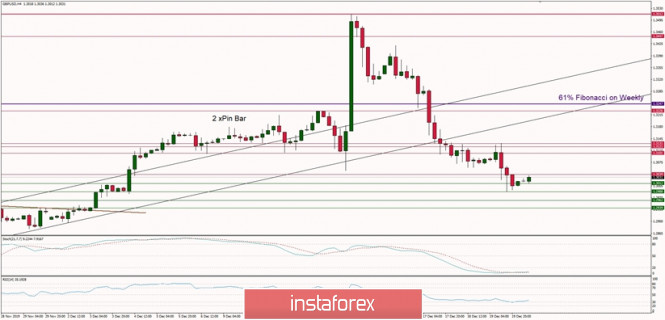
| Technical analysis of GBP/USD for 20/12/2019: Posted: 19 Dec 2019 11:22 PM PST Technical Market Overview: The GBP/USD pair has made another lower low after the battle of 61% Fibonacci retracement on the weekly timeframe has been lost by bulls. The bears have managed to push the prices below the technical support located at the level of 1.3101 and made a new local low at the level of 1.2988. Moreover, the price fell out of the old main channel as well, which additionally indicates the strength of the bearish move. The next target for bears is seen at the level of 1.2962 and the immediate technical resistance is seen at the level of 1.3039 and 1.3101. Weekly Pivot Points: WR3 - 1.4019 WR2 - 1.3748 WR1 - 1.3564 Weekly Pivot - 1.3301 WS1 - 1.3081 WS2 - 1.2836 WS3 - 1.2626 Trading Recommendations: The best strategy for current market conditions is to trade with the larger timeframe trend, which is up. All downward moves will be treated as local corrections in the uptrend. In order to reverse the trend from up to down, the key level for bulls is seen at 1.2756 and it must be clearly violated. The key long-term technical support is seen at the level of 1.2231 - 1.2224 and the key long-term technical resistance is located at the level of 1.3509.
|
| Trading plan for EURUSD for December 20, 2019 Posted: 19 Dec 2019 11:18 PM PST
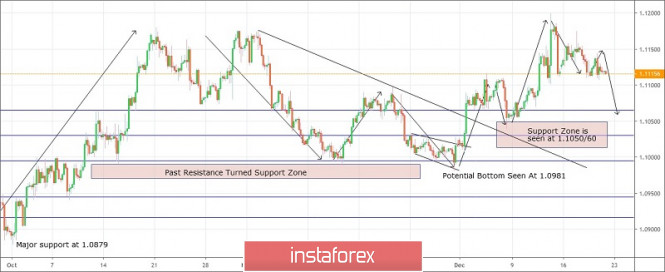
Technical outlook: EURUSD continues to drift sideways within a tight range, attempting to find bottom close to 1.1060 level. In the short-term, intraday resistance should be seen at 1.1150/60 levels. A bearish bounce may occur if the prices manage to reach these levels.The overall structure remains bullish until prices stay above 1.0879 and the projected upside target is above 1.1500. In the immediate short term, the recent rally between 1.0981 and 1.1200 levels will take place. The pair is expected to find support near the 61.8% Fibonacci level around 1.1060. The euro is expected to bounce towards 1.1150 from current levels at 1.1115 before bears take control back and drag prices lower towards 1.1060. A bullish reaction can be expected at 1.1060 and it should be considered as another opportunity to open long positions. Trading plan: Remain bullish and buy more around 1.1060, stop at 1.0879m target 1.1500 Good luck! The material has been provided by InstaForex Company - www.instaforex.com |
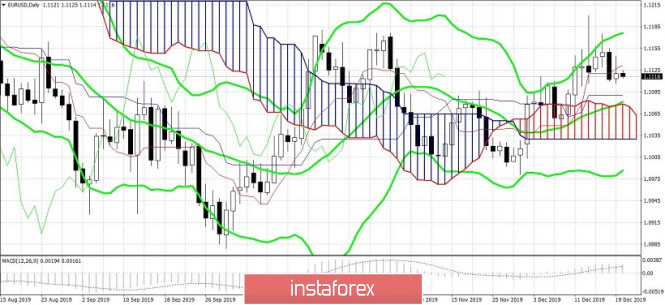
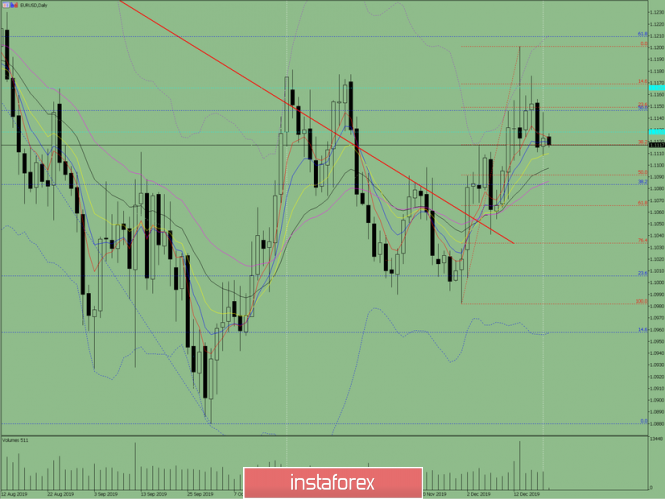
| Technical analysis of EUR/USD for 20/12/2019: Posted: 19 Dec 2019 11:17 PM PST Technical Market Overview: After the breakout below the short-term trend line support (thick orange line), the EUR/USD pair is now consolidating in a narrow range located between the levels of 1.1106 -1.1140. The bulls are still in control of the market, at least at the lower timeframes, but bears have managed to make another lower low at the level of 1.1110 and in the near term they might push prices even lower towards the level of 1.1087. Although the higher timeframes trend remains bearish, the global investors must take into account, that the EUR/USD might be finally breaking up from the multi-month Ending Diagonal pattern. Weekly Pivot Points: WR3 - 1.1337 WR2 - 1.1267 WR1 - 1.1190 Weekly Pivot - 1.1121 WS1 - 1.1048 WS2 - 1.0978 WS3 - 1.0897 Trading Recommendations: The best strategy for current market conditions is to trade with the larger timeframe trend, which is down. All upward moves will be treated as local corrections in the downtrend. The downtrend is valid as long as it is terminated or the level of 1.1445 clearly violated. There is an Ending Diagonal price pattern visible on the larget timeframes that indicate a possible downtrend termination soon. The key short-term levels are technical support at the level of 1.1040 and the technical resistance at the level of 1.1267.
|
| Indicator analysis: Daily review on EUR / USD on December 20, 2019 Posted: 19 Dec 2019 11:08 PM PST Trend analysis (Fig. 1). Today, the price may begin to move down with the first target 1.1108 which is the lower fractal. If this level is reached, there is a continuation to work down with the target 1.1098 which is equivalent to 21 average EMA presented in a black thin line.
Fig. 1 (daily chart). Comprehensive analysis: - Indicator analysis - down; - Fibonacci levels - down; - Volumes - down; - Candlestick analysis - down; - Trend analysis - up; - Bollinger Lines - up; - Weekly schedule - up. General conclusion: A downtrend is possible on Friday. An unlikely scenario is possible, which is, from a pullback level of 38.2% which is equivalent to 1.1117 presented in a red dashed line, the price will go up to the upper target 1.1146 the pullback level of 50.0% presented in a blue dashed line. The material has been provided by InstaForex Company - www.instaforex.com |
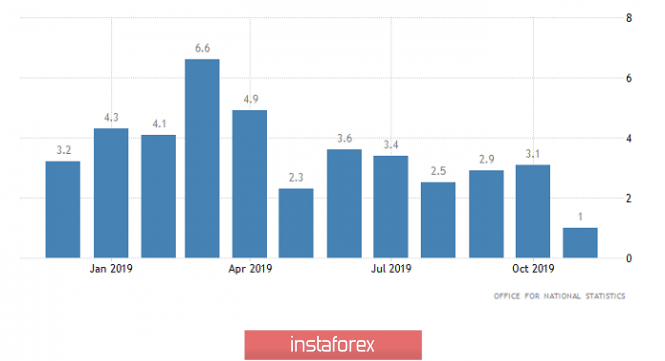
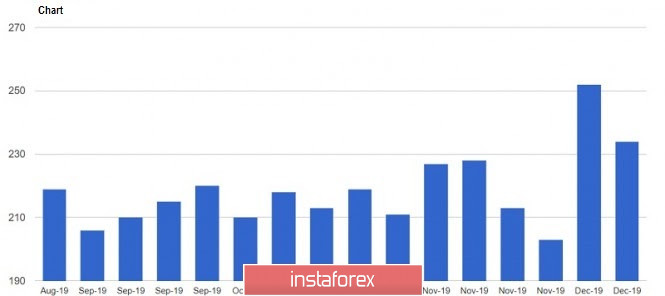
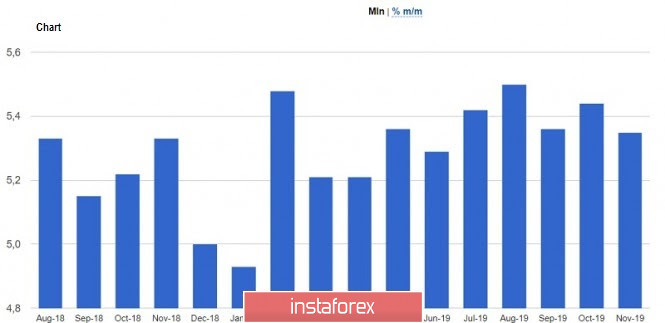
| Hot forecast for GBP/USD on 12/20/2019 and trading recommendation Posted: 19 Dec 2019 10:44 PM PST The pound declined quite confidently yesterday under the pressure of circumstances, and this process stopped only in the evening. However, the Bank of England has nothing to do with this. As expected, the refinancing rate was left unchanged, just as the distribution of votes did not change during the voting on this issue. Seven spoke in favor of maintaining the refinancing rate at the current level, while the remaining two in favor of lowering it. In fact, nothing has changed. In addition, the Bank of England made it clear to everyone once again that the refinancing rate will be reduced before the final withdrawal of Great Britain from the European Union, that is, not after January 31, but immediately after the end of the transition period. But this is still a long way off, so there is nothing to worry about so far. Nevertheless, the pound experienced a certain shock from retail sales data, the growth rate of which slowed from 3.1% to 1.0%. Hysteria is caused by the fact that they predicted a slowdown of up to 2.1%, while the biggest optimists generally counted at 2.3%. But unfortunately, the reality was much worse. In fact, there has been a serious decline in consumer activity, which has never foreshadow anything good. Retail Sales (UK): The decline of the pound was stopped only by American statistics, which turned out to be not less frightening. Therefore, the number of initial applications for unemployment benefits fell by 18 thousand, while they predicted a decrease of 33 thousand. On the other hand, the number of repeated applications for unemployment benefits increased by 51 thousand, although it was supposed to increase by 14 thousand. As a result, investors saw their growth instead of the total reducing the number of applications for unemployment benefits. In addition, home sales in the secondary market decreased by 1.7%, instead of increasing by 0.8%. Secondary Home Sales (United States): Today, we will see an attempt to repeat what happened yesterday. The pound will initially decline, under the pressure of a slowdown in GDP growth from 1.3% to 1.0%. But unlike yesterday, US statistics will not stop this process, but lead precisely to the growth of the pound, as in the United States a slowdown in GDP growth is projected, from only 2.3% to 2.1%. GDP growth rate (United States): In terms of technical analysis, we see that the GBP / USD pair, as expected, managed to get closer to the psychological level of 1.3000, where it slowed down at a small amplitude. In fact, we got a full return of the quotation to the point of beginning, an earlier move, confirming the theory of the emotional component of the market. Considering the trading chart in general terms, we see that the pound sterling occupies rather high levels relative to the existing movement, which can be reflected in a further decrease in the medium term. Thus, it is likely to assume that pressure from the side of the level of 1.3000 will locally hold back the quote, which can be reflected in a temporary fluctuation, within 1.2990 / 1.3040, where the behavior of the quote and the price fixing point should be carefully studied. Concretizing all of the above into trading signals: - Long positions are considered in case of price fixing higher than 1.3050. - Short positions are considered in case of price fixing lower than 1.2985. From the point of view of a comprehensive indicator analysis, we see that indicators, relative to all time sections, retain downward interest which confirms the dynamics of the market. |
| Trading plan on EUR/USD for December 20. The euro is under pressure. Posted: 19 Dec 2019 10:15 PM PST
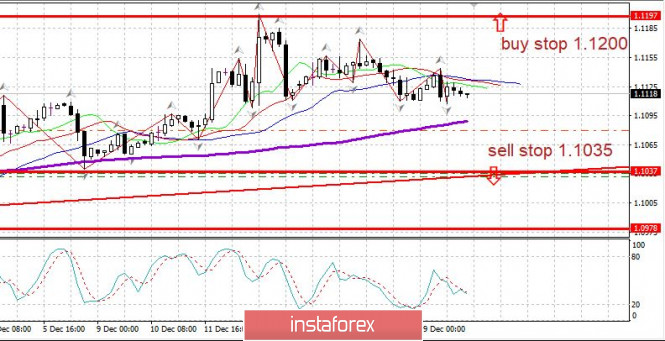
Although the issue is postponed probably until January, the impeachment of Trump in the US remains to be an important news. Meanwhile, Britain expects first parliamentary vote on Brexit. Today, December 20, the United States will release an inflation report at 14:30 London time. EUR/USD continues to remain in a narrow consolidation near the resistance line 1.1200. New growth remains possible. Keep buying from 1.1035, stop at breakeven. It is possible to buy at a breakthrough of 1.1200 up. The material has been provided by InstaForex Company - www.instaforex.com |
| Posted: 19 Dec 2019 10:15 PM PST The US dollar strengthened against the euro and the pound after the news that the US Senate approved the first of two spending packages to avoid government shutdown was released. The spending bill was passed after significant changes were made to the pension system. The White House said that President Trump would approve measures to provide nearly $1.4 trillion in spending.
The document states that in addition to the main items, expenses will be increased by adding 3.1% to the salaries of military and civil servants of the Federal government. An additional $ 425 million has also been allocated to ensure security during the elections, which will be held next fall. About $ 1.38 billion was sent to build a fence along the U.S. border with Mexico, which remains a major contentious issue. Let me remind you that at the end of last year, the problem of financing the construction of the wall on the southern border was the longest suspension of government activity in the history of the United States. As for yesterday's fundamental statistics on the United States, the dollar was not generally affected. The number of Americans applying for unemployment benefits for the first time has also fallen, confirming the healthy state of the labor market. The U.S. Department of Labor reports that the number of initial applications for unemployment benefits for the week of December 8-14 fell by 18,000 to 234,000, contrasting economists' expectation of 227,000. The moving average of applications also rose by 1,500 to 225,500. As for the number of secondary applications, from December 1 to 7, it increased by 51 000 and amounted to 1.72 million.
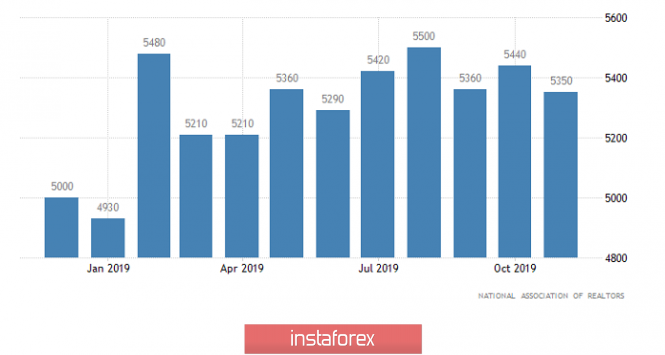
The good news for Donald Trump was the report on the current account deficit of the US balance of payments, which decreased in the 3rd quarter. This characterizes the degree of trade and financial flows between the United States and other countries. According to the report of the US Department of Commerce, the deficit amounted to 124.09 billion US dollars against the 125.21 billion dollars in the 2nd quarter of 2019. This is in contrast to economists' expectation of $ 121.9 billion in Q3. First of all, the reduction of imports of goods and the growth of investment income contributed to the reduction of the deficit. Meanwhile, data on manufacturing activity in the area of responsibility of the Federal Reserve Bank of Philadelphia did not impress traders. According to the report, while economists had expected the figure to be 8 points, the PMI in December fell to 0.3 points from 10.4 points in November. U.S. home sales in the secondary market also fell in November, as limited supply is holding back buyers, in spite of credit availability. Seasonality also affects the decline in sales, as a report by the National Association of realtors indicated that sales in the secondary housing market in November 2019 fell by 1.7% compared to the previous month and amounted to 5.35 million homes per year. Economists had expected sales to fall 0.4 percent. On the other hand, sales in November rose 2.7%, compared with the same period the previous year, Data from the Conference Board also did not have much impact on the volatility of the euro. The report showed that the index of leading indicators in November was 111.6 points, whereas economists predicted that the index will grow by 0.1%. As for the technical picture of the EUR/USD pair, after an unsuccessful attempt to update Wednesday's highs, the pressure on risky assets returned immediately after the bears pushed the trading instrument below the level of 1.1140. So far, this range remains to be a problem for the bulls, and only its breakdown will increase the probability of the further growth of EUR/USD in the area of highs 1.1170 and 1.1210. However, the pressure on risk assets is likely to continue. The breakout of the 1.1110 level will increase the pressure on the euro, which will push the pair to the lows of 1.1080 and 1.1040. A larger movement within the current range is unlikely, as traders do not have clear guidance from central banks by the end of the year, and much will depend on the incoming fundamental data. GBP/USD Pressure on the British pound will gradually weaken after yesterday's statements of the Bank of England on the situation with interest rates. In addition, today's data on consumer confidence in the UK provided little support to the pair. The increase in confidence was directly related to optimism about the situation in the economy, which should improve next year. According to the report of the research company GfK UK, consumer confidence index in December this year rose by three points to -11 points. Growth was noted in sub-indexes of the expectations of large and personal finances. As for the technical picture of the GBP/USD pair, the pressure on the pound is clearly slowing down, as today's UK GDP data may be the final chord for profit-taking on short positions gained by major players after the elections of the UK Parliament. Major support levels are seen in the area of 1.2890 and 1.2950. The material has been provided by InstaForex Company - www.instaforex.com |
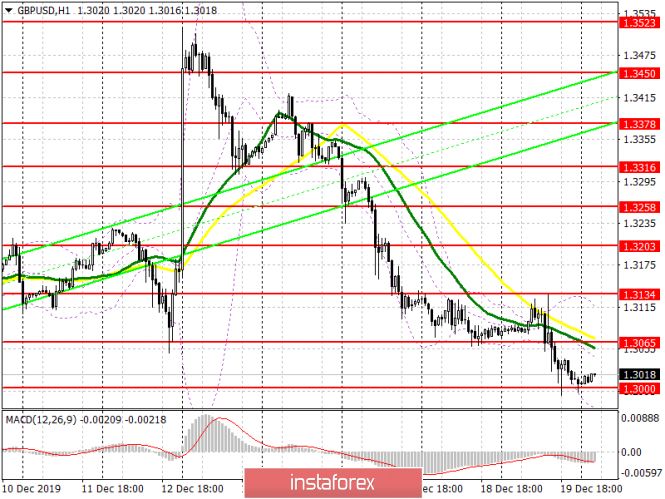
| Posted: 19 Dec 2019 08:19 PM PST To open long positions on GBP/ USD, you need: Yesterday's statements by the Bank of England that the rate can be both raised and lowered if necessary, and uncertainty in this matter returned the pressure on the British pound, and the breakthrough of the level of 1.3065 is expected to lead to a new wave of decline. At the moment, buyers need to protect the support of 1.3000, and this will have to be done with any data on the UK economy. A good report can allow you to climb to the resistance of 1.3065, which will lead to the demolition of several stop orders of sellers and a larger upward correction in the area of the maximum of 1.3134, where I recommend taking the profits. In the scenario of a further decline below the level of 1.3000 on GDP data, I recommend returning to long positions only after the test of the minimum of 1.2952, or a rebound from the support of 1.2896. To open short positions on GBP/USD, you need: Yesterday, the bears showed activity after trying to return GBP/USD to the resistance level of 1.3134, which I paid attention to in my review, and the statements of the Bank of England pushed the pound below 1.3065. At the moment, sellers will defend the resistance of 1.3065, and the formation of a false breakout in this area, together with bad data on the UK economy, will be a direct signal to open short positions. Another equally important task for sellers will be a breakthrough and consolidation below the support of 1.3000, which will collapse the pound to the lows of 1.2952 and 1.2896, where I recommend taking the profits. With the pair rising above 1.3065 on good GDP data, it is best to return to short positions on the rebound from the high of 1.3134. Indicator signals: Moving Averages Trading is below the 30 and 50 moving averages, which indicates a possible further decline in the pound. Bollinger Bands Support will be provided by the lower border of the indicator in the area of 1.2965, while growth will be limited to the upper level of the indicator in the area of 1.3080.
Description of indicators
|
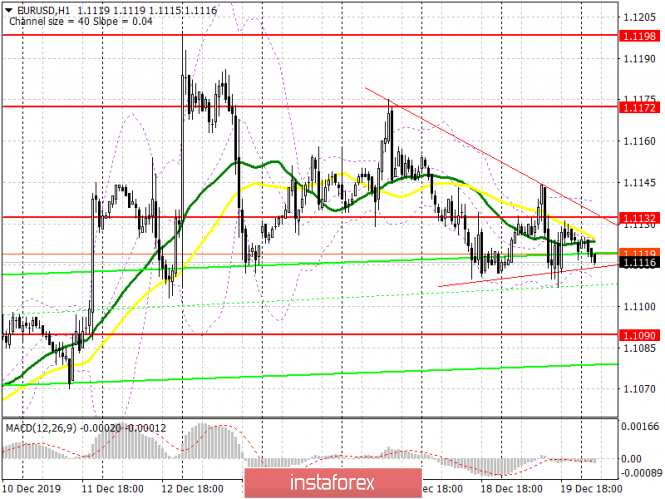
| Posted: 19 Dec 2019 08:19 PM PST To open long positions on EURUSD, you need: Yesterday, the bears once again did not let the pair above the resistance of 1.1132, and the same task of the bulls today is to return to this range. Data on the consumer climate and consumer spending index of the eurozone countries can help with this. Good indicators will return EUR/USD to 1.1132, which will lead to a breakdown of the downward triangle and a larger upward correction in the area of highs of 1.1172 and 1.1198, where I recommend taking the profits. In the scenario of lack of activity among buyers above the level of 1.1132, I recommend to postpone long positions until the update of the minimum of 1.1090, and in the case of a larger fall in the euro, after the data on the US economy, it is best to consider new purchases on the rebound from the area of 1.1041. To open short positions on EURUSD, you need: Sellers are actively defending the resistance of 1.1132. Yesterday's data on US economy made it possible to form a triangle and break of its lower boundary, which coincides with intermediate resistance around 1.1110, will increase the pressure on the euro, which will bring the pair to a minimum of 1.1090, and then open the way to a more distant target in the area of 1.1041, where I recommend fixing the profit. An unsuccessful consolidation above the resistance of 1.1132, which may occur in the first half of the day after the release of statistics on the eurozone countries, will also be an additional signal to open short positions in the euro. The main task is to prevent the renewal of yesterday's maximum, as such a scenario will lead to a return of demand for the euro. In this case, short positions are best postponed until the update of this week's highs at 1.1172, or after the update of the monthly resistance at 1.1198. Indicator signals: Moving Averages Trading is conducted in the area of 30 and 50 moving averages, which indicates the lateral nature of the market. Bollinger Bands Breaking the upper limit of the indicator around 1.1140 will lead to the growth of the European currency. The breakdown of the lower border, which coincides with the support of 1.1110, will increase the pressure on the euro.
Description of indicators
|


| You are subscribed to email updates from Forex analysis review. To stop receiving these emails, you may unsubscribe now. | Email delivery powered by Google |
| Google, 1600 Amphitheatre Parkway, Mountain View, CA 94043, United States | |
No comments:
Post a Comment