
Forex analysis review |
- Dollar index weekly analysis
- GBPUSD remains under pressure
- USDJPY bulls need to be very cautious
- Ichimoku cloud indicator analysis of EURUSD
- Ichimoku cloud indicator analysis of Gold
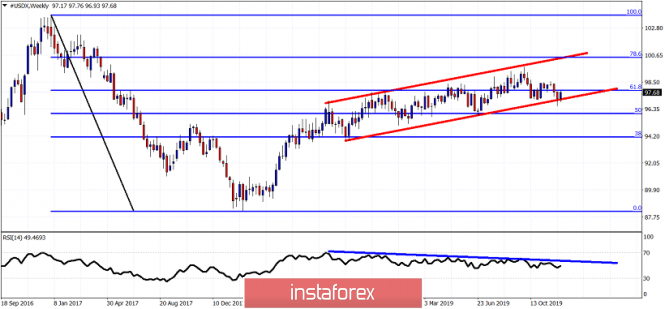
| Posted: 21 Dec 2019 11:01 AM PST The Dollar index has made no real progress for the last year as price is again where it was at the end of 2018. Price is stalling around a major Fibonacci retracement, with weakly bearish divergence signs.
Red lines - bullish channel Blue line - bearish divergence The Dollar index is trading inside a bullish channel since mid 2018. Price has not broken the lower channel boundary that was recently tested. This is a sign of strength on behalf of the bulls. However we should not ignore that the RSI is diverging and we are at the major 61.8% Fibonacci retracement level. This is a potential reversal area so we need to keep a close eye on last week's lows. Holding above it will be a sign of strength for bulls. Breaking below it will be a big win for bears. The material has been provided by InstaForex Company - www.instaforex.com |
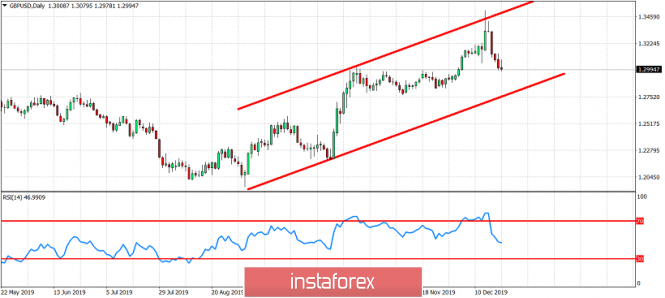
| Posted: 21 Dec 2019 10:43 AM PST GBPUSD topped two weeks ago just above 1.35 when we mentioned that a 5 wave move higher was about to complete. Price has since then pulled back below 1.30.
GBPUSD despite the sharp pull back from 1.35 remains inside the bullish medium-term channel. Channel support is at 1.2750-1.2770 area. This week I expect price to start lower and then bounce towards 1.31 before moving again lower towards the lower channel support. Although I believe the entire upward move from 1.1958 has been completed, the corrective phase we are currently in has still lots of room to unfold and is not over yet. The material has been provided by InstaForex Company - www.instaforex.com |
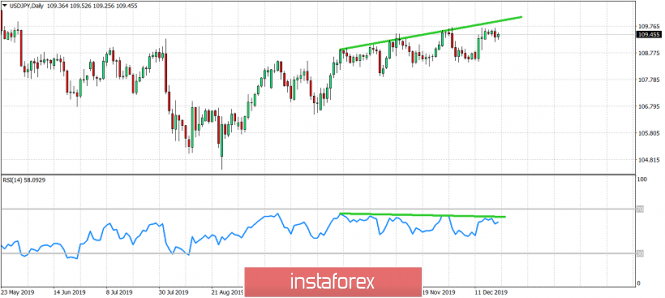
| USDJPY bulls need to be very cautious Posted: 21 Dec 2019 10:29 AM PST USDJPY has managed the last two weeks to climb above 109 and re-test the November highs. The RSI is providing several warning signs for bulls.
|
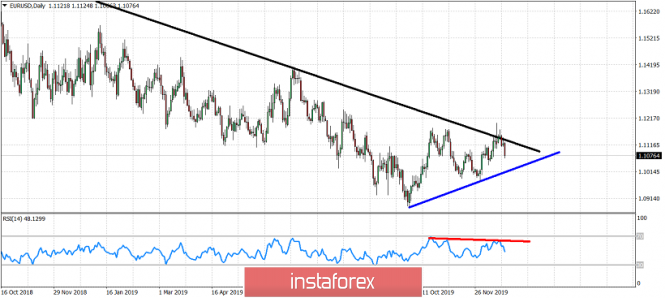
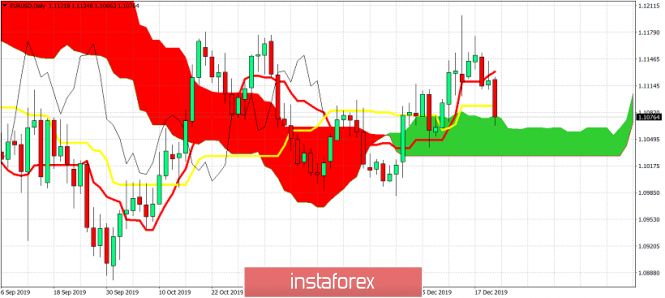
| Ichimoku cloud indicator analysis of EURUSD Posted: 21 Dec 2019 10:06 AM PST EURUSD was again unable to reclaim and stay above 1.1180. Price got rejected another time at the downward sloping resistance trend line and previous highs.
Blue line- support trend line Red line - bearish divergence EURUSD approached the downward sloping resistance trend line and the October highs. There was a bearish divergence also as shown in the Daily chart above. Price got rejected and fell below 1.11. Holding above the blue trend line is crucial for bulls. As long as price is above this area bulls remain hopeful. However bulls will need to show signs of strength by breaking and staying above 1.1180.
In Ichimoku cloud terms EURUSD is back testing cloud support. It is very possible to see price bounce off this support area and not break inside or below the Kumo. This would be a bearish sign. Bulls want to retake 1.11 at the start of the week in order to get more strength to move higher towards 1.1130 which is the next important Daily resistance. Bouncing off the cloud would be ideal for bulls according to the Ichimoku cloud indicator. This would also be highly probable....but bulls need to be aware not see price break below the cloud. The material has been provided by InstaForex Company - www.instaforex.com |
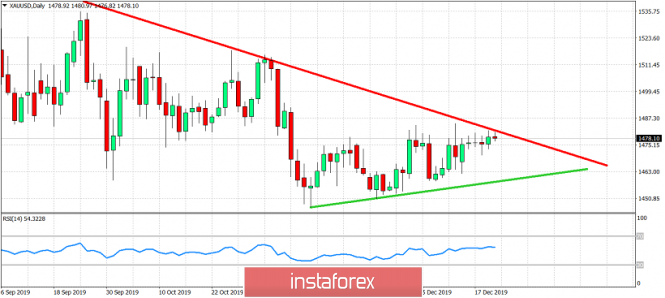
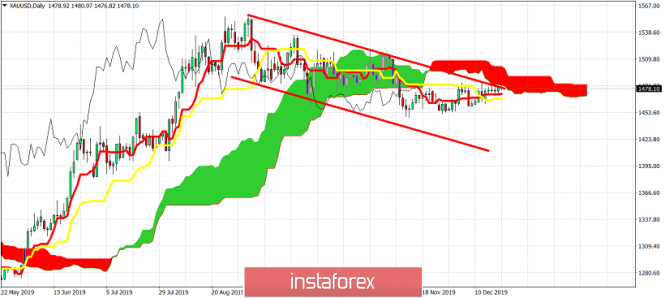
| Ichimoku cloud indicator analysis of Gold Posted: 21 Dec 2019 09:57 AM PST Gold price has made no real progress to the upside the past week. Gold price managed to climb back towards the major resistance of $1,490-$1,500 but in the end it got rejected. A bearish sign.
Green line - support trend line Gold price is challenging the medium-term downward sloping red trend line resistance. Trend remains bearish as price is still below this trend line. Support is at $1,460 where we see the green upward sloping trend line. As long as price holds above this level, bulls still have hopes for a break above the $1,490-$1,500 resistance and a move towards $1,550-$1,600. If price breaks below support we expect $1,430-$1,400 to be seen. Near resistance we prefer to be sellers as the risk reward favors the bearish scenario.
|
| You are subscribed to email updates from Forex analysis review. To stop receiving these emails, you may unsubscribe now. | Email delivery powered by Google |
| Google, 1600 Amphitheatre Parkway, Mountain View, CA 94043, United States | |
No comments:
Post a Comment