Forex analysis review |
- BTC 12.24.2019 - Daily anlaysis, rejection of the mulit pivot resistance at $7.650
- GBP/USD analysis for December 24,2019 - Upside breakout of the pivot reistance at 1.2958, watch for buying opportuntiies
- Gold 12.24.2019 - Strong bullish breakout and larger time-frame traders participation, our main target at $1.515 is on the
- Technical analysis of AUD/USD for December 24, 2019
- December 24, 2019 : EUR/USD Intraday technical analysis and trade recommendations.
- December 24, 2019 : GBP/USD Intraday technical analysis and trade recommendations.
- GBP/USD: plan for the European session on December 24. A trade agreement with the EU
- EUR/USD: plan for the European session on December 24. Data on the US economy pushed traders away from purchases of the US
- Forecast for EUR/USD for December 24, 2019
- Forecast for GBP/USD for December 24, 2019
- Forecast for AUD/USD for December 24, 2019
- Fractal analysis for major currency pairs as of December 24
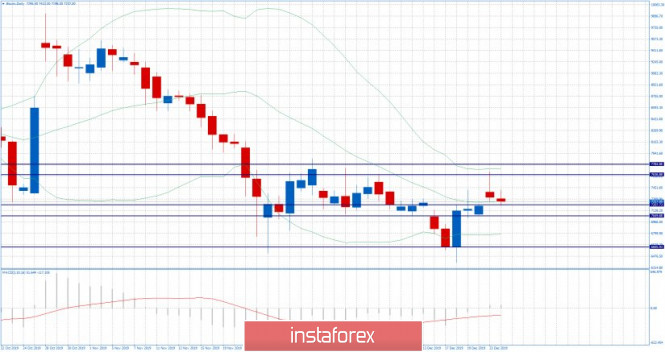
| BTC 12.24.2019 - Daily anlaysis, rejection of the mulit pivot resistance at $7.650 Posted: 24 Dec 2019 08:51 AM PST Technical analysis on the Bitcoin:
According to the daily time-frame, BTC did test and reject of the main multi pivot resistance at the price of $7.650. Bitcoin filled the gap area to the downside and It confirmed that sellers are still present. Support levels are seen at : $7.200 $7.000 $6.600 Resistance levels are seen at: $7.650 $7.850 MACD slow line is still negative and below the zero. Overall, the trend is still down, Watch for selling opportunities. The material has been provided by InstaForex Company - www.instaforex.com |
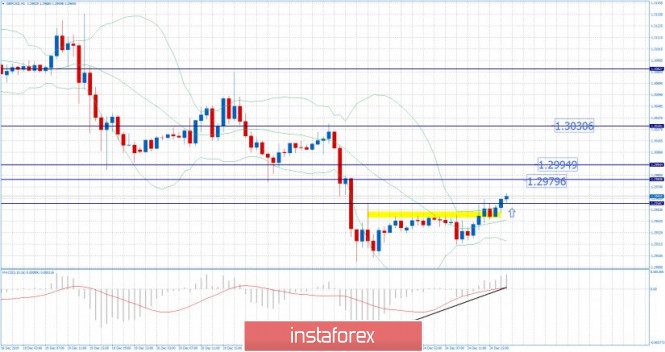
| Posted: 24 Dec 2019 08:45 AM PST GBP has been trading upwards in the past 24 hours as I expected. The broke the important pivot resistance at 1.2960. There is the failed bear flag pattern in the background, which is sign that buyers are in control. Upward targets and resistance levels to watch are set at 1.2979, 1.2995 and 1.3030.
MACD oscillator is showing mew momentum on the upside and slow line is sloping upside. Support level is seen at the price of 1.2958. Watch for buying opportunities on the dips on the lower frames like 5/15 minutes time-frame. The material has been provided by InstaForex Company - www.instaforex.com |
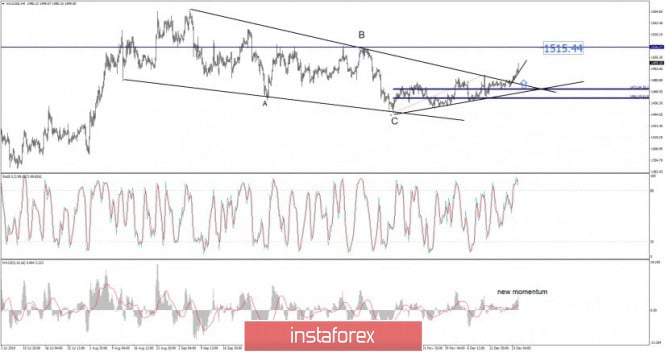
| Posted: 24 Dec 2019 08:36 AM PST Gold has been trading upwards in the past 24 hours as I expected. The price tested the level of $1.500. The upside breakout is still valid and there is chance for the potential test of $1.515, which is my main target.
Watch for buying opportunities on the dips and main target at the price of $1.515. MACD oscillator is showing mew momentum and it is confirming strong bullish condition. Resistance level is seen at the price of $1.515 and after that at $1.534 Support level is seen at the price of $1.486. In my opinion, there is the the influence from the larger time-frame traders in this bullish movement and it might have bigger bullish impact . The material has been provided by InstaForex Company - www.instaforex.com |
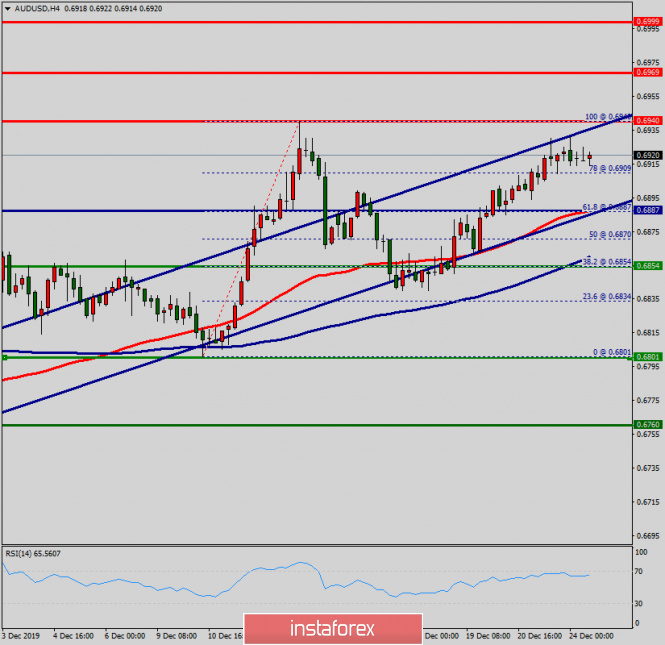
| Technical analysis of AUD/USD for December 24, 2019 Posted: 24 Dec 2019 04:37 AM PST Overview: The AUD/USD pair is continuing trading upwards from the level of 0.6887. Yesterday, the pair rose from the level of 0.6887 to the top around 0.6920. Also, it should be noted that the level of 0.6887 coincides with the ratio of 61.8% Fibonacci retracement levels. The AUD/USD pair broke resistance at the level of 0.6887 which turned into strong support at the golden ratio. In the H1 time frame, the level of 0.6887 is expected to act as major support today. Currently, the price is moving in a bullish channel. This is confirmed by the RSI indicator signaling that we are still in a bullish market. The price is still above the moving average (100) and (50). From this point, we expect the AUD/USD pair will be continuing to move in the bullish trend from the support level of 0.6887 towards the target level of 0.6940. The double top is set at the point of 0.6940 at the same time frame. If the pair succeeds in passing through the level of 0.6940, the market will indicate the bullish opportunity above the level of 0.6940 so as to reach the second target at 0.6969. On the contrary, in case a reversal takes place and the AUD/USD pair breaks through the support level of 0.6887, a further decline to 0.6801 can occur in order to indicate a bearish market. Overall, we still prefer the bullish scenario, which suggests that the pair will stay above the zone of 0.6887 today. The material has been provided by InstaForex Company - www.instaforex.com |
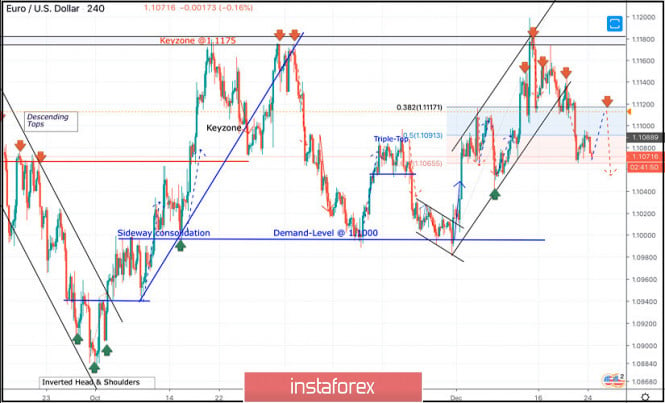
| December 24, 2019 : EUR/USD Intraday technical analysis and trade recommendations. Posted: 24 Dec 2019 03:30 AM PST
Since November 14, the price levels around 1.1000-1.0995 has been standing as a significant DEMAND zone which has been offering adequate bullish SUPPORT for the pair on two successive occasions. Shortly-after, the EUR/USD pair has been trapped within a narrower consolidation range between the price levels of 1.1000 and 1.1085-1.1100 (where a cluster of supply levels and a Triple-Top pattern were located) until December 11. On December 11, significant bullish swing was initiated around 1.1040 allowing recent bullish breakout above 1.1110 to pursue towards 1.1175 within the depicted newly-established bullish channel. Intraday bearish rejection was expected around the price levels of (1.1175). Quick bearish decline was demonstrated towards 1.1115 (38.2% Fibonacci level) which got broken to the downside as well. On Friday, further bearish decline was demonstrated towards 1.1065 where early signs of bullish recovery is currently manifested. Any bullish pullback towards 1.1115 should be watched for bearish rejection and another SELL entry. On the other hand, If earlier bearish decline below 1.1065 is demonstrated, next bearish projection target would be located around 1.1010. Trade recommendations : Conservative traders should wait for a bullish pullback towards 1.1115 ( reversal pattern neckline ) as a valid SELL signal. Bearish projection target to be located around 1.1090, 1.1040 and 1.1010. The material has been provided by InstaForex Company - www.instaforex.com |
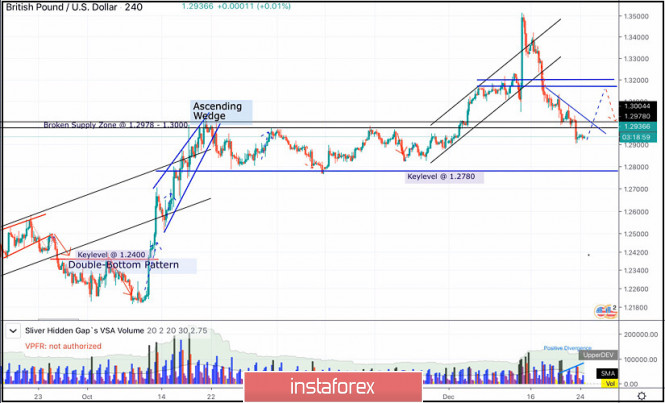
| December 24, 2019 : GBP/USD Intraday technical analysis and trade recommendations. Posted: 24 Dec 2019 02:57 AM PST
In the period between October 17 to December 4, the GBP/USD pair has been trapped between the price levels of 1.2780 and 1.3000 until December 4 when bullish breakout above 1.3000 was achieved. Moreover, a newly-established short-term bullish channel was initiated on the chart. The GBPUSD has recently exceeded the upper limit of the depicted bullish channel on its way towards 1.3500 where the pair looked quite overpriced. This was followed by successive bearish-engulfing H4 candlesticks which brought the pair back towards 1.3170 quickly. Further bearish decline was pursued towards 1.3000 which got broken to the downside as well. Short-term outlook remains bearish as long as bearish persistence below 1.3000 is maintained on the H4 chart. Further bearish decline is expected towards 1.2840 - 1.1800 provided that bearish persistence below the newly-established downtrend line is maintained ( Low Probability ). However, early signs of bullish recovery as well as some positive divergence are being manifested on the chart denoting a high probability bullish reversal to be expected soon. That's why, Intraday bullish pullback may be anticipated to occur towards 1.3170-1.3190 where bearish rejection and another bearish swing can be initiated. The material has been provided by InstaForex Company - www.instaforex.com |
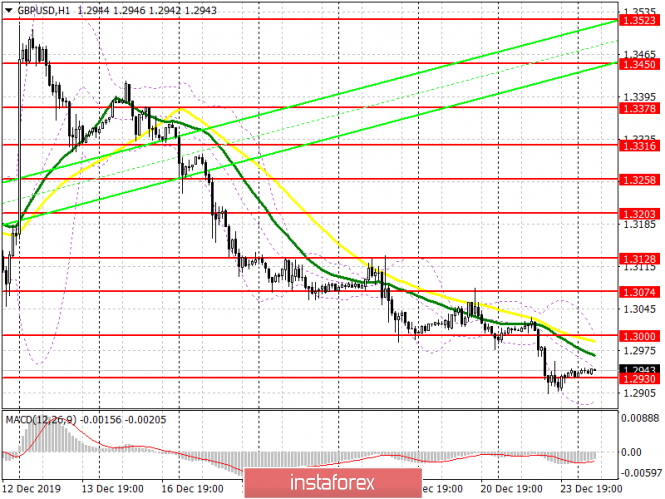
| GBP/USD: plan for the European session on December 24. A trade agreement with the EU Posted: 23 Dec 2019 08:25 PM PST To open long positions on GBPUSD, you need: It seems to have started what was before the results of the parliamentary elections in Great Britain when the pound was bought just without stopping, and everyone was waiting for a downward correction. The same thing is now happening with sales, and it is not clear where to look for the bottom. Bulls will try to protect the support of 1.2930 today, but only the formation of a false breakout on it will be a signal to open long positions. For a more reliable buying scenario, it is best to postpone until the lows of 1.2879 and 1.2831 are updated. No less important task of the bulls will be the return and consolidation at the resistance level of 1.3000, from where we can expect a larger upward correction to the levels of 1.3074 and 1.3128, where I recommend taking the profits. To open short positions on GBPUSD, you need: The pair were not deterred from falling by the statements of British Prime Minister Boris Johnson that a trade agreement with the EU would be developed according to the interests of all parties. The only thing left for the bears today is to return the pound under the support of 1.2930, which forms a new downward channel and will lead to further preservation of the trend with the exit to the area of lows of 1.2879 and 1.2831, where I recommend taking the profits. In the scenario of GBP/USD growth in the first half of the day, you can return to short positions on a false breakout near the maximum of 1.3000, or sell the pound immediately on a rebound from the resistance of 1.3074. Indicator signals: Moving Averages Trading is conducted below the 30 and 50 moving averages, which indicates a possible further decline in the pound. Bollinger Bands Support will be provided by the lower border of the indicator in the area of 1.2900, while growth will be limited to the upper level of the indicator in the area of 1.2989.
Description of indicators
|
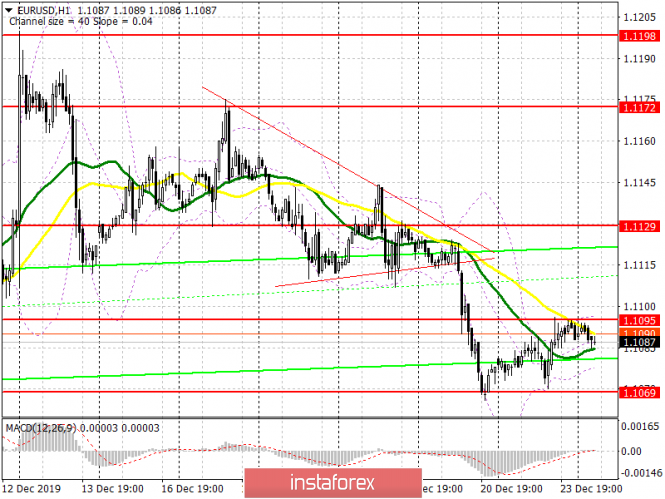
| Posted: 23 Dec 2019 08:03 PM PST To open long positions on EURUSD, it is required: Yesterday's data on a sharp reduction in orders for long-term goods in the US did not allow the bears to maintain pressure on the pair, which limited the downward potential and led to a slight upward correction, with a return to the level of 1.1090, which is now transformed into the resistance of 1.1095. The entire focus is shifted to this area, and since no important fundamental statistics are scheduled to be released today, volatility is likely to remain at a low level. The only consolidation above the range of 1.1095 will lead to a larger upward correction in the area of the maximum of 1.129, above which it will be quite difficult to breakthrough. In the case of continued pressure on EUR/USD, it is best to return to long positions only on the support test of 1.1069, subject to the formation of a false breakout, or a rebound from a larger minimum of 1.1041. To open short positions on EURUSD, it is required: Sellers will protect the resistance of 1.1095, and the formation of a false breakout there will be a direct signal to open short positions in the continuation of the downward trend to update the lows of 1.1069 and 1.1041, where I recommend fixing the profits there. In the absence of pressure on the euro around 1.1095, it is best to postpone the sale until the update of the maximum of 1.129. It is also recommended to sell immediately on the rebound in the resistance area of 1.1172, the test of which will indicate the formation of a new upward trend in the euro. Indicator signals: Moving Averages Trading is conducted in the area of 30 and 50 moving averages, which indicates market uncertainty. Bollinger Bands Volatility is low, which does not give signals to enter the market.
Description of indicators
|
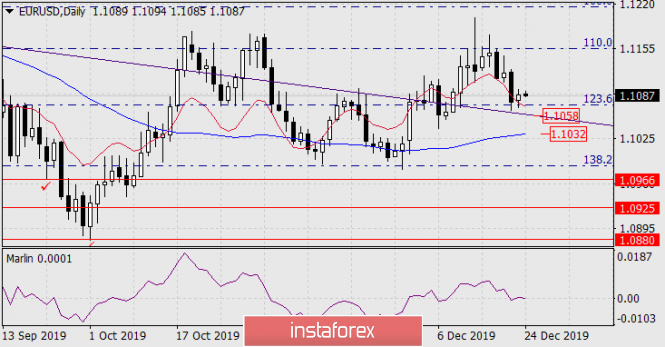
| Forecast for EUR/USD for December 24, 2019 Posted: 23 Dec 2019 07:57 PM PST EUR/USD On Monday, weaker-than-expected US data were released, which strengthened the upward correction for the euro. The volume of orders for durable goods in the November estimate showed a decrease of 2.0% against the expectation of growth of 0.2%, the core index of orders (Core Durable) showed a zero increase against the forecast of 1.5%. Sales of new homes in November amounted to 719 thousand, the forecast was 734 thousand, and the October figure of 733 thousand was revised down to 710 thousand.
Today is a weekend in Germany, Switzerland, Italy, and other regions, including the United States, have a shortened trading day. The euro needs to overcome the support of the embedded price channel line at 1.1058 (daily) to break down. After yesterday's data, it is already unlikely that investors will decide on such an operation today. If the support is overcome, the target of 1.1032 is opened - the MACCD line on the daily scale chart.
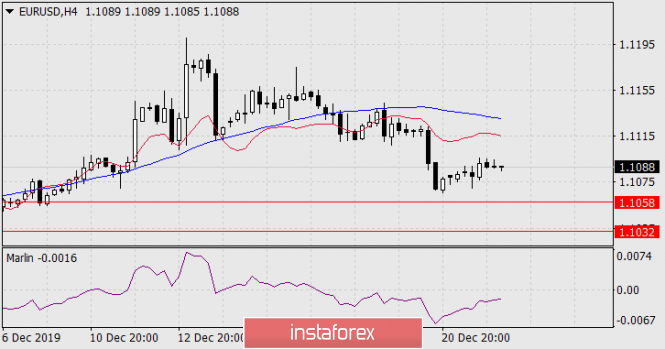
As seen on the four-hour chart, the price is developing under the indicator lines of balance and MACD, the Marlin oscillator is in the zone of decline and no signs of its reversal have yet been created. We are waiting for the continuation of the price reduction. The material has been provided by InstaForex Company - www.instaforex.com |
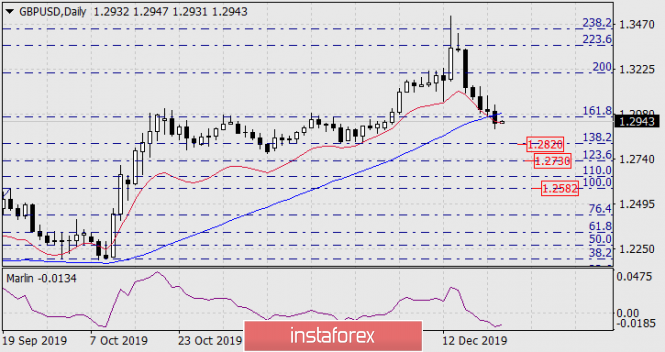
| Forecast for GBP/USD for December 24, 2019 Posted: 23 Dec 2019 07:57 PM PST GBP/USD On Monday, the British pound easily overcame the support of the MACD indicator line and the Fibonacci level of 161.8% on the daily scale chart. The next target of 1.2820, defined by the Fibonacci level of 138.2% is open. After that, the next target will be the Fibonacci level of 123.6% at 1.2730. The Marlin oscillator is steadily decreasing.
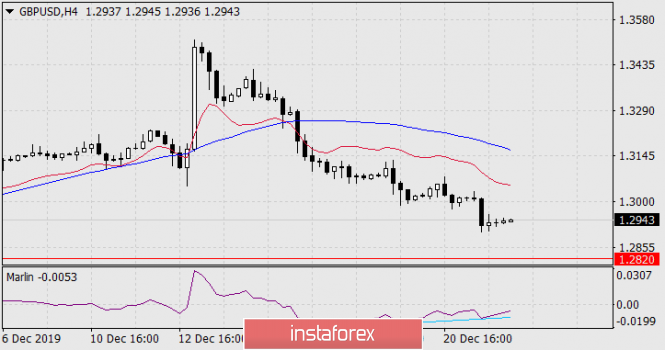
As seen on the four-hour chart on the Marlin oscillator, a double convergence has formed, but it can be pushed by the dynamics of the higher timeframe. In the case of working out the convergence of corrective growth, the movement is likely to be not large, as it is hindered by yesterday's resistance levels, and now the price is in the November consolidation zone, and it would be more logical for the market to work out its entire range, at least up to 1.2820.
|
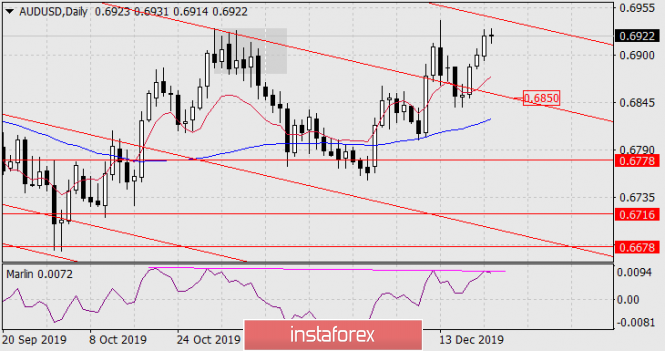
| Forecast for AUD/USD for December 24, 2019 Posted: 23 Dec 2019 07:57 PM PST AUD/USD On Monday, the Australian dollar rose by 22 points and was stopped by the upper limit of consolidation from November 5. According to the Marlin oscillator, an original triple divergence was formed. As a consequence, now we are waiting for the price to turn down. The target of 0.6850 is to support the embedded line of the red price channel. The upper line of the price channel may not be reached.
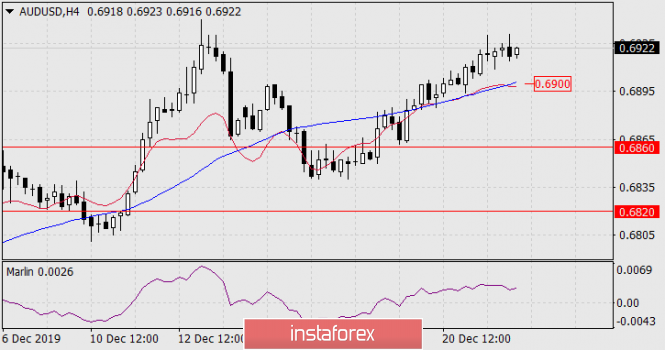
As seen on the four-hour chart, the situation is rising: the price is above the balance and MACD indicator lines, the signal line of the Marlin oscillator is in the growth zone. To form a reversal signal, we are waiting for a price decrease under the MACD line (0.6900). At this point, visually, the Marlin signal line will move into the negative numbers zone.
|
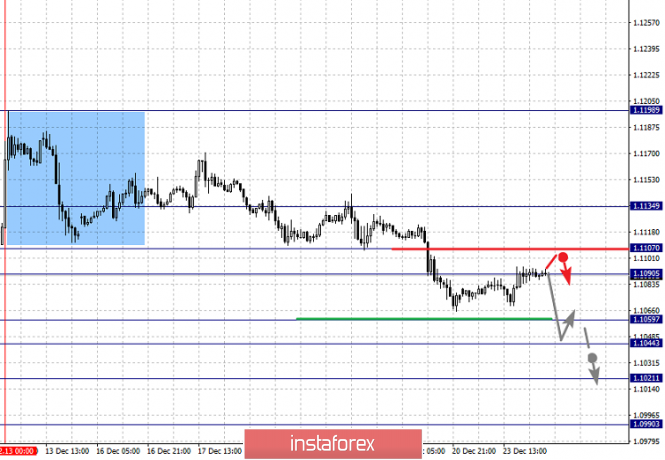
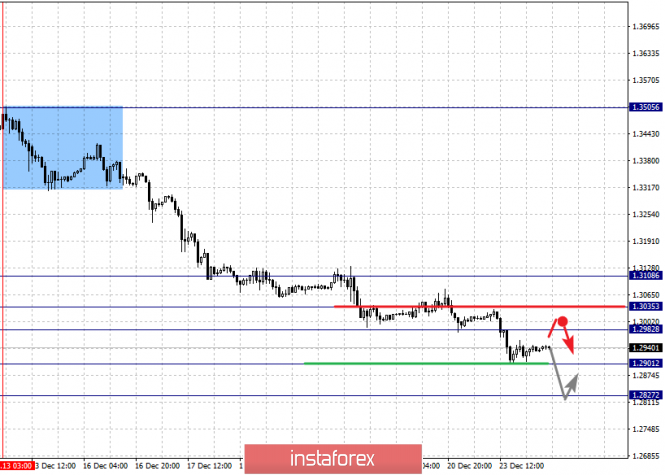
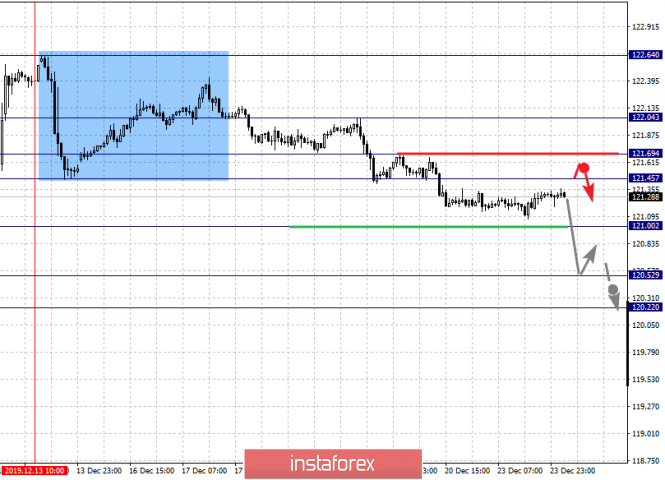
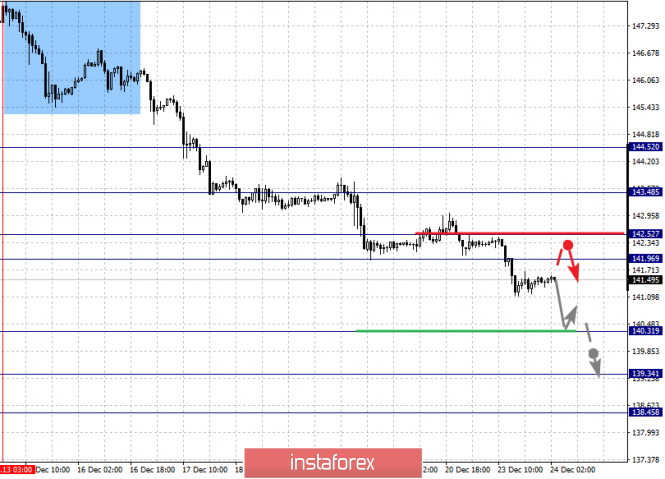
| Fractal analysis for major currency pairs as of December 24 Posted: 23 Dec 2019 07:57 PM PST Hello, dear colleagues. For the Euro/Dollar pair, we follow the development of the downward cycle from December 13 and the level of 1.1044 is the key resistance. For the Pound/Dollar pair, the continuation of the downward movement is expected after the breakdown of 1.2900 and the level of 1.3035 is the key support. For the Dollar/Franc pair, the price has issued expressed initial conditions for the top of December 19. For the Dollar/Yen pair, the price forms mid-term initial conditions for the high from December 12; the level of 109.62 is the key resistance and the level of 109.08 is the key support. For the Euro/Yen pair, we expect the continuation of the downward cycle from December 13 after the breakdown of 121.00 and the level of 121.69 is the key support. For the Pound/Yen pair, we expect to reach the level of 140.31 and the level of 141.96 is the key support. Forecast for December 24: Analytical review of currency pairs on the H1 scale:
For the Euro/Dollar pair, the key levels on the H1 scale are 1.1134, 1.1107, 1.1090, 1.1059, 1.1044, 1.1021, and 1.0990. We follow the development of the downward cycle of December 13. The short-term downward movement is expected in the range of 1.1059-1.1044. The breakdown of the last value will lead to a movement to the level of 1.1021, near this level is a consolidation and hence a high probability of a reversal into a correction. We consider the level of 1.0990 as a potential value for the bottom. The short-term upward movement is expected in the range of 1.1090-1.1107 and the breakdown of the last value will lead to an in-depth correction. The target is 1.1134. The main trend is the downward cycle from December 13. Trading recommendations: Buy: 1.1090 Take profit: 1.1107 Buy: 1.1109 Take profit: 1.1130 Sell: 1.1057 Take profit: 1.1045 Sell: 1.1043 Take profit: 1.1022
For the Pound/Dollar pair, the key levels on the H1 scale are 1.3108, 1.3035, 1.2982, 1.2901, and 1.2827. We follow the development of the downward cycle of December 13. The continuation of the downward movement is expected after the breakdown of 1.2901. The potential target is 1.2827, from this level, we expect a pullback to the correction. The short-term upward movement is possible in the area of 1.2982-1.3035 and the breakdown of the last value will lead to a protracted correction. The target is 1.3108 and this level is the key support for the downward structure. The main trend is the downward cycle from December 13. Trading recommendations: Buy: 1.2982 Take profit: 1.3033 Buy: 1.3037 Take profit: 1.3108 Sell: Take profit 1.2900: 1.2830 Sell: Take profit:
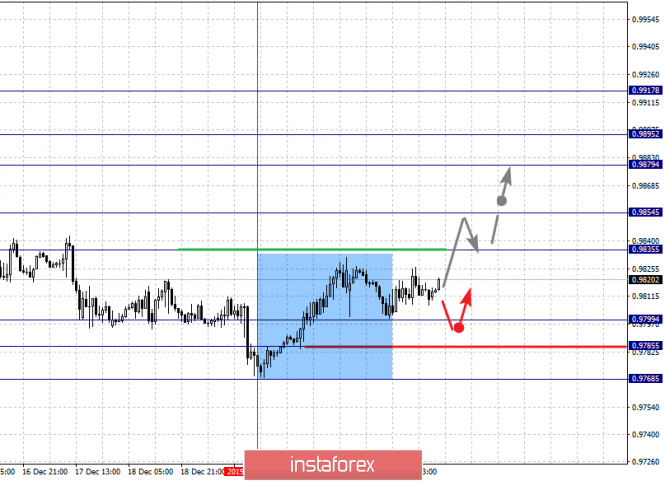
For the Dollar/Franc pair, the key levels on the H1 scale are 0.9917, 0.9895, 0.9879, 0.9854, 0.9835, 0.9799, 0.9785, and 0.9768. The price has issued expressed initial conditions for the top of December 19. We expect the continuation of the upward movement after the breakout of 0.9835. In this case, the target is 0.9854 and near this level is the consolidation. The breakout of the level of 0.9855 will lead to a pronounced movement. The target is 0.9879 and in the area of 0.9879-0.9895 is the short-term upward movement, as well as consolidation. We consider the level of 0.9917 as a potential value for the top, from which we expect a pullback to the bottom. A short-term downward movement is possible in the area of 0.9799-0.9785 and the breakdown of the last value will lead to the cancellation of the upward structure from December 19. In this case, the first target is 0.9768. The main trend is the initial conditions for the top of December 19. Trading recommendations: Buy: 0.9835 Take profit: 0.9852 Buy: 0.9856 Take profit: 0.9877 Sell: 0.9799 Take profit: 0.9787 Sell: 0.9783 Take profit: 0.9768
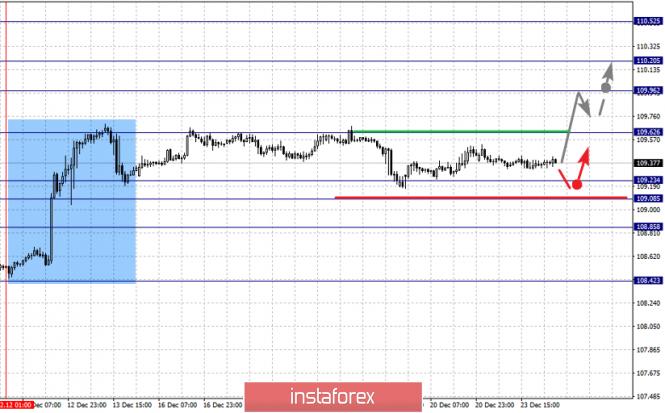
For the Dollar/Yen pair, the key levels in the H1 scale are 110.52, 110.20, 109.96, 109.62, 109.23, 109.08, and 108.85. We follow the formation of the initial conditions for the top of December 12. The continuation of the upward movement is expected after the breakdown of 109.62. In this case, the target is 109.96 and in the area of 109.96-110.20 is the short-term upward movement, as well as consolidation. We consider the level of 110.52 as a potential value for the top, upon reaching which, we expect a pullback in the correction. The short-term downward movement is expected in the range of 109.23-109.08 and the breakdown of the last value will lead to an in-depth correction. The target is 108.85 and this level is the key support for the upward structure from December 12. Main trend: initial conditions for the top of December 12. Trading recommendations: Buy: 109.63 Take profit: 109.96 Buy: 109.98 Take profit: 110.20 Sell: 109.23 Take profit: 109.08 Sell: 109.06 Take profit: 108.85
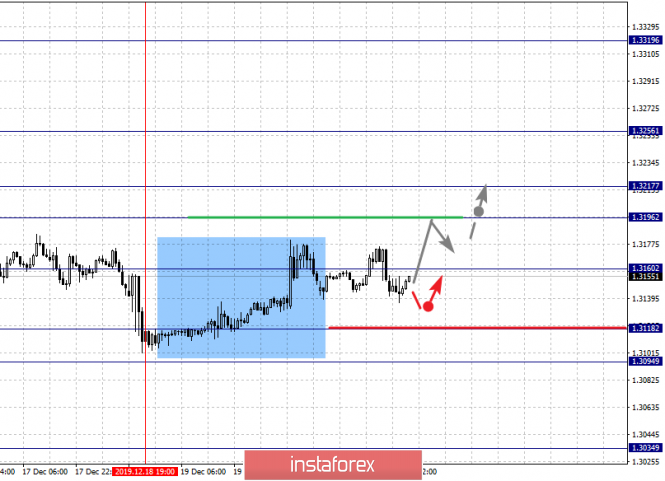
For the Canadian dollar/Dollar pair, the key levels on the H1 scale are 1.3256, 1.3217, 1.3196, 1.3146, 1.3118, 1.3094, and 1.3034. The price has issued a pronounced potential for the top of December 18. The continuation of the upward movement is expected after the break of 1.3160. The target is 1.3196. The range of 1.3196-1.3217 is the key support for the downward structure. Its passage at the price will favor the development of the upward movement. The potential target is 1.3256. A short-term downward movement is possible in the area of 1.3118-1.3094 and the breakdown of the last value should be accompanied by a pronounced movement. The potential target is 1.3034. The main trend is the expressed potential for the top of December 18. Trading recommendations: Buy: 1.3160 Take profit: 1.3196 Buy: 1.3218 Take profit: 1.3252 Sell: 1.3118 Take profit: 1.3096 Sell: 1.3092 Take profit: 1.3040
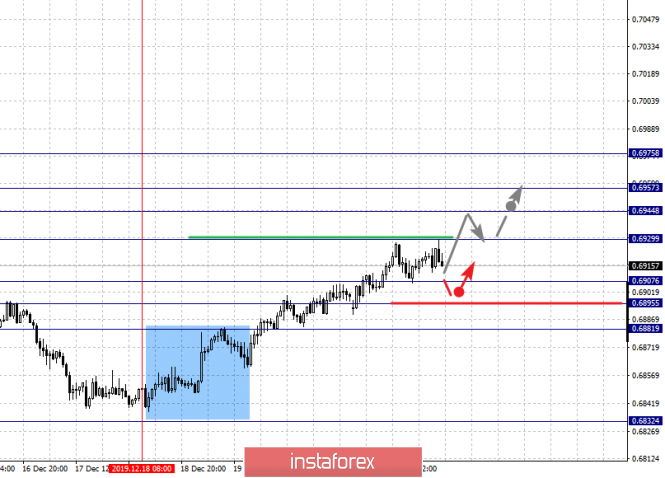
For the Australian dollar/Dollar pair, the key levels on the H1 scale are 0.6975, 0.6957, 0.6944, 0.6929, 0.6907, 0.6895, and 0.6881. We follow the development of the upward cycle of December 18. The continuation of the upward movement is expected after the breakdown of 0.6930. In this case, the target is 0.6944 and in the area of 0.6944-0.6957 is the short-term upward movement, as well as consolidation. We consider the level of 0.6975 as a potential value for the top, upon reaching which, we expect a pullback to the bottom. The short-term downward movement is expected in the range of 0.6907-0.6895 and the breakdown of the last value will lead to an in-depth correction. The target is 0.6881 and this level is the key support for the top. The main trend is the local upward cycle from December 18. Trading recommendations: Buy: 0.6930 Take profit: 0.6944 Buy: 0.6945 Take profit: 0.6956 Sell: 0.6907 Take profit: 0.6896 Sell: 0.6894 Take profit: 0.6881
For the Euro/Yen pair, the key levels on the H1 scale are 122.04, 121.69, 121.45, 121.00, 120.52, and 120.22. We follow the downward structure of December 13. The continuation of the downward movement is expected after the breakdown of 121.00. In this case, we expect a pronounced movement to the level of 120.52. We consider the level of 120.22 as a potential value for the bottom, near which we expect consolidation, as well as a pullback in the correction. A short-term upward movement is possible in the area of 121.45-121.69 and the breakdown of the last value will lead to an in-depth correction. The target is 122.04 and this level is the key support for the downward structure. The main trend is the downward cycle from December 13. Trading recommendations: Buy: 121.45 Take profit: 121.66 Buy: 121.72 Take profit: 122.04 Sell: 121.00 Take profit: 120.55 Sell: 120.50 Take profit: 120.22
For the Pound/Yen pair, the key levels on the H1 scale are 143.48, 142.52, 141.96, 140.31, 139.34, and 138.45. We follow the development of the downward cycle of December 13. At the moment, we expect to reach the level of 140.31, near which consolidation and hence, there is also a high probability of going into a correction. The breakdown of 140.20 will allow us to count on the movement to 139.34, from which we expect a pullback to the top. The short-term upward movement is possible in the area of 141.96-142.52 and the breakdown of the last value will lead to an in-depth correction. The target is 143.48 and this level is the key support for the downward cycle of December 13. The main trend is the downward cycle from December 13. Trading recommendations: Buy: 141.96 Take profit: 142.50 Buy: 142.55 Take profit: 143.45 Sell: 140.20 Take profit: 139.40 Sell: Take profit: The material has been provided by InstaForex Company - www.instaforex.com |
| You are subscribed to email updates from Forex analysis review. To stop receiving these emails, you may unsubscribe now. | Email delivery powered by Google |
| Google, 1600 Amphitheatre Parkway, Mountain View, CA 94043, United States | |

No comments:
Post a Comment