Forex analysis review |
- Forecast for GBP/USD on December 26, 2019
- Forecast for USD/JPY on December 26, 2019
- Pound still in the grip of Brexit, but can grow by leaps and bounds
- Gold prepares to continue the bullish move, remain in trend
- Gold made a Christmas present
- Simplified wave analysis. Forecast for EUR/USD for the coming weeks of December 25
- USD/CAD - medium term until March 2020
- Analysis of EUR/USD and GBP/USD for December 25. Holidays made markets freeze
- EUR/USD. December 25. In support of a previous trading idea
- GBP/USD. December 25. In support of the trading idea for the pound until the end of the year
- USD/CAD. Weak data on Canada's GDP growth: loonie escaped with a slight startle
- GBP/JPY analysis and forecast for December 25, 2019
- Overview of the GBP/USD pair. December 25. 2020 will bring a lot of new challenges to the pound
- Overview of the EUR/USD pair. December 25. Democrats drag out impeachment of Trump
- NZD/USD review and opinion on December 25, 2019
- Outlook for US dollar and EURUSD in the first quarter of 2020
- EUR/USD. China is again dissatisfied with the United States - the dollar is losing ground
- Oil marked the red line
- Is it worth buying Bitcoin next year and how much will it cost?
- Medium-term gold prospect until spring 2020
- Gold prices rise before the expiration of the December futures (we expect the continuation of the long-term decline in the
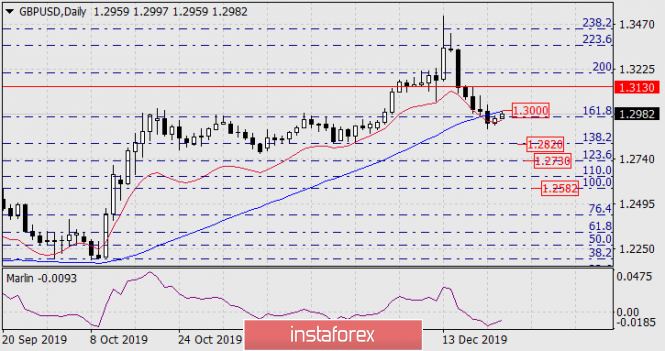
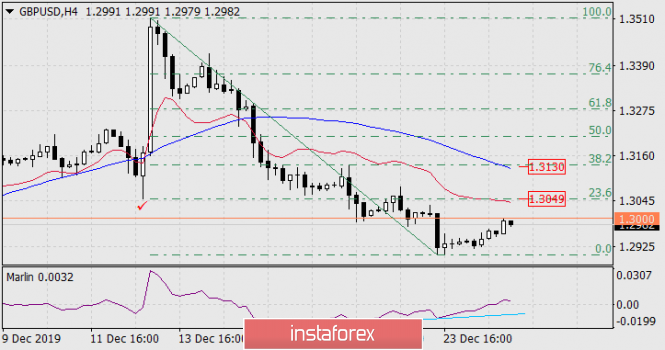
| Forecast for GBP/USD on December 26, 2019 Posted: 25 Dec 2019 06:59 PM PST GBP/USD The British pound is slightly correcting up after the previous six-day strong fall. Currently, the price is testing below the MACD level (1.3000). Consolidation above it can extend the growth to 1.3130, which will be 38.2% of the total movement since December 13. If the price cannot be consolidated above the MACD line, then the fall will resume with renewed vigor to the nearest target at 1.2820 - to the Fibonacci level of 138.2%. On the four-hour chart, the double convergence according to Marlin worked, a minimal correction took place. This graph also shows that before the 1.3130 goal, there is an intermediate target at the Fibonacci level of 23.6% 1.3049, which coincides with the December 12 low. A price reversal may well take place from it. The intention of the price to move towards lower goals (1.2820, 1.2730) will be finalized with overcoming the low of December 23 at the price of 1.2904. |
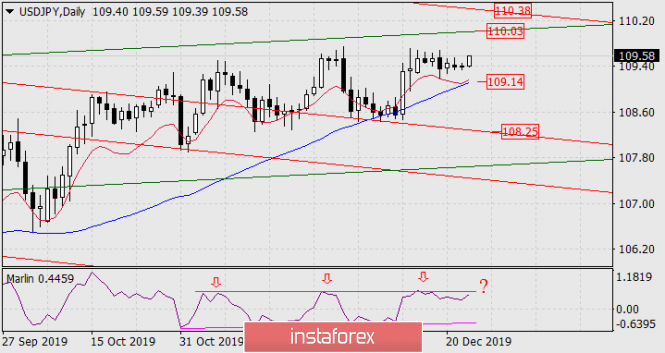
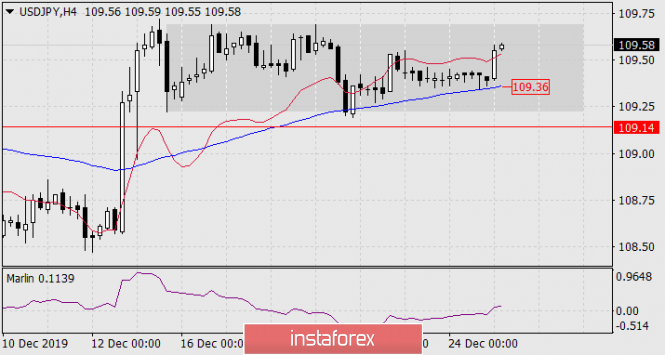
| Forecast for USD/JPY on December 26, 2019 Posted: 25 Dec 2019 06:46 PM PST USD/JPY Today's growth of the USD/JPY pair has transformed the movement of the last seven daily candles into horizontal consolidation. This increases the likelihood of working out the green line of the price channel on the daily chart in the price area of 110.03. Overcoming resistance will open the second target of 110.38 - the line of the red price channel. The triple peak on the Marlin oscillator is strong enough. The formation of the fourth peak is also possible, after which the indicator will unfold to go down (accordingly, the price). In fact, according to Marlin, a range is formed - a horizontal channel slightly converging on a wedge, which in the medium term retains the potential for a market decline - the signal line goes down from the wedge. A significant sign of a falling dollar will be the price drift below the MACD line on the daily, below 109.14. The target will be the line of the red price channel at around 108.25. On the H4 chart, the consolidation from December 13 looks more pronounced. The MACD line is the support. Accordingly, consolidating the price under it (below 109.36) will be the first sign of an attack on 109.14 as well. The material has been provided by InstaForex Company - www.instaforex.com |
| Pound still in the grip of Brexit, but can grow by leaps and bounds Posted: 25 Dec 2019 04:13 PM PST The British currency rose by almost 5% at the beginning of 2019 against the US dollar, but in the next six months the pound lost ground and the GBP/USD pair fell below the key mark of 1.20 in September. Then the pound strengthened by more than 12%, noting the high since May 2018 in the first half of December (around $1.35) as a reaction to the Tories victory in the December 12 early parliamentary elections and on the expectation that the outcome of early voting will help solve the long-standing problem of ratifying the Brexit deal. However, the GBP/USD momentum was quickly dying away as concerns about the disordered Brexit returned. The pound rally stopped after British Prime Minister Boris Johnson announced his intention to pass a bill through the national Parliament, according to which London and Brussels will need to conclude a trade deal with the European Union in the coming months, and the extension of the transition period after 2020 will become illegal. It should be recalled that Great Britain is about to leave the EU on January 31, 2020. At the same time, the country will remain in the single market and the EU customs union until December 31, 2020. Currently, the transition period can be extended by mutual agreement of the parties for up to two years. The amendment made by Johnson will not allow this, as a result of which complex negotiations will have to be held in a fairly short time. EU authorities have already warned that, given the number of issues that will need to be addressed, ratification of the trade deal during the year seems unlikely. Recent events have raised concerns that the United Kingdom will eventually exit the EU in accordance with WTO rules if the parties fail to conclude a trade agreement by the end of the year. The recent drop in the pound fuels the market's belief that the Brexit problem has not yet been resolved and will continue to influence the British currency in the next few months. In addition to the situation with Brexit, the focus will remain on macroeconomic indicators in the UK. Recent data show that the country's economic growth is still slowing, and if the situation continues to worsen, this can provide food for talk about a lower interest rate by the Bank of England and increase pressure on the pound. At the end of the December meeting, the regulator revised downward the estimate of national GDP growth in the fourth quarter of 2019 from 0.2% to 0.1%, although it predicted an acceleration of economic growth in early 2020. At the same time, the BoE warned that if the growth of the global economy cannot stabilize or the uncertainty associated with Brexit remains high, it may be necessary to support the national economy and inflation through monetary policy. "Now the attention of market participants should switch to the British economy, and here not everything looks positive. Uncertainty regarding the future trade relations between Great Britain and the EU remains high. It's hard to predict what the opportunities for economic growth in the United Kingdom in 2020 will be against this background," said Brown Brothers Harriman experts. They predict that the pound against the US dollar could fall to $1.28 in the first quarter of 2020 and drop to $1.25 by the middle of the year. It is estimated that British economic growth could accelerate in 2020 if local companies and investors feel more confident about the future. Moreover, Johnson promised to significantly increase government spending in the next five years, which will give the economy an additional incentive. The BoE has already said that a gradual increase in the interest rate may be required if the risks to the national economy do not materialize and the situation develops in accordance with forecasts. This will support the pound. Standard Chartered expects the GBP/USD pair to rise to 1.38 by the end of the third quarter and finish 2020 at 1.40. "Political incentives do not support the idea of destroying the economy, so investor concern about the risk associated with Brexit should be reduced," said bank expert Steve Englander. "Ahead of the British currency will be increased volatility, but nevertheless, the pound will add to the price, since there is no reason to expect its collapse due to the lack of political will to resolve the situation," he added. The material has been provided by InstaForex Company - www.instaforex.com |
| Gold prepares to continue the bullish move, remain in trend Posted: 25 Dec 2019 04:13 PM PST Gold is preparing to complete the current year with an increase of more than 13%, which will mark the highest annual increase since 2010. The outgoing year will be remembered by investors for the escalation of the trade conflict between Washington and Beijing, the threat of a future recession in the United States and the dovish reversal of the Federal Reserve. The US central bank intended to raise rates twice in 2019, but in the first quarter it revised its mood. Gold initially reacted to this with a growth of only 0.76% in the first quarter, but strengthened by 9% in the second quarter. In addition to changing the Fed's monetary rate, throughout 2019, markets nervously reacted to news headlines on the subject of US-Chinese trade relations, which went from one extreme to another. Growing uncertainty and volatility played into the hands of the yellow precious metal. In addition, the Treasury yield curve was inverted in August, which fueled fears of a recession in the United States. In addition, the German economy slowed down significantly, which also attracted the attention of the "golden bugs." What to expect from precious metals next year? Will it be able to maintain an upward trajectory? Growth factors 1. Dovish mood of the Fed At the end of the December meeting, the US central bank made it clear that it was going to take a break in the cycle of easing monetary policy in 2020. This raised concerns that the next year may not be easy for the bulls in gold. In the near future, the Fed does not plan to raise interest rates. For this, inflation in the country should confidently gain a foothold over the 2% mark, which so far seems unlikely. Thus, it is hardly worth for the precious metal to wait for tricks from the regulator: it still adheres to a slightly dovish mood. 2. Fed balance The Fed continues to build up its balance sheet. According to some estimates, its volume may exceed $4.516 trillion in May 2020 and reach a record high if the regulator continues to increase the balance at the pace observed over the past three and a half months. In mid-September, the US central bank began to buy treasuries in order to calm the markets. Since then, the size of assets on its balance sheet has increased by more than $330 billion and currently stands at about $4.10 trillion. Many experts consider this a hidden quantitative easing. Historically, all previous Fed expansion programs have boosted gold demand. When the Fed first launched such a program in 2009, its balance sheet was less than $1 trillion, and by 2014 it had grown to $4.5 trillion. During this period, the precious metal rate increased from $800 to $1,200, noting in September 2011 a record high of $1,921. 3. The threat of recession in the United States "Manufacturing problems, a near-full-time labor market, and periodic inversions in the yield curve suggest that the longest period of economic growth in the US seems to be drawing to a close," said Bloomberg analyst Eddie van der Walt. According to a consensus estimate of economists recently surveyed by the agency, the likelihood of a recession in the next 12 months in the United States is 30%. "Since 1960, the S&P 500 index reached its pre-recession peak on average six months before the start of the fall in GDP. This means that such safe havens like gold can go up even in anticipation of a recession," said Eddie van der Walt. "Economic downturns tend to lower nominal and real rates, lowering the opportunity cost of gold ownership, which is seen as a hedge of inflation. Since 1990, the correlation of precious metal on a monthly chart with the yield on two-year bonds of the US Treasury was -0.3. Gold bullion vaults must be filled, because negative nominal rates will affect everyone: from institutional investors to wealthy individuals," he added. "If the markets begin to be laid for a recession in the United States, then the levels of $1,700- $1,800 per ounce will be quite achievable," the expert predicts. 4. World central bank runs out of ammunition The Bank of Japan and the ECB have long lowered interest rates to negative values and seem to have reached their limits. So, the BOJ has been implementing the QE program for seven consecutive years, but inflation in the country is still far from the 2% target. In this regard, fears are growing more and more: when the next global recession breaks out, regulators will have no choice but to helplessly watch what is happening. Of course, they can try to plunge interest rates into the zone of negative values even more, which will push investors to gold more strongly. The global bond market has a similar picture. The yield of many securities slipped into a negative, and this also plays in favor of precious metals. Potential obstacles 1. Trading optimism Washington and Beijing recently reached an agreement on the first phase of a trade deal. Many experts continue to consider the agreements reached by the parties on the abolition of part of trade tariffs as a symbolic gesture that does not solve serious fundamental problems. However, the presidential elections in the United States will be held in November 2020. This circumstance may force Trump to conclude a full-fledged deal with China. Even if such an agreement is not reached, the head of the White House will have to stop the hostilities on this front, which will contribute to increasing the risk appetite for investors and hit gold demand next year. 2. Recovery of the global economy According to a number of reputable organizations, the state of the global economy should improve somewhat in 2020. The IMF and OECD forecast that next year global GDP growth will accelerate to 3.4%. Hopes and markets also rest on global economic growth. Recently published macro statistics provides reason to believe that the drawdown of the global economy is ending. However, it has not yet begun to gain momentum. Perhaps, as often happens, investors are again over-enthusiastic and run ahead of the engine. Thus, next year the situation as a whole will be in favor of gold, and the decline in precious metals due to the growth of trade optimism is unlikely to be long-lasting. The material has been provided by InstaForex Company - www.instaforex.com |
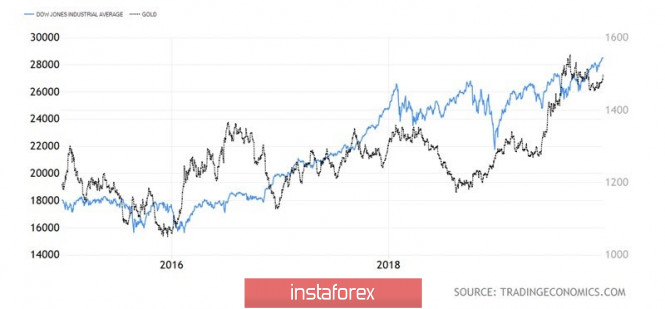
| Posted: 25 Dec 2019 03:26 PM PST The precious metal has remained amazingly stable for a long time amid the rally of the US stock market and an increase in global risk appetite, on the eve of Christmas, gold gave its fans a pleasant surprise. The precious metal returned to the psychologically important mark of $1,500 per ounce, sensitively reacting to the correction of the S&P 500 by 1.4%. Although the stock index movement was more technical in nature and was due to the closure of speculative longs, nevertheless the XAU/USD rally showed where it could look for help in 2020. The most powerful driver for its growth next year will most likely be the pullback of the US stock market . The S&P 500 and other US stock indexes look overbought. Investors are too aggressive in winning back the news that Washington and Beijing will soon sign a trade agreement as part of the first phase. At the same time, an unexpected reduction in orders for durable goods for Bloomberg experts suggests that the US economy is too dependent on consumer sentiment. Neither investments, nor other components of GDP are capable of supporting the current growth rate in 2020. If they slow down, the idea of a proactive reduction in the federal funds rate will return to the Fed table, which is a bullish factor for precious metals. By the way, the derivatives market, following the release of data on durable goods orders, increased the chances of monetary expansion in December 2020 from 45% to 52%. The dynamics of gold and the Dow Jones There is no certainty in the most problematic issues for the world economy in 2019. Despite the Conservative party winning the parliamentary elections in Britain, the idea of a disorderly Brexit has not disappeared. On the contrary, a resuscitation caused GBP/USD quotes to fall below the bottom of the 30th figure. Let Donald Trump claim that a trade agreement between Washington and Beijing will be signed soon, until this document is endorsed. In addition, the question is in limbo about how negotiations will proceed in the framework of a second phase. A substantial part of import duties remains in force, and what will the United States demand from China in order to abolish them? If we add a Senate vote on the impeachment of Trump and the US presidential election to the existing risks, then the reason for the stability of gold against an unfavorable background becomes clear. Yes, the decline in the global negative debt market from $17 trillion in the summer to $11 trillion triggered a wave of correction to the bullish XAU/USD trend, but who knows what will really happen to the global economy in 2020. If its growth continues to shrink, central banks will be forced to return to the idea of easing monetary policy, which will lower bond yields and support precious metals. Technically, gold managed to gain a foothold within the range of the previous consolidation of $1475-1515 per ounce. In case of a breakthrough of its upper border, the "Expanding Wedge" pattern will be activated. As a result, the risks of implementing the target by 161.8% according to the "Crab" pattern will increase. The material has been provided by InstaForex Company - www.instaforex.com |
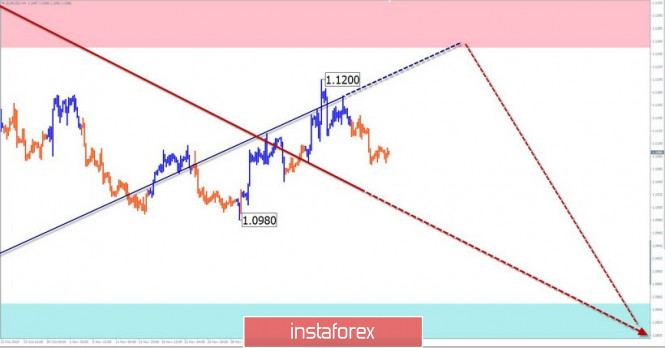
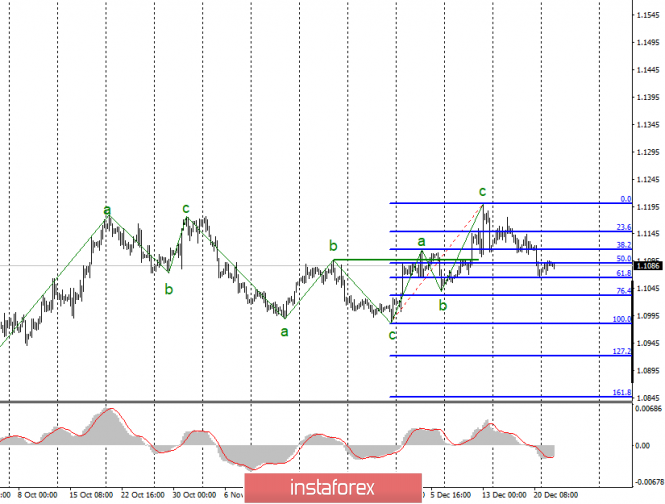
| Simplified wave analysis. Forecast for EUR/USD for the coming weeks of December 25 Posted: 25 Dec 2019 03:26 PM PST EUR/USD Analysis: The European currency has been in a downward trend since the beginning of last year. Preliminarily, the upper boundary of the target zone begins in the region of the 107th figure. The current price increase in recent months is forming a correction that has not yet been completed. Forecast: In the most optimistic scenario, the price of the pair can work up in the region of two figures. It is unlikely for the quotes to rise further. There are much more chances for further completion of the current course and a reversal towards the dominant trend. Potential reversal zones Resistance: - 1.1250/1.1350 Support: - 1.0850/1.0750 Recommendations: The upward trend of the euro will still be relevant in the next week or two. Next, you should change the trading vector, focusing on the signals. It is worth considering the likelihood of a "saw": false breakouts up and sharp price reversals. Explanations: In the simplified wave analysis (UVA), the waves consist of three parts (A-B-C). The last unfinished wave is analyzed. The solid background of the arrows shows the formed structure, dotted - the expected movement. Attention: The wave algorithm does not take into account the length of time the tool moves! The material has been provided by InstaForex Company - www.instaforex.com |
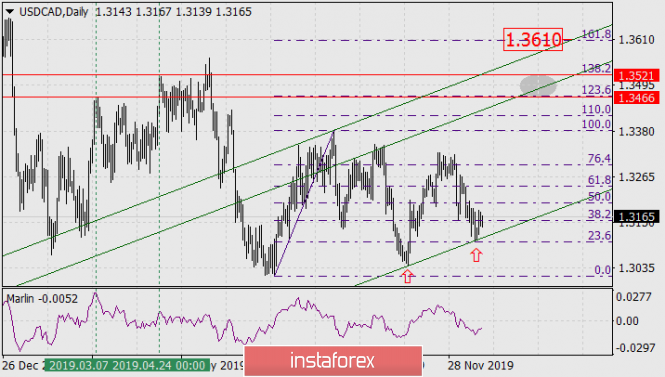
| USD/CAD - medium term until March 2020 Posted: 25 Dec 2019 03:25 PM PST On the compressed Canadian dollar chart of the daily timeframe, it is noticeable that the price has turned upward from the lower boundary of the green price channel. The previous price reversal from the lower boundary of the channel led to a subsequent increase in prices by 285 points. This time we are counting on more significant growth as a way out of the six-month range. The target zone of expected growth is the range of Fibonacci levels of 123.6-138.2%. It is in this range that the embedded line of the price channel runs, the price of the range is determined by the levels of 1.3466 (March 3 high) and 1.3521 (April 24 high) - they exactly coincide with the indicated Fibonacci levels. Overcoming the target range will allow the price to rise even higher, to the area of coincidence of the overlying line of the price channel with the Fibonacci level of 161.8% at the price of 1.3610. The dollar may reach this mark in March 2020. The material has been provided by InstaForex Company - www.instaforex.com |
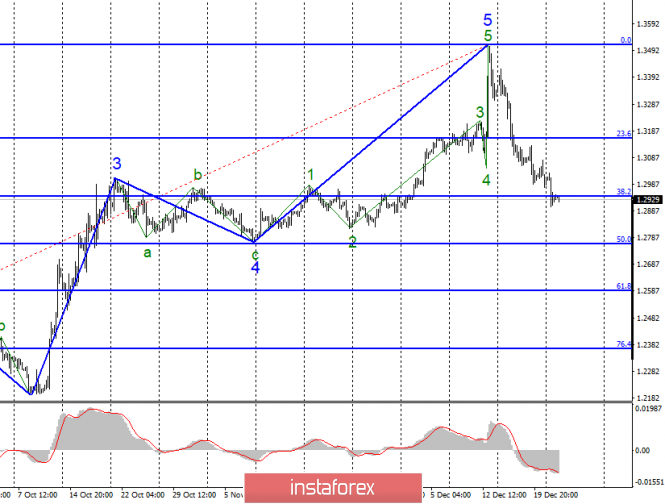
| Analysis of EUR/USD and GBP/USD for December 25. Holidays made markets freeze Posted: 25 Dec 2019 03:05 PM PST EUR/USD The EUR/USD pair ended with the loss of several base points on December 24. The current wave marking remains the same, because for the remaining time after the release of a review made on Tuesday with low market activity, no changes just happened. Thus, the pair is in some way stuck between the levels of 50.0% and 61.8% according to the Fibonacci and maintains excellent chances for the continuation of the fall within the framework of the new downward trend section. Fundamental component: Christmas is celebrated around the world on Wednesday, so markets are closed and will only open on Thursday morning. For obvious reasons, no news and economic reports on Wednesday, December 25, are listed in the news calendar. General conclusions and recommendations: The euro-dollar pair, presumably, completed the construction of the upward trend section. Thus, I would recommend selling the instrument with targets located near the levels of 1.1034 and 1.0982, which corresponds to 76.4% and 100.0% Fibonacci. An unsuccessful attempt to break through the 50.0% level may lead to the completion of the quotes withdrawal from the achieved lows and the resumption of the construction of the downward wave. GBP/USD The GBP/USD pair increased by 20 basis points on December 24, but, nevertheless, remains within the framework of constructing the alleged wave 1, or a, of a new downward section of the trend. At the very least, the departure of quotes from the lows reached by 20-30 points is clearly not enough to ascertain the completion of the downward wave of about 500-600 points. However, a successful attempt to break through the 38.2% level in itself still suggests the readiness of the instrument to build a correctional wave. Fundamental component: For obvious reasons, today there is no news background for the GBP/USD instrument. Until the end of the week, no news or reports from the UK or the US are listed in the news calendar. General conclusions and recommendations: The pound/dollar tool continues to build a new downward trend. I recommend continuing to sell the instrument with targets near 1.2764, which corresponds to the 50.0% Fibonacci level, but now after a successful attempt to break through the 38.2% Fibonacci level from above. Now there is a chance of building a corrective upward wave. The material has been provided by InstaForex Company - www.instaforex.com |
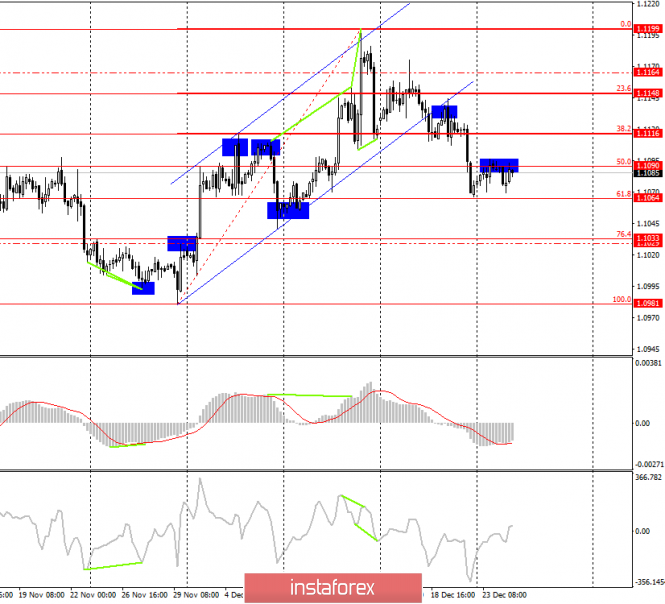
| EUR/USD. December 25. In support of a previous trading idea Posted: 25 Dec 2019 03:05 PM PST EURUSD - 4H On December 24, the EUR/USD pair made a return to the correctional level of 50.0% - 1.1090 and some hint of a break from it over the remaining few hours before closing. Thus, I expect a new reversal in favor of the US currency and the resumption of the fall process in the direction of the correction level of 61.8% - 1.1064. The activity of traders has significantly decreased this week, which is not surprising. An informational background is currently absent for any pair; there are no economic reports. The entire background is still reduced to skirmishes between Donald Trump and the Democrats, as well as discussions regarding trade negotiations between America and China. My trading idea, as before, is to sell the pair with the target of 1.1033 and the Stop Loss level above the level of 1.1090, since the pair has already been rebounding from this level. The trading idea will be canceled if a close is made above the level of 1.1090. Forecast on EUR/USD and recommendations to traders: The markets remain closed on December 25 and will only start functioning again on Thursday morning. However, until the very end of the week, given that there is no information background, activity can remain "at zero". If at least some of the traders return to the market, then the trading idea will receive a chance of implementation. The Fibo grid was built at the extremes of November 29, 2019 and December 13, 2019. The material has been provided by InstaForex Company - www.instaforex.com |
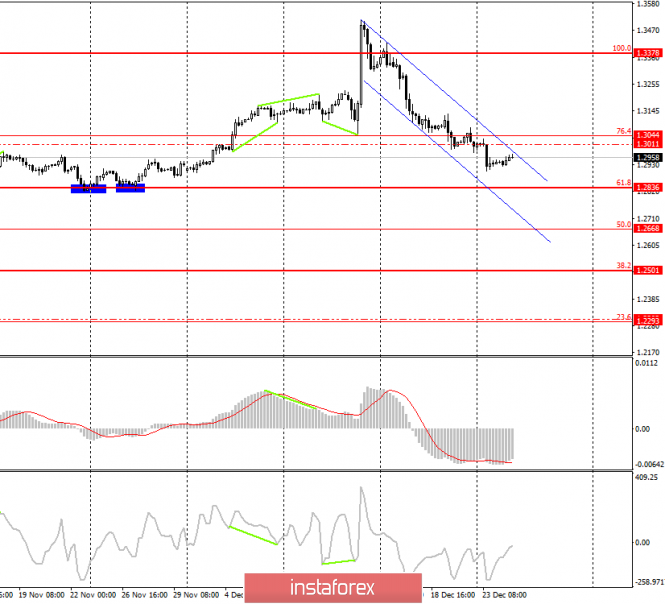
| GBP/USD. December 25. In support of the trading idea for the pound until the end of the year Posted: 25 Dec 2019 03:05 PM PST GBP/USD - 4H On December 25, the GBP/USD pair started moving to the upper boundary of the trend descending band, but trading ended very quickly and now quotes will not move until tomorrow morning. I would like to say that, depending on what the background will be tomorrow or the day after tomorrow, the pair will show the direction of movement, but no news is expected this week, just like economic reports. Most parliaments, congresses and top officials go on the same Christmas holidays as ordinary citizens. Thus, there is no information background. As with the euro-dollar pair, I believe that you can try to work out another deal in 2019. In recent days, a new band has formed, inside which the price continues to move clearly even without working out its upper and lower boundaries. Thus, traders can count on the resumption of the fall, since the pair does not respond to a zero information background. I believe that until December 31, quotes may continue the process of falling in the direction of the correction level of 61.8% - 1.2836, which potentially means receiving 120 points of profit if sold from the upper boundary of the band. I recommend placing Stop Loss orders outside the downward band. GBP/USD forecast and recommendations for traders: The pound-dollar pair is trying to continue the process of falling and only in the event of a rebound from the correction level of 61.8% would it be able to take a break for a while and slightly roll back up. However, I do not expect a strong upward pullback, and the current location of the price relative to the level of 76.4% allows you to sell the pair while aiming for 1.2836. I do not recommend that you buy the pound in the near future anyway. The Fibo grid was built at the extremes of March 13, 2019 and September 3, 2019. The material has been provided by InstaForex Company - www.instaforex.com |
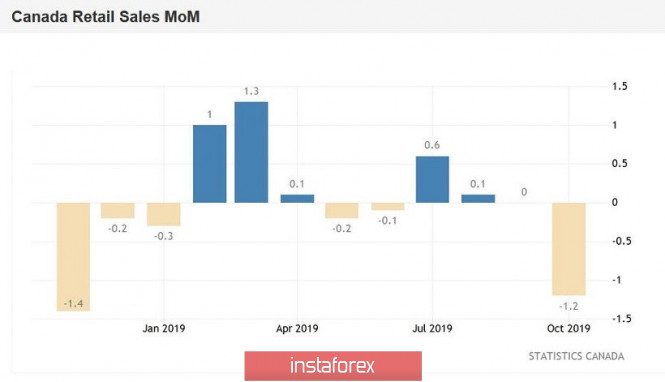
| USD/CAD. Weak data on Canada's GDP growth: loonie escaped with a slight startle Posted: 25 Dec 2019 03:04 PM PST The thin market on Monday helped the Canadian dollar maintain its position in tandem with the US currency amid absolutely disastrous data on the growth of the Canadian economy. The bulls could not develop the upward impulse, and after the price jump to around 1.3180, the USD/CAD pair returned home. In addition, the loonie was helped by US data, which was not in favor of the greenback. The semi-empty economic calendar and the pre-holiday mode reinforced the importance of each news, so the pair's traders yesterday reacted violently to both Canadian GDP and the US release of data on the volume of orders for durable goods. The published figures put pressure on both the loonie and the dollar, so in the end the pair actually remained in place. But it is worth noting here that the US Durable Goods Orders indicator has a rather short-term effect on dollar pairs, and only the thin market factor focused investors on this release. Meanwhile, Canadian figures will remind themselves more than once: at least at the beginning of next year, when the Bank of Canada will decide the future fate of monetary policy. This is far from a passing release, which could remain in the shadow of subsequent publications. By and large, this is a time bomb, which can explode as soon as the market returns to operating mode. Data was recently published on the growth of the Canadian economy in October. According to the general forecast, this indicator was expected to marginally grow on a monthly basis (+0.1%) and slightly slow down in annual terms (+ 1.4%) after a two-month growth. But the real numbers were much worse. On a monthly basis, the key indicator fell into the negative area (for the first time in eight months), reaching -0.1%. In annual terms, the indicator slowed down more than expected - up to 1.2%. The release structure suggests that 13 out of 20 sectors of the economy showed negative dynamics. In particular, the production of durable goods decreased to -2.3%. Slowdown of this component is recorded for the fourth time in the last six months. The transport equipment manufacturing sector showed the strongest negative dynamics (decline to -2.5%), primarily due to a decrease in the production of cars and auto parts. The decline was recorded in the sphere of non-food goods production (-0.3%), as well as in the sphere of food production (-0.1%). In October, the wholesale sector also slowed down (down to -1.0%). Among the pluses is the growth in traffic and warehousing. This component increased by 0.6% (in particular, the air transportation subcategory showed the strongest growth over the past year and a half). The non-residential building and other construction sector has also grown, but residential construction has declined. It is also worth noting that the September GDP growth indicator (in annual terms) was revised downward, to 1.5%. In other words, the numbers released yesterday only exacerbated the negative effect of data on retail sales growth in Canada released last week. Contrary to positive forecasts (growth up to 0.5%), this indicator crashed to -1.2% - this is the weakest result for several months (to be more precise, since November 2018). Such dynamics cannot be ignored by members of the Canadian central bank. Let me remind you that the last meeting of the Bank of Canada ended in a positive way: according to regulator members, the global economy is showing "signs of stabilization," although global trade conflicts remain the main risk factor for forecasts. The central bank also indicated a decrease in recession risks and a significant increase in investment spending in the third quarter. In addition, the regulator optimistically commented on the price dynamics of the commodity market (including the oil market), while noting that the Canadian dollar rate maintains "relative stability". These findings made it possible for the loonie to strengthen to the base of the 31st figure. However, recent releases indicate that at a January meeting, the Bank of Canada could soften its rhetoric, and possibly even announce a reduction in interest rates. According to some analysts, the Canadian central bank will resort to monetary easing in the first half of next year, although this reduction in interest rates will be preventive. Thus, the October GDP growth data is still "waiting in the wings": the market, although it did not ignore it, did not fully win back, given the possible consequences. All this suggests that the USD/CAD pair retains the potential for its growth - at least to the level of 1.3200 (the lower boundary of the Kumo cloud, which coincides with the middle line of the Bollinger Bands indicator on the daily chart). The material has been provided by InstaForex Company - www.instaforex.com |
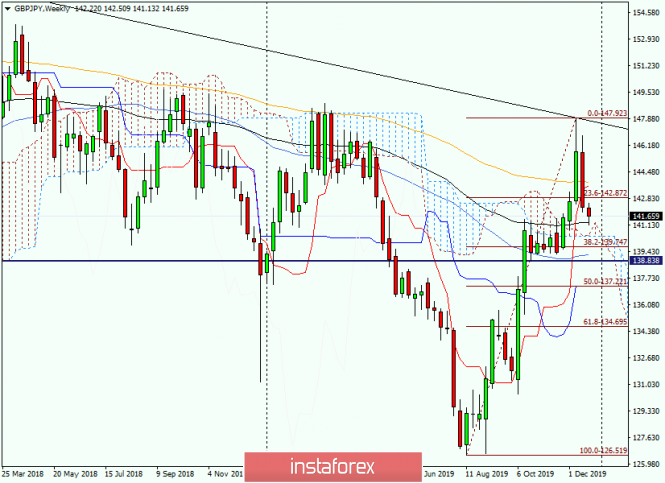
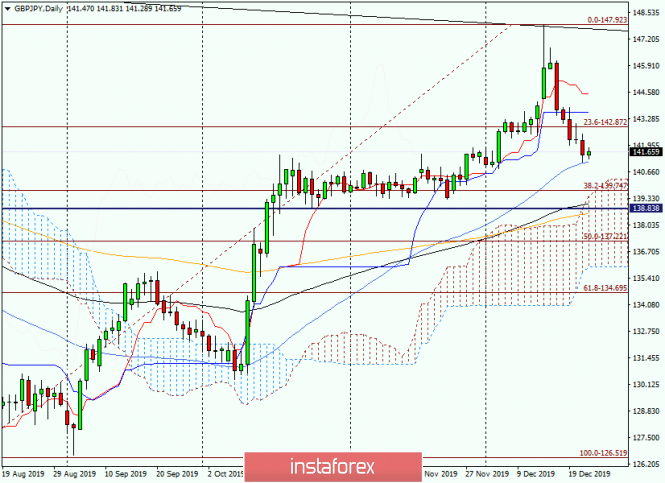
| GBP/JPY analysis and forecast for December 25, 2019 Posted: 25 Dec 2019 02:58 PM PST Hello again! Taking advantage of the closure of markets due to the celebration of Christmas, it is possible to consider currency pairs that are usually deprived of attention. One of these pairs, in my opinion, is the pound/yen cross rate. Those who are not beginners are well aware that this is one of the most volatile crosses, trading with which, you can not only make good money, but also decently lose. I admit honestly, recently I rarely look at the charts of this tool, and even more so, I trade it. It will be even more interesting right now in real time to consider further prospects of GBP/JPY by analyzing price charts. Do you want to - believe it or not - I just opened a graph of this cross-pair, did not prepare for its analysis, so right now I will express my personal opinion on the basis of technical factors. Weekly It's no secret that both the pound and the Japanese yen have not shone the stable direction of price dynamics in recent years. Both currencies either show serious strengthening, or suddenly find themselves under no less serious pressure from sales. As you can see, the weekly chart perfectly confirms this interpretation. Following the impressive growth of 126.52-147.92, an equally significant decline began. However, by stretching the grid of the Fibonacci instrument to the indicated upward movement, the downward direction at the moment can be considered a correction to the previous growth. Nevertheless, the continuation of the downward dynamics and the breakout of the level of 138.84 will significantly aggravate the situation for bulls on GBP/JPY. It will be possible to finally talk about the bearish moods in the cross after passing the 50th level of Fibo from the indicated growth. It is characteristic that it is here that the Kijun line of the Ichimoku indicator runs, which makes the moment with the pair going down to 137.20 perhaps the key. Key in terms of what comes next. If 50% Fibo and Kijun repel a possible bear attack, you can expect a rebound to at least 139.00-139.20. As you can clearly see on the weekly chart, below are many strong supports, the passage of which is by no means guaranteed. At the moment, the bears are trying to push quotes below a strong 89 exponent. Whether they will succeed or not, we will find out only after the close of trading on December 23-27. But even if 89 EMA is broken, below the support are able to provide both boundaries of the Ichimoku indicator cloud at 140.50, and at 139.25 50 a simple moving average. As for me, the chances of a further direction of the price movement are approximately equal, but, in my personal opinion, the continuation of the upward scenario seems to be the most relevant. By the way, its confirmation will be the breakout of the Tenkan 144 EMA line and consolidation above the important technical level 144.00. Daily On the daily chart, the picture is also far from unambiguous. I will indicate the nearest resistance and support, after which traders are entitled to look for options for opening positions. I'll explain my point right away - it makes sense to consider movement and positioning in both directions. So, selling looks relevant after quotes rise to 143.60 and 144.53. This is where the Kijun and Tenkan lines run, respectively. It seems that the price range of 143.50-144.50 is extremely strong and, together with Tenkan and Kijun, could provide strong resistance and turn the course down. In turn, purchases are technically justified after a decline in the price range of 140.00-139.00. This is no less (or maybe more) strong area than the indicated resistance. With both options for positioning, it would be nice to enlist the support of candle signals. However, at the moment it is worth observing how the price behaves relative to 50 MA, which provides current support to the pound/yen cross. Good luck and profit! The material has been provided by InstaForex Company - www.instaforex.com |
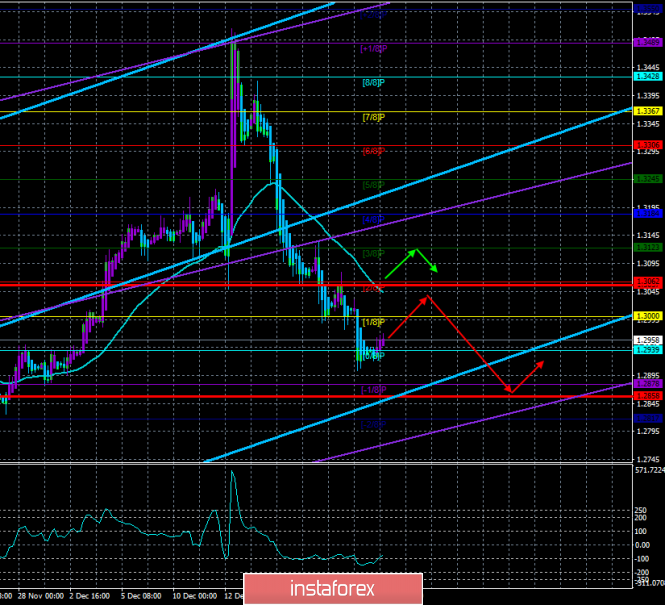
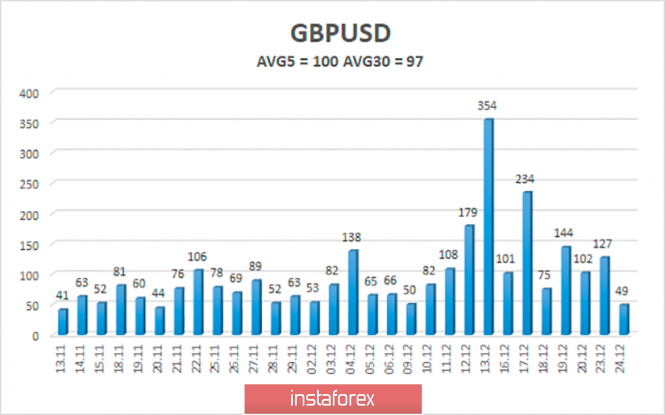
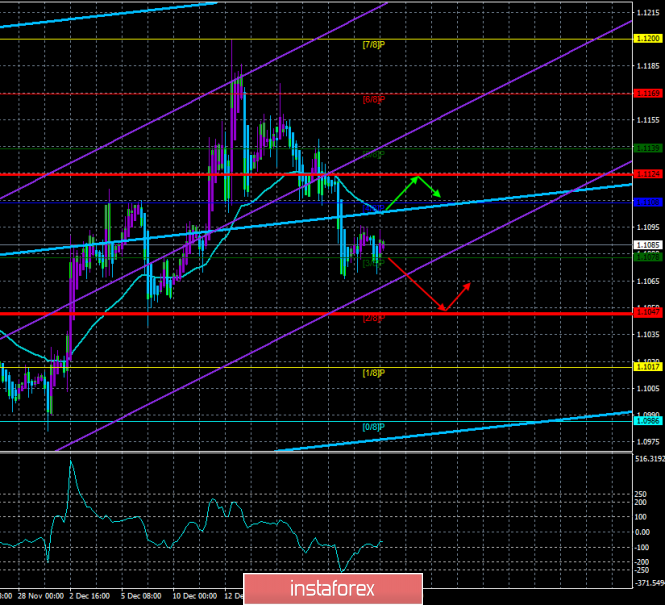
| Overview of the GBP/USD pair. December 25. 2020 will bring a lot of new challenges to the pound Posted: 25 Dec 2019 02:58 PM PST 4-hour timeframe Technical details: Higher linear regression channel: direction - up. Lower linear regression channel: direction - up. Moving average (20; smoothed) - down. CCI: -78.6140 The British currency began to be corrected on Tuesday, December 24, and all international currency and stock exchanges are closed on Wednesday. Thus, trading will not be carried out until Thursday, and we can only speculate and philosophize about the prospects of the pound sterling, about the various political events and plans of the British government is not the future. We have repeatedly said that the prospects for the pound remain very dim for a number of reasons, including economic, political, and the "Boris Johnson factor". Thus, until the fundamental background for the British currency changes from absolutely negative to at least neutral, it makes no sense to wait for a serious and reasonable strengthening of the pound. Yes, traders may note that over the past few months the pound also had no reason to grow, however, the currency has grown to $1.35, however, we are now talking exclusively about the reasonable movement of the pair in one direction or another, that is about that movement that can be worked out without relying on luck. Even during the period of its strengthening, the pound initially grew, then for about a month was in a flat, then it increased again. That is, there was no stability. Based on this, we believe that in 2020, the British currency will face approximately the same picture. The main thing for the UK and the pound is now to go through the first stage of a "divorce" with the European Union. After January 31, the question "will there be a second referendum?" Or "will we just leave the European Union?" Will not be asked. After January 31, the "divorce" process will be officially launched. And the prospects for the pound after January 31 will depend solely on progress in the negotiations between Boris Johnson, representatives of his government and the EU negotiation group led by Michel Barnier. What can you say now, at the end of 2019, about these negotiations? Only that they will be extremely complex, and therefore potentially could fail. We do not believe that absolutely no agreement will be reached. Most likely, a "surface agreement" will be concluded, which will highlight the main points and points of further coexistence of Britain and the European Union. That is, the most important and basic aspects relating, for example, to trade. The remaining, not so pressing issues will already be discussed after 2020. Thus, although most political scientists and experts are inclined to believe that it will not be possible to conclude a deal in 11 months, we believe that perhaps not everything is so bad and there are still some chances for success. However, in any case, it will be necessary to watch the progress of the negotiations and judge the advancement of the parties precisely by this information. Thus, in 2020 we are waiting for the renewal of multi-year lows of the pound/dollar pair, and how far the pound will go down will depend on the promotion of trade negotiations with the European Union. Technically, the upward trend that has been observed in recent months is already broken, now the bears just need to develop success, based on weak macroeconomic statistics from the UK and uncertainties in future relations between Britain and the EU. The average volatility of the pound/dollar is exactly 100 points over the past five days, remaining at a fairly high level. According to the current level of volatility, the working channel on December 25 and 26 is limited by the levels of 1.2858 and 1.3060. The pair has currently started to adjust, and volatility may continue to decline in the Christmas and New Year weeks. Nearest support levels: S1 - 1.2939 S2 - 1.2878 S3 - 1.2817 The nearest resistance levels: R1 - 1,3000 R2 - 1.3062 R3 - 1.3123 Trading recommendations: The GBP/USD pair began a round of upward correction. Thus, traders are advised to sell the British currency with the nearest targets of 1.2878 and 1.2858 after the Heiken Ashi indicator reverses back down, but with extreme caution. It is recommended that you return to purchases of the pound/dollar pair no earlier than re-consolidation above the moving average line, however, while such a scenario is not expected. In addition to the technical picture, fundamental data and the time of their release should also be taken into account. Explanations for illustrations: The highest linear regression channel is the blue unidirectional lines. The lowest linear channel is the violet lines of unidirectional movement. CCI - blue line in the indicator regression window. Moving average (20; smoothed) - a blue line on the price chart. Murray levels - multi-colored horizontal stripes. Heiken Ashi is an indicator that colors bars in blue or purple. Possible price movement options: Red and green arrows. The material has been provided by InstaForex Company - www.instaforex.com |
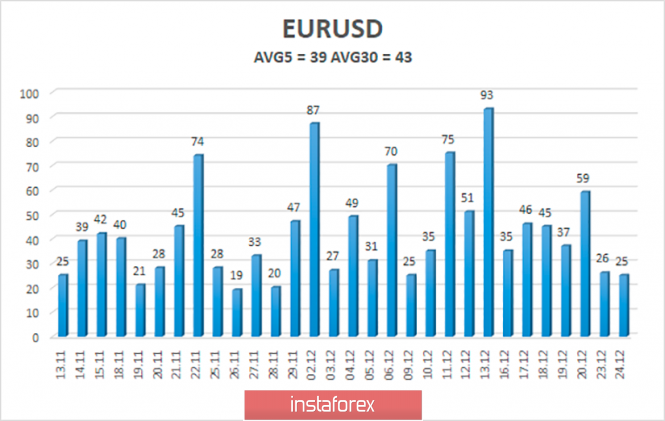
| Overview of the EUR/USD pair. December 25. Democrats drag out impeachment of Trump Posted: 25 Dec 2019 02:57 PM PST 4-hour timeframe Technical details: Higher linear regression channel: direction - up. Lower linear regression channel: upward direction. Moving average (20; smoothed) - down. CCI: -63.1389 The currency and stock markets are officially closed in honor of the celebration of Christmas, and we have no choice but to focus on the fundamental background, which is now exclusively political in nature. It is clear that the last full trading week of the year is, firstly, split in half by Christmas, and secondly, there are no planned macroeconomic publications on its balance. On the last trading day, the euro/dollar pair already showed great reluctance to trade in any particular direction, and volatility fell to a record 25 points per day. As we said earlier, with such volatility, trading the pair is extremely difficult and inconvenient. But back to our political news. The two most relevant and exciting topics now are the "impeachment of Donald Trump" and the "signing of the agreement between China and the United States." On Tuesday, Trump, who, I recall, is extremely unprofitable for the impeachment case to continue for a long period of time, continued to put pressure on the Speaker of the House of Representatives, Nancy Pelosi (who is one of the Democrats). Trump expressed outrage at the fact that there are too many uncertainties around the impeachment process in the Senate, and lawmakers have not yet been able to come to the rules for carrying out such a process. Previously, Pelosi postponed the transfer of the case to the Senate indefinitely. Trump was unable to get past Pelosi, who had "come under attack," and immediately declared: "She hates the Republican Party. She hates everyone who voted for me and the Republican Party. It inflicts tremendous damage to the country. " One of the main features of the US president is his constant use in speech of indefinite pronouns. Most of all, Trump likes to call the enemies of the government, the country and the American nation the pronoun "they". Every second of his statements the word "they" is mentioned. Sometimes it's absolutely clear who Trump is talking about, sometimes it's completely incomprehensible, and each listener or reader of the message from the US president has to guess for himself who is in question. For example, Trump said: "We have the majority, and now they want McConnell to do something wonderful for them." It's at least understandable who they are, it's about the Democrats, but what Trump has in mind when speaking of "something wonderful" is hard to understand. One thing is certain: the Democrats will drag out the process of transferring the case to the Senate until they find new witnesses who are ready to give new evidence in this case. Trump will insist on the speedy transfer of the case to the Senate, since at the moment there are no new witnesses who are ready to cooperate with justice. As for the trade agreement between China and the United States, Trump said on Tuesday that he and Chinese President Xi Jinping will hold a ceremony to sign the first phase of the trade agreement that was reached this month. Trump also said that at this time the entire voluminous document of the agreement is in the process of being translated into Chinese, after which "we will all come together and sign the document." We continue to be skeptical of this agreement until its essence is clear and understandable to absolutely all market participants, that is, until it is published and available to everyone. Only then will it be possible to understand what kind of concessions both parties made and the full list of agreements. It seems that the first phase agreement will be signed, but it's nature is also important here, since it will depend on it for further negotiations. Recall that the first phase, according to many experts, is considered the easiest, in the future Beijing and Washington expect much more complicated negotiations. As a summary, we can say that at the end of the outgoing year there will probably be no strong jerks of the pair. But at the beginning of the new year, when a trade agreement will be signed, the US currency could possibly strengthen, which is already fundamentally justified. The average volatility of the euro/dollar currency pair fell to 39 points and has a tendency to further decline. Thus, we now have volatility levels of 1.1046 and 1.1124. Given the empty fundamental background and the beginning of the flat, none of these levels can be worked out until the end of the week. Nearest support levels: S1 - 1.1078 S2 - 1,1047 S3 - 1,1017 The nearest resistance levels: R1 - 1,1108 R2 - 1.1139 R3 - 1,1169 Trading recommendations: The euro/dollar pair retains the prospects for a downward movement, but in the near future the beginning and continuation of the flat is possible. Thus, one can formally consider selling the euro while aiming for 1.1047 after the Heiken Ashi indicator has moved down, however, with the opening of any positions, we recommend that you be extremely careful. The general fundamental background does not remain on the side of the euro, so a fall in the pair is more preferable, but rather in the new year. It is recommended to buy the euro/dollar pair no earlier than when traders return to the area above the moving average line. In addition to the technical picture, fundamental data and the time of their release should also be taken into account. Explanations for illustrations: The highest linear regression channel is the blue unidirectional lines. The smallest linear regression channel is the purple unidirectional lines. CCI - blue line in the indicator window. Moving average (20; smoothed) - a blue line on the price chart. Murray levels - multi-colored horizontal stripes. Heiken Ashi is an indicator that colors bars in blue or purple. Possible price movement options: Red and green arrows. The material has been provided by InstaForex Company - www.instaforex.com |
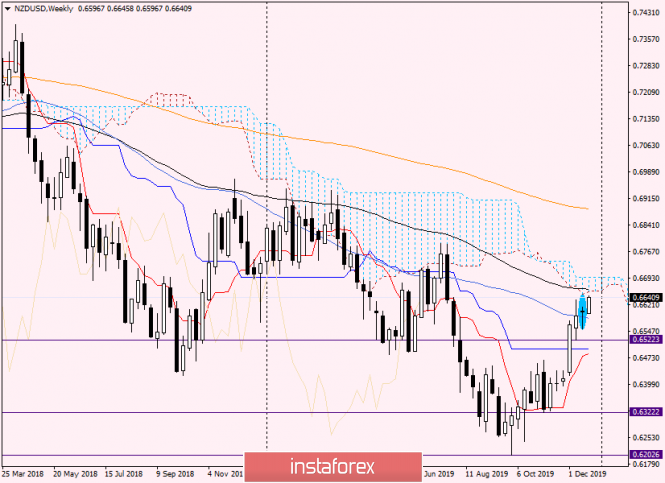
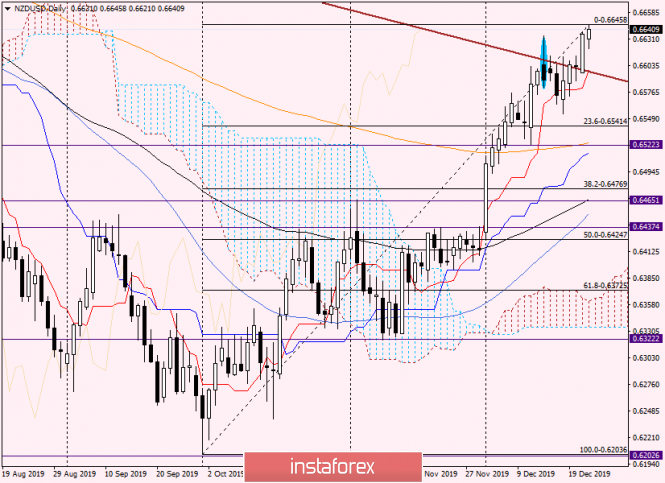
| NZD/USD review and opinion on December 25, 2019 Posted: 25 Dec 2019 02:57 PM PST Dear colleagues! Despite the fact that today global trading floors are closed due to Christmas, we will analyze some tools that are not so often seen. Perhaps, the NZD/USD currency pair can rightfully be attributed to just such instruments. Before proceeding to the analysis of the charts of the kiwi, a little about the situation that developed at the time of closing of trading before the celebration of Christmas. But the picture was mixed. In relation to some major currencies, the US dollar has grown, while it has fallen slightly in relation to others. If earlier the so-called "Christmas rally" often happened, then in recent years this phenomenon has practically not been observed. So Tuesday's trading took place at fairly low volumes. The instability of the US currency is still affected by sometimes conflicting reports about an agreement in a trade dispute between the United States and China. If you look at the economic calendar, then it is actually empty. Based on this, in order not to lose time, let's better look at some charts of NZD/USD and try to determine the future prospects of the New Zealand dollar against the US dollar. Weekly This is exactly what was mentioned at the beginning of the review. The pair rarely comes into view. As we see, in vain. The situation here is developing very interestingly and requires a timely response. However, I hope we are not late. In any case, it is necessary to wait until the end of this week, and only after that it will be possible to draw more definite conclusions. At the moment, the situation is such that the market breaks the bearish signal in the form of a Hanged candle and shows a desire to continue to move up. And let the "Hanging Man" appear below the highest values of the previous white candle, this does not cancel its bearish essence. So, the pair tends to go up, and the nearest resistance with the continuation of the bullish direction may occur in the area of 0.6656-0.6663. It is here that the lower boundary of the Ichimoku indicator cloud passes, as well as the 89 exponential moving average. If the current five-day trading ends within the Ichimoku cloud and above 89 EMA, this will only emphasize the seriousness of the bullish sentiment for this currency pair. The lowest objective will be closing the week above the year before last highs shown at 0.6635. If all current growth is lost and trading on December 23-27 ends under 50 simple moving average, the bullish kiwi scenario may need to be revised. While the week shows the pair's desire to grow. We are waiting for the results of the closure of the current five-day period. Daily On the daily chart we see that the breakout of the brown resistance line 0.6938-0.6790 most likely took place. Four consecutive candles closed above this line. I believe that the pullback to this line can be considered to open long positions. Moreover, there is Tenkan right on the line, and this is an option for additional and, possibly, very strong support. If we take it at prices, then it's worth planning purchases after pulling down the pair to a strong technical level of 0.6600. This mark was already mentioned in the previous review on the kiwi, and was mentioned as quite strong and important. Determining the price zone (and not a specific point) to open long positions, I will highlight the area 0.6625-0.6600. After the pair dips into the selected area, we consider options for buying NZD/USD, where candlestick patterns on the daily, four-hour and hourly charts will become an additional signal. If the expected decline does not happen and the quotation continues to grow, we are waiting for the breakout of resistance at 0.6650 and after consolidating above, we buy the pair at the pullback to the broken mark. At the moment, this is the main trading idea for the NZD/USD pair. Wish you success! The material has been provided by InstaForex Company - www.instaforex.com |
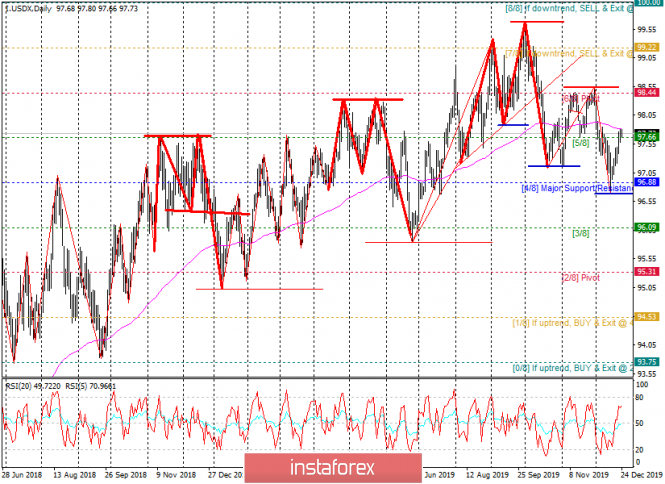
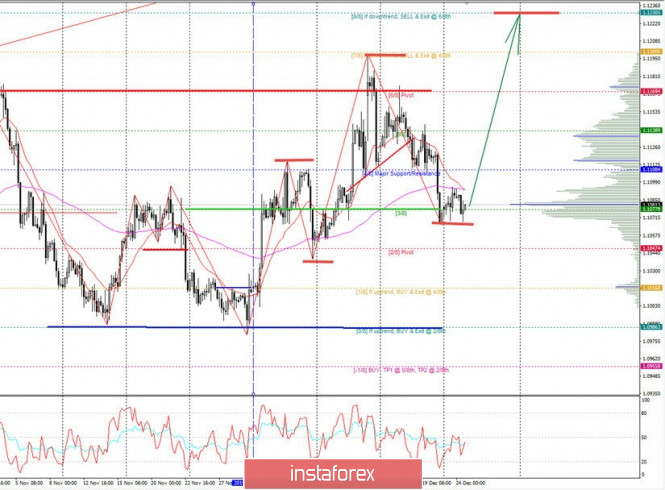
| Outlook for US dollar and EURUSD in the first quarter of 2020 Posted: 25 Dec 2019 02:57 PM PST Hello! At the end of the outgoing year, it is customary to take stock and create plans for the future. I will not depart from this tradition and I will summarize and outline the prospects for the dynamics of the US dollar and its antagonist EURUSD. Formally, with respect to a basket of foreign currencies, the dollar ends 2019 with a positive trend of about three percent, which can be written in its asset. However, in the second half of the year, a situation emerged in the FOREX market that suggests a depreciation of the US dollar next year, or at least in the first half of 2020. The nature of the foreign exchange market is such that traders are more interested in periods from a few days to a quarter, but today we can say with some certainty that the dollar has survived its climax at the end of September 2019 and by the end of December has almost formed a trend reversal to pull down quotes . The vast majority of traders determine the trend using graphical analysis in trading terminals, in our case InstaForex will be such a terminal, and if we approach the definition of a trend from the point of view of technical analysis, the medium-term trend of the US dollar is really broken. Technical analysis is pretty straightforward to understand, but many traders are confused about definitions. I apologize to those who are fluent in this tool, but I consider it necessary to repeat some of the postulates: an upward trend is a series of consecutively increasing lows and highs; a downward trend is a series of successively lowering highs and lows; the trend will continue until we get the opposite. Based on the tenets of the trend dynamics, for its reversal, it is necessary to violate the conditions of the previous trend, i.e., for the US dollar, which is in an upward trend, it is necessary to violate the conditions for increasing key lows and highs. However, what extreme can be considered key? Let's figure it out, because it is very important! But for this we will need to understand some fundamental market concepts. Forex is a market with a small time horizon. Unlike the oil market, the highest depth of the foreign exchange market is six months. Theoretically, one can speak of longer periods, but, unfortunately, there is no liquidity or the rate will be very far from what is desired. Therefore, the optimal period for which transactions can be made is one quarter. If we talk about trading time frames, then the quarter is reflected in the daily period. A transaction opened on a period of one day, with a high degree of probability will be in the market from one to four months. Accordingly, a transaction opened on a four-hour period (H4) will be in the market for one to four weeks, and a transaction opened on an hourly time (H1) will be conducted in the market from one day to one week. Based on these parameters, it is possible to determine the key extreme for each half. For the daily chart, the key points will be monthly and quarterly extremes. For a four-hour time period, weekly and monthly highs and lows will be key, and for an hourly time, day and weekly tipping points will be key. To determine the fracture of the medium-term trend, let's look at the daily chart of the US dollar index (Fig. 1). As follows from the definition of the trend, at the moment, the dollar (USDX) has broken the upward trend, originating in the spring of 2018, dropping below the low of September at 97.90 and October at 97.15. This implies a further decline in the dollar against a basket of foreign currencies at least until the dollar index reaches the November 98.50 high. Another confirmation that the dollar has changed its direction is its location below the level of the semi-annual moving average line with a period of 120. Technical analysis shows that the immediate goals of the US dollar decline will be levels 96.90 and 96.15. Figure 1: U.S. Dollar trend broken However, we, as traders, are not very interested in the dollar index, we need to know what will happen to the EURUSD. Everything is very simple here. Since the US dollar index is 58% euro, the EURUSD is the opposite of the dollar index. The current index value is 97.70, and the current EURUSD value is 1.1080. Assuming a decline in the dollar to levels 96.90 and 96.15, this means that the euro during the first quarter of 2020 could grow by 0.8 and 1.5%. Let's see what happens with the euro. A 1.5% increase in EURUSD implies an increase to 1.1230, which is quite realistic in a wide range (Fig. 2). Fig. 2: Prospects for the dynamics of EURUSD Consider the dynamics of the EURUSD rate in the four-hour half, which determines the prospects for a period of up to one month. Here we can see a series of successively rising lows and highs, which indicates an increasing trend, which is in full accordance with the US dollar rate in the daily half and suggests the completion of the corrective growth of the dollar that it experienced from December 12. Thus, the current technical picture implies the potential possibility of buying the euro against the US dollar with a target at 1.1230. The disadvantages of this purchase will be a negative swap and the need to maintain a position during the New Year holidays when liquidity in the FOREX market decreases, which means unpredictable price spikes are possible, which complicates the installation of a stop order to consolidate losses. From a fundamental point of view, the decline in the dollar and the growth of the euro are locally supported by the growth of oil quotes. In addition, in the future, until March 2020, with almost one hundred percent certainty, one can assume the unchanged policy of central banks, which maintains the current status quo, according to which the exchange rate will change in a narrow range. Thus, with a 95% probability, by the end of March 2020, the EURUSD quote will remain in the range 1.0925 - 1.1535, which corresponds to the band in the parameters of 2019. The material has been provided by InstaForex Company - www.instaforex.com |
| EUR/USD. China is again dissatisfied with the United States - the dollar is losing ground Posted: 25 Dec 2019 02:57 PM PST After falling from the levels of many-month highs, the euro-dollar pair took the price level in the middle of the 10th figure. The EUR/USD bears could not lower the price below 1.0980 (the lower line of the Bollinger Bands on the daily chart), while the bulls are not able to return the pair to their previous positions. Amid low liquidity and pre-holiday phlegmatic trading, the pair got stuck in a flat waiting for information drivers. Rare news and near-market rumors are pushing the price up or down - but in fact, the foreign exchange market has already fallen into traditional pre-Christmas suspended movement with low volatility. The EUR/USD pair has already managed to update session (and at the same time weekly) lows on Tuesday, being marked at 1.1069. However, then the buyers seized the initiative, and the pair updated the daily high, although they did not leave the boundaries of the 10th figure. On the one hand, such price fluctuations can be called market noise, but, on the other hand, during a period of general lull, such price jumps are of interest - what fundamental factors could stir traders from the holiday hibernation? For example, the dollar came under pressure on Monday after the release of unexpectedly weak data on the growth of orders for durable goods. The overall indicator collapsed to -2% with a forecast of growth to 0.2%. Without taking into account transport, the indicator dropped to zero, although according to forecasts it was supposed to grow immediately by 1.5%. While European statistics provided little support for the euro: the German import price index significantly grew in monthly terms (+0.5% instead of the projected increase to 0.1%), although in annual terms it remained in the negative area (but still came out in the green zone, better than expected). This indicator is an early signal of changes in inflationary trends; therefore, its positive dynamics kept the euro from further decline - including paired with the dollar. Towards the end of yesterday, the dollar received support from China - it became known that the Chinese government will reduce import tariffs on a wide range of goods (total 859 types) from January 1, including certain types of food products, consumer goods and spare parts production of smartphones. The market interpreted Beijing's actions as a friendly step by China in the context of recent events, although it made this decision independently, outside the negotiation process. The news flow has completely dried up on Tuesday- in preparation for Christmas, so the economic calendar is almost empty. During the US session, only the Federal Reserve's Richmond secondary index was published, which showed negative dynamics (it dropped to -5 points instead of the expected decline to -1). At the same time, the market also turned its attention to the external fundamental background, after which the dollar again came under additional pressure. The reason for this is the growing tension between Washington and Beijing. Dollar bulls did not have time to take advantage of the thaw period. True, in this case we are talking about a conflict not of an economic but of a political nature. The fact is that on Monday, Trump signed the bill on the US military budget for next year. Even at the stage of consideration of this document in Congress, China expressed its indignation regarding some of its points. In particular, the signed law expresses support for Hong Kong protesters, who for several months have been trying to overthrow the pro-Chinese city administration. The United States also expressed their intention to bypass China to increase Taiwan's defense capabilities and combat readiness (including through joint exercises and arms sales). Beijing considers Taiwan its province, which, if necessary, can be forcibly combined with mainland China. Therefore, it is not surprising that the Chinese perceived the US defense budget as interference in the internal affairs of the state. After Trump nevertheless signed this bill, China through diplomatic channels protested to the American side. In addition, a representative of the Chinese Foreign Ministry later said that if the above-mentioned military budget provisions are implemented by Washington, relations between the countries will deteriorate significantly, and the situation in the region will be destabilized. Such prospects are confusing dollar bulls. On the one hand, recently passed laws in the United States supporting protesters in Hong Kong did not prevent the parties from agreeing on the first phase of the deal. On the other hand, the second stage of the dialogue promises to be much more difficult, while the above circumstances will clearly not contribute to mutual concessions. That is why the dollar lost points throughout the market on Tuesday. The EUR/USD pair was no exception here - during the US session, the price regained its position, thereby extinguishing the downward impulse. However, one cannot talk about cardinal changes now since the thin market is too unstable. The material has been provided by InstaForex Company - www.instaforex.com |
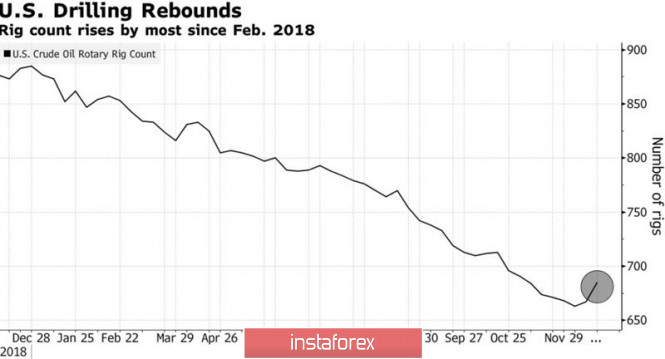
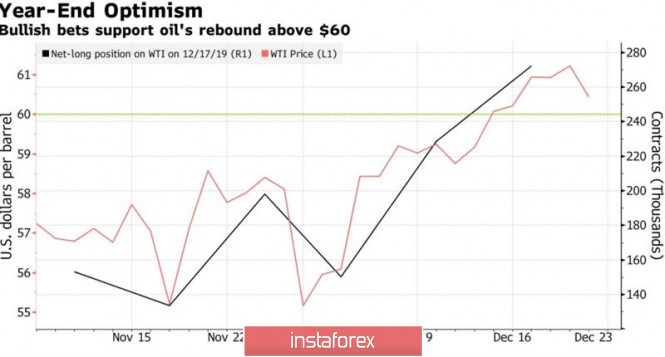
| Posted: 25 Dec 2019 02:47 PM PST While oil in the thin Christmas market comfortably rests on its laurels near two-month highs, large banks and investment companies are not stingy with forecasts. The consensus assessment of Bloomberg experts suggests that the average price for Brent in 2020 will be $64.25 per barrel, for WTI - $58.5 per barrel. This is slightly lower than the current quotes for the North Sea and Texas varieties, but higher than their average in 2019. Over the past month, oil added about 5% thanks to the willingness of China and the United States to sign a trade agreement under Phase 1 and OPEC+'s intentions to bring the total production cuts to 2.1 million bpd, which is equivalent to about 2% of the global supply of black gold . Russia believes that cooperation with Saudi Arabia and other cartel countries is effective and will continue as long as the market requires it. It is believed that a drop in Brent below $60 per barrel will lead to an increase in the cut from Riyadh, and an increase in North Sea quotes above this mark will increase oil supplies from the United States, Norway, Brazil and other countries outside the OPEC. Thus, we are talking about a certain red line around which Brent will prefer to trade in 2020. Goldman Sachs predicts that black gold will do better and raises its estimate of the average North Sea grade price from $60 to $63 per barrel. Judging by the decrease in the number of drilling rigs from Baker Hughes, US manufacturers are reducing investment in the industry, which should lead to a slowdown in production. Let me remind you that in November it exceeded 13 million bpd. US Drilling Rig Dynamics Speculators are also optimistic about the prospects for black gold. By the end of the week, by December 17, they increased their net longs by WTI by 19%, by Brent - by 6.6%. As a result, indicators are at their highest levels in more than seven months. In 2019, the Texas variety grows faster than the North Sea variety (+33.4% since the beginning of the year versus +23.6%), which has its own logical explanation. The US economy looks better than the rest of the world, and strong domestic demand is driving up prices. In 2020, the situation may change. Thanks to the restoration of the eurozone and China amid the end of the trade war, global demand will lend a helping hand to more expensive oil. As a result, the Brent-WTI spread risks expanding. The dynamics of WTI and speculative positions It is possible that a slowdown in US GDP will force the Federal Reserve to return to the idea of continuing the cycle of a preventive easing of monetary policy, which will inflict a blow on the positions of the US dollar. What is bad for the US currency is good for black gold, so a correction to the USD index in 2020 will raise the number of bulls in the oil market. Technically, buyers of the North Sea grade managed to gain a foothold above the important level of $64 per barrel, and they are preparing to attack the resistance at $66.85-66.95. Success in this event will open an upward path for Brent in the direction of the target by 88.6% according to the Double Peak pattern. The material has been provided by InstaForex Company - www.instaforex.com |
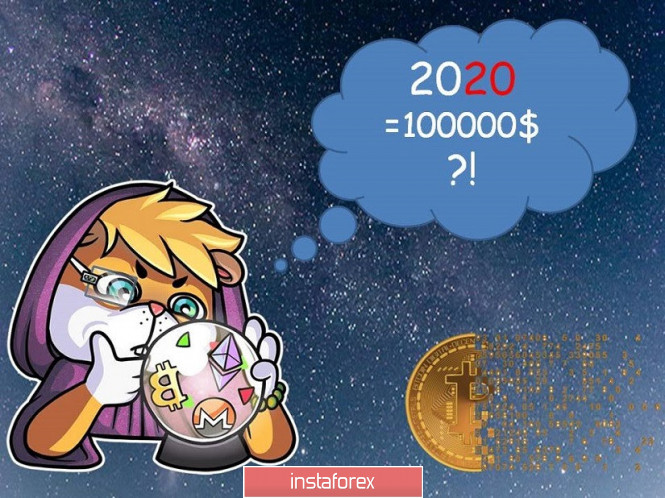
| Is it worth buying Bitcoin next year and how much will it cost? Posted: 25 Dec 2019 02:45 PM PST Greetings to crypto enthusiasts, here comes the end of 2019, how many things happened, and even more that did not happen, so here are the details. The "holy" forecasts of many market gurus about the movement of Bitcoin prices towards the $50,000-$100,000 marks did not even closely match, but, I think, ordinary sane traders did not expect such a development. In principle, not everything was so bad as in 2018, if you look at the Bitcoin movement in detail, then 2019 gave a solid income, and this is not a joke. The highest income since the beginning of the year was 300%, and for the current day, taking into account the correction, it is approximately 110%, which, by the way, is greater than in the foreign exchange and stock markets. Thus, there was an opportunity to earn, but, in connection with a considerable fear in the form of a repetition of 2018, few people managed to take full advantage of the situation, but I do not exclude that true traders took their profit from the market. What was in terms of the foundation of the crypto industry? Many projects, exchanges that appeared on the 2017-2018 hype, finally fell apart in 2019, which to some extent cleaned the industry from garbage. At the beginning of the year [2019], a new hype appeared in the form of IEO [Initial Exchange Offerings, the primary exchange offer], which was headed by the Binance exchange and, to some extent, again set the drive for the market. Like any hype, IEO died just as fast as the ICO [Initial coin offering], and the market began to fade again. In terms of jurisprudence, the leading economies of the world continue to consider cryptocurrency a surrogate, but still try to figure it out. In turn, the SEC [Securities and Exchange Commission] continues to pull the strap, delaying the launch of the bitcoin-ETF, citing all the same reasons: the lack of an appropriate legal framework; risk of laundering; high volatility of bitcoin; data exchange, etc. In turn, representatives of the US Congress in the person of Paul Gosar proposed a bill providing for the separation of functions for regulating digital currencies between several departments, which may facilitate the task of a sacred understanding of the industry. Digest of the last days: • The People's Bank of China announced the completion of work on a digital analogue of the renminbi. The digital RMB electronic payment system has already been tested. The next step is the launch of a pilot program in commercial banks in China, through which the digital yuan will be distributed among the citizens of the country. • Crypto enthusiast Larry Chermak conducted a study and found that 95% of all cryptocurrencies are already depreciated and their value is zero, since they have zero liquidity. He studied not only the volume of exchange trading, but also the depth of their orders, the data of which is more difficult to fake. With the exception of stablecoins, of all crypto assets, only twenty currencies have liquidity. Bitcoin has the highest rate. If we consider its analysis in descending order, then the list of currencies looks like this: Bitcoin; Ethereum; EOS Litecoin XRP; Bitcoin Cash BSV TRON; ETC NEO; BNB; Monero Dash Zcash Chainlink Sellar Cardano; Dogecoin; Huobi Token; Tezos. • Iranian President Hassan Rouhani proposed creating a cryptocurrency for Muslim countries as an alternative to the US dollar. He believes that the Muslim world needs a different tool to counter US economic sanctions. What awaits us in 2020? To begin with, according to the fifth European Union anti-money laundering directive, from January 10, 2020, new rules will come into force that all blockchain projects located in the EU should adhere to - a link to the document. So, according to the new rules, projects will be required to register with supervisory authorities, identify their customers and pass on the addresses of user wallets to the authorities. The consequences of the innovation are not difficult to predict, many small startups simply will not be able to get along, which will lead to a change of jurisdiction to other countries. Large projects will feel the pressure that will affect existing users within the ecosystem. It is worthwhile to understand that the European Union is not doing anything catastrophic, this completely normal norm of vision is active, just the ideology of the crypto industry is built according to a different law, which contradict the well-known, but this is for the time being. In turn, the US Securities and Exchange Commission [SEC] will once again decide to approve or refuse the Bitcoin-ETF on February 26, 2020, but with a 95% probability we will hear the refusal all for the same reasons. Regarding the Bitcoin-ETF, I suppose that 2020 will not be able to give complete results, because the regulator does not have a complete understanding of control and regulation, and if the demand for cryptocurrencies continues to fall, the process will go to arbitrary infinity. Forecasts for 2020 and not only - an excursion according to the expectations of world experts • Silk Road DarkNet service founder Ross Ulbricht once again announced Bitcoin's upside potential to $100,000, citing Elliott wave analysis. So, he believes that the past waves had impulses in themselves: 1 wave - from $0.06 to $32; 3 wave - from $2 to $1240; 5th wave - started from $175 and continues to this day, that is, its prospect, in comparison with previous waves, is in the region of $100,000. • The well-known McAffee continues to shout about growth, although his earlier predictions, frankly, did not match. This time he is certain that by the end of 2020 the first cryptocurrency will grow ten times, he did not provide any arguments, thereby his goal is to once again draw attention to himself and no more. • Former chief executive officer of one of the largest exchanges in China [BTCC] and just a veteran of the crypto industry, Bobby Lee believes that next year Bitcoin can easily update record highs and reach such a mark as $60,000. He suggests that, in connection with the upcoming Halving Bitcoin, the demand for the first cryptocurrency can significantly increase. His judgment is more sensible in comparison with the two predictions before him, and so, the halving process entails the complication of BTC production by halving the reward to miners. A decrease in the emission rate can directly affect the rate of Bitcoin. • The cult personality Nassim Taleb, the author of such a bestseller as The Black Swan, believes that a decrease in people's confidence in the banking system and state authorities will lead to the fact that the crypto industry can no longer be ignored, and even if the cryptocurrency price drops, it will still be used. • Experts from the research division of the BitMEX exchange forecast that in 2020 the BTC will trade in the range of $2,000-$15,000, and the Bitcoin dominance index will not exceed 75%. • Bloomberg analysts, together with Deutsche Bank experts, believe that the instability of the financial system caused by a potential recession and further problems of US-Chinese trade relations may lead to an increase in demand for the first cryptocurrency in 2020. As we can see from the above forecasts, many experts expect great growth, just do not forget that in order for 2017 to repeat, the market needs another influx of new traders with real [non-virtual] money. Otherwise, we will see the flow of an asset from one crypto trader to another, and the Bitcoin rate will tirelessly continue to decline. The material has been provided by InstaForex Company - www.instaforex.com |
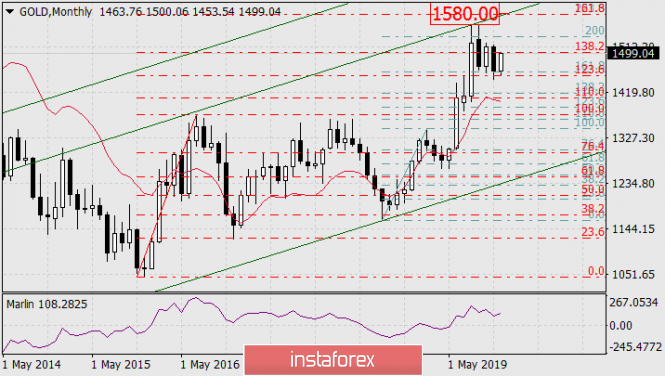
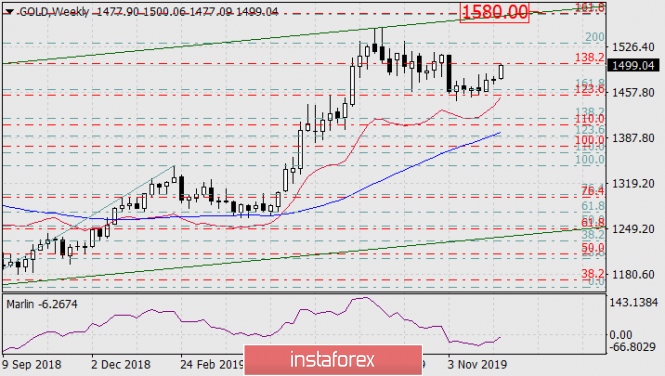
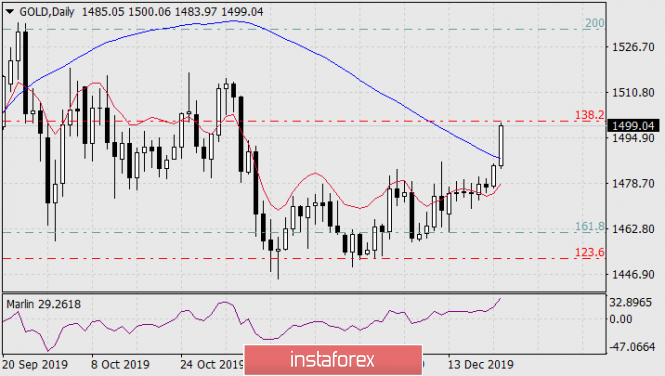
| Medium-term gold prospect until spring 2020 Posted: 25 Dec 2019 02:44 PM PST On a monthly chart, the current candle is growing exactly from the Fibonacci line 123.6% red. This grid is built on the base movement of December 2015-June 2016. The signal line of the Marlin oscillator also moved up in the zone of positive numbers. A promising growth target is the level of coincidence of two Fibonacci levels: 161.8% of the red mesh and 223.6% of the azure mesh, the base branch of August 2018-February 2019. The levels coincide in the area of the price mark of 1580.00. In the same area, the price is waiting for the embedded line of the global price channel, originating in June 2005. The price can reach the target level in two months, that is, by March of next year. On the weekly chart, the price is showing steady growth, supported by the rising signal line of the Marlin Oscillator. On the daily chart, the price went above the MACD line (blue moving), the signal line of the Marlin oscillator went out into the growth zone even earlier, now the situation on this scale is completely increasing. The material has been provided by InstaForex Company - www.instaforex.com |
| Posted: 25 Dec 2019 02:43 PM PST The data on the US economy released on Monday, which is the values of basic orders for durable goods and their volumes, were disappointing, but only gold quotes reacted to the negativity while the foreign exchange market habitually stood, and US stock indices continued the Christmas rally. Or is this not entirely true? Indeed, basic orders for durable goods and their volumes in November fell compared to October values. Base orders were at zero against the expectation of an increase of 0.1% and, importantly, the October figures were revised down to 0.3%. The volume of orders fell by 0.2% against the forecast of growth by 1.5%. The October data was revised down to 0.2%. And although the US stock market did not respond to this in any way, nor did the dollar exchange rate, gold turned out to be the indicator that responded to the data presented. Or is it still not quite so? Since the beginning of this month, gold began to grow smoothly, and then fell into a weekly mode of waiting for a denouement in the negotiations on the so-called "first phase" between Washington and Beijing. Last week, Trump and the Chinese side announced the signing of the first phase of the agreement in January. This supported the quotes of the yellow metal, which began to grow weakly. This move was caused by a lack of transaction details and continuing fears that the expressive US president might change his mind again. Moreover, interestingly, all the statements that the resumption of growth in the price of gold reflects precisely these fears do not find confirmation in the dynamics of other important protective assets. We do not observe a drop in yield in US government bonds, so the benchmark yield of 10-year Treasuries remains near a local high in early November and is not going to fall at all, neither in Japanese yen and Swiss franc quotes. So, it turns out that some other reasons push gold prices up. There is an explanation that this is the topic of impeachment of Donald Trump by the US Democratic Party that supports prices, but it is not confirmed by the dynamics of other defensive assets and the movement of the stock market. Doubts that the latest data on America's economy are so disappointing that it makes investors fear for its objective growth in the fourth quarter, it seems, are also not significant. In our opinion, there are two banal reasons. The first is the habitually thin market on Christmas week, when there is a unique opportunity to "move" the market to one or several large players in their interests. And the second reason, we believe, is the expiration of futures contracts on December 25 that helps to increase spot prices to futures in the interests of individual players in this market. Of course, the beginning of active trading will show how right we were, but the reasons for the increase in gold prices that we have cited are indeed, most likely, these reasons, and not something else. The material has been provided by InstaForex Company - www.instaforex.com |
| You are subscribed to email updates from Forex analysis review. To stop receiving these emails, you may unsubscribe now. | Email delivery powered by Google |
| Google, 1600 Amphitheatre Parkway, Mountain View, CA 94043, United States | |





No comments:
Post a Comment