Forex analysis review |
- Weekly EURUSD analysis
- Weekly candlestick pattern in Gold implies the start of a correction
- January 10, 2020 : EUR/USD Intraday technical analysis and trade recommendations.
- January 10, 2020 : GBP/USD Intraday technical analysis and trade recommendations.
- BTC analysis for 01.10.2020 - Evening start patterrrn on the daily time-frarme, watch for selling oppotuntiies
- Gold 01.10.2020 - Key decision pivot on the test at $1.500, further upside very possible
- GBP/USD 01.10.2020 - Watch fo bigger upside movement and completion of the ABC downside correction
- Technical view and recommendations for USD/CAD on January 10
- GBP/USD: plan for the US session on January 10. The British pound is not in a hurry to buy, but there are still few willing
- EUR/USD: plan for the US session on January 10. Euro buyers do not believe in Germany's good performance and are in no hurry
- Australian dollar becomes star of the market. How long?
- EUR/USD. January 10. Two bullish divergences may send the euro higher, but both trading ideas to sell remain valid
- GBP/USD. January 10. Three sales signals are still in effect
- Analysis and forecast for USD/JPY on January 10, 2020
- Trading recommendations for GBPUSD for January 10, 2020
- EUR/USD is back on the path of financial war
- Will dollar support the first NFP report this year?
- Simplified wave analysis of GBP/USD and USD/JPY on January 10
- Technical analysis of ETH/USD for 10/01/2020:
- Technical analysis of BTC/USD for 10/01/2020:
- Technical analysis of NZD/USD for January 10, 2020
- Technical analysis of GBP/USD for 10/01/2020:
- Technical analysis of EUR/USD for 10/01/2020:
- Reading headlines (Overview of EUR/USD and GBP/USD on 01/10/2020)
- Analysis of EUR/USD and GBP/USD for January 10. Bad news for the pound while good news for the euro
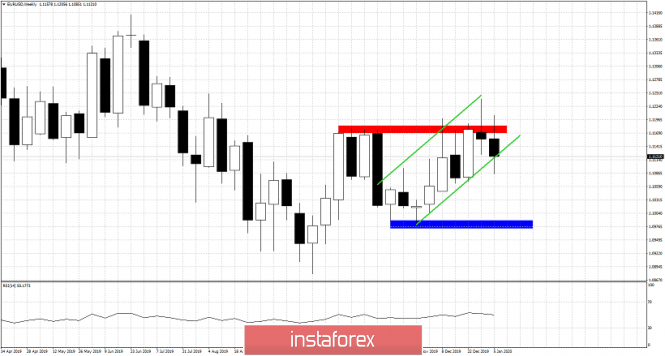
| Posted: 10 Jan 2020 03:39 PM PST EURUSD challenged the 1.12 level once again, but bulls were not strong enough for a second time to hold above 1.12. Price is back below the horizontal resistance (red rectangle) at 1.1170. Price so far has respected short-term higher highs and higher lows. In order for bulls to remain in control of the trend, we should see price starting to rise after Monday.
Blue rectangle - support Green lines- bullish channel EURUSD has made another negative weekly performance and it is testing the weekly bullish green channel. Price has not managed once again to close above the red rectangle resistance. As long as price is below it bulls need to be very cautious. This past week's low is important short-term support. Bulls need to recapture 1.1170-1.12 in order to have hopes for a move towards 1.13. The material has been provided by InstaForex Company - www.instaforex.com |
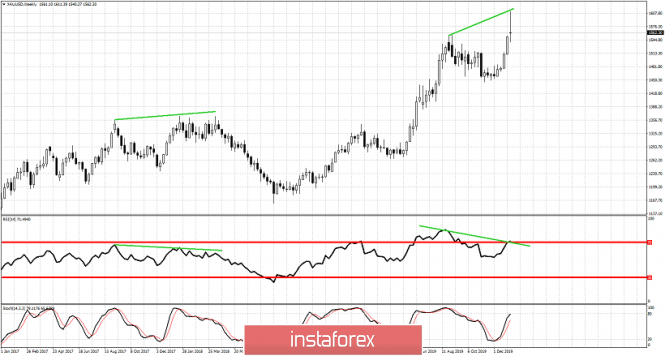
| Weekly candlestick pattern in Gold implies the start of a correction Posted: 10 Jan 2020 03:34 PM PST The last time we had a weekly RSI bearish divergence in Gold price, we saw prices pull back around $200. Gold price has formed a bearish reversal candlestick and combined with the RSI divergence makes us believe that we should expect more downside.
Green line- bearish divergence Both the RSI and the stochastic are providing weekly bearish divergence warnings. The weekly candlestick with the long upper tails confirms this warning. Also in Elliott wave terms, Gold price we can say that it has made 5 waves up from the August of 2018 low. So it it is time for a pull back. Back in December of 2017 where we had a similar weekly bearish divergence, Gold price pulled back $200. We continue to expect such a pull to be very possible. First short-term target is the $1,500 area. The material has been provided by InstaForex Company - www.instaforex.com |
| January 10, 2020 : EUR/USD Intraday technical analysis and trade recommendations. Posted: 10 Jan 2020 07:23 AM PST
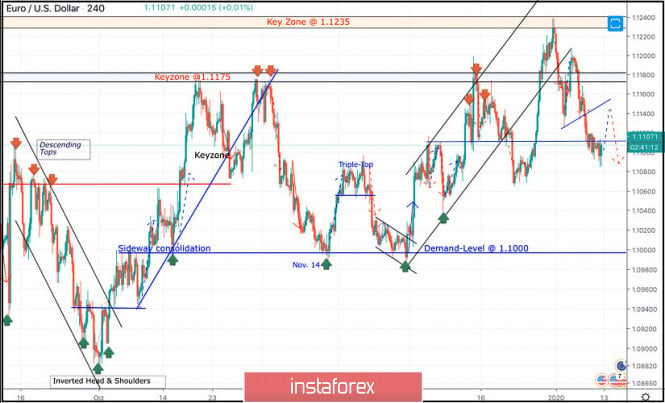
Since November 14, the price levels around 1.1000 has stood as a significant DEMAND-Level offering adequate bullish SUPPORT for the pair on two successive occasions. During this Period, the EUR/USD pair has been trapped within a narrow consolidation range between the price levels of 1.1000 and 1.1085-1.1100 (where a cluster of supply levels and a Triple-Top pattern were located) until December 11. On December 11, another bullish swing was initiated around 1.1040 allowing recent bullish breakout above 1.1110 to pursue towards 1.1175 within the depicted short-term bullish channel. Initial Intraday bearish rejection was expected around the price levels of (1.1175). Moreover, On December 20, bearish breakout of the depicted short-term channel was executed. Thus, further bearish decline was demonstrated towards 1.1065 where significant bullish recovery has originated. The recent bullish pullback towards 1.1235 (Previous Key-zone) was suggested to be watched for bearish rejection and another valid SELL entry. Suggested bearish position is currently running in profits while approaching the price levels around 1.1110. The current Key-Level around 1.1110 may provide some bullish rejection. If so, another bullish pullback would be expected towards 1.1140 and probably 1.1175. On the other hand, for those who caught the initial bearish trade around 1.1235, bearish persistence below 1.1110 enables further bearish decline towards 1.1060 and probably 1.1040. Trade recommendations : Conservative traders should wait for bullish pullback towards the price levels of (1.1140-1.1175) as another valid SELL signal. Bearish projection target to be located around 1.1120 and probably 1.1060. Any bullish breakout above 1.1175 invalidates the mentioned bearish trading scenario. The material has been provided by InstaForex Company - www.instaforex.com |
| January 10, 2020 : GBP/USD Intraday technical analysis and trade recommendations. Posted: 10 Jan 2020 06:19 AM PST
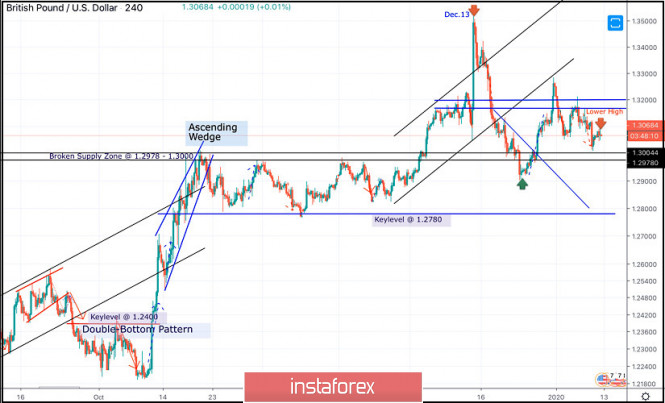
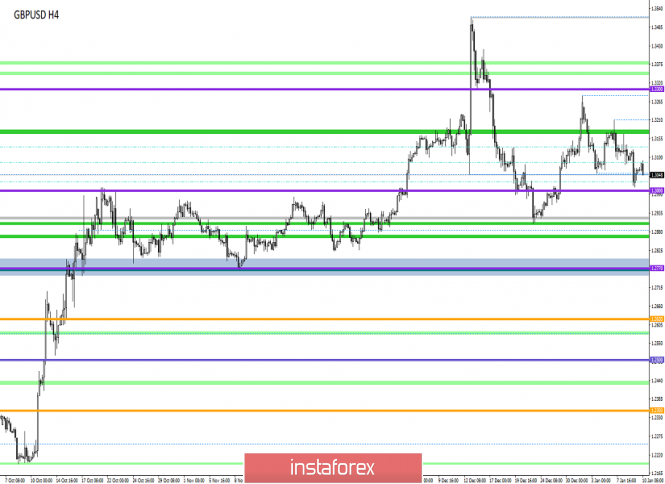
On December 13, the GBPUSD pair looked overpriced around the price levels of 1.3500 while exceeding the upper limit of the newly-established bullish channel. On December 23, initial bearish breakout below 1.3000 was demonstrated on the H4 chart. However, earlier signs of bullish recovery were manifested around 1.2900 denoting high probability of bullish breakout to be expected. Thus, Intraday technical outlook turned into bullish after the GBP/USD has failed to maintain bearish persistence below the newly-established downtrend line. That's why, bullish breakout above 1.3000 was anticipated. Thus, allowing the recent Intraday bullish pullback to pursue towards 1.3250 (the backside of the broken channel) where bearish rejection and another bearish swing were suggested for conservative traders in Last Week's previous articles. Intraday bearish target remains projected towards 1.3000 and 1.2980 provided that the current bearish breakout below 1.3170 is maintained on the H4 chart. Please also note that two descending highs are being demonstrated around 1.3120 and 1.3090 which enhances the bearish side of the market. On the other hand, bearish breakdown below 1.2980 is mandatory to enhance further bearish decline towards 1.2900 and probably 1.2800 where the backside of the previously-broken downtrend is located. Moreover, Intraday traders can watch any bullish pullback towards the depicted price zone (1.3170 - 1.3200) for bearish rejection and another valid SELL entry with intraday bearish targets projected towards 1.3000 and 1.2980. The material has been provided by InstaForex Company - www.instaforex.com |
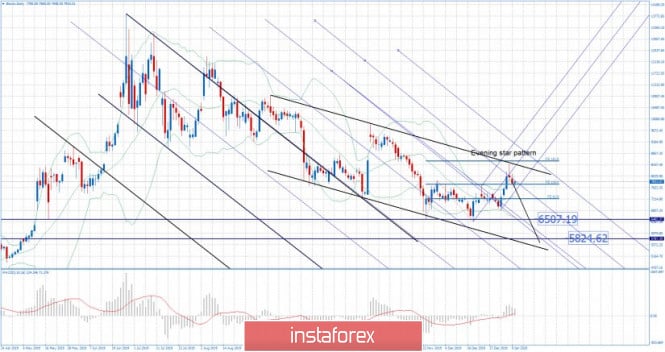
| Posted: 10 Jan 2020 04:43 AM PST Industry news: Thailand's Siam Commercial Bank (SCB) recently partnered with RippleNet to create 'SCB Easy', a mobile application that facilitates instant, low-cost cross-border payment solutions, according to a blog post. With this, the 112-year-old bank became Thailand's first domestic bank that is willing to push forward with Fintech partnerships. Technical analysis:
BTC is still trading inside of the downside channel and there is potential fo the further downside movement. I would like to see the breakout of the $7.690 to confirm further downward movement and potential test of $6.510 and $5.824. MACD reading is positive above the zero and slow line is slopping to the upside. As long as the BTC is trading above the $8.500 there is potential for more downside. Support levels are seen at the price of $6.507 and $5.824 Key resistance is set at the price of $8.500 The material has been provided by InstaForex Company - www.instaforex.com |
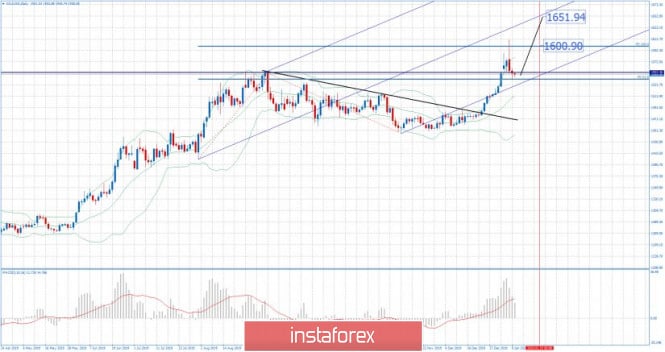
| Gold 01.10.2020 - Key decision pivot on the test at $1.500, further upside very possible Posted: 10 Jan 2020 04:31 AM PST Gold has been trading sideways at the price of $1.550.My analysis from yesterday didn't change and I still see more upside on the Gold and potential re-test of $1.600 and $1.650.
The breakout of the major swing high this week was the key for strong demand on the Gold. My advice is to watch for buying opportunities on the dips using intraday-frames 5/15 minutes. The Non-Farm Employment Change can be big volatility boost for Gold. MACD oscillator is showing increase on the upside momentum and new high, which is good confirmation for the further upside... Resistance levels and upward targets are seen at the price of $1.601 and $1.650. Key support level is set at the price of $1.550-$1.540 The material has been provided by InstaForex Company - www.instaforex.com |
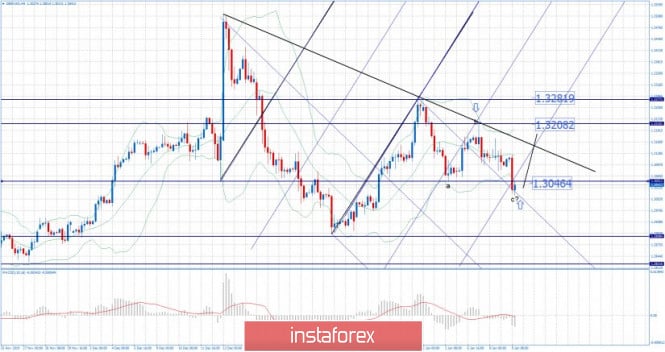
| GBP/USD 01.10.2020 - Watch fo bigger upside movement and completion of the ABC downside correction Posted: 10 Jan 2020 04:22 AM PST GBP has been trading upwards as I expected yesterday. The price tested the level of 1.3090. I still see more upside on the Gold and potential test of 1.3200 and 1.3280. The employment change that will happen in next hour might be key trigger for further development.
There is potential completion of the ABC downside correction and resume of the upward trend. My advice is to watch for buying opportunities on the dips using intraday-frames 5/15 minutes. MACD oscillator is showing neutral stance and slow is is trying to turn bullish. Resistance levels and upward targets are seen at the price of 1.3150 and 1.3200. Support levels are set at the price of 1.3035 and at the price of 1.3000. The material has been provided by InstaForex Company - www.instaforex.com |
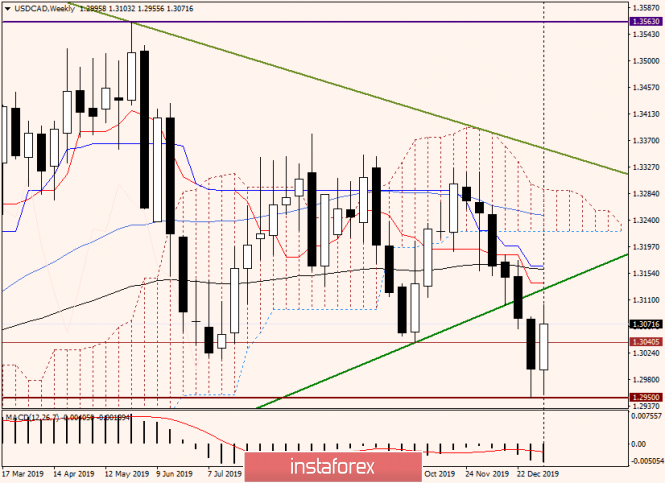
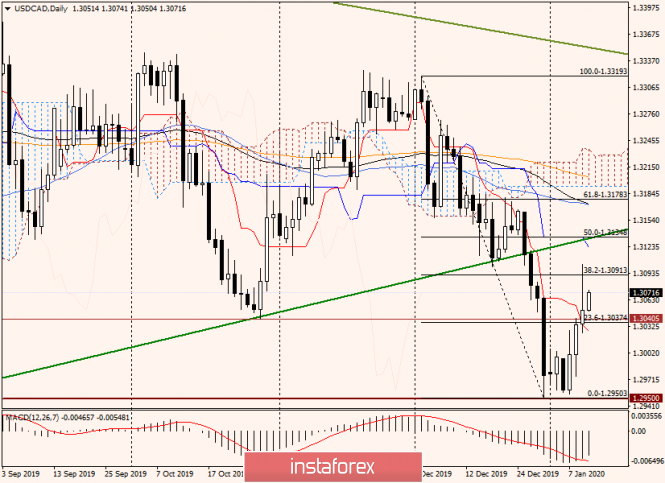
| Technical view and recommendations for USD/CAD on January 10 Posted: 10 Jan 2020 03:37 AM PST Good day, dear traders! Today is a special and very important day for the USD/CAD currency pair. The fact is that at 14:30 (London time), data on the US and Canada labor market will be published There will be reports from the Maple Leaf Country on the unemployment rate and changes in the number of people employed. The US Department of Employment will present data for December on the creation of new jobs in the non-agricultural sectors of the economy, the growth of average hourly wages and the unemployment rate. We can only assume that the strongest volatility will overwhelm a pair of North American dollars! I suppose sharp and strong movements, possibly in each direction. Weekly
I think that today, the current growth will be largely determined. It is an adjustment to the previous decline or a change in the trend. To approve the latter, it is necessary to close weekly trading above the broken green support line of 1.2061-1.3041. But that's not all. As you can see, a little higher is the Tenkan line of the Ichimoku indicator, over which the 89 exponential moving average and Kijun hang. All of the above is quite able to provide strong resistance and turn the price down, so to indicate the seriousness of their intentions, the bulls on USD/CAD need to close trading above 1.3166. I must say that this task is not easy, but using such important macroeconomic statistics, everything can be. To prevent any insinuations that they have lost control of the pair, the bears need to eliminate a significant part of the current growth and close trading below the level of 1.3040. We go further. Daily
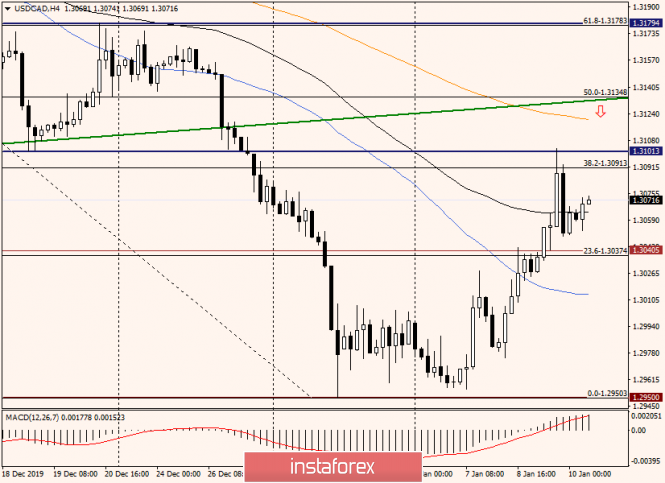
We observe a very interesting and important point in the current situation. After yesterday the pair corrected to the level of 38.2 Fibo from the decline of 1.3319-1.2950 and reached one of the key technical levels of 1.3100. Also, there was a strong rebound down. As a result, a candle appeared with a very impressive upper shadow, several times the size of the body itself. Very often, after such candles, the quote turns to a decrease, but at the time of writing the review, the USD/CAD rate continues to strengthen. In my opinion, the closing price of today's trading will be very important. If it turns out to be higher than yesterday's highs of 1.3103, you can count on the subsequent strengthening of the quote. If not, USD/CAD will likely resume the downward scenario and go to re-test the strong technical level of 1.2950. In the case of its true breakdown, there will be almost no doubt about the bearish direction of the instrument. At the same time, I do not exclude a short-term increase of the price to 1.3123, where the Kijun line is located, from which a strong rebound down may occur. H4
At the 4-hour chart, the full significance of the current moment is confirmed. Bulls on the pair need to break through the resistance of sellers at 1.3103, but this will not close all the questions. As you can see, a little higher, at 1.3121, there is a 200 exponential moving average, which together with the broken green support line of 1.2061-1.3041 is quite capable of providing decent resistance to attempts to grow and turn the quote down. For aggressive and risky traders, I recommend looking for sales after the pair rises to the levels of 1.3123, 1.3166, and 1.3172. For those who on the last day of weekly trading do not want to take risks, and even on such important statistics, I recommend to stay out of the market and see what will be the result. Successful completion of the auction and a good weekend! The material has been provided by InstaForex Company - www.instaforex.com |
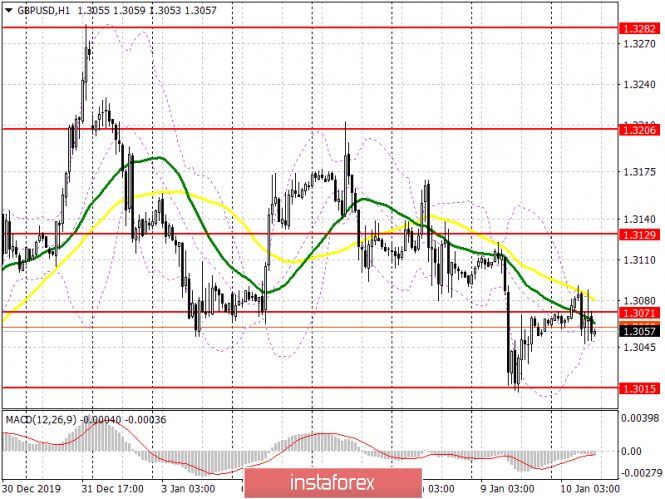
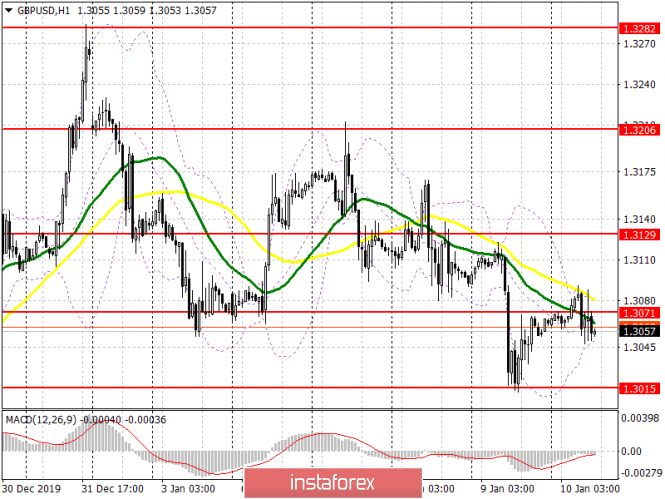
| Posted: 10 Jan 2020 03:37 AM PST To open long positions on GBPUSD, you need: After yesterday's failed meeting of the British Prime Minister with EU representatives, as well as the approval of the Brexit bill in Parliament, the pound has wandered into a dead end. Buyers retreated from the level of 1.3071, which I emphasized in the morning forecast, but there are no willing to sell yet. An important task for the second half of the day will be to consolidate above the resistance of 1.3071, which will open GBP/USD the opportunity to test the longer-term highs of 1.3129 and 1.3206, where I recommend taking the profits. If the report on the US labor market will be better than economists' forecasts, then it is best to consider new long positions on the pound after updating the support of 1.3015, provided that a false breakout is formed there, or buy immediately on a rebound from the minimum of 1.2971. To open short positions on GBPUSD, you need: Bears have achieved small so far but returned to the level of 1.3071, and while trading is conducted below this range, we can expect a decline in the pound to the support of 1.3015, the breakdown of which will only increase the pressure on the pair and lead to the area of 1.2971 and 1.2904, where I recommend taking the profit. If the report on the US labor market is not so positive, the growth above the resistance of 1.3071 will lead to larger purchases. In this scenario, it is best to look for new short positions in the resistance area of 1.3129 or sell GBP/USD immediately on a rebound from the maximum of 1.3206. Indicator signals: Moving averages Trading is conducted in the area of 30 and 50 moving averages, which indicates a temporary uncertainty with the direction. Bollinger Bands Volatility has decreased, which does not give signals to enter the market.
Description of indicators
|
| Posted: 10 Jan 2020 03:37 AM PST To open long positions on EURUSD, you need: The euro continues to fall, ignoring the support level of 1.096. However, as noted in the morning review, all will be decided by the data on the American labor market, which can complete the cycle of ten-year growth. The bulls have only one hope for indicators that will be worse than economists' forecasts or coincide with them. Only in this scenario, you can expect a return of EUR/USD to the resistance area of 1.096 and a larger upward correction to the maximum of 1.1130, where I recommend fixing the profit. If the report is better than expected, it is best to look for new long positions only after the formation of a false breakout in the area of the minimum of 1.1069 or buy immediately on the rebound from the support of 1.1041. To open short positions on EURUSD you need: Sellers continued to control the market and coped with the morning task, which was to break and consolidate below the support of 1.096, which only increased the pressure on the EUR/USD. The bears' new target is the lows of 1.1069 and 1.1041, which will be tested only after a good report on the US labor market. That's where I recommend taking profits. In the case of bad indicators, the bulls will be able to regain the resistance of 1.1096. Only in this scenario, it is best to consider short positions only after the formation of a false breakout around the level of 1.1130 or sell EUR/USD immediately on a rebound from the highs of 1.166 and 1.1205. Indicator signals: Moving Averages Trading continues below the 30 and 50 moving averages, indicating continued pressure. Bollinger Bands Sellers have broken through the lower border of the indicator, which indicates that their advantages remain. In the case of an upward correction of the euro, the upper level of the indicator 1.1115 will act as an intermediate resistance.
Description of indicators
|
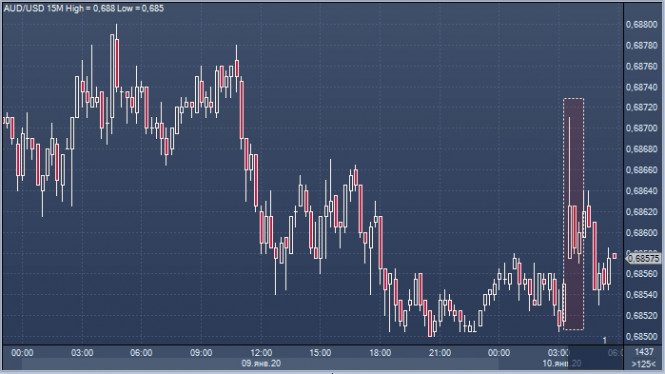
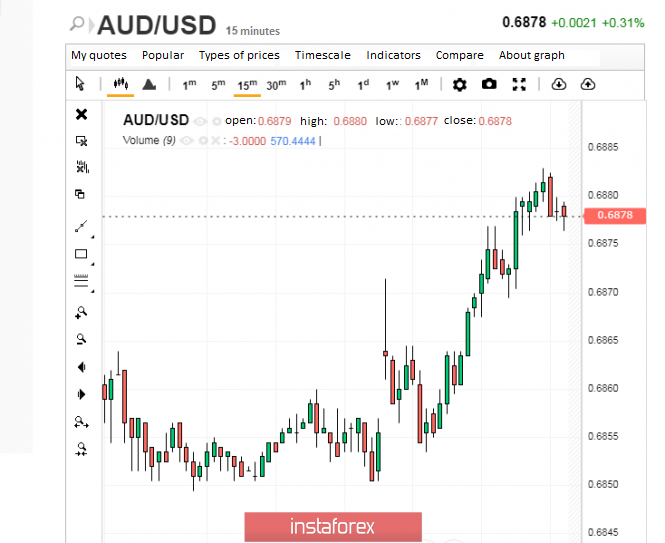
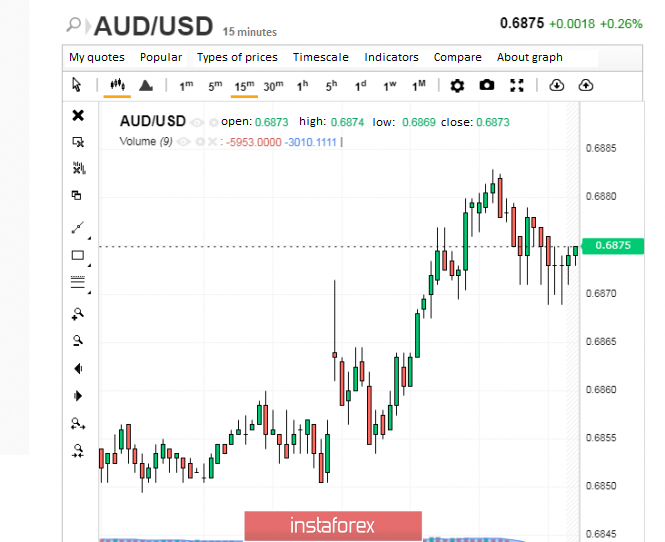
| Australian dollar becomes star of the market. How long? Posted: 10 Jan 2020 03:16 AM PST By the end of the week, the currency of the Green Continent has demonstrated its best qualities. The Aussie became the star of the Asian trading session, soaring to record highs. Triumph was not prevented by further subsidence following the rapid growth, analysts say. The driver of an unprecedented rise in the Australian dollar was the publication of positive data on retail sales in the country. According to a report from November 2019, the pair soared 0.9%, more than double the forecasts of economists. Previously, experts foreshadowed an increase of 0.4% and according to preliminary estimates, this is the strongest growth rate in the last two years. Recall that in 2017, this indicator rose by 1.1%. The current situation in the AUD / USD pair was taken by the bulls, seizing the initiative from the bears. This allowed buyers to partially regain lost positions. However, in the current report, not everything turned out to be as rosy as previously presented. According to analysts, the December results alerted the market and can disappoint traders, experts warn. In the wake of this mistrust, the Australian currency went down again and is currently near the closing levels on Thursday, January 9. Morning of January 10, the AUD / USD pair showed relative stability. It started at 0.6878, showing a slight downward trend. Subsequently, the tandem dipped to the level of 0.6874-0.6875, continuing to run in this range. Economists explain the abnormal growth of Aussie during the period of Christmas discounts when buying activity was at its peak. However, the time of triumph ends and it is time for a cold calculation, which suggests that you should not be too optimistic about the Australian dollar. Its current growth is due to the upward momentum associated with good macroeconomic data and is short-lived, analysts emphasize. This impulse is not enough to break the long downward trend of the AUD / USD pair, experts are sure. They do not advise to open short positions on this pair, especially in anticipation of the release of data on the American labor market. According to experts, the currency of the Green Continent still has no good reason for long-term growth. The current report, which became the starting point for the correction of the AUD / USD pair, is not able to affect the position of the leadership of the Reserve Bank of Australia (RBA) in relation to monetary policy. Experts believe that the regulator will ignore the positive data on the growth of consumer activity. Experts draw attention to the high likelihood of monetary easing by the RBA. The catalyst for this step can be conflicting data on the labor market in the country, published recently. The last meeting of the Australian regulator demonstrated that it is ready to further mitigate monetary policy. At the moment, the Central Bank of Australia took a break to assess the effect of previously introduced measures. The material has been provided by InstaForex Company - www.instaforex.com |
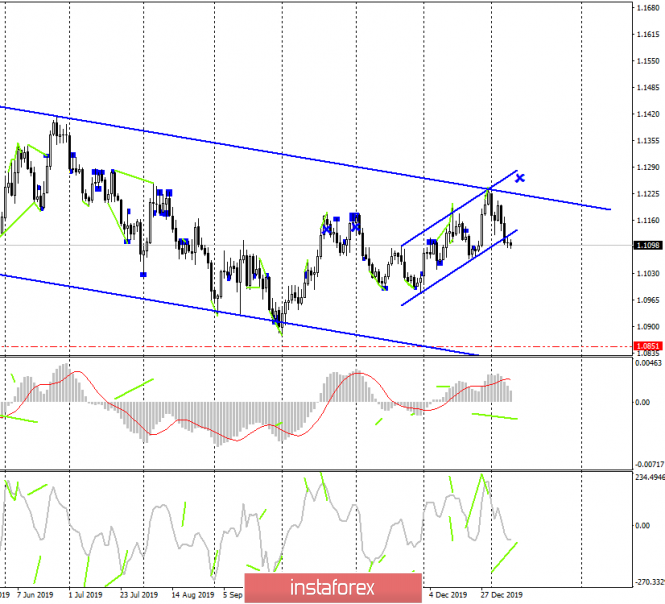
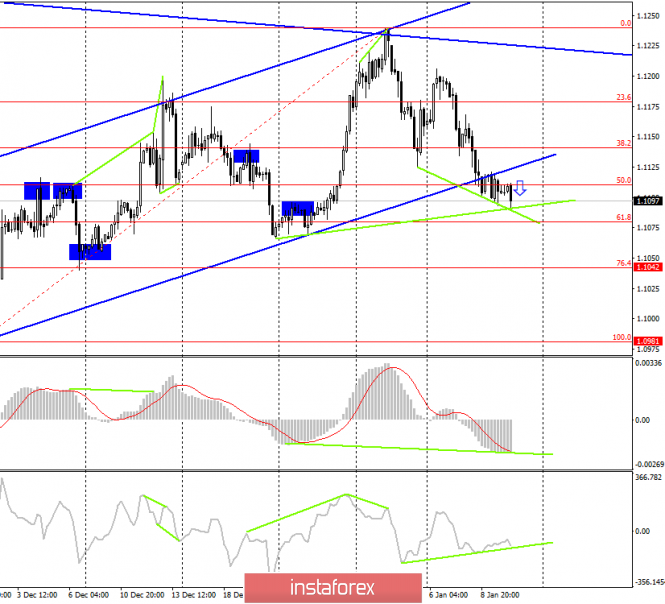
| Posted: 10 Jan 2020 03:13 AM PST EUR/USD - Daily.
As seen on the 24-hour chart, the EUR/USD pair has performed a consolidation under the upward small corridor, which increases the pair's chances to go further in the direction of the lower border of the downward trend corridor or approximately the level of 1.0851. The long-term trading idea remains valid, but its implementation may take from a week to two. EUR/USD - 4H.
On January 9, the EUR/USD pair continues the process of falling towards the corrective level of 61.8% (1.1080) on the 4-hour chart. At the same time, two bullish divergences are now brewing for the MACD and CCI indicator, which warns traders about a possible reversal of the pair in favor of the European currency and some growth in the direction of the corrective level of 38.2% (1.1141). I also tend to the option of rolling back the pair's quotes from the current levels up. And it is after the completion of the correction that I expect the pair to resume falling in the direction of the target levels of 76.4% and 100.0%. Forecast and trading recommendations for EUR/USD: The long-term trading idea remains in force, as the pair's quotes performed a consolidation under the upward small corridor. Traders get a target for a drop of about 250 points - around the level of 1.0850. On the second trading idea, I expect a fall during the week to the corrective levels of 1.1042 and 1.0981. Two bullish divergences eloquently indicate a likely correction that can be used for new sales with designated goals. The material has been provided by InstaForex Company - www.instaforex.com |
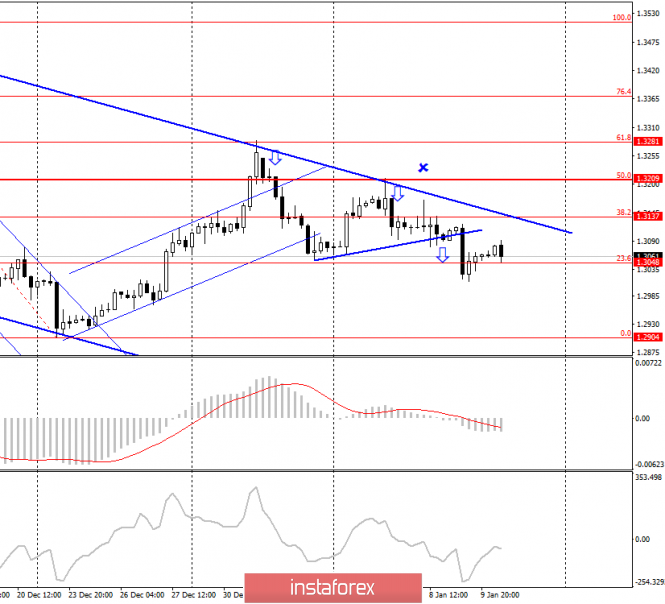
| GBP/USD. January 10. Three sales signals are still in effect Posted: 10 Jan 2020 03:13 AM PST GBP/USD - 4H.
The GBP/USD pair rebounded from the corrective level of 61.8% (1.3281), then from the corrective level of 50.0% (1.3209) and the upper line of the downward trend corridor, and on January 8 - closed under the correction line. All three signals are marked with down arrows in the illustration. At the moment, the pair has again performed a reversal in favor of the euro and started the growth process, however, I expect the resumption of the process of falling in the direction of the corrective level of 0.0% (1.2904). Closing the quotes above the upper line of the downward corridor will cancel all sell signals. Today, the divergence is not observed in any indicator. The new fixing of the pound-dollar exchange rate under the Fibo level of 23.6% (1.3048) will again increase the chances of a further fall in the direction of the last corrective level on the current Fibo grid of 0.0% (1.2904). Forecast and trading recommendations for GBP/USD: The current trading idea is to sell the pound with a target of 1.2900, as many as three sales signals have been received. I recommend moving the Stop Loss levels outside the trend range or placing them behind the nearest corrective levels. The material has been provided by InstaForex Company - www.instaforex.com |
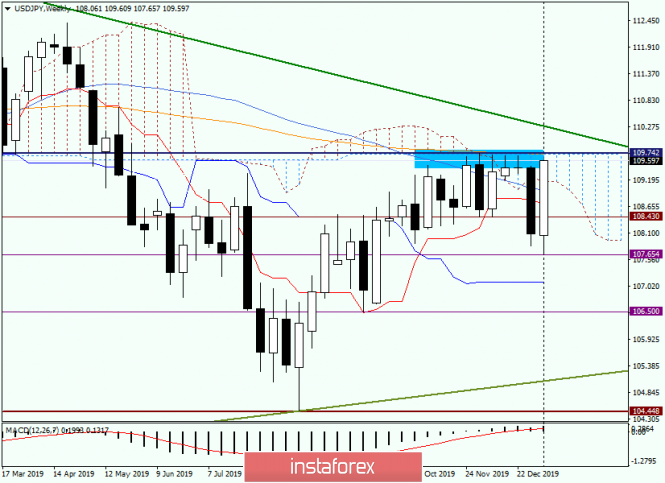
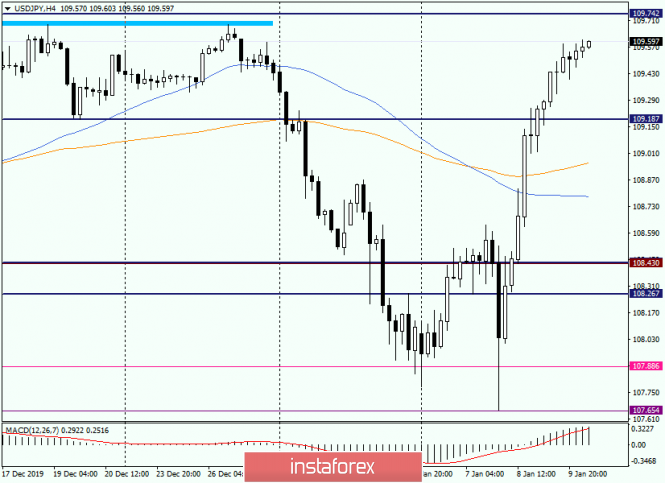
| Analysis and forecast for USD/JPY on January 10, 2020 Posted: 10 Jan 2020 02:14 AM PST Hello, dear colleagues! After the murder of Iranian General Soleimani by the Americans, it was quite logical to expect an escalation of the conflict between the US and Iran. It's been a long time coming. Against this background, protective assets began to enjoy increased demand, including the Japanese yen, which is a safe-haven currency. Iran, as promised, responded to the Americans by firing several missiles at their bases in Iraq. All the more surprising was the reaction of the markets, which believed that the further growth of the conflict will not happen. Given the nature of the owner of the White House, there is no doubt that the US will not leave the attack of its military bases in Iraq unanswered. Nevertheless, the demand for protective assets has disappeared, and what we see on the USD/JPY charts is a clear confirmation of this. Weekly
At the moment, the "bullish absorption" candle is being formed on the weekly chart, which in fact will be such in the case of closing weekly trading above 109.48. If trading ends above 109.74 and 144 exponential moving average, there will be little doubt that the market for USD/JPY has come under the control of the bulls. The bears are in a very difficult situation right now. They had a great opportunity to continue the decline that had started a week earlier, but something went wrong. Now, it is even difficult to imagine what sellers need to do to regain control of this tool. Yes, today investors have yet to digest the labor reports from the United States, which are scheduled for publication at 14:30 (London time). However, it is difficult to imagine the degree of negativity at which the dollar will collapse. Something extraordinary is going to happen. Judging by the weekly TF, it is premature to conclude, although there is a high probability of a reversal of the pair in the north direction. A very high probability. Let's see what will nonfarm bring. Daily
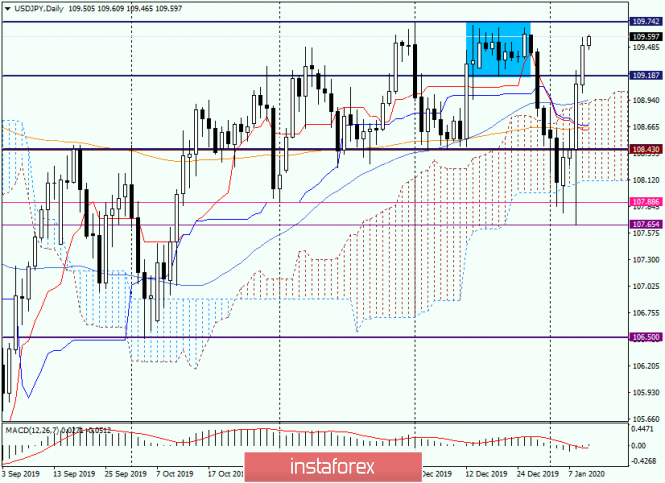
The level of 107.65 was the mark that stopped the decline and sent the pair up. And the rebound was very strong! The quote stitched up the Ichimoku indicator cloud, 144 EMA, Tenkan with Kijun and 50 simple moving average. As you can see, at the moment, the growth does not think to stop. In this regard, it is reasonable to assume attempts to break the resistance of sellers near 109.74. If these attempts are successful, we are waiting for the rate in a strong and important price zone of 110.00-110.20. In my opinion, the further direction of the quote will be finally decided here. From personal experience, I will suggest that such strong reversal movements just do not happen. This is usually a continuation of an existing trend or the emergence of a new one. A false breakdown of 50 MA, Kijun, Tenkan, 144 EMA and a downward exit from the cloud also indicate the weakness of bears and the strength of bulls. H4
As you can see, near 109.60, the upward momentum is fading. After such strong growth, it seems that the time has come to adjust the rate. You can wait for the closing of the current 4-hour candle and, in the case of its bearish nature, try to sell with the nearest goals in the area of 109.20-109.00. Although, to be honest, I would stay on USD/JPY while out of the market. Despite the very strong bullish sentiment, the pair has already grown decently, and buying under the resistance of 109.74 is not the best idea. Sales are against the current very strong upward momentum, so opening short positions on USD/JPY is also associated with increased risks. Good luck! The material has been provided by InstaForex Company - www.instaforex.com |
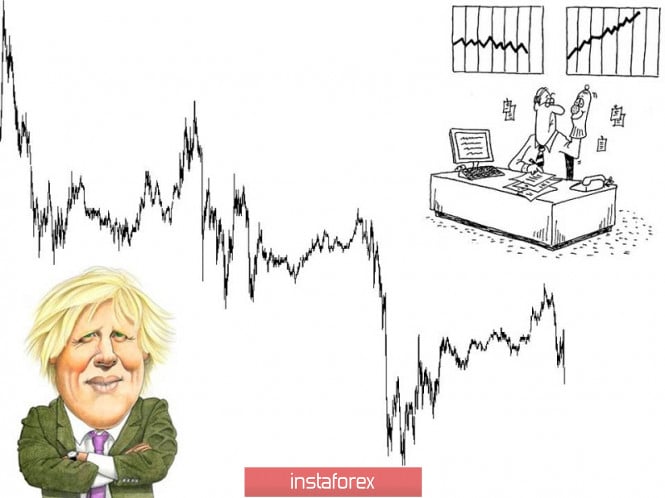
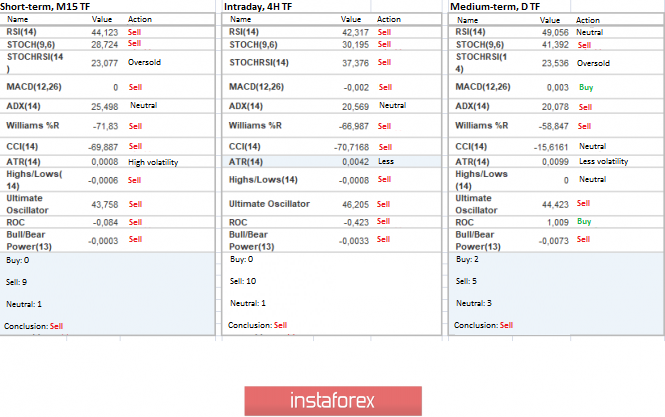
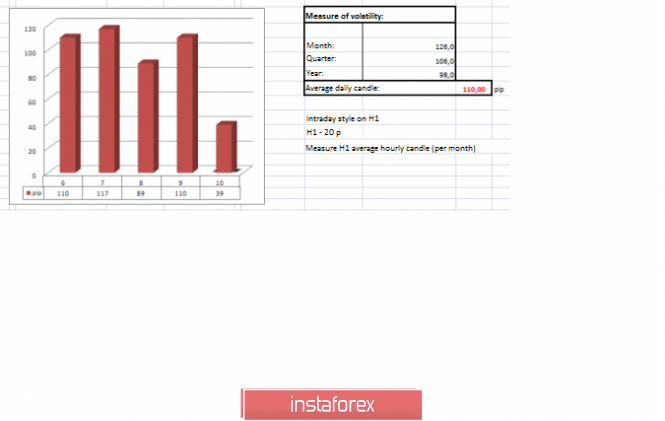
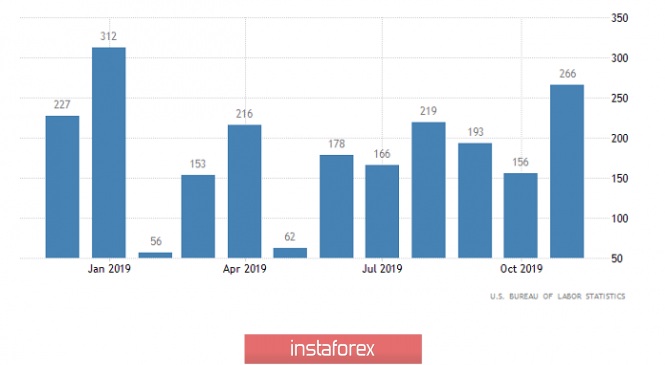
| Trading recommendations for GBPUSD for January 10, 2020 Posted: 10 Jan 2020 01:36 AM PST From a comprehensive analysis point of view, we see characteristic impulse candles that closely approach the quotes with a psychological level of 1.3000, but there was already a stop followed by a reverse move near the control value. In fact, half of the decline was already won back yesterday and local oversold, with the close proximity of a key level, played a role in the market. Theories of the future development of the pound differ among traders, some believe that the current swing, with an impressive rebound from historic lows, is a harbinger of a change in the key trend, and this is confirmed by the protracted process of maintaining the existing heights. However, other traders, believe that the situation in the United Kingdom does not bode well and problems in the economy are just beginning, In terms of volatility, we have a current-saving acceleration, which was set by the market at the end of last year. The emotional component of the market still has a high speculative operations ratio, which cannot be said about strategic participants who hold a waiting position. Parsing the past minute by minute, we see that the main leap in quotes occurred in the period 07:00 - 08:30 UTC [time on the trading terminal]. Then came the measured recovery process until the end of the day. As discussed in the previous review, speculators worked precisely on a pulsed path, where the entry was made at around 1.3079, and the first partial exit at 1.3053. The further process of retention of trading operations led speculators to the area of the psychological level of 1.3000, where, against the background of local oversold and disposable level, further positions were fixed. Considering the trading chart in general terms [the daily period], we see an upward trend in the structure of the global downward trend. At the same time, if we focus on the interval of the last month, then we will see not just a V-shaped oscillation, but a kind of stop, which has its limits and is characterized as lateral movement. The news background of the past day contains the data on applications for unemployment benefits in the United States, where they expected a total reduction of 34 thousand, and as a result received a rapid increase of 66 thousand [Primary: - 9 thousand; Repeat: 75+ thousand.] The reaction of the market to statistical data was not in favor of the American dollar, as a result of which we saw the growth of the pound on its general recovery. If we take a closer look at the trading chart [GBP/USD], we will see that before the statistics there was a significant weakening of the pound. So, the reason for the decline was in a number of factors that intertwined among themselves. The head of the Bank of England Mark finally hinted that in the near future the regulator will still lower the interest rate if weaknesses in the economy are noticed. At the same time, an article was published on the Bloomberg resource with a loud title regarding the strong decline in retail trade among the largest retailers, where they took the news in a negative tone without necessary details. The result of all the noise is already known to us, the time of the appearance of information almost up to a minute coincides with market leaps. In terms of the general informational background, we have news that the House of Commons of the British Parliament adopted in the third reading a bill on the country's withdrawal from the European Union, where 330 deputies voted in support of the bill while 231 voted against. The next step goes to the House of Lords, which should consider the bill, and after their approval, the document goes to the signing of Elizabeth II. In fact, the deal has already been approved, and the procedure is a formality. Today, in terms of the economic calendar, we have the publication of the report of the United States Department of Labor, where, according to preliminary expectations, there may be negative data. So, outside the agricultural sector, 165 thousand new jobs should be created in comparison with 266 thousand in the previous month according to forecasts. The unemployment rate could rise from 3.5% to 3.6%. The upcoming trading week in terms of the economic calendar is replete with statistical data, inflation indicators in the United States stand out most strongly, where they are expected to slow down. The most interesting events are displayed below: Monday, January 13 Great Britain 09:30 UTC - Volume of industrial production (YoY) (November): Prev -1.3% Tuesday, January 14 USA 13:30 UTC - Inflation: Prev 2.1% ---> Forecast 2.0% Wednesday, January 15 Great Britain 09:30 UTC - Inflation: Prev 1.5% ---> Forecast 1.4% USA 13:30 UTC - Producer Price Index (PPI) (YoY) (Dec): Prev 1.1% ---> Forecast 1.3% Thursday, January 16th USA 13:30 UTC - Retail sales (dec) USA 13:30 UTC - Applications for unemployment benefits Friday, January 17th United Kingdom 09:30 UTC - Retail sales (dec) USA 13:30 UTC - The number of issued building permits (Dec) USA 13:30 UTC - The volume of construction of new houses (Dec) USA 15:00 UTC - The number of open vacancies in the labor market JOLTS (Nov) Further development Analyzing the current trading chart, we see an attempt to return sellers to the market after a short corrective move. In fact, the past recovery movement in some way cooled overheated short positions, and sellers again try to send the quotes towards the psychological level of 1.3000, but can they do it if the statistics for the United States come out in bad tones. Thus, the assumption of local slowdown, with relatively wide boundaries, is considered for this situation as a real path of development. In terms of volatility, we see holding acceleration, which, of course, pleases speculators. By detailing the per-minute portion of time, we see that the main fluctuation occurred at the start of the European trading session. Now we have a few pulsing downward candles. In turn, speculators do not have time to calculate profits, as the past short positions, which have brought impressive income, are again considered as local operations until the release of statistical data on the United States. Having a general picture of actions, it is possible to say that a hypothetically downward movement may resume if the quotes manage to fix lower than 1.3050, otherwise there may be a chatter. Do not forget that the support in the face of the psychological level of 1.3000 is still maintained in the market and puts pressure on the quotes. Based on the above information, we derive trading recommendations as follows: - Buy positions are considered in case of price-fixing higher than 1.3100. - Sales positions are considered as local, if we do not have operations, then we can consider them lower than 1.3050. Indicator analysis Analyzing a different sector of timeframes (TF), we see that indicators' indicators still retain downward interest, despite the recent rollback. Volatility per week / Measurement of volatility: Month; Quarter; Year Measurement of volatility reflects the average daily fluctuation, calculated for the Month / Quarter / Year. (January 10 was built taking into account the time of publication of the article) The current time volatility is 39 points, which is still a low indicator, but not yet a downfall. It is likely to assume that the speculative mood, coupled with the news background, can still show itself, accelerating the quotes. Key levels Resistance zones: 1.3180 **; 1.3300 **; 1.3600; 1.3850; 1.4000 ***; 1.4350 **. Support Areas: 1,3000; 1.2885 *; 1.2770 **; 1.2700 *; 1.2620; 1.2580 *; 1.2500 **; 1.2350 **; 1.2205 (+/- 10p.) *; 1.2150 **; 1,2000 ***; 1.1700; 1.1475 **. * Periodic level ** Range Level *** Psychological level **** The article is built on the principle of conducting a transaction, with daily adjustment The material has been provided by InstaForex Company - www.instaforex.com |
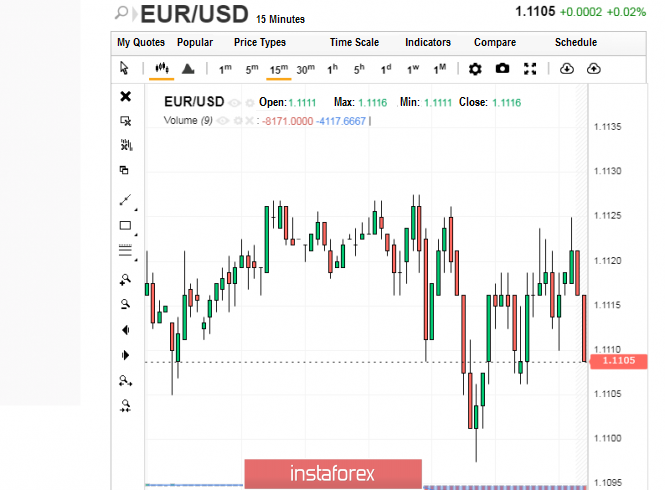
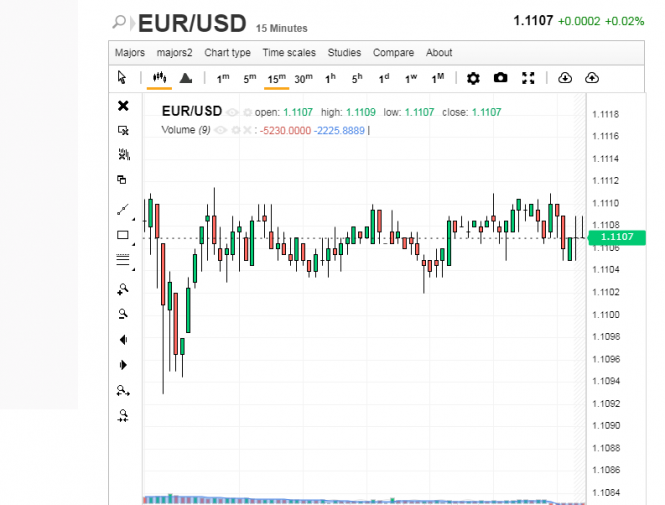
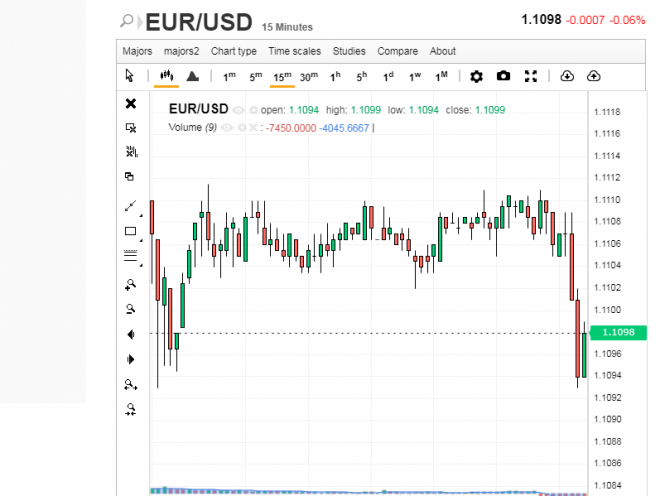
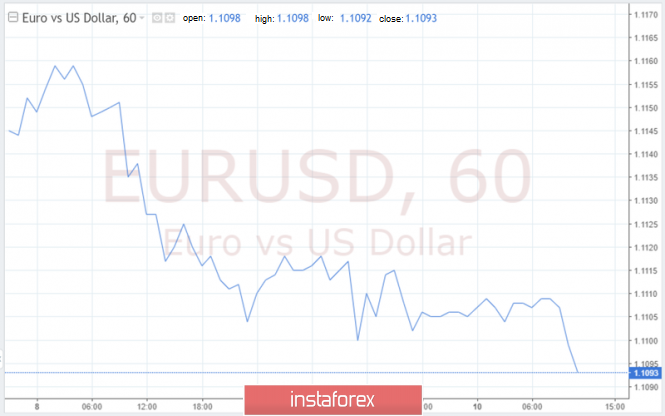
| EUR/USD is back on the path of financial war Posted: 10 Jan 2020 01:35 AM PST By the end of the week, the dynamics of the US and European currencies became a bit contradictory. Earlier, dollar actively grew, strengthening in the EUR / USD pair, whereas euro weakened. Now, however, analysts say that small losses have not spared the dollar. A number of geopolitical and economic factors have superimposed on the current weakening of euro and the strengthening dollar. These include both the military conflict between Iran and the United States, as well as the economic reports from the Euro zone and America. Be reminded that on Wednesday, January 8, the report of ADP Research Institute on the number of people employed in the private sector of the American economy in December was published. It was positive, showing an increase in the number of jobs by 202 thousand. The services sector occupied the palm, where growth reached to 173 thousand jobs, while in the manufacturing sector, it felt to 29 thousand. According to experts, the current data indicate the stability of the American labor market. Currently, the situation was not in favor of euro. The recovery of dollar after the release of positive reports on the labor market and activity in the service sector deprived euro of all advantages. Experts say that the strong data significantly reduced the possibility of additional monetary policy easing in the United States. According to recent forecasts, in December 2019, the American economy generated 160 thousand new jobs, excluding agriculture. The preliminary data also states that the unemployment rate in the country should not exceed 3.5%. However, experts have found a dark spot in the overall positive position of the dollar, which are the series of technical signals that indicate the looming weakness of the US currency. Analyzing the chart of the dollar index, experts noted that the 50-day moving average crossed the 200-day moving average. This situation was recorded in May 2017, and became the threshold of a five-month decline of the dollar. On Friday, January 10, the 21-day moving average crossed the 200-day line in the EUR / USD pair for the first time in 2.5 years. Analysts emphasize that previously, such intersections turned into a rapid rise of euro. At the moment though, euro is still under pressure from the negative macroeconomic factors. According to a report on German production orders, the country industrial sector is experiencing a long stagnation. In December, the volume of industrial orders in Germany decreased by 6.5%. Earlier, experts also recorded a gradual reduction in production. Analysts fear that the current difficulties in German industry will turn into problems for the GDP of the entire Eurozone. The report on the unemployment rate in the Euroblock countries published on Thursday, January 9 is a spoonful of honey in a barrel of tar for the euro. This indicator, which grew to 7.6%, was better than forecasts. According to the report, the unemployment rate remained the same in November last year which is 7.5%, and the number of people who lost their jobs decreased by 10 thousand. The current situation was in the hands of the bears. Experts have recorded a long "bearish" market sentiment in relation to EUR / USD. The tandem was under pressure from sellers for six sessions in a row. At the same time, euro strongly resisted the transition of a downward trend, but its efforts were not successful. According to analysts, it was the bears that pushed the currency to the support level of 1.1100. Experts consider this level to be the key one - a kind of pivot point for the EUR / USD pair. It was here that the decisive battle was played out the other day: the "bulls" rebuffed the "bears". There is now, however, a lull in the dynamics of the EUR / USD pair. A day earlier, the tandem's quotes sank to 1.1105, having experienced a series of ups and downs. On the morning of Friday, January 10, the EUR / USD pair was still marking time, slightly rising to 1.1107. Experts believe that in the near future, the tandem will enter a downward spiral. Later on, these assumptions were confirmed and the EUR / USD pair started to slide down to the low levels of 1.1097–1.1098, falling in an effort to find the bottom from time to time. According to experts, the situation of the EUR / USD pair is at the moment, developing in favor of the dollar. It is confident, despite some mistakes, and intends to move on to new heights. Dollar is supported by a strong US economy, whereas the Eurozone's economy is sagging. This knocks the ground out from under euro's feet, shaking the position of the currency. In general, the EUR / USD pair is trying not to lose stability, adequately accepting the challenges of the market. The material has been provided by InstaForex Company - www.instaforex.com |
| Will dollar support the first NFP report this year? Posted: 10 Jan 2020 01:27 AM PST In recent days, the US currency has appreciably strengthened. The USD index reached local highs at 97.50. The dollar can demonstrate the best weekly dynamics for the last two months, if the report on the US labor market for December does not disappoint. The intensification of geopolitical tensions in the Middle East, positive statistical data on the United States, as well as doubts about the expansion of the differential growth of world and US GDP allowed the bears to lower the quotes of EUR / USD below the base of the 11th figure. Should sellers expect a continuation of the banquet? The American employment which was released in December will help answer this question. Arguments in favor of a strong report:
Arguments in favor of a weak report:
According to analysts, US unemployment remained at the previous month's level of 3.5% in December, while the number of jobs in the non-agricultural sector of the economy increased by 164 thousand after rising 266 thousand a month earlier. On the other hand, uncertainty around the US-Celestial War, escalation of tensions in the Middle East, presidential elections in the United States and sluggish dynamics in global demand can lead to a reduction in corporate investment, which will negatively affect the labor market. However, this will be later, but for now, representatives of the Federal Reserve express confidence in the strength of the American economy and argue that monetary policy is in the right place and no interest rate changes are needed in 2020. Not only the centrist, vice chairman of the Fed Richard Clarida, but also the "dovish", the heads of the Federal Reserve Bank of St. Louis and the Federal Reserve Bank of Minneapolis James Bullard and Neel Kashkari adhere to the same point of view. Thus, the strength of the American economy and the confidence of Fed officials in its bright future allow the greenback to stand firmly on its feet. In the case of the release of positive data on the US labor market for December, the risks of falling EUR / USD to 1.1055–1.1070 will increase, while weak statistics will contribute to consolidation in the range of 1.1100–1.1180. The material has been provided by InstaForex Company - www.instaforex.com |
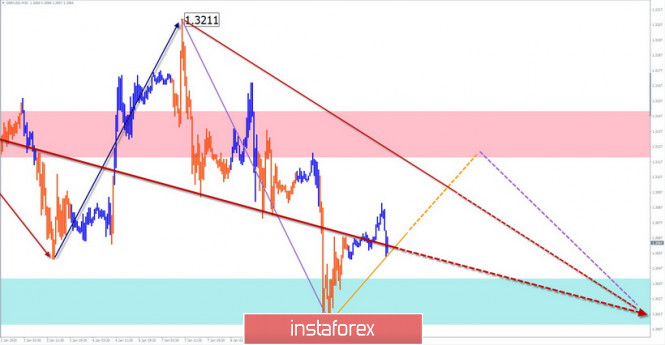
| Simplified wave analysis of GBP/USD and USD/JPY on January 10 Posted: 10 Jan 2020 01:23 AM PST GBP/USD Analysis: The main wave of the British pound has been developing a downward wave since December 13. Given the potential of the first part of the movement, the wave can become a correction of the entire main wave. At the beginning of this year, the final part (C) started. Since yesterday, it has been forming a bullish pullback. Forecast: Over the next day, the general upward mood of the movement is expected, until its completion in the area of calculated resistance. A short-term decline is possible in the next session. Potential reversal zones Resistance: - 1.3120/1.3150 Support: - 1.3040/1.3010 Recommendations: Today, for supporters of intra-session trading, it is possible to buy the pound with a reduced lot. The most reasonable tactic for today is to refrain from entering the pair's market during the pullback. In the area of the resistance zone, it is recommended to track the pair's sell signals.
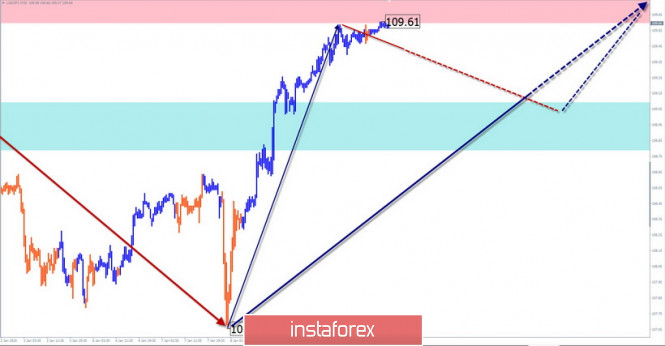
USD/JPY Analysis: In the dominant upward wave of the Japanese yen for the last six months, the corrective part of the movement (B) ended 2 days ago. The price rise from January 8 showed a high potential for the beginning of an upward movement. The price achieved a strong resistance to the older TF. Forecast: A price correction is expected in the next sessions. The most likely character of the movement will be "sideways" along the lower borders of the resistance zone. The option of a short-term decline to the support zone is not excluded. The resumption of price growth is expected at the end of the day or the beginning of the next trading week. Potential reversal zones Resistance: - 109.60/109.90 Support: - 109.10/108.80 Recommendations: Selling a pair can be very risky. It is wiser to refrain from entering the market until the end of the upcoming decline and try to enter long positions at the end of it.
Explanations: In the simplified wave analysis (UVA), waves consist of 3 parts (A-B-C). The last incomplete wave is analyzed. The solid background of the arrows shows the formed structure and the dotted background shows the expected movements. Attention: The wave algorithm does not take into account the duration of the tool movements in time! The material has been provided by InstaForex Company - www.instaforex.com |
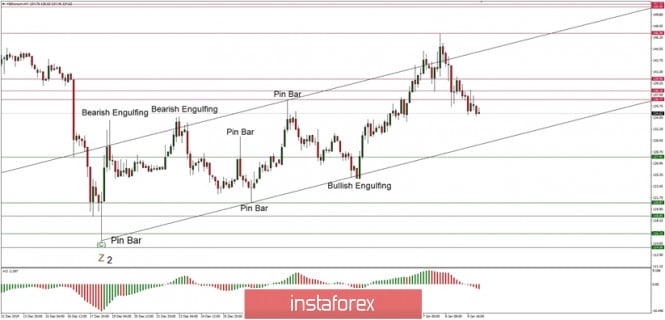
| Technical analysis of ETH/USD for 10/01/2020: Posted: 10 Jan 2020 01:22 AM PST Crypto Industry News: According to a press release from January 8, Interpol began working with the cybersecurity company Trend Micro to reduce cryptojacking affecting MikroTik routers in Southeast Asia. Although collaboration has reduced the number of devices affected by the problem by 78 percent, it is unlikely to have a significant impact on the hash rate. Cryptojacking is a malicious practice in which attackers infect popular devices with cryptocurrency mining software using the victim's computational resources to extract them. Trend Micro works with Interpol's Global Complex for Innovation to disinfect malware-infected MikroTik routers. As part of Operation Goldfish Alpha, Trend Micro has developed a document with guidelines on "Limiting and preventing cryptojacking" describing how a vulnerability affecting the known brand of home and corporate routers has infected thousands of devices in the ASEAN region. The document also suggests how victims can use Trend Micro to detect and eliminate malware. Within five months of creating the document in June 2019, experts from national computer failure teams and police have helped identify and restore more than 20,000 affected routers, reducing the number of infected devices in the region by 78 percent. Technical Market Overview: The recent move up on ETH/USD might be the beginning of a new impulsive wave up since the corrective cycle had been terminated at the level of $116.15 in form of a Pin Bar candlestick pattern, but so far the bullish rally has been terminated at the level of $145.94. Since then the market has retraced more than 50% of the wave up and the last local low was made at the level of $134.18. The next target for bears is seen at the level of 61% Fibonacci retracement located at $133.13. There is still a chance for the rally to continue, but the level of $124.42 can not be violated before any new swing high is made. Weekly Pivot Points: WR3 - $152.72 WR2 - $144.64 WR1 - $140.53 Weekly Pivot - $132.09 WS1 - $127.41 WS2 - $119.97 WS3 - $115.08 Trading Recommendations: The best strategy in the current market conditions is to trade with the larger timeframe trend, which is down. All the shorter timeframe moves are still being treated as a counter-trend correction inside of the downtrend. When the wave 2 corrective cycles are completed, the market might will ready for another wave up.
|
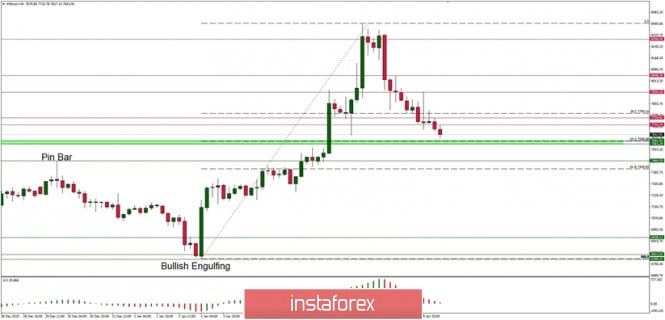
| Technical analysis of BTC/USD for 10/01/2020: Posted: 10 Jan 2020 01:18 AM PST Crypto Industry News: To address the aftermath of fires in Australia, the Binance Charity Foundation (BCF) donates $ 1 million BNB tokens to the Australia Bushfire Donations project. In a BCF blog post - the philanthropic branch of the Binance cryptocurrency exchange - announced the launch of a new charity project called Australia Bushfire Donations, to which BCF donates $ 1 million in the native Binance Coins exchange. The funds raised under the project will be used to mitigate the destructive impact of fires across the continent. As Australian fire donations are a Blockchain-based initiative, there is an assurance that all BNB donations and distribution will be verifiable to anyone. The BCF says it intends to reach as many local organizations as possible to donate received. Binance CEO Changpeng Zhao called on the cryptographic community to support Australia, which is fighting forest fires - which have hit the south-east of the country most. Since October last year, over 20 people have been killed and nearly 2,000 homes have been destroyed. In the first week of January, more than 8.4 million hectares burned throughout the country. Technical Market Overview: The BTC/USD rally has been capped around 50% Fibonacci retracement located at the level of $8,320 and since then the bears have took temporary control of the market. They have managed to move the price towards the key technical support located at the level of $7,581 - $7,601. As long as this level is not clearly violated, the whole move down will be considered as short-term counter-trend corrective move only. The weekly timeframe trend remains down and there are no signals of any trend reversal just yet. Weekly Pivot Points: WR3 - $8,248 WR2 - $7,819 WR1 - $7,642 Weekly Pivot - $7,179 WS1 - $6,988 WS2 - $6,550 WS3 - $6,318 Trading Recommendations: The best strategy in the current market conditions is to trade with the larger timeframe trend, which is still down. All the shorter timeframe moves are still being treated as a counter-trend correction inside of the uptrend. When the wave 2 corrective cycles are completed, the market might will ready for another impulsive wave up of a higher degree and uptrend continuation.
|
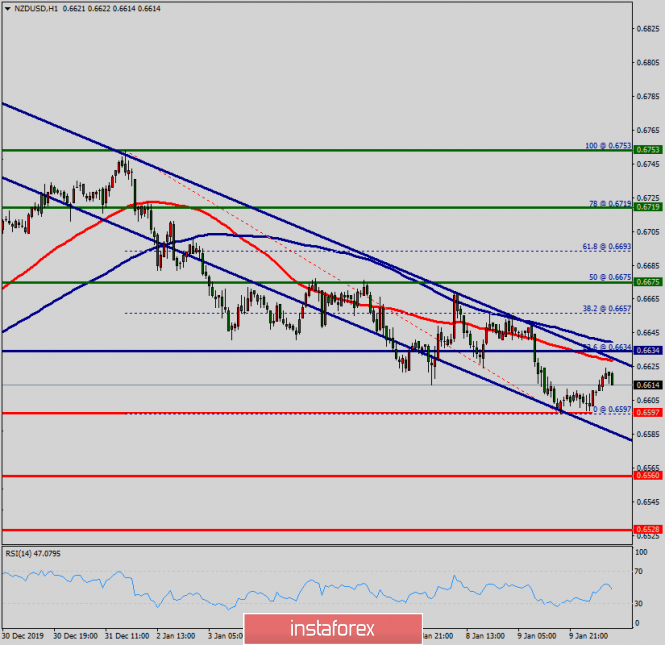
| Technical analysis of NZD/USD for January 10, 2020 Posted: 10 Jan 2020 01:16 AM PST Overview: Pair: NZD/USD. Pivot: 0.6634. The market opened below the weekly pivot point. It continued to move downwards from the level of 0.6634 to the bottom around 0.6597. Today, the first resistance level is seen at 0.6675 followed by 0.6719, while daily support 1 is seen at 0.6560. The NZD/USD pair broke support which turned to strong resistance at 0.6675. Right now, the pair is trading below this level. It is likely to trade in a lower range as long as it remains below the support (0.6675) which is expected to act as major support this present day. This would suggest a bearish market because the moving average (100) is still in a negative area and does not show any signs of a trend reversal at the moment. Amid the previous events, the ND/USD pair is still moving between the levels of 0.6634 and 0.6560, so we expect a range of 75 pips in coming hours. Therefore, the minor resistance can be found at 0.6634 providing a clear signal to sell with a target seen at 0.6560. If the trend breaks the minor support at 0.6560, the pair will move downwards continuing the bearish trend development to the level of 0.6528 in order to test the daily support 2. Overall, we still prefer the bearish scenario which suggests that the pair will stay below the zone of 0.6634 /0.6675 today. The material has been provided by InstaForex Company - www.instaforex.com |
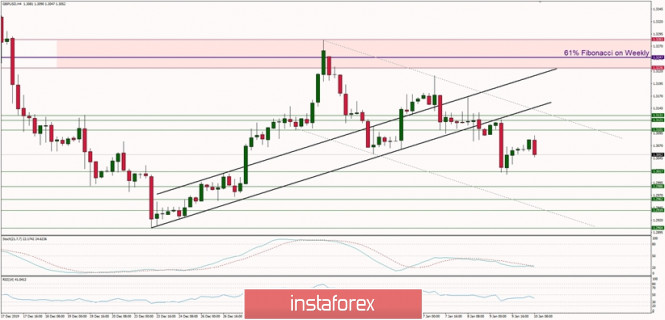
| Technical analysis of GBP/USD for 10/01/2020: Posted: 10 Jan 2020 01:12 AM PST Technical Market Overview: The GBP/USD pair has been testing the lower channel line from below and failed to move above it. In this situation, the bears have taken control of the market and push the price towards the level of 1.3017 as anticipated. This is the local technical support level and might be broken with ease. On the other hand, in order to continue the move higher, the bulls must break through the level of 1.3171. The momentum has changed from neutral to negative, so the odds for another move up are low. The target for bears is seen at the level of 1.2988 and 1.2962. Weekly Pivot Points: WR3 - 1.3419 WR2 - 1.3347 WR1 - 1.3185 Weekly Pivot - 1.3120 WS1 - 1.2957 WS2 - 1.2894 WS3 - 1.2801 Trading Recommendations: The best strategy for current market conditions is to trade with the larger timeframe trend, which is up. All downward moves will be treated as local corrections in the uptrend. In order to reverse the trend from up to down, the key level for bulls is seen at 1.2756 and it must be clearly violated. The key long-term technical support is seen at the level of 1.2231 - 1.2224 and the key long-term technical resistance is located at the level of 1.3509.
|
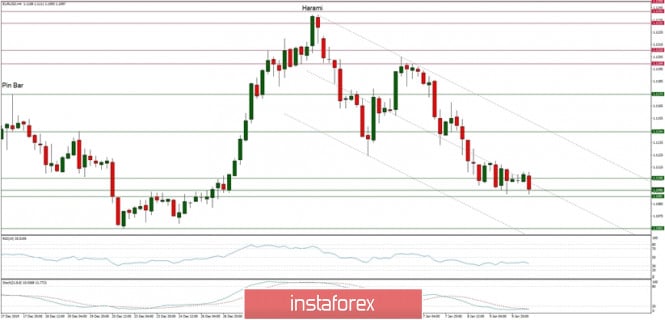
| Technical analysis of EUR/USD for 10/01/2020: Posted: 10 Jan 2020 01:01 AM PST Technical Market Overview: As anticipated yesterday, the EUR/USD pair has made a fresh new local low on its way down at the level of 1.1093 and the price is moving up and down in a narrow zone between the levels of 1.1093 - 1.1117 as the traders wait for move continuation. This is a very important technical support zone so any breakout lower will only extend the sell-off towards the level of 1.1065. The larger timeframe trend remains down, so the pressure for bears intensifies. Weekly Pivot Points: WR3 - 1.1326 WR2 - 1.1283 WR1 - 1.1212 Weekly Pivot - 1.1166 WS1 - 1.1101 WS2 - 1.1048 WS3 - 1.0979 Trading Recommendations: The best strategy for current market conditions is to trade with the larger timeframe trend, which is down. All upward moves will be treated as local corrections in the downtrend. The downtrend is valid as long as it is terminated or the level of 1.1445 clearly violated. There is an Ending Diagonal price pattern visible on the larget timeframes that indicate a possible downtrend termination soon. The key short-term levels are technical support at the level of 1.1040 and the technical resistance at the level of 1.1267.
|
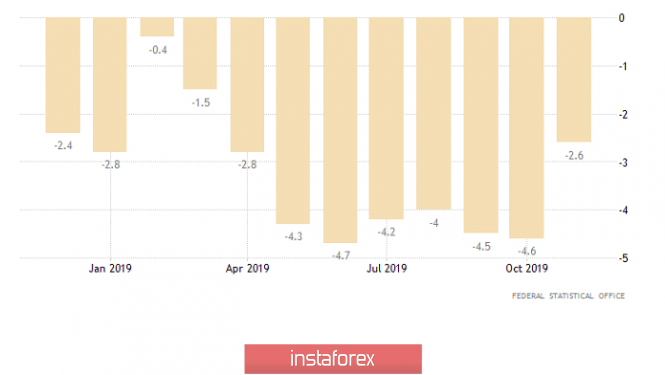
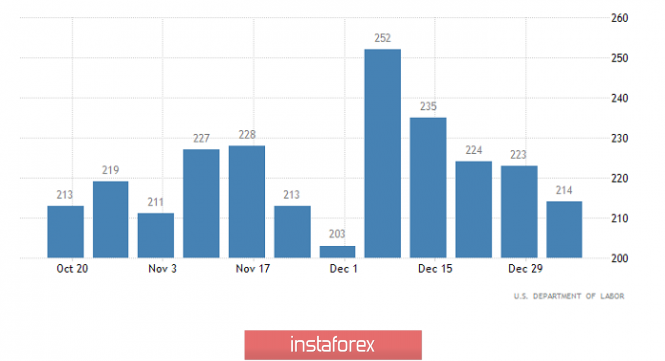
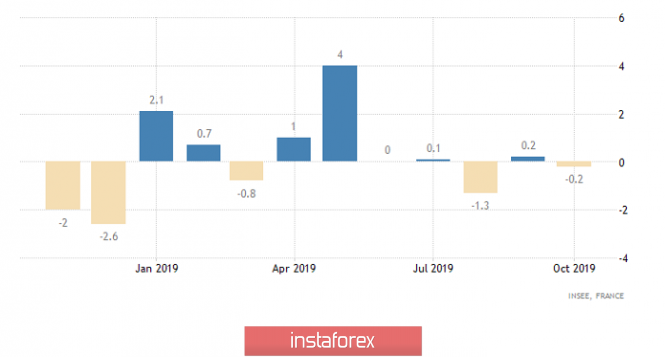
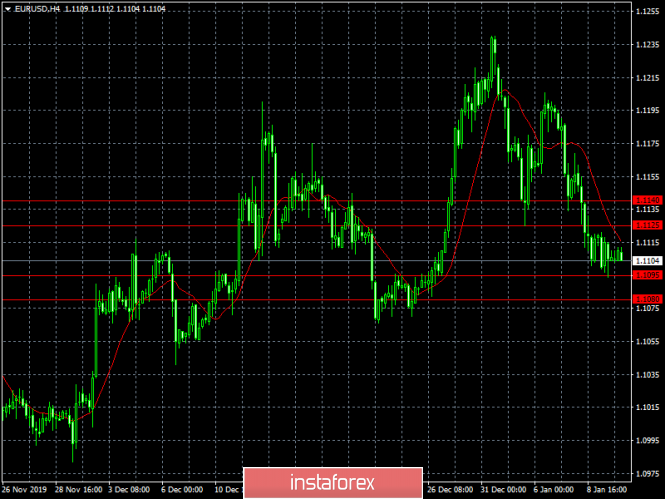
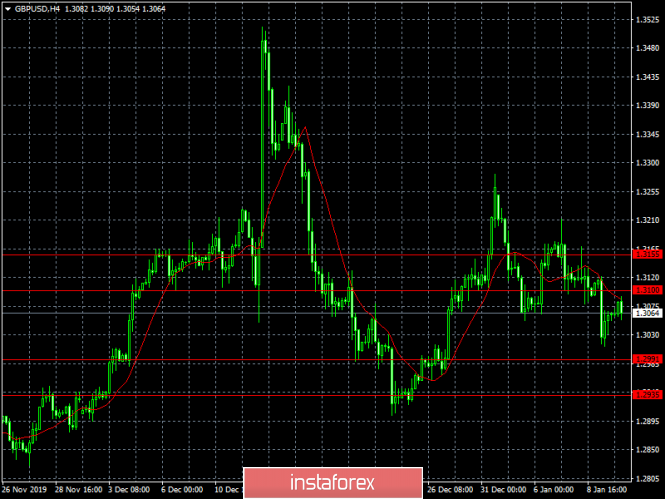
| Reading headlines (Overview of EUR/USD and GBP/USD on 01/10/2020) Posted: 10 Jan 2020 12:53 AM PST It always seemed that we live in a world of triumphant universal education.Not all over the world, but at least in most countries of the world. And certainly in the richest countries of the world there should simply be general literacy, and every second one has a university diploma in his pocket. But looking at what periodically happens in the markets, you lose faith not only in universal school education, but also in humanity as a whole. It feels like people have mastered the letters, and even able to put them into words. However, there is a feeling that all market participants skipped literature lessons, where they were told not only how letters form words, but also what these words mean and how the name of the work reflects its essence. After all, in the mass media of agitation and misinformation, headlines appeared about that the UK's largest retailers showed the worst Christmas sales results ever, as investors began to get rid of the pound in panic. This clearly demonstrates that investors do not read further than the headlines, because it is said that the reason for such sad results lies in the increase in sales through online services and stores in all these publications. That is, sales themselves do not decrease, people just go purchasing less, preferring to order everything with home delivery. Therefore, if there is universal education in the world, then it either passed the market participants, or they teach something else in schools. However, after some time, it began to reach some that something was wrong, and they tried to explain everything with a statement by Mark Carney. Like, preparing for his resignation, the head of the Bank of England predicted the British economy the dire consequences of Brexit. But, in this case, it is even worse, because it is not only about the fact that market participants do not read the headlines, but they also have the memory of aquarium fish. Firstly, Mark Carney has been saying this with enviable regularity from the very moment that the results of the referendum on the Brexit issue became known, that is, there is nothing new in this. And this is not the worst, since at one time he generally spoke about the pound parity with the dollar. Secondly, if you read the text of his speech, it becomes clear that it is actually somewhat more about the other. More precisely, about something else in general. It represents an ode to the merits of the Bank of England over the past twenty years and the words about the consequences of Brexit were sounded only as an answer to questions. And then, as already mentioned above, he did not say anything new. Meanwhile, the single European currency ignored European macroeconomic statistics. Apparently, investors are not able to move without a "kick-in-the-ass" in the form of high-profile headlines in the media of agitation and misinformation. However, the data on Germany, which by chance is the largest economy in Europe, can cause only sadness and gloom. Exports declined by 2.3% and imports by 0.5%. Thus, it is not surprising that the trade surplus is steadily moving towards the deficit thereof. Still, the negativity was somewhat smoothed by data on industrial production, the decline of which slowed down from -4.6% to -2.6%. Another thing is that we are still talking about a recession lasting more than a year. And although the pace of decline has slowed, this does not change the overall picture. There were also published data on the unemployment rate in Italy and throughout Europe as a whole. In both cases, unemployment remained unchanged, although it was expected to fall in Italy from 9.7% to 9.5%. Industrial production (Germany): Nevertheless, justice had triumphed and the pound had returned by the evening, and the single European currency, not having time to fall in price, realized that it did not need it. In turn, investors were seriously surprised, or rather scared, by the data on applications for unemployment benefits in the United States. Of course, the number of initial applications for unemployment benefits fell not by 4 thousand, but by 9 thousand. The only trouble is that the number of repeated applications for unemployment benefits, which should have been reduced by 31 thousand, increased by 75 thousand. more frighteningly, all this is in anticipation of the publication of a report by the United States Department of Labor. Initial Jobless Claims (United States): Curiously, the incredibly weak unemployment claim data did not cause a revision of forecasts regarding the contents of the report of the United States Department of Labor. Thus, it is expected that 165 thousand new jobs were created outside agriculture, compared to 266 thousand in the previous month. From this alone, investors should already have hair on their heads standing up, but the data on the unemployment rate, which should grow from 3.5% to 3.6%, will become an additional reason for panic. And it is clear that no one will look at the fact that the increase in unemployment should occur due to an increase in the share of labor in the total population from 63.2% to 63.3%. We do not forget that there is a high probability that the data will turn out to be worse than forecasts. The number of new jobs created outside of agriculture (United States): At the same time, investors are only waiting for the report of the United States Department of Labor, as they generally ignored industrial production data for a number of European countries. In France, in particular, the second eurozone economy, industrial production growth of 0.2% gave way to a decline of 0.2%. But in Spain, that is, the fourth economy of the euro area, the opposite is true, since the decline in industrial production by 1.3%, which was supposed to increase to -1.8%, unexpectedly gave way to a growth of 2.1%. However, Spain is clearly not as significant as France. In addition, in Italy, and this is the third eurozone economy, a slowdown in the decline in industrial production is expected from -2.4% to -0.4%. Industrial Production (France): Therefore, we should expect a single European currency to increase to 1.1150, given the negative outlook on the contents of the report of the United States Department of Labor as well as the high probability that the data may turn out even worse. Exactly for the same reasons, the pound can grow to 1.3150. Just for a pound, the level of nervousness is significantly higher due to the ongoing fuss around Brexit and the prospects for the British economy. |
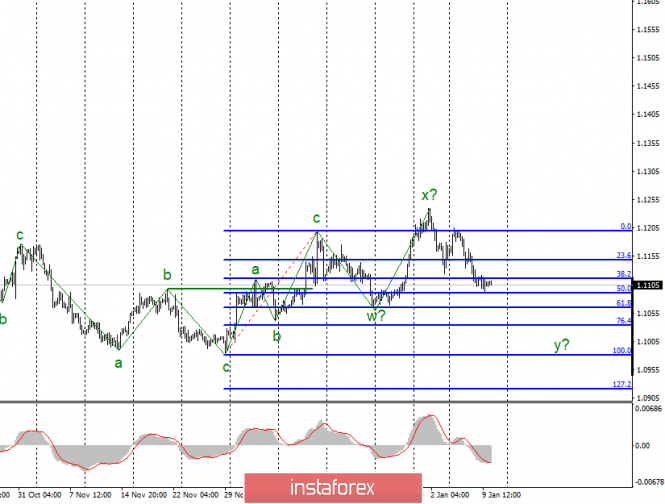
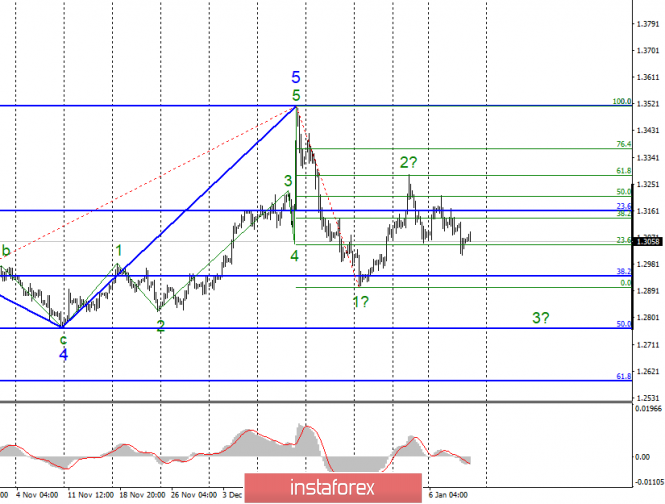
| Analysis of EUR/USD and GBP/USD for January 10. Bad news for the pound while good news for the euro Posted: 10 Jan 2020 12:43 AM PST EUR / USD On January 9, the EUR / USD pair did not lose or gain a single basis point. Thus, the instrument continues to remain within the framework of constructing the alleged downward wave y. If this assumption is true, then the decline in quotes will continue with targets located around the 10th figure. On the contrary, an unsuccessful attempt to break through the 50.0% Fibonacci mark led to quotes moving away from the lows reached. However, I do not believe that the downward wave has completed its construction. Fundamental component: The news background for the euro-dollar instrument was rather weak on Thursday. Mostly, only one economic report really deserved attention. The change in industrial production in Germany in November was interesting not only in itself, but also in terms of determining the indicator of production in the European Union. Moreover, production in Germany exceeded expectations which is unexpected for the currency exchange market, but still turned out to be negative. Compared to November 2018, the decrease was 2.6%. Thus, the fact of exceeding the forecast was not noted by the markets, and the euro remained in a downward direction. Today, there will be much more important news, and all of them will be released in America. In the first place in importance, of course, is the Nonfarm Payrolls, which will show how many jobs were created in the non-agricultural sector in December. From which, market expectations range from 150K to 165K. Thus, the dynamics of the instrument on Friday depends on whether the forecast is exceeded. The salary report for December will also be interesting, but markets will pay more attention to the report on Nonfarms. In case of strong data from America, the US dollar will receive support for the currency exchange market this afternoon and will be able to continue to build a downward wave y. General conclusions and recommendations: The euro-dollar pair allegedly completed the construction of the upward trend section. Thus, I would recommend continuing to sell the instrument with targets located around the levels of 1.1034 and 1.0982, which corresponds to 76.4% and 100.0% Fibonacci, since there is now a high probability of building a bearish wave. And perhaps, new sales of the instrument are best done after the new MACD signal "down". GBP / USD On January 9, GBP / USD pair lost another 30 basis points. However, the construction of the bearish wave 3 continues, and even if the entire trend section beginning on December 13, acquires a 3-waveform, the instrument should still decline below the expected first wave of this trend section. That is, below the level of 1.2890, which corresponds to 0.0% on the green grid of Fibonacci levels. Thus, I expect the resumption of the decline in quotes of the pound / dollar instrument. Fundamental component: There was no news background for the GBP / USD instrument on Thursday, but it was absent only at first glance. On the other hand, speech by Mark Carney, Chairman of the Bank of England, stirred up the markets and in the morning, the pound lost about 90 basis points. By the end of the day, it won back most of the losses, but still. Mark Carney said that the Bank of England could lower the key rate, and this greatly upset buyers of the British pound. The markets have been waiting for such a statement from Carney for a long time. In turn, economic reports coming from the UK are upsetting and disappointing one by one. The Central Bank would have to intervene sooner or later and it seems that it is approaching this time. Mark Carney also said that other monetary policy instruments could be applied to stabilize the economic situation. General conclusions and recommendations: The pound / dollar instrument continues to build a new downward trend. Thus, I recommend continuing to sell the instrument with targets near 1.2764, which corresponds to the Fibonacci level of 50.0%. Meanwhile, a new MACD signal "down" may indicate the next wave of sales of the instrument. Thus, I recommend placing Stop Loss orders above 1.3206. The material has been provided by InstaForex Company - www.instaforex.com |
| You are subscribed to email updates from Forex analysis review. To stop receiving these emails, you may unsubscribe now. | Email delivery powered by Google |
| Google, 1600 Amphitheatre Parkway, Mountain View, CA 94043, United States | |






No comments:
Post a Comment