
Forex analysis review |
- Forecast for USD/JPY on January 16, 2020
- Fractal analysis for major currency pairs on January 16
- Soaring on a scandal: the Swiss franc has reached heights
- Gold has come to life
- What did Putin say on his speech at the Federal Assembly on January 15?
- GBP/USD. January 15. Results of the day. Boris Johnson officially refused to allow Scotland to hold a second independence
- EUR/USD: weak PPI report, rumors around the deal, and dollar's overall vulnerability
- EUR/USD. January 15. Results of the day. Euro is growing amid signing trade deal between US and China
- GBP/USD: Bank of England seems tired of doing nothing, so the pound is not bored now
- What to watch out for Bitcoin? Will it rise?
- EUR/USD. January 15. We are waiting for the consolidation at 1.1109 to return the pair to a downward direction
- GBP/USD. January 15. The last chance for the pair to fall to the level of 1.2900
- BTC analysis for 01.15.2020 - Watch for potential downside on the BTC due to overbought condition
- EUR/USD for January 15,2020 - Potetnial completion of the ABC upside corection, watch for downside opportunities...
- Gold 01.15.2020 - Broken rising wedge pattern, watch for selling opportunities...
- Bitcoin at the first resistance! Long or Short? 15/01/2020
- Evening review for EURUSD for 01/15/2020. A new attempt at growth
- Technical analysis of GBP/USD for January 15, 2020
- Can We Still Buy USDJPY? 15.01.2020
- January 15, 2020 : EUR/USD is demonstrating negative divergence while approaching Intraday Keylevel around 1.1140.
- January 15, 2020 : GBP/USD Intraday technical analysis and trade recommendations.
- Gold's wings has been clipped. It can not go far on geopolitics alone.
- Technical analysis recommendations for EUR/USD and GBP/USD on January 15
- Euro is at a crossroads: between falling and rising
- Analysis of EUR/USD and GBP/USD for January 15. UK Inflation: reason for new sales of the pound?
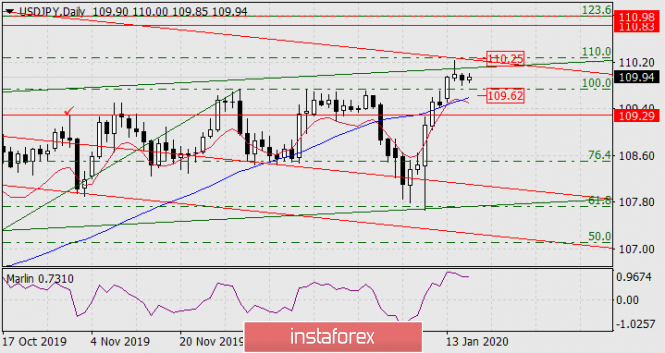
| Forecast for USD/JPY on January 16, 2020 Posted: 15 Jan 2020 06:42 PM PST USD / JPY The dollar against the yen suspended growth in front of the strong linear resistance of the price channels - upward (green) and downward (red). The price is supported by the MACD presented in a blue moving line at a price of 109.62. Yesterday the S&P500 grew 0.19%, and today Nikkei225 is adding only 0.08%, if the stock market does not rise in today's retail sales data then the correction may go deeper into this line. In general, potential growth remains. Overcoming the red price channel line at 110.25 opens the way for the price to the target range 110.83 / 98, to the Fibonacci level of 123.6%.
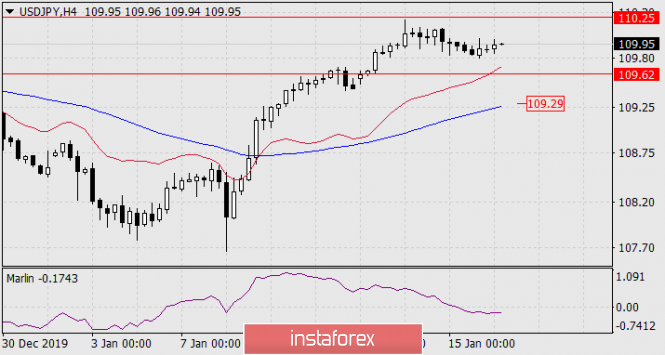
On the four-hour chart, the growing potential looks strong. The price is above the lines of balance and MACD, the Marlin oscillator is in the decline zone, but can easily go into the growth zone. Weak divergence may already be worked out.
The critical level that unfolds the trend is 109.29, which is October 30's maximum and the MACD line of a four-hour scale is located at the same level. The material has been provided by InstaForex Company - www.instaforex.com |
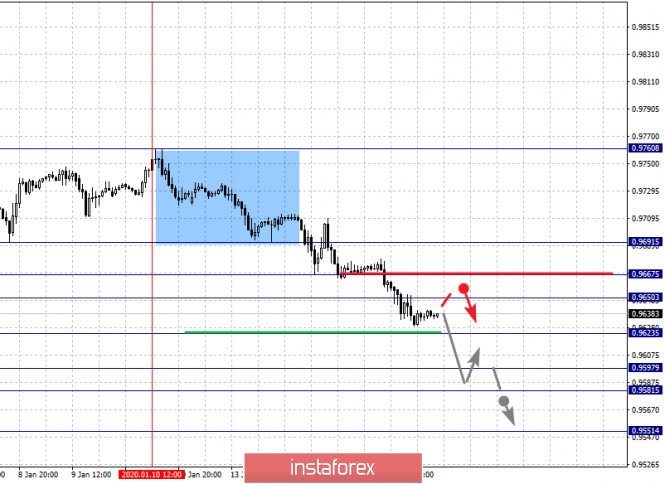
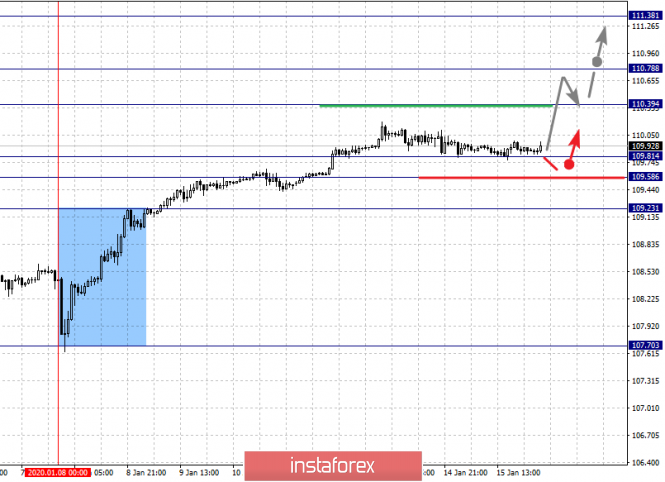
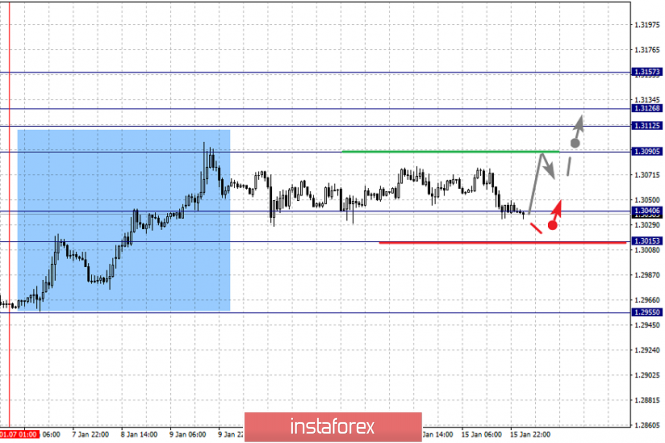
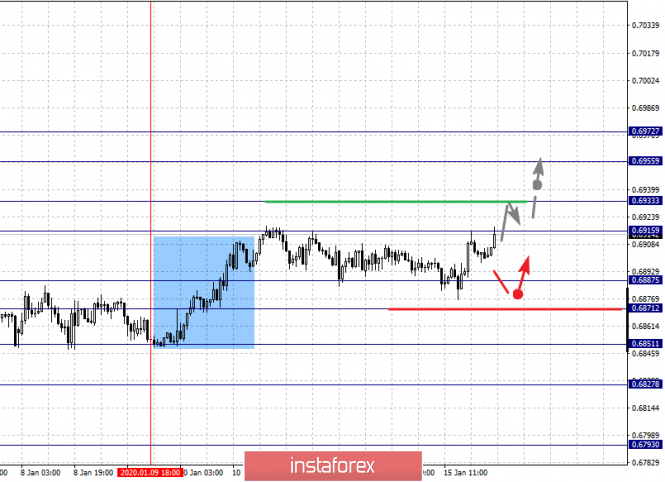
| Fractal analysis for major currency pairs on January 16 Posted: 15 Jan 2020 06:33 PM PST Forecast for January 16: Analytical review of currency pairs on the scale of H1:
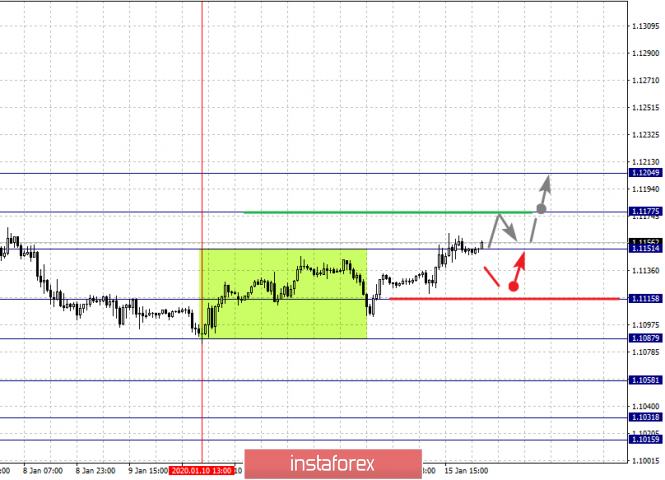
For the euro / dollar pair, the key levels on the H1 scale are: 1.1204, 1.1177, 1.1151, 1.1115, 1.1087, 1.1058, 1.1031 and 1.1015. Here, the price is close to the cancellation of the downward structure from January 6, for which we expect a breakdown of the level of 1.1177. In this case, the first potential target is 1.1204, while we expect a short-term upward movement, as well as consolidation in the range 1.1151 - 1.1177. The continuation of the movement to the bottom is possibly after the breakdown of the level of 1.1115. Here, the first goal is 1.1087. The breakdown of which will allow counting on the movement to 1.1058. Price consolidation is near this level. The breakdown of the level of 1.1056 will lead to movement to a potential target - 1.1015. Price consolidation is in the range of 1.1015 - 1.1031, and from here, The main trend is the local descending structure of January 6, the potential for the top of January 10 Trading recommendations: Buy: 1.1153 Take profit: 1.1175 Buy: 1.1178 Take profit: 1.1204 Sell: 1.1058 Take profit: 1.1090 Sell: 1.1085 Take profit: 1.1060
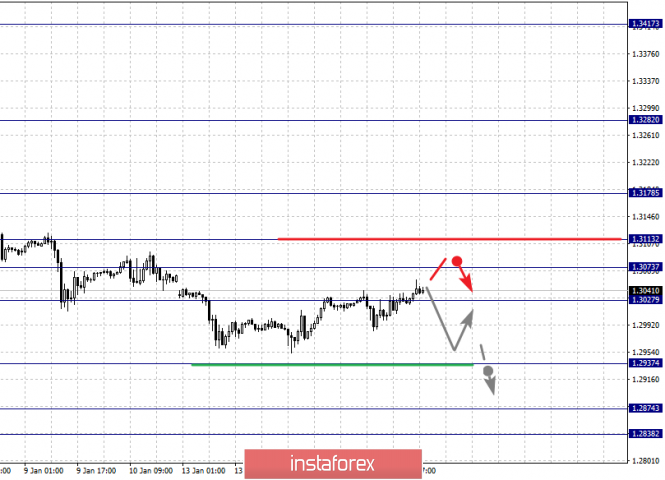
For the pound / dollar pair, the key levels on the H1 scale are: 1.3113, 1.3073, 1.3027, 1.2937, 1.2874 and 1.2838. Here, the price is in correction from the downward structure on December 31. The continuation of movement to the bottom is expected after the breakdown of the level of 1.2937. In this case, the target is 1.2874. For the potential value for the bottom, we consider the level of 1.2838. Upon reaching this level, we expect consolidation, as well as a rollback to the top. Short-term upward movement, as well as consolidation, are expected in the range 1.3027 - 1.3073. The breakdown of the latter value will lead to an in-depth correction. Here, the goal is 1.3113. This level is a key support for the bottom, its passage through the price will have the formation of initial conditions for the upward cycle. Here, the potential target is 1.3178. The main trend is the descending structure of December 31, the correction stage Trading recommendations: Buy: 1.3027 Take profit: 1.3073 Buy: 1.3074 Take profit: 1.3113 Sell: 1.2935 Take profit: 1.2875 Sell: 1.2872 Take profit: 1.2838
For the dollar / franc pair, the key levels on the H1 scale are: 0.9691, 0.9667, 0.9650, 0.9623, 0.9597, 0.9581 and 0.9551. Here, we are following the development of the downward cycle of January 10. The continuation of the movement to the bottom is expected after the breakdown of the level of 0.9623. In this case, the target is 0.9597. Price consolidation is in the range of 0.9597 - 0.9581. For the potential value for the bottom, we consider the level of 0.9551. Upon reaching which, we expect a pullback to the top. Short-term upward movement is possibly in the range of 0.9650 - 0.9667. The breakdown of the latter value will lead to an in-depth correction. Here, the target is 0.9691. This level is a key support for the bottom. The main trend is the initial conditions for the bottom of January 10 Trading recommendations: Buy: 0.9650 Take profit: 0.9665 Buy: 0.9668 Take profit: 0.9690 Sell: 0.9621 Take profit: 0.9598 Sell: 0.9580 Take profit: 0.9551
For the dollar / yen pair, the key levels on the scale are: 111.38, 110.78, 110.39, 109.81, 109.58 and 109.23. Here, we are following the development of the upward cycle of January 8. At the moment, we expect a movement to the level of 110.39. The breakdown of which will allow us to count on movement to the level of 110.78. Price consolidation is near this value. The breakdown of the level of 110.80 should be accompanied by a pronounced upward movement. Here, the potential target is 111.38. Short-term downward movement is possibly in the range 109.81 - 109.58. The breakdown of the latter value will lead to an in-depth correction. Here, the goal is 109.23. This level is key support for the top. The main trend: the upward cycle of January 8. Trading recommendations: Buy: 110.40 Take profit: 110.76 Buy: 110.80 Take profit: 111.35 Sell: 109.80 Take profit: 109.58 Sell: 109.55 Take profit: 109.25
For the Canadian dollar / US dollar pair, the key levels on the H1 scale are: 1.3157, 1.3126, 1.3112, 1.3090, 1.3062, 1.3040 and 1.3015. Here, we are following the development of the upward cycle of January 7. The continuation of the movement to the top is expected after the breakdown of the level of 1.3090. In this case, the target is 1.3112. Price consolidation is in the range of 1.3112 - 1.3126. We consider the level 1.3157 to be a potential value for the top; upon reaching this level, we expect a pullback to the bottom. Short-term downward movement, as well as consolidation are possible in the range of 1.3040 - 1.3015. The breakdown of the latter value will lead to the formation of initial conditions for the downward cycle. In this case, the potential target is 1.2988. The main trend is the upward cycle of January 7, the correction stage Trading recommendations: Buy: 1.3090 Take profit: 1.3112 Buy: 1.3126 Take profit: 1.3155 Sell: 1.3038 Take profit: 1.3017 Sell: 1.3013 Take profit: 1.2990
For the Australian dollar / US dollar pair, the key levels on the H1 scale are: 0.6972, 0.6955, 0.6933, 0.6915, 0.6887, 0.6871, 0.6851, 0.6827 and 0.6793. Here, we are following the formation of the ascending structure of January 9. Short-term movement to the top is expected in the range of 0.6915 - 0.6933. The breakdown of the last value will lead to a pronounced movement. Here, the target is 0.6955. For the potential value for the top, we consider the level of 0.6972. Upon reaching this value, we expect consolidation, as well as a pullback to the bottom. Short-term downward movement is expected in the range 0.6887 - 0.6871. The breakdown of the last value will have the subsequent development of the downward structure. Here, the first goal is 0.6851. As a potential value for the bottom, we consider the level of 0.6793. The movement to which is expected after the breakdown of the level of 0.6825. The main trend is the descending structure of December 31, the formation of potential for the top of January 9 Trading recommendations: Buy: 0.6915 Take profit: 0.6930 Buy: 0.6935 Take profit: 0.6955 Sell: 0.6887 Take profit: 0.6873 Sell: 0.6870 Take profit: 0.6852
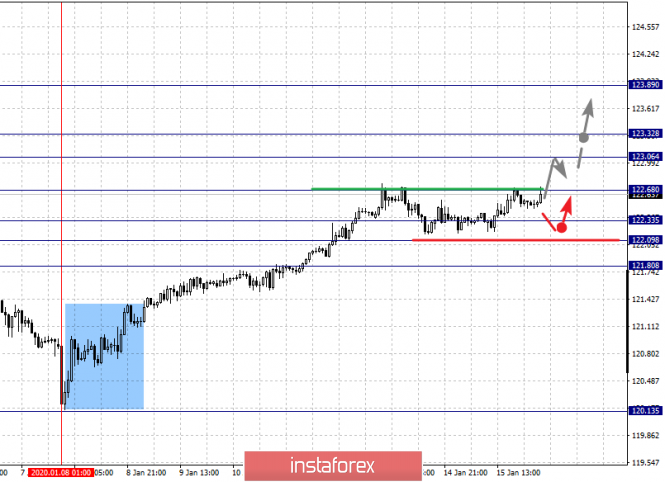
For the euro / yen pair, the key levels on the H1 scale are: 123.89, 123.32, 123.06, 122.33, 122.09 and 121.80. Here, we are following the development of the upward cycle of January 8. The continuation of the movement to the top is expected after the breakdown of the level of 122.70. In this case, the first target is 123.06. Short-term upward movement, as well as consolidation is in the range of 123.06 - 123.32. The breakdown of the level of 123.35 will lead to a movement to a potential target - 123.89. We expect a pullback to the bottom from this level. Short-term downward movement is possibly in the range of 122.33 - 122.09. The breakdown of the latter value will lead to an in-depth correction. Here, the goal is 121.80. This level is a key support for the upward structure. The main trend is the upward cycle of January 8 Trading recommendations: Buy: 122.70 Take profit: 123.05 Buy: 123.06 Take profit: 123.30 Sell: 122.33 Take profit: 122.10 Sell: 122.07 Take profit: 121.84
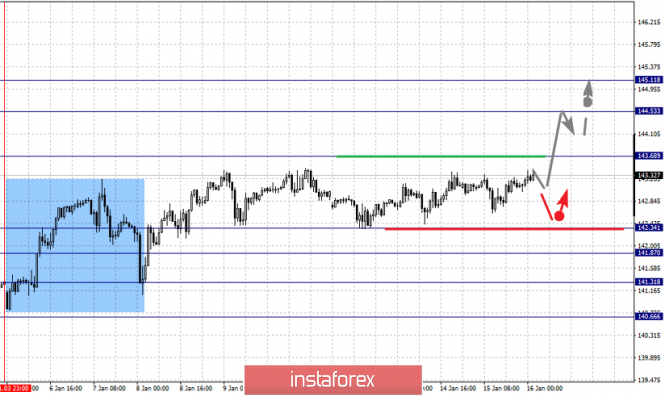
For the pound / yen pair, the key levels on the H1 scale are : 145.11, 144.53, 143.68, 142.34, 141.87, 141.31 and 140.66. Here, we are following the development of the ascendant structure of January 3. The continuation of the movement to the top is expected after the passage at the price level of 143.70. In this case, the target is 144.53. Price consolidation is near this value. For the potential level for the top, we consider level 145.11, from which we expect a pullback to the bottom. Short-term downward movement is possibly in the range of 142.34 - 141.87. The breakdown of the last value will lead to an in-depth correction. Here, the goal is 141.31. This level is a key support for the upward structure. The main trend is the upward structure of January 3 Trading recommendations: Buy: 143.70 Take profit: 144.50 Buy: 144.55 Take profit: 145.10 Sell: 142.34 Take profit: 141.90 Sell: 141.85 Take profit: 141.35 The material has been provided by InstaForex Company - www.instaforex.com |
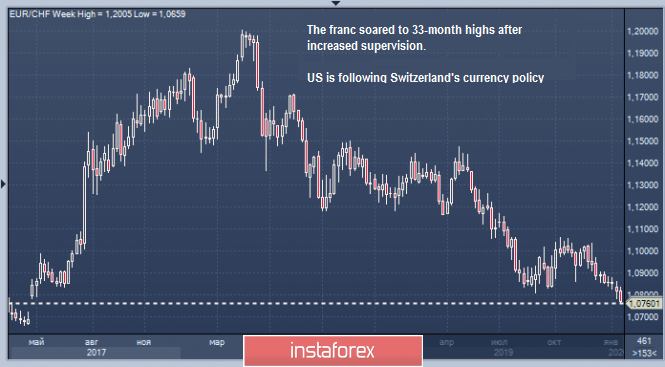
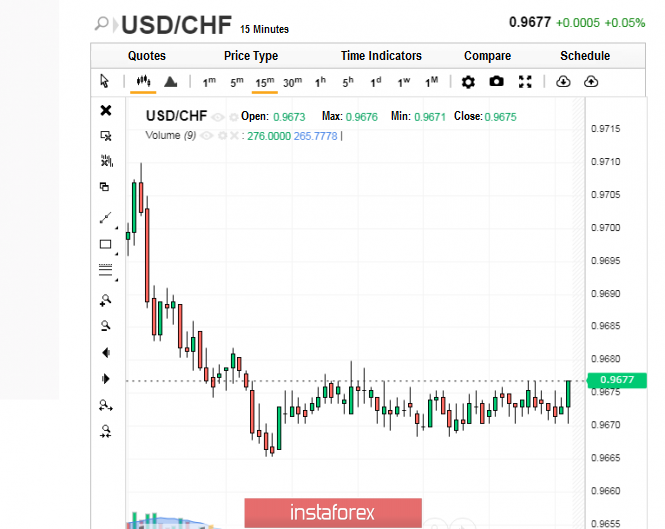
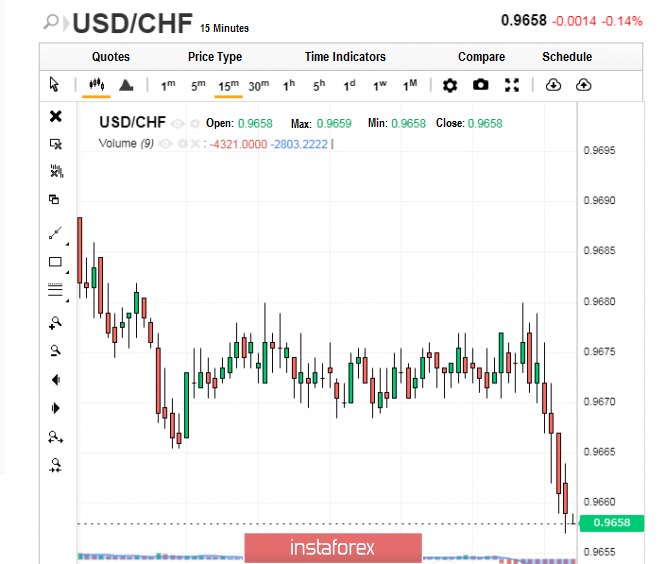
| Soaring on a scandal: the Swiss franc has reached heights Posted: 15 Jan 2020 04:09 PM PST In relation to the national currency of Switzerland, the saying "there would be no happiness, but misfortune helped" has fully justified itself. The Swiss franc soared to a 33-month high after adding Switzerland to the list of potential currency manipulators. Experts believe, however, that the rise of this currency will be short-lived. On Tuesday, January 14, the Swiss currency, previously behaving calmly in the market, showed a strong character unexpectedly. Its growth against the euro was the strongest in the last three years. Against the franc, euro fell to 1.0760 francs, or almost 0.5%. The Swiss currency took advantage of the moment and rose upwards, having significantly strengthened since April 2017. Meanwhile, in the USD/CHF pair, the situation was different: the franc fell against the dollar. On the morning of Wednesday, January 15, the tandem was trading within 0.9677. The dollar sank slightly against the franc by 0.4%, up to 0.9669 francs earlier, but then regained its positions. Later on, the USD/CHF pair entered a downward spiral, slipping to 0.9658. At the same time, the Swiss franc strengthened significantly in the European session. The reason for the rise of the Swiss national currency was the actions of the United States, which added this European country to the list of possible manipulators of exchange rates. According to experts, this inclusion can significantly affect the further actions of the Swiss National Bank (SNB). As a result, the regulator may refuse currency interventions that slow the growth of the franc, which is similar to an escape from potential problems. The country's Finance Ministry, however, denies the negative impact of the US authorities' decision on the national currency. Recall that on Monday, January 13, the US Treasury Department added Switzerland to the list of countries whose currency practices are causing concern in Washington. The country is accused of actively increasing purchases of foreign currency, starting in mid-2019. Note that in the past few years, the SNB has purchased foreign currency on a huge scale in order to weaken the demand for the franc. The Swiss regulator denies America's accusations of gaining a trading advantage over other currencies. The department emphasizes that the current interventions were aimed at eliminating the fortress of franc. The SNB also notes that a very high exchange rate negatively affects inflation and the country's export-dependent economy. Analysts emphasized that the Swiss Finance Ministry does not intend to change its currency policy with respect to the franc. They believe that currency interventions serve as a powerful fuel for the "Swiss". Currently, investors who use the Swiss franc as a safe haven asset during periods of uncertainty are focusing on the currency. The advantage of investing in this asset is the fact that the SNB has set the lowest interest rates in the world to deter investors. Representatives of the Swiss regulator emphasize that the goal of the country's financial policy is to stabilize prices and control current economic changes. Experts summarize that the Swiss financial authorities strive to achieve a balance in the implementation of this strategy, and most often, they succeed. The material has been provided by InstaForex Company - www.instaforex.com |
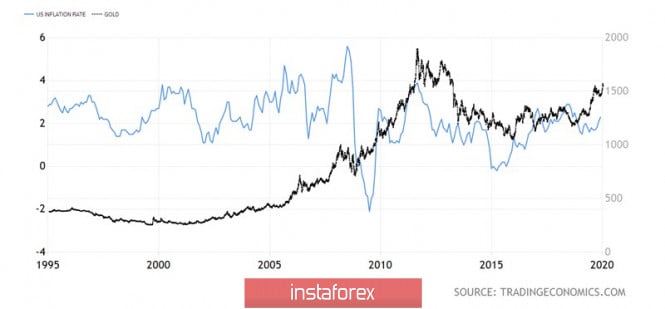
| Posted: 15 Jan 2020 04:09 PM PST The storm continues to rage in the gold market. Despite the fact that only two weeks have passed since the beginning of the year, the precious metal has already managed to go to 7-year highs, collapse like a stone, and then begin to recover thanks to bad news about the trade war. Bloomberg is actively spreading rumors that tariffs on $360 billion of Chinese imports will remain in force, at least until the US presidential election, because the White House needs to assess how Beijing is fulfilling its obligation to increase purchases of American agricultural and other products. The trade war, which has lasted just under two years, does not seem to be going to stop, which means that demand for safe-haven assets will remain high. The conflict in the Middle East is gradually fading. The market is dominated by the view that the current XAU/USD correction is due to the mass closure of long speculative positions. Hedge funds in the week of January 7 increased them to the highest level since the end of September, probably hoping that the confrontation between US and Iran will be long-lasting. Some are still hoping for it. The Standard Chartered Bank notes that the price movement due to geopolitics was stronger than previously expected. HSBC raised its forecast for gold for 2020 from $1560 to $1613 per ounce. In my opinion, the reasons for the strengthening of the precious metal should not be found in geopolitics, but in the activities of central banks, in politics and in trade disputes instead. The Fed has made it clear that even exceeding the 2% inflation target will not force it to abandon passive behavior. The regulator is ready to endure the acceleration of consumer prices during the period of economic expansion, which is good news for the "bulls" on XAU/USD. The precious metal is traditionally perceived as a tool for hedging inflation risks, asits dynamics have a lot in common with the changes in the US CPI. The dynamics of gold and American inflation:
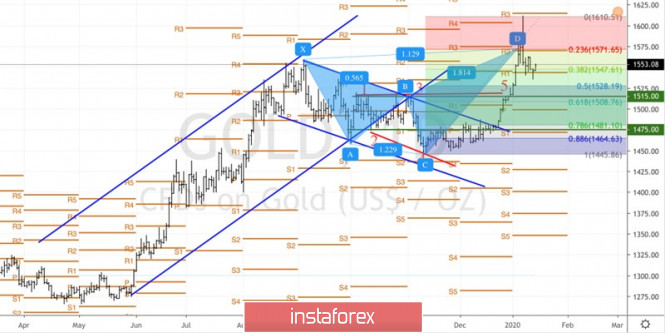
The dog is buried in the increased sensitivity of gold to the real yield of US Treasury bonds. In December, inflation in the United States grew by 2.3%. This is the second best indicator for a calendar year since 2011, when its growth rate was at 3%. In 2018, consumer prices rose by 1.9%, and by 1.6% on average for 10 years. Another factor supporting XAU / USD is the propensity of the world's leading central banks to ultra-soft monetary policy, which keeps global debt market rates close to historical lows. At the same time, a large-scale monetary stimulus contributes to the devaluation of currencies, which increases the attractiveness of gold. If global GDP does not recover as quickly as expected, regulators will further weaken monetary policy. With tariffs on $360 billion of Chinese imports still in place, this is more than likely. Technically, after reaching the target of 113% for the "Shark pattern", a natural pullback to the 38.2% Fibonacci correction level followed. Important Pivot levels are also located here. The fact that the "bulls" managed to hold support at $1545-1548 per ounce, the hopes of restoring the upward trend remains. Gold, daily chart
 |
| What did Putin say on his speech at the Federal Assembly on January 15? Posted: 15 Jan 2020 04:09 PM PST Vladimir Putin delivered his annual address to the Federal Assembly. This time, it is a record early, at the very beginning of the year. What's good? Real assistance will be given to families with children, mainly to the poorest families: a) Benefits for low-income families with children have been extended from 3 to 7 years, starting from January 1, 2020. b) All students up to grade 4 will be given free hot meals in school from September 1, 2020. C) Matkapital will be already on the first child (!) - on the second increase of 150 thousand rubles. This, unfortunately, is almost everything. But what about income and GDP growth? a) For income growth, GDP growth is needed, which is fortunately promised on 2021. For GDP growth, we need an investment growth of +5% to the current level. Thus, all in all, we need first an investment growth, then GDP growth, then income growth. This will take a very long time and in my opinion, is unlikely to work. The economy is not developing, as it is pinned down by low incomes of citizens and high taxes. No demand, no growth. b) Positively, it is promised that the government's reserves will amount to 7% of GDP by mid-2020, and that which will be higher will be sent to the economy. Politics. A change in the system of power and the Constitution is promised. The role of the parliament will be strengthened, while the President's role will be weakened. The parliament will be the one to appoint the Prime Minister and Ministers, and the President will not be able to approve the decision of the parliament. The President though, can send Ministers and the Prime Minister to resign. Putin said that he does not consider it necessary to increase the term of office of the President. Conclusions: It seems that Putin is not going to keep his presidency after 2024. The role of the parliament is growing. The significance of the State Duma elections in 2021 is increasing dramatically. A large transit of power begins. The material has been provided by InstaForex Company - www.instaforex.com |
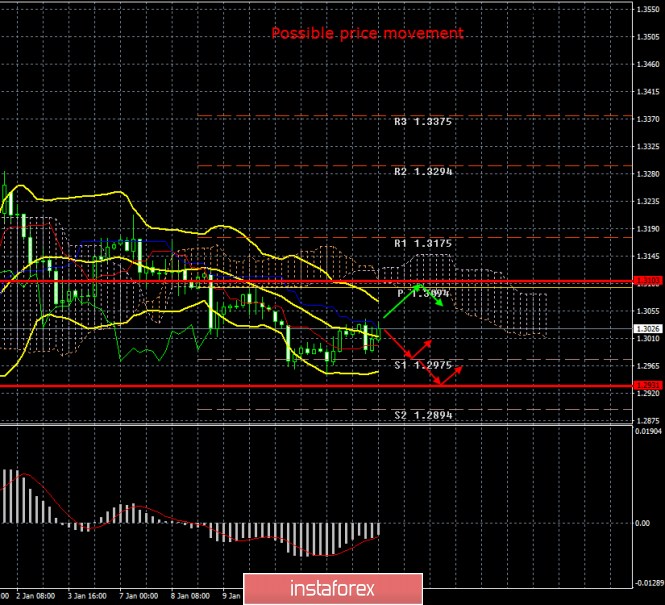
| Posted: 15 Jan 2020 03:49 PM PST 4-hour time frame Amplitude of the last 5 days (high-low): 118p - 89p - 111p - 55p - 79p. Average volatility over the past 5 days: 86p (average). The British pound sterling tried to resume the downward movement at the European trading session on Wednesday, January 15. However, the bearish mood of the traders ended very quickly and the pair has now returned to the Kijun-sen critical line, and the Bollinger bands are narrowing and turning sideways again. Thus, the further downward movement is still in question, as traders are clearly not willing to sell the pound again and even ignore quite important macroeconomic statistics from the UK. Today's inflation report showed that the consumer price index fell to 1.3% y / y by December, while traders expected inflation to remain unchanged at 1.5%. Thus, this is another slowdown in inflation in Britain. In monthly terms, the consumer price index was 0.0%, although market participants were expecting + 0.2%. In general, we can state that the data from the Foggy Albion failed once again. Formally, traders reacted to these statistics, since the pound still declined by 40 points early in the morning. However, we believe that this is too little for yet another confirmation of the weakness of the UK economy. This week, a retail sales report will be published in the UK, which will not save the situation for the British pound in any case. The most important thing in the current situation is to find out why the British pound has stopped declining. Maybe the reasons lie not in the pound, but in the dollar? However, there have been no pessimistic events recently in the States. The signing of a trade deal in the first phase between Beijing and Washington with all the desire could not cause a sell-off of the American currency. Thus, we are now inclined to believe that traders again consider the current level of the pound / dollar pair unattractive for new sales. Not so long ago, we listed a list of reasons why the pound will continue to fall in price in 2020. The main reason, of course, was Brexit, and this reason brings with it a number of other reasons. For example, we said that London could have serious problems with Scotland, which wants to remain in the European Union, with Ireland, where clashes between various separatist and nationalist movements may begin, with Gibraltar, which Spain claims, and so on. Of course, the most pressing issue remains the issue with Scotland, whose Prime Minister Nicola Sturgeon has repeatedly stated her intention to initiate a second referendum on independence. Yesterday, January 14, Boris Johnson sent an official letter to Mrs. Sturgeon which refused to allow her to hold an independence referendum. Boris Johnson recalled the results of the previous referendum in 2014, when most Scots decided to stay in the United Kingdom. He also recalled that Nicola Sturgeon and her predecessor, Alex Salmond, promised last 2014 that the referendum would be the last "in a generation." In principle, Johnson's failure was predicted by everyone. Why would the Prime Minister endorse the possible loss of an entire country in such difficult times for Britain? Moreover, there is really an iron argument in the form of the 2014 referendum. However, the problem is that Scotland is unlikely to give up so easily. It's good (for London) if the Scottish National Party simply continued to act "by law", requiring official permission from London. But then this process will simply drag on for many years and will not have any serious consequences. However, it can be assumed that Edinburgh may not follow a completely legal path given the truly serious attitude of Nicola Sturgeon, for example, to hold a referendum not agreed with London. Potentially, this could be a source of global conflict between England and Scotland. After all, Scotland remains under the jurisdiction of London and is obliged to obey. However, Nicola Sturgeon has repeatedly stated that her country does not want to be under the leadership of Boris Johnson. In general, Brexit will only begin on January 31, 2020, and the UK has already faced so many problems: financial losses and a political crisis that it becomes scary at the expense of the near future of the country. Thus, the future of the pound is no less vague and we continue to expect a decline in the British currency in the medium and long term. Trading recommendations: GBP / USD remains downside. Thus, traders are advised to stay on the pound / dollar pair with targets at 1.2975, 1.2931 and 1.2894 as long as the pair is below the critical line. It is recommended that purchases of British currency be returned no earlier than the price fixing above the Kijun-sen and Senkou Span B lines with the first target of 1.3175. Explanation of the illustration: Ichimoku indicator: Tenkan-sen is the red line. Kijun-sen is the blue line. Senkou Span A - light brown dotted line. Senkou Span B - light purple dashed line. Chikou Span - green line. Bollinger Bands Indicator: 3 yellow lines. MACD indicator: Red line and bar graph with white bars in the indicators window. Support / Resistance Classic Levels: Red and gray dotted lines with price symbols. Pivot Level: Yellow solid line. Volatility Support / Resistance Levels: Gray dotted lines without price designations. Possible price movement options: Red and green arrows. The material has been provided by InstaForex Company - www.instaforex.com |
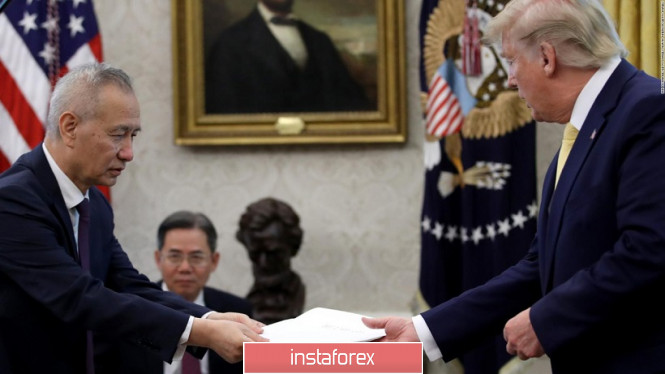
| EUR/USD: weak PPI report, rumors around the deal, and dollar's overall vulnerability Posted: 15 Jan 2020 03:49 PM PST The euro-dollar pair shows amazing durability at the beginning of this year. The bears of EUR/USD put pressure on the pair with an enviable regularity, however, buyers always return the price to previous levels. For two weeks in January, sellers could not gain a foothold in the area of the 10th figure, although such attempts were made repeatedly. Nevertheless, the overall vulnerability of the US currency does not allow the bulls of the dollar to develop a downward trend for the pair. Moreover, the events of the current week logically fit into the general outline of the latest trends. The bears of EUR/USD made another attempt to decline to the area of the 10th figure after the release of conflicting data on the growth of American inflation, but they were able to only reach the level of 1.1104 instead, after which they began to actively buy the pair. Today, the upward dynamics has continued again, thanks to the general weakening of the dollar. On the other hand, the European currency has recently behaved modestly, due to the lack of information lines. In almost all cross-pairs, the euro is weak. With the exception of the euro / franc pair, which declined to three-year lows. But in this case, we are only talking about the rise in price of the Swiss, and the euro only follows the quoted currency. The same can be said about the EUR/USD pair. Here, a mirror situation has only developed, since the price is rising only due to the devaluation of the dollar. The American currency came under pressure from several fundamental factors. Firstly, in anticipation of the signing of the first phase of the U.S.-China trade deal, rumors appeared in the market that Washington did not intend to lower tariffs imposed on Chinese goods previously, at least until the presidential election in November this year. Yet, it is worth noting immediately that this information is unofficial in nature - it was distributed by reporters of the Bloomberg agency. Nevertheless, the currency market took this signal quite seriously: the yuan slowed down the strengthening process, and the dollar index began to show a downward trend. The euro-dollar pair, respectively, rose to the level of 1.1160. In turn, US macroeconomic statistics added fuel to the fire. Disappointing retail sales were released today after slurring non-farms and conflicting data on inflation in the United States. Meanwhile, the Producer Price Index is an early signal of changes in inflationary trends – the negative dynamics of this indicator. Therefore, its decline was negatively perceived by dollar bulls, especially against the background of other inflationary releases. Thus, the December producer price index on a monthly basis increased by only one tenth of a percent, after falling to zero (experts predicted growth to 0.2%). In annual terms, this figure rose to 1.3%, which coincided with the forecasts of most analysts. The basic PPI, that is, the producer price index without taking into account the prices of foodstuffs and energy carriers, has completely entered the "red zone" - both in annual and monthly terms. For example, the indicator has been consistently decreasing for the past four months on an annualized basis - if the index was at around 2.9% in August last year, then it has reached 1.1% today. This indicator fell to many-year lows - the it was on such bottoms only in August 2016 last time. However, long positions in the pair still look risky despite such disappointing reports, as well as short ones. Toward the close of the American session, a ceremony of signing the first phase of the deal between the United States and China should be held. The head of the White House and Vice Premier of the State Council of the PRC Liu He will certify with their signatures an almost 90-page document at the reception, where hundreds of high-ranking guests from business, government and diplomatic circles will be present. In such an environment, the parties are unlikely to voice any negative signals. Therefore, the dollar may receive some support, amid peace-loving rhetoric. On the other hand, a newsletter will be published on the text of the trade agreement a bit later (obviously tomorrow or the day after tomorrow). This document may return a certain negativity to the market. According to rumors, Beijing has made only vague obligations in terms of protecting intellectual property and liberalizing the financial services market. In addition, the negotiators decided to discuss the most complex and strategically important issues in the course of further negotiations, which will begin (most likely) in February. In other words, the parties managed to postpone the conflict for a while, putting the trade war on hold. However, the euphoria about this fact will quickly come forward. Beijing and Washington have not been able to solve key problems, taking the issue of structural reforms in China out of the negotiations. All this suggests that the EUR/USD pair may demonstrate false price movements in the near future. The current price increase should also be rather skeptical, in view of the above reasons. At the moment, it is worthwhile to maintain a wait-and-see attitude until the market acquaints itself and renders its "verdict" to the first phase of the trade transaction. The material has been provided by InstaForex Company - www.instaforex.com |
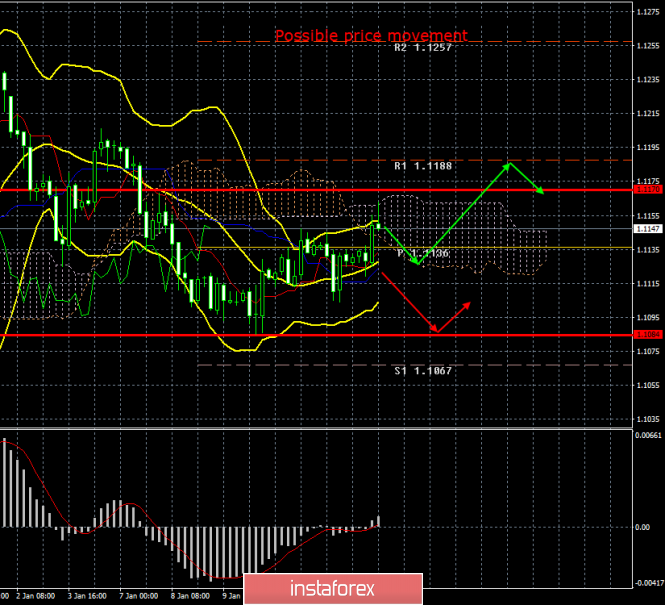
| Posted: 15 Jan 2020 03:49 PM PST 4-hour time frame Amplitude of the last 5 days (high-low): 67p - 28p - 44p - 34p - 41p. Average volatility over the past 5 days: 43p (average). The third trading day of the week for the EUR / USD pair ends with a corrective movement again, which may move into a new upward trend in the near future. During today, traders ignored macroeconomic statistics, being at the mercy of optimism regarding the signing of a trade deal between China and the States in the White House. Oddly enough, such news supports the European currency, although a trade conflict seems to be between China and America. Thus, it is clear that the conflict also affects European countries to one degree or another. But why then the US dollar does not go up, which also gets rid of one of the negative factors? Moreover, a report on industrial production was published today in the European Union itself, which very predictably showed a 1.5% drop in the indicator, which is worse than the forecast value (-1, 1% g / g). Mostly, this report is another in a series of weak or failed macroeconomic statistics from the European Union. Nevertheless, the reduction in industrial production is not surprising given the weak business activity in the manufacturing sector of the EU countries. But the growth of the European currency - causes. Once again, we have to return to the topic of justice and the validity of strengthening the euro. It is clear that one currency (in our case, the dollar) cannot grow constantly. We need corrections, pullbacks and if we look at the whole picture in this context, then everything is logical. The dollar regularly rises in price, and corrections of euro currency are justified simply on the need to adjust and do not correlate with macroeconomic statistics. Well, at least such a picture was just observed today. During the day, the euro / dollar pair reached the upper border of the Ichimoku cloud. So now, the bears, which obviously have fundamental support, have new good chances for the pair to decline. On the other hand, the price rebound from the Senkou Span B line is a strong signal. However, we will be able to see whether traders will be able to return the downward trend to the currency market only tomorrow and the day after tomorrow. Meanwhile, today is January 15, and the markets are still waiting for the signing of the "first phase" agreement and the official announcement of this. And while time goes on, we would like to note once again that it is still very, very early to talk about the victory of Donald Trump and the end of the trade war. According to many experts, the signing of the "first phase" agreement is nothing more than Trump's political move in order to somehow smooth out the electorate's displeasure. It's no secret that Trump and China are fighting in fact, but American consumers and American business are paying for this war, for which goods from China have become more expensive due to duties. Moreover, Donald Trump, as often happens among confident leaders, clearly counted on a quick victory. Those are: introduction of duties - China is afraid of monetary losses - makes concessions - countries sign an agreement that is beneficial to the States, - peace, friendship, chewing gum. However, China turned out to be a "tough nut", and the parties in total negotiated for almost two years. And now, when the first step towards reconciliation seems to have been taken, many experts note that the current agreement is the easiest part of the general trade agreement. Thus far, the simplest questions have been resolved, and most of the duties have remained in effect. However, Trump will now be able to announce his next victory and count on raising his political ratings. and the parties in total negotiated for almost two years. And now, when the first step towards reconciliation seems to have been taken, many experts note that the current agreement is the easiest part of the general trade agreement. Thus far, the simplest questions have been resolved, and most of the duties have remained in effect. However, Trump will now be able to announce his next victory and count on raising his political ratings. and the parties in total negotiated for almost two years. And now, when the first step towards reconciliation seems to have been taken, many experts note that the current agreement is the easiest part of the general trade agreement. Thus far, the simplest questions have been resolved, and most of the duties have remained in effect. However, Trump will now be able to announce his next victory and count on raising his political ratings. In the light of the trade war, I would like to note the actions of the Fed to flood the US economy with cash in very large amounts. Many experts called it a full-scale program of quantitative easing, but the Fed disallows QE and calls such injections temporary measures aimed at maintaining liquidity. However, we find it strange that the US economy suffers much less from a trade war with China than the EU economy, for example. Most likely, the Fed just hides the fact of a rather impressive stimulation of the American economy and Jerome Powell can do this for only one reason - the US president should not be shown in a negative light to voters less than a year before the presidential election . It can be noticed, how did any criticism of Jerome Powell and the Fed by Donald Trump cut short, which failed to reach a rate reduction to 0%? Perhaps the parties agreed, as they say, "amicably"? The Fed will stimulate the economy secretly, with cash injections so that the negative effects of the trade war are not visible. In turn, Trump will negotiate with Beijing from a position of strength, and in the eyes of the electorate - look like an invincible leader, whose actions did not lead to a fall in the economy, but, on the contrary, will lead to its even greater growth. The Euro currency is still showing growth, but high chances remain for the resumption of the downward trend until the Ichimoku cloud is overcome. Even in the case of overcoming the Senkou Span B line, it is unlikely that the euro will be able to rise in price too much. European statistics upset European bulls with alarming regularity. Trading recommendations: The pair EUR / USD continues to adjust. Thus, now, it is recommended for traders to wait for the pair to consolidate back below the Kijun-sen line and resume trading for a decline with goals 1.1084 and 1.1067. Moreover, it will be possible to consider purchases of the euro / dollar pair not earlier than the traders of the Senkou Span B line overcome with the first goal the resistance level of 1.1188. Explanation of the illustration: Ichimoku indicator: Tenkan-sen is the red line. Kijun-sen is the blue line. Senkou Span A - light brown dotted line. Senkou Span B - light purple dashed line. Chikou Span - green line. Bollinger Bands Indicator: 3 yellow lines. MACD indicator: Red line and bar graph with white bars in the indicators window. Support / Resistance Classic Levels: Red and gray dotted lines with price symbols. Pivot Level: Yellow solid line. Volatility Support / Resistance Levels: Gray dotted lines without price designations. Possible price movement options: Red and green arrows. The material has been provided by InstaForex Company - www.instaforex.com |
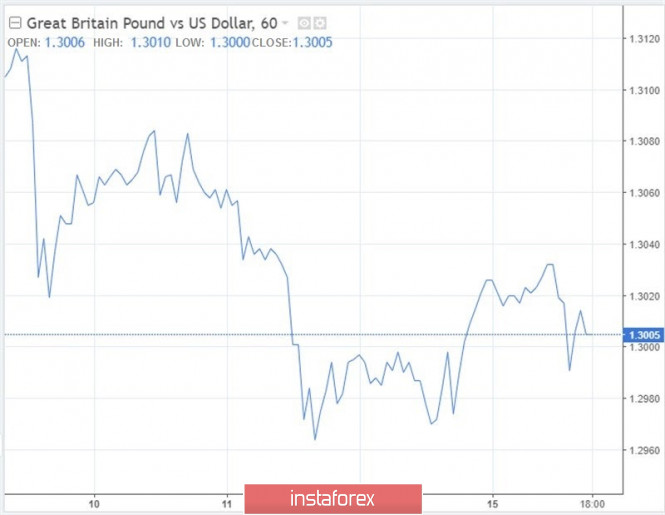
| GBP/USD: Bank of England seems tired of doing nothing, so the pound is not bored now Posted: 15 Jan 2020 03:49 PM PST The British currency lost about 2% in weight during the first two weeks of 2020. Last Monday, the GBP/USD pair fell below $ 1.30 for the first time this year amid growing expectations that the Bank of England could lower its interest rate this month. Specialists at NatWest Markets expect a rate cut by 25 basis points on January 30, although they previously thought it would happen in May. At the same time, Credit Agricole analysts believe that more than half of the members of the Bank of England's Monetary Policy Committee can support the reduction if the UK macro statistics does not improve. The chances that the Bank of England will reduce the cost of borrowing increased after data released on Monday showed that the British economy contracted in November by 0.3%. This casts doubt on the fact of whether there was any growth at all in the fourth quarter. The sales of the pound strengthened, triggered by comments by Mark Carney, Gertyan Wlige and Sylvanas Tenreiro, who signaled that they supported interest rate cuts. "There is an undeniable decline in economic data for the United Kingdom. We were pessimistic about the fundamental indicators of Great Britain for a long time, but we expected a temporary improvement in the data at the beginning of 2020. This view has not yet been confirmed," said Ross Walker, an economist at NatWest Markets. On the other hand, consumer prices in the UK rose by 1.3% in December year on year, at the lowest pace since November 2016. This is evidenced by the data published today by the National Statistical Office (ONS) of the country. On Wednesday, Michael Saunders, a member of the Bank of England's Monetary Policy Committee, citing a weak labor market and a sluggish economy, said interest rates should be cut immediately so that Britain does not fall into the trap of low inflation, like the eurozone. As a result, the GBP / USD pair noted local lows around 1.2990 against this background. "We are wary of the pound because of the risk that disappointing statistics in the UK in the coming weeks may increase the chances of easing monetary policy by BoE," Goldman Sachs said. "Weak UK economic data means the pound will struggle to stay above $ 1.30 for the next three to six months if progress is not made in the London-Brussels talks on Brexit," Rabobank said. "GBP/USD may decline to 1.2905, the lowest level since December 12, when early elections in the UK took place if economic data remains weak," said Rabobank expert Jane Foley, citing increased speculation about the Bank's interest rate cut England at a meeting on January 30. According to her, January can be considered BoE as attractive for changes in monetary policy, since there is a calmer background now. "The election results may not last long if negotiations on a trade deal between the UK and the EU prove difficult," said J. Fowley. The material has been provided by InstaForex Company - www.instaforex.com |
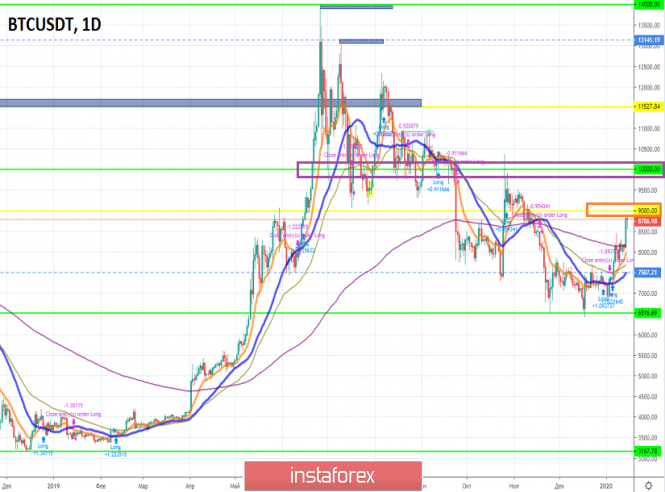
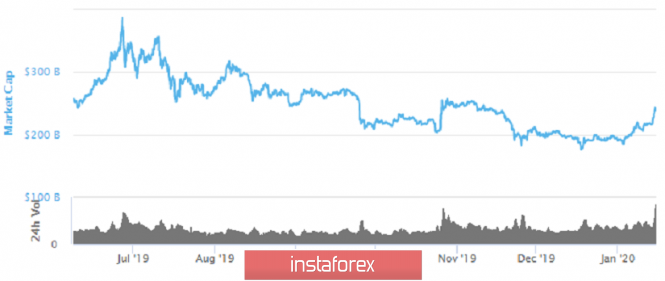
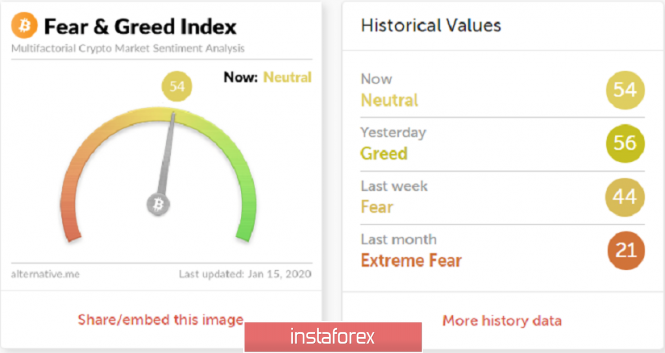
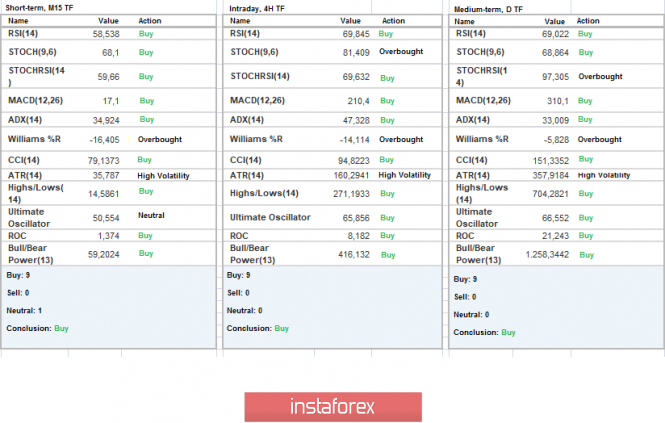
| What to watch out for Bitcoin? Will it rise? Posted: 15 Jan 2020 03:49 PM PST The cost of the first cryptocurrency has grown by more than $ 2000 since the beginning of the year. So, are we really seeing the first signs of a recovery in the trend? The question is actually interesting, but it's worth starting with the details, and so, a very dull downward move lasted for about 190 days, which cut the Bitcoin rate by half. The base point was designated in the range level of $ 6550, where a peculiar flat 6900/7750 was formed above it, and the clock component changed only on January 6 of this year, reflecting to us a series of pulsed rising candles and fixing above $ 8000. What is the reason for the change of interest? There are quite a lot of theories here, one of the most interesting ones says that the stage of fear that has taken place since the beginning of autumn 2019 has waned. This theory has the basis of law, where the period of the end of 2018 is taken as a basis, having in some way a similar model for the development of prices. In terms of fundamental data, they are inclined to believe that 2020 has good growth prospects. Therefore, many believe that Bitcoin halving can significantly increase the demand for the first cryptocurrency due to a conditional deficit that will be caused by an adjustment in the complexity of the development of BTC. Let me remind you that in the history of halving with the first cryptocurrency, it happened twice already, where the BTC rate increased 200 times for the first time, and in the second process of the development complication, the growth was 700%, which, of course, says a lot. However, I don't think we should expect a similar repetition, because the times are not the same, and a kind of excitement is gone. In any case, this event [halving], which is scheduled for May 2020, will attract special attention and, possibly, new market participants, due to which local growth will occur. Current development and prospects This week, a quite significant event for the crypto industry, the launch of Bitcoin options on the Chicago Mercantile Exchange [CME Group]. Trading volumes left 55 contracts at the start, or 275 BTC [$ 2 million (call option)], which is many times more than at the start of Bakkt. Moreover, volume data delighted many experts, dubbing what was happening as an important event for market development and a signal for investors [1 option contract of the European type corresponds to 5 BTC. The minimum price step is 5 index points corresponding to $ 25] The reaction of the market was positive, in particular, to Bitcoin. The upward pace was set, and the BTC rate has gained more than $ 500 in weight since the beginning of the week. It is likely to assume that the current stumbling block is the psychological level of $ 10,000, which still needs to be reached, but also to break through. But, it is extremely early to talk about growth until this moment comes, as well as about changing the clock component. It is worth considering such a moment that a kind of fear of further weakening of bitcoin is still preserved in the minds of traders and this may inhibit possible growth. Thus, you need a kind of engine and at least a clear fixation of prices higher than $ 10,000. The general background of the cryptocurrency market Analyzing the total market capitalization, we see a gradual recovery, where volume indicators have already reached the values of November last year, and currently amount to $ 240 billion If we consider the volume chart in general terms, then the current ceilings are 254 ---> 272 ---> 281 ---> 320 ---> 356 ---> 385 billion $. The index of emotions, aka "fear and euphoria" of the cryptocurrency market, is surprisingly at a very comfortable level for this season at 54p. For example, the index was 24p on a similar date last year, which was an extremely low rate. Indicator analysis Analyzing a different sector of timeframes (TF), we see that indicators relative to all the main time intervals are literally unanimously inclined towards a further ascent, which confirms the current market sentiment.  |
| Posted: 15 Jan 2020 05:38 AM PST EUR/USD - 4H.
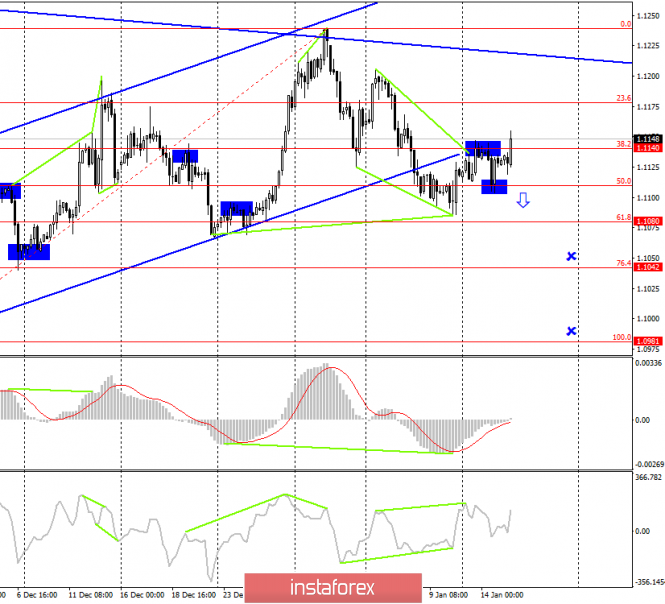
As seen on the 4-hour chart, the EUR/USD pair fell to the corrective level of 50.0% (1.1109) and rebounded from it. As a result, the pair performed a reversal in favor of the European currency and began the process of growth in the direction of the corrective level of 38.2% (1.1140), which is currently worked out. Thus, I believe that the downward momentum has lost its potential due to the rebound from the Fibo level of 50.0% and the "swinging" of traders around this level. Now, I recommend selling the pair again only if the reversal in favor of the US currency is performed again and the closure is below the Fibo level of 50.0%. Otherwise, the trading idea that predicts a fall to the levels of 76.4% and 100.0% will completely lose its functionality. Today, the divergence is not observed in any indicator. Forecast for EUR/USD and trading recommendations: The long-term trading idea remains in force, as the pair's quotes performed a consolidation under the upward small corridor on the 24-hour chart. Traders got a target for a drop of about 250 points - around the level of 1.0850. The deadline is one to two weeks. According to the second trading idea, I still expect a fall during the week to the corrective levels of 1.1042 and 1.0981, but at the moment, bull traders have started to move the pair up. I recommend waiting until their fuse runs out and return to selling the pair below the level of 1.1109. The material has been provided by InstaForex Company - www.instaforex.com |
| GBP/USD. January 15. The last chance for the pair to fall to the level of 1.2900 Posted: 15 Jan 2020 05:38 AM PST GBP/USD - 4H.
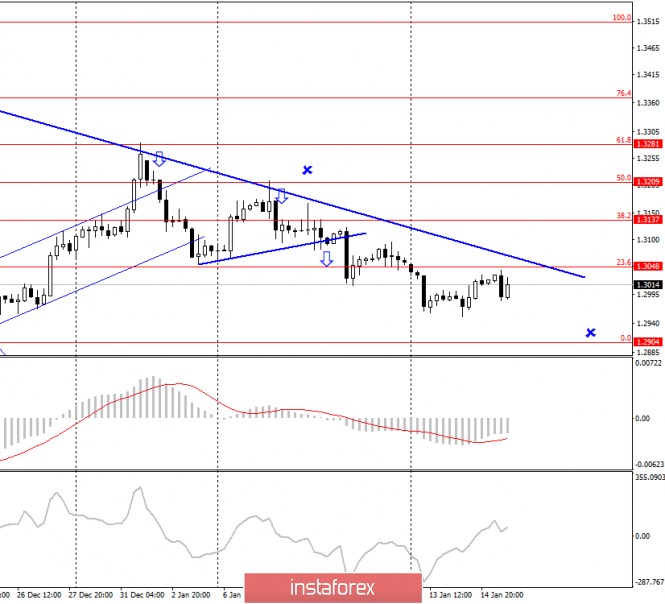
The GBP/USD pair, after fixing under the corrective level of 23.6% (1.3048), began the process of returning to this Fibo level. The rebound of quotes from it or the upper border of the downward trend corridor will be the fourth signal to sell the British pound with the last target - the corrective level of 0.0% (1.2904). At the same time, I believe that working out a trading idea is somewhat delayed and further keeping sales open can be a bit dangerous. In any case, it is best to move Stop Loss orders as close as possible to the upper line of the corridor or beyond the corrective level of 23.6% (1.3048). I believe that the pound-dollar pair will have the last chance to fall to the designated target level, after which the trading idea will exhaust its efficiency. The consumer price index in the UK today was much lower than forecasts. Thus, the "foundation" speaks in favor of a new fall in the pound, as does the "technique". Forecast and trading recommendations for GBP/USD: The current trading idea is still to sell the pound with a target of 1.2904 since as many as three sales signals were received. I recommend moving Stop Loss levels outside the trend area or placing them behind the nearest corrective level. The material has been provided by InstaForex Company - www.instaforex.com |
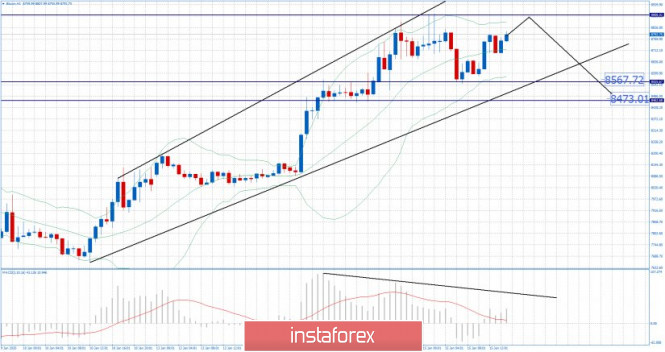
| BTC analysis for 01.15.2020 - Watch for potential downside on the BTC due to overbought condition Posted: 15 Jan 2020 05:23 AM PST Industry news: The last several years have brought great economic difficulties for the country of Venezuela, whose native currency, bolivar, suffered a great loss of value due to extreme inflation. At the same time, cryptocurrencies were finally leaving the shadows and becoming a big trend around the world. This is why the country decided to create its own, national cryptocurrency backed by its oil supplies — Petro. The coin was supposed to represent a safe haven from the nearly-worthless bolivar, but also to help circumvent US sanctions. However, Petro, which was launched in 2018, failed to attract users as Venezuelans were more interested in Bitcoin and altcoins. Now, Maduro has announced that he plans to bring the Petro back. Technical analysis:
BTC is trading in the upward trend but the price is trading near the previous day high at $8.888, which is sign that buying looks risky at this stage. Watch for selling opportunities on the rallies and use 5/15 minute time-frame for better timing. Downward targets are set at the price of $8.567 and $8.473. MACD oscillator is showing decreasing on the upside and the slow line is on the downside. Resistance level is set at the price of $8.888 Support levels are set at the price of $8.567 and $8.473. The material has been provided by InstaForex Company - www.instaforex.com |
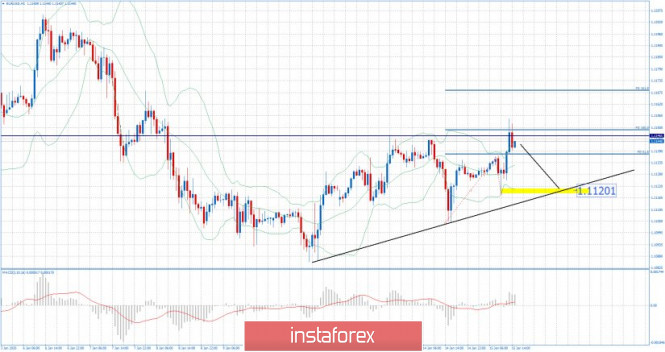
| Posted: 15 Jan 2020 05:12 AM PST EUR/USD has been trading upwards in the past few hours. The price did test reject of the level of 1.1155 and started sideways mode. I found potential completion of the upward cycle and start of the downside cycle.
Watch for selling opportunities on the rallies and use 5/15 minute time-frame for better timing. Downward target is set at the price of 1.1120. MACD oscillator is showing increasing on the upside momentum but the slow line is still in neutral stance... Resistance levels are set at the price of 1.1155 and $1.1165 Support levels and downward target is set at the price of 1.1120. The material has been provided by InstaForex Company - www.instaforex.com |
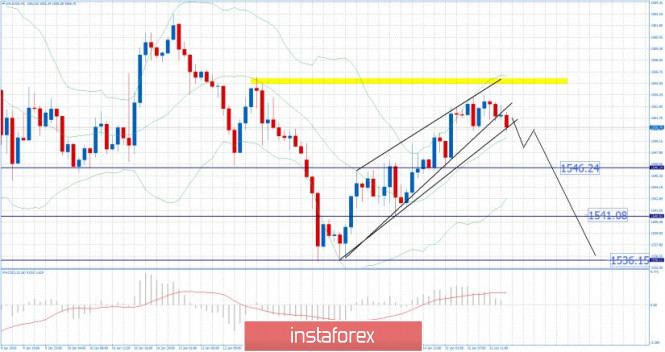
| Gold 01.15.2020 - Broken rising wedge pattern, watch for selling opportunities... Posted: 15 Jan 2020 04:59 AM PST Gold has been trading upwards in the past 24hours. The price did test the level of $1.554 and started sideways mode. I found rising wedge pattern in creation and potential for the downside. Downward targets are set at the price of $1.546, $1.541 and $1.536.
The breakout of the rising wedge was the key for strong supply on the Gold. Watch for selling opportunities on the rallies... MACD oscillator is showing decreasing on the upside momentum and slow line did turn into bearish mode... Resistance levels are set at the price of $1.544 and $1.556 Support levels and downward targets are set at the price of $1.546, $1.541 and $1.536. The material has been provided by InstaForex Company - www.instaforex.com |
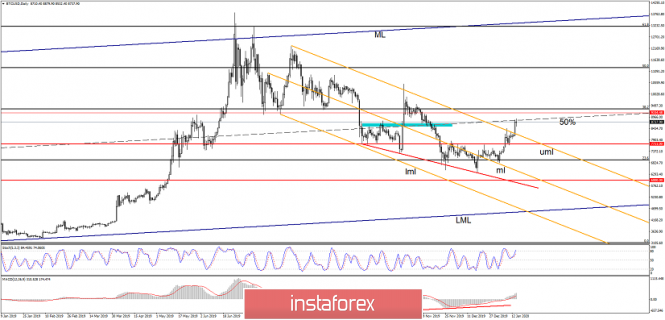
| Bitcoin at the first resistance! Long or Short? 15/01/2020 Posted: 15 Jan 2020 04:51 AM PST Bitcoin has increased significantly in the latest days and it seems ready to jump much higher after the failure to stabilize below the 23.6% retracement level. Yesterday's impressive rally has signalled that the bulls are very strong in the short term, but BTC price has reached a very important upside obstacle, the 50% Fibonacci line. You can see on the daily chart that BTCUSD has escaped from the descending orange pitchfork, a retest and a rejection from the upper median line (uml) could send the rate much above the 50% Fibonacci line and above the 38.2% retracement level.
On the second chart, I've drawn an ascending pitchfork (dark blue) to catch the current upside movement. BTCUSD rallied after the bullish engulfing and now is trading right above the sliding line (SL). If the price stays above the SL, the outlook remains bullish and it could resume the upside movement, we have a potential target at the median line (ML) of the minor ascending pitchfork, above $10,000 psychological level. A rejection from the 50% Fibonacci line (ascending dotted line) and a drop below the SL will signal that BTCUSD will come back towards the upper median line (uml) and maybe it will reach the LML as well. The critical support level remains at the 7711 level, a drop below this level will open the door for more drops. The material has been provided by InstaForex Company - www.instaforex.com |
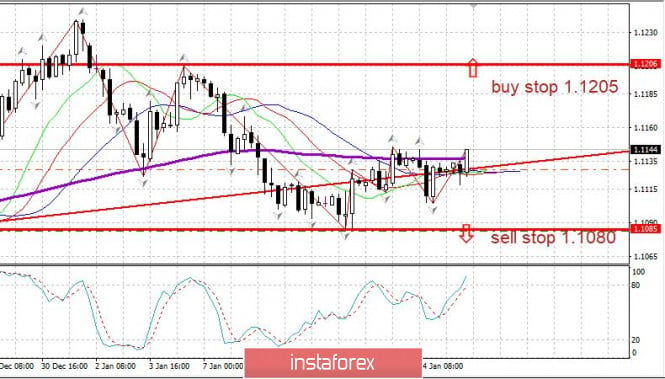
| Evening review for EURUSD for 01/15/2020. A new attempt at growth Posted: 15 Jan 2020 03:33 AM PST
As you can see, the euro is updating the highs of the current week at 1.1145. There is no particular reason for growth - but growth begins, nonetheless. We see that the euro held the level of 1.1100 - the efforts of the sellers did not yield results. Now, logically, the test goes up to 1.1205 and then 1.1240. Alternative: Break down of 1.1085. The material has been provided by InstaForex Company - www.instaforex.com |
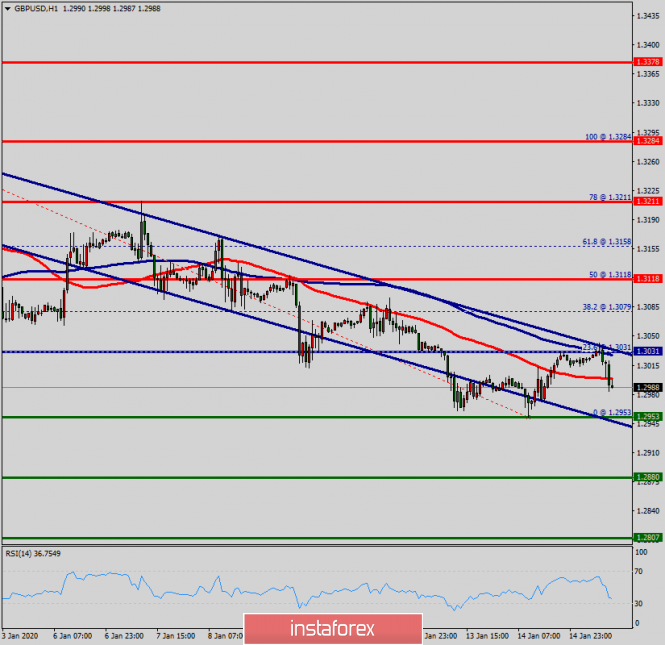
| Technical analysis of GBP/USD for January 15, 2020 Posted: 15 Jan 2020 02:47 AM PST Overview: The GBP/USD pair is in a bearish channel now. Amid the previous events, the pair is still in a downtrend. From this point, the GBP/USD pair is continuing in a bearish trend from the new resistance of 1.3031. The price spot of 1.3031 remains a significant resistance zone. Therefore, a possibility that the GBP/USD pair will have downside momentum is rather convincing and the structure of a fall does not look corrective. Last week, the GBP/USD pair fell from the level of 1.3118 to bottom at 1.2953 yesterday. Currently, the price is in a bearish channel. This is confirmed by the RSI indicator signaling that we are still in a bearish trending market. The bias remains bearish in the nearest term testing 1.2953 and 1.2880. Immediate resistance is seen around 1.3031 levels, which coincides with the weekly pivot. Moreover, the moving average (100) starts signaling a downward trend; therefore, the market is indicating a bearish opportunity below 1.3031. So it will be good to sell at 1.3031 with the first target of 1.2953. It will also call for a downtrend in order to continue towards 1.2880. The strong weekly support is seen at 1.2807. However, if a breakout happens at the resistance level of 1.3118, then this scenario may be invalidated. The material has been provided by InstaForex Company - www.instaforex.com |
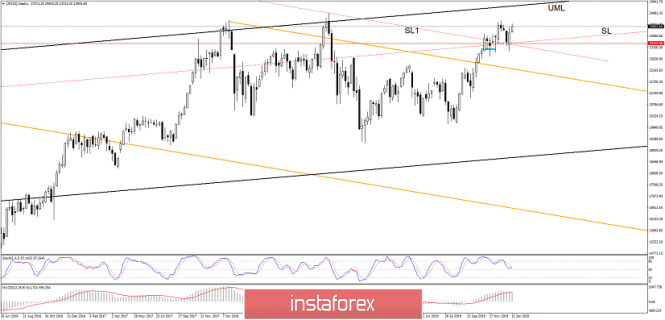
| Can We Still Buy USDJPY? 15.01.2020 Posted: 15 Jan 2020 02:47 AM PST USDJPY maintains a bullish outlook on the daily chart as the price has managed to make another higher high. Besides, the price is also located way above the 61.8% retracement level, signaling a potential upside movement. The JP225 rally has sent the Japanese yen towards new lows versus major currencies. So, if the Nikkei continues its climb, USDJPY could grow in the short term as well.
USDJPY has reached the median line (ML) and the R1 level. So, we cannot exclude a minor decline in the short term from this resistance area, the quote could come back to test and retest the 61.8% retracement level and the sliding line (SL) before it resumes the ascending movement. The pair is under strong bullish pressure after the false breakdown below the sliding parallel line (SL1) and below S1 level, but we still need a confirmation that the price will reach new highs. However, the price could breakout above the median line (ML) and above R1 anytime soon. So, a valid breakout above these levels will give us a great chance to go long with the first potential target at the 100% level, R3. The major upside target could be at the upper median line (UML). A further increase could be invalidated only by several false breakouts, rejections from the median line (ML - orange line) of the ascending pitchfork. Personally, I would like to see a decrease in the short term because a rejection from the 61.8% level and from the sliding line (SL) could signal important bullish momentum. The material has been provided by InstaForex Company - www.instaforex.com |
| Posted: 15 Jan 2020 02:28 AM PST
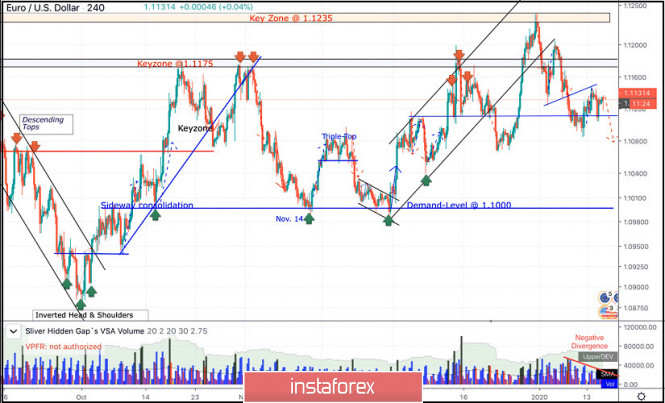
Since November 14, the price levels around 1.1000 has stood as a significant DEMAND-Level offering adequate bullish SUPPORT for the pair on two successive occasions. During this Period, the EUR/USD pair has been trapped within a narrow consolidation range between the price levels of 1.1000 and 1.1085-1.1100 (where a cluster of supply levels and a Triple-Top pattern were located) until December 11. On December 11, another bullish swing was initiated around 1.1040 allowing recent bullish breakout above 1.1110 to pursue towards 1.1175 within the depicted short-term bullish channel. Initial Intraday bearish rejection was expected around the price levels of (1.1175). Moreover, On December 20, bearish breakout of the depicted short-term channel was executed. Thus, further bearish decline was demonstrated towards 1.1065 where significant bullish recovery has originated. The recent bullish pullback towards 1.1235 (Previous Key-zone) was suggested to be watched for bearish rejection and another valid SELL entry. Suggested bearish position has achieved its targets while approaching the price levels around 1.1110. As expected, the Key-Level around 1.1110 has provided some bullish rejection. That's why, the previous bullish pullback was expected to pursue towards 1.1140 and probably 1.1175. This is supported by the manifested negative divergence while demonstrating the previous bullish pullback. However, for the bearish side of the market to dominate, bearish persistence below 1.1110 is needed to enable further bearish decline towards 1.1060 and probably 1.1040. Trade recommendations : Conservative traders should wait for any bullish pullback towards the price levels of (1.1140-1.1175) as another valid SELL signal. Bearish projection target to be located around 1.1120 and probably 1.1060. Any bullish breakout above 1.1190 invalidates the mentioned bearish trading scenario. The material has been provided by InstaForex Company - www.instaforex.com |
| January 15, 2020 : GBP/USD Intraday technical analysis and trade recommendations. Posted: 15 Jan 2020 02:10 AM PST
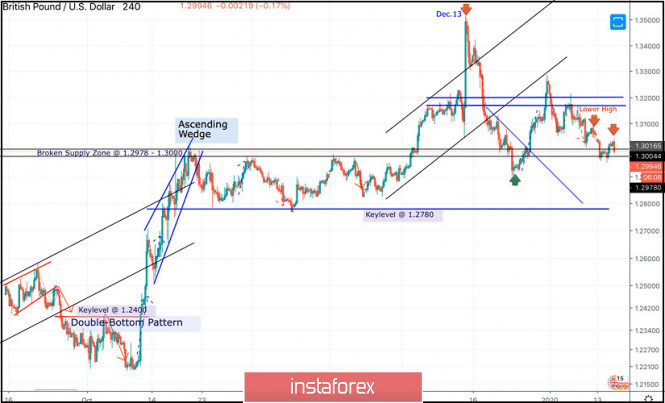
On December 13, the GBPUSD pair looked overpriced around the price levels of 1.3500 while exceeding the upper limit of the newly-established bullish channel. On the period between December 18 - 23, bearish breakout below the depicted channel followed by initial bearish closure below 1.3000 were demonstrated on the H4 chart. However, earlier signs of bullish recovery were manifested around 1.2900 denoting high probability of bullish pullback to be expected. Thus, Intraday technical outlook turned into bullish after the GBP/USD has failed to maintain bearish persistence below the newly-established downtrend line. That's why, bullish breakout above 1.3000 was anticipated. Thus, allowing the recent Intraday bullish pullback to pursue towards 1.3250 (the backside of the broken channel) where bearish rejection and another bearish swing were suggested for conservative traders in previous articles. Intraday bearish target are projected towards 1.3000 and 1.2980 provided that the current bearish breakout below 1.3170 is maintained on the H4 chart. Please also note that two descending highs are being demonstrated around 1.3120 and 1.3090 which enhances the bearish side of the market. Bearish breakdown below 1.2980 is needed first to enhance further bearish decline towards 1.2900, 1.2800 and 1.2780 where the backside of the previously-broken downtrend is located. Otherwise, Intraday traders can watch any bullish pullback towards the depicted price zone (1.3170 - 1.3200) for bearish rejection and another valid SELL entry with intraday bearish targets projected towards 1.3000 and 1.2980. The material has been provided by InstaForex Company - www.instaforex.com |
| Gold's wings has been clipped. It can not go far on geopolitics alone. Posted: 15 Jan 2020 01:14 AM PST
At the end of 2019, some analysts predicted that by the end of 2020, the price of gold will rise, amounting to $1,600 per 1 ounce. They proceeded from the following: a slowdown in the US economy will lead to a decrease in the yield of treasuries, forcing dollar to become cheaper due to the expansion of divergence in the global and US GDP growth. Moreso, in 2020, the S&P 500 index will not be able to boast the same success as in 2019. Nonetheless, the precious metal did not put plans on hold, and soared to seven-year highs amidst the escalating tensions in the Middle East. Geopolitics has become a new trump card for gold, allowing it to achieve its goals much earlier than expected. However, the situation quickly cleared up. The risks of an armed conflict between the US and Iran decreased to a minimum, and the "bulls" for XAU/USD were forced to descend from heaven to earth. The price of gold has rolled back down to the levels of $1,535-1,550 per ounce, where an intermediate "peak" was recorded in September 2019, and which has now turned from a strong resistance zone into a support area. You can't go too far with geopolitics alone. According to experts at the Australian financial company, Macquarie, geopolitical risks alone will not be enough to support the upward trend in the gold market. They said that "After a sharp increase from a shock event, the price of the precious metal usually tends to return to the previous level of quotes." Experts cited the events of September 11, 2001, as well as the attack on an oil refinery in Saudi Arabia last year as examples. During these times, the price of gold also rose sharply, however, it could not hold the positions it had won. Once the effect of the shock event ended, the price of the precious metal adjusted. "In order for the upward trend in the gold market to continue for a long time, a simultaneous combination of several factors is necessary. For instance, the weakening of the US dollar, low interest rates and rising inflation expectations, as well as the rise in oil prices and increased concerns about the slowdown in the global economy," Macquarie representatives said. It is noteworthy that during the last conflict between US and Iran, the dollar behaved quite strangely. This prompted some analysts to think that the US currency has lost its traditional role as a safe haven asset. Dollar, as a rule, grows with gold when the world is restless. If we judge by the USD index, which shows the dynamics of the dollar against a basket of major currencies, after the assassination of Iranian General Qassem Suleimani, the dollar practically did not move and even began to strengthen as soon as the conflict between the two countries began to fade. "It seems that investors can't decide whether they should consider the dollar as a safe haven or as a risky asset. The problem is that you can't sit on two chairs at the same time, although that seems to be what happened with the dollar," Richard Benson of Millennium Global said. "The reasons for this behavior of the dollar should be found in US interest rates, which at this stage, are the highest among developed countries. They increase the attractiveness of the dollar, as it provides both income and security, being the most liquid currency in the world," he added. What to expect from gold next? After sharp movements, the precious metal market usually determines the extreme points of the range in which the price further fluctuates, and consolidates until new introductory prices are received. At the moment, these points are $1,540 and $1,610 per ounce. After testing the lower limit of the range, it is expected that another attempt to increase gold's price will follow in the near future. However, graphical analysis suggests that in the area above $1,580, quotes may encounter quite strong resistance, thus, you need to prepare for the fact that the peak in the $1,611 area may last for several months before the price goes further up. The material has been provided by InstaForex Company - www.instaforex.com |
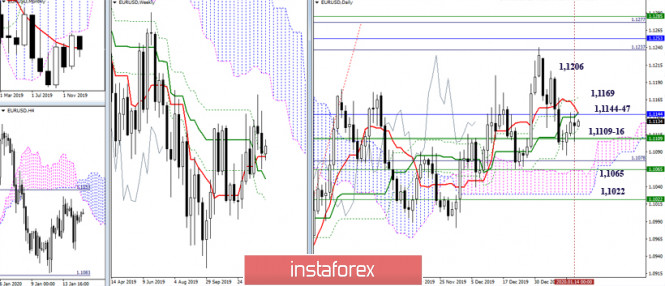
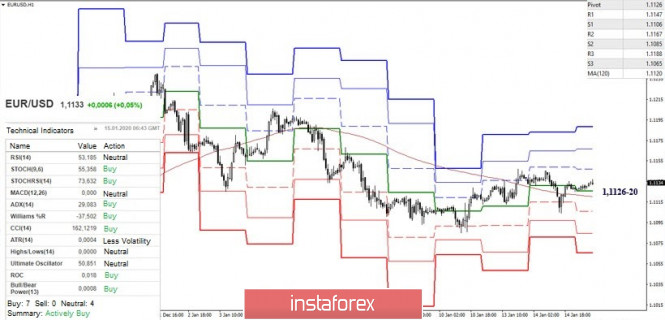
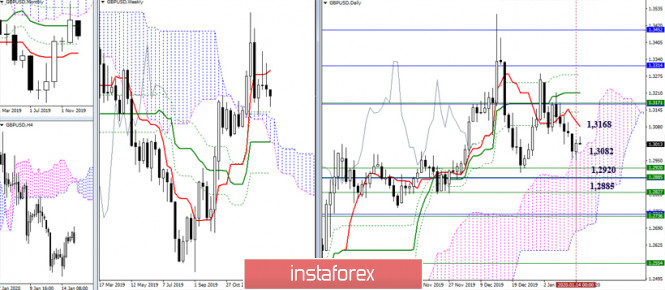
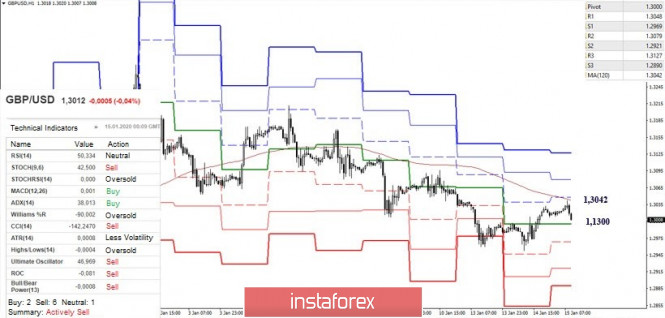
| Technical analysis recommendations for EUR/USD and GBP/USD on January 15 Posted: 15 Jan 2020 01:07 AM PST Economic calendar (Universal time) The most significant events of today's economic calendar are: consumer price index (9:30, UK), producer price index (13:30, USA), Crude oil reserves (15:30, USA). EUR / USD Yesterday, the players on the downside made an attempt to complete the climb, but have not succeeded in achieving a reliable result. Today, we are close to the zone of important resistance (1.1144-47) again, which combines the main levels of the daily cross and the weekly short-term trend. Moreover, consolidation above may affect the current balance of power, returning hope for a longer strengthening of the bulls and continues to rise. At the same time, intermediate upward directions on the way to the key resistance zone of this section (1.1237-85) in this case can be noted at 1.1169 (daily Fibo Kijun) - 1.1206 (extreme). Today, support remains at 1.1109-16 - 1.1065 - 1.1022 (weekly Tenkan + weekly Fibo Kijun + daily Fibo Kijun + daily cloud + weekly Kijun + weekly Fibo Kijun). Players for promotion have not yet been able to realize their advantage and the potential of the lower halves. Key supports (1.1120-26 central Pivot level + weekly long-term trend) continue to be united, located in the immediate vicinity of the price chart. A firm hold below may affect the balance of current preferences. Today, support for the classic Pivot levels are located at 1.1106 - 1.1085 - 1.1065. Maintaining positions over key supports (1.1120-26) and the reversal of moving in the future can lead to overcoming the met resistance of the higher halves by 1.1144-47, strengthening today the first resistance of the classic Pivot levels of the day R1 (1.1147 ) In this case, new upward prospects will appear within the day. They will be R2 (1.1167) and R3 (1.1188). GBP / USD The meeting with the upper border of the daily cloud (1.2981) delayed the bearish offensive, forming the premises for correction. The first reference point for the development of the correction now is the daily short-term trend (1.3082), then the most important role is still played by resistance 1.3168 (weekly short-term + monthly medium-term trend). The main focus will be on strengthening bearish sentiment and lowering to a fairly wide area of support which was indicated earlier (1.2920 - 1.2885 - 1.2827 - 1.2736) when consolidating inside the daily cloud (below 1.2981). The development of a correctional upward turn led the pair to the most important resistance on H1 - a weekly long-term trend (1.3042). Now, consolidating above will allow players to move up to the upward orientations of the higher halves. It should be noted that at the moment, the analyzed technical indicators remain loyal to the bears and hope for the completion of the correctional rise. Strengthening of the bearish plans now can serve as a decrease under the central Pivot level (1.3000), then the exit from the correction zone (1.2953 minimum extremum) will have significance. Ichimoku Kinko Hyo (9.26.52), Pivot Points (classic), Moving Average (120) The material has been provided by InstaForex Company - www.instaforex.com |
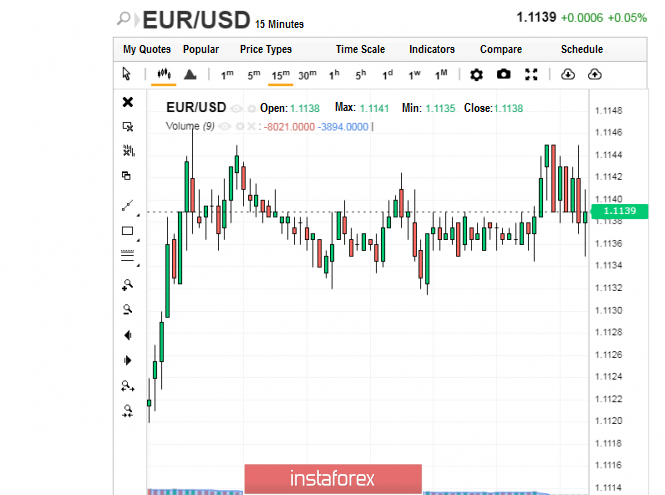
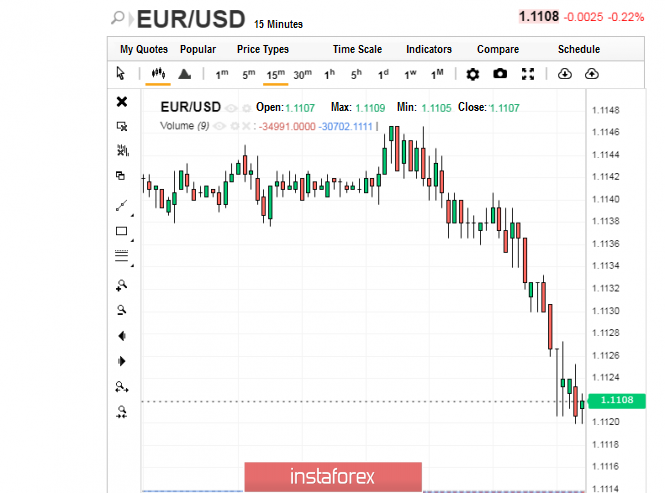
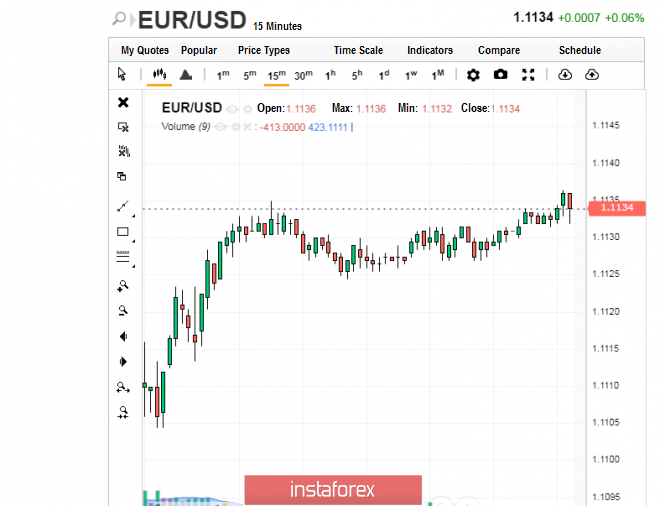
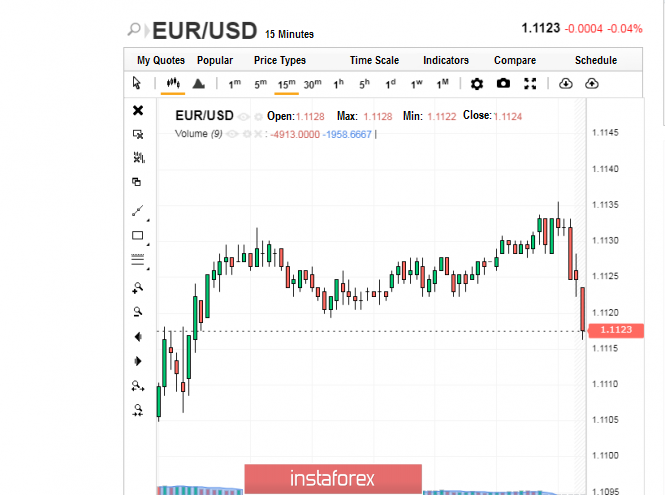
| Euro is at a crossroads: between falling and rising Posted: 15 Jan 2020 01:05 AM PST The European currency is awaiting data from the United States, as the said data will partly determine the direction of its movement. On Thursday, January 16, US will receive information on the volume of retail sales for December last year. This information will affect the future dynamics of the euro in the EUR/USD pair. On Tuesday, January 14, sellers of the EUR/USD pair became more active in the market, trying their best to increase the pressure on the euro. The attempt, however, was unsuccessful, and the classic tandem rose to 1.1139, and entered a downward flow yesterday. The EUR/USD pair made attempts to grow last Tuesday, but they were in vain. First, the decline reached the range of 1.1120–1.1123. Afterwards, the tandem literally rolled head over heels to the bottom, and at the moment, its quotes is at 1.1108, an extremely low indicator. The situation improved though on the morning of Wednesday, January 15. The EUR/USD pair went up steadily to 1.1134, almost returning to the starting point of Tuesday. Later on, the tandem tried to overcome this barrier, moving towards 1.1136 and higher, but it did not succeed. At the moment, the EUR/USD pair is back on track, sliding to 1.1123. Experts believe though that in the near future, attempts to grow will be unsuccessful. According to analysts, the EUR/USD pair was in a state of so-called "oblong correction" yesterday, where both the euro and the dollar exhibit strong movements. This, however, did not affect the further dynamics of the European currency, which was at a crossroads. It seems to be stuck in limbo, not knowing how to react to the situation and where to move – in the direction of falling or rising. In relation to this, experts say that the euro is ready to strengthen against the dollar. It just so happens that the buyers of the single currency are constrained by geopolitics, and the news background is more in favor of the American currency. Recall that the two largest participants in the protracted trade conflict, the United States and China, expressed their readiness to sign the first part of a mutually beneficial trade agreement. This gives the dollar an advantage over the euro, analysts say. Currently, the quotes of the euro are below $1.1155, so there is no need to talk about the recovery of the upward trend. There is little hope though, for relatively good data on industrial production in the Euro area, which will be available today. According to preliminary forecasts, the rate of the decline in industrial production in Europe should slow down from the previous -2.2% to -1.4%. Experts believe that if relatively positive data is released and the agreement between Washington and Beijing is signed, the euro may strengthen its position. Meanwhile, for the US currency, its current situation is developing successfully. Analyzing the latest data on the labor market in the United States, experts note high indicators that will allow the Federal Reserve not to change the existing policy in the near future. At the same time, according to the report of the US Department of Labor, the level of wage increases in the private sector was only 2.9%, becoming the lowest since July 2018. This indicator does not raise Fed's concerns about rising inflation, so it does not need to raise interest rates to curb inflation. This pleases the buyers of the stock market. Recall that the inflation rate in the United States is considered one of the key parameters for the financial world. Experts expected inflation to rise from 2.1% to 2.3%, which not only gives an incentive to strengthen the dollar, but also allows the Fed to close the issue of reducing interest rate. Today, we are expecting the report on producer prices in the United States, which has a large possibility of accelerating their growth rate from the previous 1.1% to 1.4%. This once again confirms the fact that there are no reasons for slowing inflation in America. According to analysts, in the case of positive data from the United States, euro will begin to sink, but this slippage will be temporary. It will be able to quickly regain its position, and create a competitive environment with the dollar. Experts believe that its current intermediate state will end with a rise. The material has been provided by InstaForex Company - www.instaforex.com |
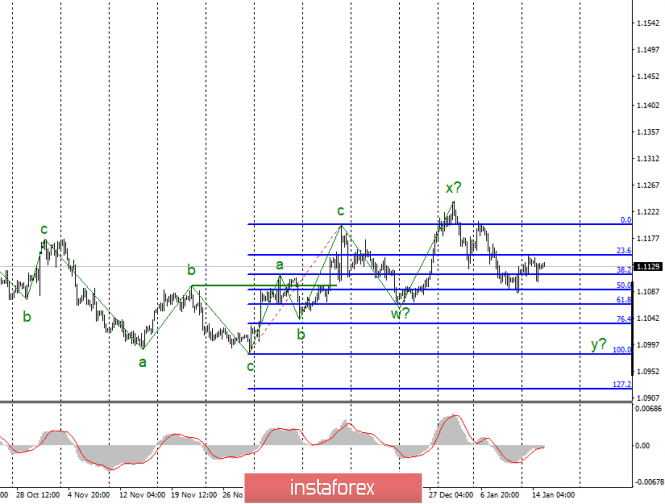
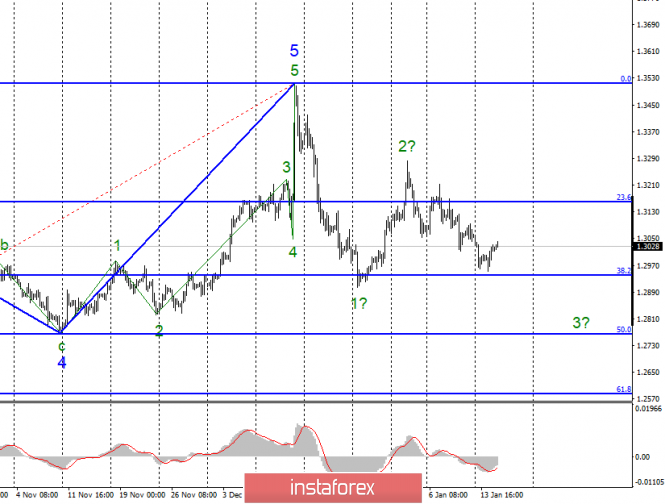
| Analysis of EUR/USD and GBP/USD for January 15. UK Inflation: reason for new sales of the pound? Posted: 15 Jan 2020 12:56 AM PST EUR / USD On January 14, the EUR / USD pair lost only a few basis points, although it fell significantly below the opening levels during the day. However, the current wave marking remains to be developed as before, the construction of wave y with targets located around the 10th figure is still expected. At the moment, the wave y takes a 5-wave form, and if this is true, then the decline in quotes of the instrument will resume today. On the contrary, an unsuccessful attempt to break through the 23.6% Fibonacci level indirectly indicates the readiness of the markets for new sales of the euro. Fundamental component: The news background for the euro-dollar instrument was not strong on Tuesday. There is only one report that came out - the US inflation report, and market expectations were fully justified. On an annualized basis, inflation rose to 2.3% in December, and on a monthly basis - by 0.2%. These are the numbers that were expected by the markets. On the one hand, the news is positive, as the Fed and Jerome Powell have repeatedly stated that inflation is weak, which hinders stronger economic growth. Now, inflation has exceeded the target 2%, and now the main thing is to keep the consumer price index above this level. If this can be done, then the US economy may continue to accelerate in 2020, which may even lead to an increase in key rates in the middle to the end of the year. Today's news background for the euro / dollar instrument will be reduced to a November report on industrial production in the European Union. Nevertheless, the markets do not expect any optimistic figures again and are preparing to reduce volumes by 1.1% y / y. But then, the indicator may grow by 0.3% compared to the previous month. However, whatever the final value, it is still far from the "normal" value, indicating a steady rate of production growth. Moreover, it is not surprising that the EU industry is in decline. Business activity has been signaling this for more than six months, which is declining in all countries of the European Union. Separately, I would like to note that today the first phase of the trade agreement between China and America will be signed, which can be favorably received by markets, especially stock markets. General conclusions and recommendations: The euro-dollar pair allegedly completed the construction of the upward trend section. Thus, I would recommend resuming sales of the instrument with targets located near the levels of 1.1034 and 1.0982, which corresponds to 76.4% and 100.0% Fibonacci and on the MACD signal "down", which indicates the readiness of markets for building a new downward wave of y. GBP / USD On January 14, the GBP / USD pair added about 30 basis points and continues to build the alleged wave of 3 or C as part of a new downward trend. Even if the current downward wave is C, then the instrument should decline below the 38.2% Fibonacci level in any case. For today, I'm still inclined to see the instrument go down to 1.2763, which corresponds to 50.0% Fibonacci. Fundamental component: The news background for the GBP / USD instrument was the same as the EUR / USD instrument on Tuesday. However, if the euro fell down during the day, then the pound did not. On the way to the level of 38.2%, quotes began to move away from the lows reached. There were no economic reports in the UK yesterday; today, inflation for December will come out, which will be called upon to answer an important question: will this indicator slow down or begin to show signs of recovery? If inflation continues to decline, then the demand for the pound will also continue to decline. In the last year or two, it was inflation that gave the Bank of England hope for a positive outcome and saved it from deciding on a new reduction in the key rate. Inflation was more or less stable around 2%. Now, a value of 1.5% y / y has been observed for two consecutive months, and it may continue to decline. Thus, I believe that any value below 1.5% can return the instrument to 1.2939. General conclusions and recommendations: The pound / dollar instrument continues to build a new downward trend. I recommend selling the instrument again with targets located near the level of 1.2764, which corresponds to the Fibonacci level of 50.0%, with the new MACD signal "down", as wave 3 does not yet look fully completed yet. The material has been provided by InstaForex Company - www.instaforex.com |




| You are subscribed to email updates from Forex analysis review. To stop receiving these emails, you may unsubscribe now. | Email delivery powered by Google |
| Google, 1600 Amphitheatre Parkway, Mountain View, CA 94043, United States | |

No comments:
Post a Comment