
Forex analysis review |
- January 17, 2020 : GBP/USD Intraday technical analysis and trade recommendations.
- January 17, 2020 : EUR/USD Intraday technical analysis and trade recommendations.
- BTC analysis for 01.17.2020 - Bearish divergence on the 4H time-frarrme, selling opporutnities are preferable
- Gold 01.17.2020 - Decision pivot level on the Gold at the price of $1.562
- GBP/USD 01.17.2020 - Broken bearish flag on the daily time-frrame, watch for selling on rallies with main target at 1.2960
- EUR/USD. January 17. Overbought euro still caused a fall
- GBP/USD. January 17. We are waiting for a new sales signal. The Briton embarrassed in front of another weak statistics from
- Evening review for EURUSD for 01/17/2020. The pressure on the euro intensified
- Trading recommendations for EUR/USD
- Dollar takes revenge on euro
- Fractal analysis for major currency pairs as of January 17
- Trading recommendations for GBP/USD - prospects for further movement
- Is Euro playing cat and mouse with the dollar?
- Technical analysis recommendations for EUR/USD and GBP/USD on January 17
- Technical analysis of EUR/USD for January 17, 2020
- The golden January auction
- Simplified wave analysis of EUR/USD and GBP/JPY for January 17
- Analysis of EUR/USD and GBP/USD for January 17. Pound ignores statistics, while euro is afraid of inflation
- Trader's Diary: EURUSD on 01/17/2020, Market condition
- Democrats are not giving up their hopes (EUR/USD and GBP/USD review on 01/17/2020)
- USD/JPY. Unnecessary yen: Japanese currency is actively losing value
- Overview of the GBP/USD pair on January 17. Will the UK retail sales show growth after 4 months of decline?
- Technical analysis of ETH/USD for 17/01/2020:
- Technical analysis of ETH/USD for 17/01/2020:
- Overview of the EUR/USD pair on January 17. Is US manufacturing sector starts to experience problems that the fed is smoothing
| January 17, 2020 : GBP/USD Intraday technical analysis and trade recommendations. Posted: 17 Jan 2020 07:48 AM PST
On December 13, the GBPUSD pair looked overpriced around the price levels of 1.3500 while exceeding the upper limit of the newly-established bullish channel. On the period between December 18 - 23, bearish breakout below the depicted channel followed by initial bearish closure below 1.3000 were demonstrated on the H4 chart. However, earlier signs of bullish recovery were manifested around 1.2900 denoting high probability of bullish pullback to be expected. Thus, Intraday technical outlook turned into bullish after the GBP/USD has failed to maintain bearish persistence below the newly-established downtrend line. That's why, bullish breakout above 1.3000 was anticipated. Thus, allowing the recent Intraday bullish pullback to pursue towards 1.3250 (the backside of the broken channel) where bearish rejection and another bearish swing were suggested for conservative traders in previous articles. Intraday bearish target are projected towards 1.3000 and 1.2980 provided that the current bearish breakout below 1.3170 is maintained on the H4 chart. Please also note that two descending highs were recently demonstrated around 1.3120 and 1.3090 which enhances the bearish side of the market. Conservative traders should wait for bearish breakdown below 1.2980, This is needed first to enhance further bearish decline towards 1.2900, 1.2800 and 1.2780 where the backside of the previously-broken downtrend is located. In the Meanwhile, Intraday traders can watch any bullish pullback towards the depicted price zone (1.3170 - 1.3200) for bearish rejection and another valid SELL entry with intraday bearish targets projected towards 1.3000 and 1.2980. The material has been provided by InstaForex Company - www.instaforex.com |
| January 17, 2020 : EUR/USD Intraday technical analysis and trade recommendations. Posted: 17 Jan 2020 07:24 AM PST
Since November 14, the price levels around 1.1000 has stood as a significant DEMAND-Level offering adequate bullish SUPPORT for the pair on two successive occasions. During this Period, the EUR/USD pair has been trapped within a narrow consolidation range between the price levels of 1.1000 and 1.1085-1.1100 (where a cluster of supply levels and a Triple-Top pattern were located) until December 11. On December 11, another bullish swing was initiated around 1.1040 allowing recent bullish breakout above 1.1110 to pursue towards 1.1175 within the depicted short-term bullish channel. Initial Intraday bearish rejection was expected around the price levels of (1.1175). Moreover, On December 20, bearish breakout of the depicted short-term channel was executed. Thus, further bearish decline was demonstrated towards 1.1065 where significant bullish recovery has originated. The recent bullish pullback towards 1.1235 (Previous Key-zone) was suggested to be watched for bearish rejection and another valid SELL entry. Suggested bearish position has achieved its targets while approaching the price levels around 1.1110. As expected, the Key-Level around 1.1110 has provided some bullish rejection. That's why, the previous bullish pullback was expected to pursue towards 1.1140 and 1.1175 where the depicted key-zone as well as the recently-broken uptrend are located. Recent signs of bearish rejection were demonstrated around 1.1175. That's why further bearish decline was anticipated towards 1.1110. For the bearish side of the market to dominate, bearish persistence below 1.1110 is needed to enable further bearish decline towards 1.1060 and probably 1.1040. Trade recommendations : For those who caught the initial bearish trade around 1.1175, it's already running in profits. S/L should be lowered to 1.1140 to secure some profits. On the other hand, Conservative traders should wait for a bullish pullback towards 1.1120-1.1135 for another valid SELL signal. Bearish projection target to be located around 1.1060. Any bullish breakout above 1.1175 invalidates the mentioned bearish trading scenario. The material has been provided by InstaForex Company - www.instaforex.com |
| Posted: 17 Jan 2020 07:12 AM PST Industry news: It seems that crypto-custody has been kept a secret from institutional investors. Few things have improved in 2019 as much as the custody of cryptocurrency, and the regulators' attitude towards it. While a Bitcoin Exchange Traded Fund still waits on the doorsteps of the SEC, institutional companies entering the cryptocurrency custody market has grown. Coinbase snapped up custody provider Xapo, Fidelity entered the crypto-storage space, and the Intercontinental Exchange's digital assets platform Bakkt launched offering both trading and custody. Yet, investors have been kept in the dark. According to a survey by Bitcoin ETF hopeful Bitwise Asset Management, institutional investors have a crypto-custody problem. The problem, however, is a lack of information, not a lack of solutions. Technical analysis:
BTC has been trading upside but it found solid supply near the $9.000 level. I found the bearish divergence on the MACD oscillator, which is sign that buyers got exhausted. Watch for selling opportunities on the rallies with the downward targets at the price of $8.590 and $8.445. Major resistance is set at the price of $9.000. Support levels and downward target are set at the price of $8.592 and $8.445. The material has been provided by InstaForex Company - www.instaforex.com |
| Gold 01.17.2020 - Decision pivot level on the Gold at the price of $1.562 Posted: 17 Jan 2020 07:04 AM PST Gold has been trading sideways at the price of $1.557. The price is near the critical decision level at $1.562 and you should watch carefully the price action around it.
The breakout of the $1.562 to the upside will confirm test of $1.557 and in that case you should watch on buying opportunities on the dips. The rejection of the resistance at $1.562 would confirm rotation back towards the level of $1.535. MACD oscillator is showing positive reading but the slow line is tuned to the downside. Major resistance is set at the price of $1.562. Support levels and downward target is set at the price of $1.535. The material has been provided by InstaForex Company - www.instaforex.com |
| Posted: 17 Jan 2020 06:57 AM PST GBP has been trading downwards. The price tested and rejected of the level of 1.3120. I see further downside on the GBP and potential re-test of 1.2960 and 1.2910.
The rejection of the Bollinger middle line is the early trigger for the downside. I also found potential for bearish outside candle. My advice is to watch for selling opportunities on the rallies using the hourly/4H time-frame. MACD oscillator is showing bearish stance and reading below the zero Major resistance is set at the price of 1.3120. Support levels and downward targets are set at the price of 1.2960 and 1.2910. The material has been provided by InstaForex Company - www.instaforex.com |
| EUR/USD. January 17. Overbought euro still caused a fall Posted: 17 Jan 2020 05:42 AM PST EUR/USD - 4H.
As seen on the 4-hour chart, the EUR/USD pair performed a reversal in favor of the US currency and resumed the process of falling in the direction of the low level of 1.1086. A new downward trend corridor has been formed, which now points to the "bearish" mood of most traders. The reversal of quotes in favor of the US dollar occurred with some delay, I was waiting for it 1-2 days earlier. However, in this case, it turned out not so bad, and now I expect a fall to the lower line of the corridor - 1.1040 (approximate goal). A bearish divergence was also formed for the MACD indicator, which also worked in favor of the US currency. The report on inflation in the European Union was not weaker than forecasts, but not stronger than them. Inflation was 1.3% y/y in December, which remains far from the ECB's target level, which is now 2.0% but can be lowered in the future. Now the main thing is that the information background from America does not scare off bear traders from the plan. In the US, the consumer confidence index and the level of industrial production will be released today. Forecast for EUR/USD and trading recommendations: The long-term trading idea remains in force, as the pair's quotes performed a consolidation under the upward small corridor on the 24-hour chart. Traders still have a target for a fall near the level of 1.0850. Terms of execution - 2-3 weeks. The new trading idea is to sell the pair with the targets of 1.1086 and 1.1040 since the trend on the 4-hour chart is again "bearish". These levels are the two local lows. The material has been provided by InstaForex Company - www.instaforex.com |
| Posted: 17 Jan 2020 05:41 AM PST GBP/USD - 4H.
As seen on the 4-hour chart, the GBP/USD pair performed a consolidation above the corrective level of 23.6% (1.3048). Along with this consolidation, quotes of the pair closed above two trends and corridors. I have built a small correction line based on the movement of the last days, and if the pair closes below it, then traders will again be able to count on a reversal in favor of the US currency and a resumption of the fall in the direction of the corrective level of 0.0% (1.2904). As we can see, the goal remains the same, however, too long growth of the pound before the expected fall suggests a possible different scenario. In any case, I recommend trying to sell the pair when it is fixed below the Fibo level of 23.6% and the correction line. The "foundation", in the case of the pound-dollar pair, remains in favor of the dollar. Retail sales in the UK declined by 0.6% m/m in December, with forecasts of +0.7%. These numbers were supposed to cause the British dollar to fall, however, the pair continues to trade with a small amplitude, showing no particular desire to move at the end of the trading week. Forecast for GBP/USD and trading recommendations: The trading idea is still to sell the pound with a target of 1.2904. Going beyond both corridors cancels their relevance, at the same time, the "foundation" can cause a new fall, as well as fixing under the corrective line and the Fibo level of 23.6%. The material has been provided by InstaForex Company - www.instaforex.com |
| Evening review for EURUSD for 01/17/2020. The pressure on the euro intensified Posted: 17 Jan 2020 05:04 AM PST
Investor sentiment is getting worse and the global economy is getting more negative. The growth rate in China has fallen to +6.1% and the negative is coming. Investment, sales, and the auto market are all slowing down. In Britain, new retail sales data is weak and the Bank of England is likely to cut the rate. Against this background, the US-Europe trade contradictions are intensifying. EURUSD: The euro is falling towards the support of 1.1100. In the case of a break below 1.1085, we sell. Purchases from 1.1180. The material has been provided by InstaForex Company - www.instaforex.com |
| Trading recommendations for EUR/USD Posted: 17 Jan 2020 04:28 AM PST Using complex analysis, we can see that the correction phase from the range of 1.1080 reached its local peak. This was located near the level of 1.1180. Since Wednesday, the correction has been under pressure, confirmed by a temporary lateral movement, and the structure of which there were impulses, locally reaching the area of the control level with shadows. The amount of the change in the correction was much larger than initially considered, which is more than 50% relative to the downward movement since the beginning of the year. Because of this, traders are not losing faith in the resumption of the downward trend, snd considers the recent correction as a kind of a variable component that does not carry a fracture of earlier bars. In fact, if the quote manages to fix at least below 1.1115, this theory will sparkle with new colors and most traders will believe in a downward move. In terms of volatility, we have extremely stable indicators that are close to the average daily value. Such statistics confirm a rather good emotional background of the market, where both speculators and intraday traders get along, which cannot be said about conservative market participants. Analyzing the past days by the minute, we can see a series of pulsing downward candles that have switched to a local inertial course [13:30-16:30 London time in the trading terminal]. The subsequent oscillation was in terms of a rollback/stagnation with a small amplitude. As discussed in the previous review, speculators had local long positions from 1.1150, and at the same time, not forgetting about the restrictive order. Looking at the trading chart in general terms [the daily period], we see a lot of discussions about the trend change. The oblong correction, which has been taking place for as long as 3.5 months, made its own adjustments to the existing market cycles, but did not change the direction of the trend itself. Open the daily chart and analyze it from at least 2018. The news background of the previous day included data on the United States, which turned out to be much better than forecasts. The indicators for the applications for unemployment benefits decreased by 46 thousand [Repeated - 36 thousand, the forecast - 11 thousand; Primary - 10 thousand, the forecast - +5 thousand]. At the same time, there were very good indicators for retail sales, which, according to forecasts, should have slowed from 3.3% to 2.9%. Iinstead , there was an acceleration to 5.8%. The market's reaction to the statistical data was almost instantaneous in terms of strengthening the dollar. The inertial move was set. In terms of informational background, a broad discussion of the previously signed first phase of the trade agreement between US and China continues. This time, the noise came to US from Europe, where the European commissioner for trade, Phil Hogan, said that EU can file a claim with the WTO regarding the previously concluded deal, as it violates the rules of free trade. "We have not studied the document in detail, and if there is a question of compliance with the WTO rules, we will, of course, file a complaint. We are not happy about this and would not like to create such an impression, but we will defend our own economic interests in the context of the US agreements with Japan and China. We will study everything carefully," the European Commissioner said. Today, in terms of the economic calendar, we had data on inflation in Europe. As predicted, there was an acceleration from 1.0% to 1.3%, however, there was almost no market reaction, even though the indicator is not bad for the Eurozone. We are still waiting for statistics from the United States, where the rate of industrial production continues to decline from -0.8% to -1.2%, and the construction of new buildings may decrease by 2.6%, and construction permits by 1.6%. The upcoming trade week, in terms of the economic calendar, begins with a weekend in the United States, where Martin Luther King Day is celebrated. The following days do not have a wide flow of statistical data, but we have a meeting of the ECB, followed by a press conference where the rate will not be touched. There may, however, be juicy details about the further actions of the regulator, which many expect. The most interesting events are displayed below - - - > Wednesday, January 22: USA 16:00 London time - sales in the secondary housing market (m/m) (Dec): PREV. -1.7% - - - > Forecast 0.8% Thursday, January 23 ECB meeting, followed by a press conference Further development Analyzing the current trading schedule, we can see a rapid downward move, although inertial, which has already managed to return the quote to the area of the base of the corrective movement. This is a good sign in terms of resuming the downward movement. If we analyze the market in detail, we will see that at the same time, GBP/USD, against the background of not the best statistics for Britain, sharply began to lose its positions in the form of a correlation. It is worth considering that yesterday's data on the United States did not fully play out in the market, and the current situation perfectly confirms this. In terms of the emotional component of the market, we can see a sharp surge in speculative positions, which is confirmed by the structure of trading candles. Detailing the available trading day by the minute, we can see that before the start of the European session, there was an accumulation process in 1.1130/1.1140. However, at 8:30 London time [time on the trading terminal], there was a surge of activity, quickly overcoming the limits of accumulation. Yesterday's speculators changed their long positions to short ones, as soon as they saw such remarkable inertial candles. The subsequent flood of trading volumes occurred at the time of the breakdown of the morning accumulation, just flying into the current inertia. Partial exits from short positions are already being made. The movement is likely directed towards the range level of 1.1080, however, it faces a minimum of January 14 [1.1104], which can locally put pressure on short positions, and lead to wider fixing of trading operations. In any case, at the moment, the benchmark for most traders is in the face of the range level, as many are eager to break it. I am not sure though if the price will be able to break it now. Based on the above information, we have derived these trading recommendations: - Buy positions will be considered near the range level of 1.1080. In the case of a local rebound, you can also look at the minimum of January 14, again in the form of local operations. - Positions for sale are already available and are being fixed. If we do not have any deals, we can consider a local entry lower than 1.1100 with a prospect to 1.1085 [Risky trade]. The main positions will be considered after the price fixes below 1.1080. Indicator analysis Analyzing different sectors of timeframes (TF), we see that against the background of such a strong inertia, all technical instruments, without exception, turned in the downward direction, signaling sales. Volatility for the week / Measurement of volatility: Month; Quarter; Year The measurement of volatility reflects the average daily fluctuation, based on the calculation for Month / Quarter / Year. (January 17 was based on the time of publication of the article) At the moment, volatility is at 36 points, which is even lower than normal. It is likely that there is still a chance of increasing volatility, just in the phase of the inertial course. Key level: Resistance zones: 1.1180; 1.1300**; 1.1450; 1.1550; 1.1650*; 1.1720**; 1.1850**; 1.2100 Support areas: 1.1080**; 1.1000***; 1.0900/1.0950**;1.0850**; 1.0500***; 1.0350**; 1.0000***. * Periodic level ** Range level ***Psychological level ***** This article is based on the principle of conducting a transaction, with daily adjustments The material has been provided by InstaForex Company - www.instaforex.com |
| Posted: 17 Jan 2020 03:55 AM PST The greased weekend of January 17 does not upset the "bulls" of EUR/USD. For most of the five-day period, euro rose against dollar, thanks to traders' faith in the signing of the trade agreement by Washington and Beijing, as well as the hopes for the "hawkish" rhetoric of the ECB. In reality though, it was worse than expected. Investors doubted whether China will be able to buy $200 billion goods and services from the States more than before. Moreso, the duties on $360 billion of Chinese imports remain in force, and, according to competent Bloomberg sources, Christine Lagarde and her colleagues from the governing council are not afraid of negative rates. In 2017, American exports to China amounted to $186 billion. According to the latest data for 2019, this figure fell to $160 Billion. Wall Street Journal estimates that in order to fulfill its obligations, China must increase purchases of goods and services from the United States to $262 billion in 2020, and to $309 billion in 2021. Theoretically, the colossal numbers should accelerate US GDP, but Wall Street Journal experts, on the contrary, expect it to slow from 2.3% to 1.9%, as business activity in the manufacturing sector continues to fall, and the dynamics of retail sales indicates a reduction in consumer activity. The dynamics of business activity in the manufacturing sector:
There are rumors in the market that due to Boeing problems, the US GDP growth rate in the first quarter may drop to 1.5%, which gives the Nordea Market reasons to forecast a 25bp reduction in the Federal funds rate by March. The ECB, on the other hand, will remain passive in monetary policy, which is a bullish factor for EUR/USD. Expectations of ECB rate changes:
According to the minutes of the last meeting of the Governing Council in 2019, the Central Bank noticed signs of stabilization in the situation, and assessed the risks as less dangerous than before. At the same time, there was an increase in industrial production in the Euro zone by 0.2% in December led by Germany (+0.9%), as well as an acceleration in inflation from 1% to 1.3%, which are good news for the euro. Yes, the German economy has seen its weakest growth since 2013, but it has expanded every year from the past 10 years, which is the longest economic expansion since 1990. In addition, official Berlin forecasts foresee an acceleration of GDP from 0.6% to 1% in 2020. The main events of the week of January 24 will be the first meeting of the ECB in the new year, as well as the release of data on European business activity. If the Central Bank continues to radiate moderate optimism, and purchasing managers' indices go up due to the ceasefire in the US-China trade war, euro's bulls will correct their positions. Technically, as long as the EUR/USD quotes are above the short-term diagonal support and the correction level of 50% of the last rising wave, which corresponds to the 1.11-1.111 area, the situation will continue to be controlled by buyers. A breakthrough of important support will increase the risks of a pullback to the "bullish" medium-term trend in the direction of 1.1065-1.107. EUR/USD, daily chart:
|
| Fractal analysis for major currency pairs as of January 17 Posted: 17 Jan 2020 03:54 AM PST Hello, dear colleagues. For the Euro/Dollar pair, we expect the continuation of the upward structure from January 10 after the breakdown of 1.1151. For the Pound/Dollar pair, we follow the formation of an upward structure from January 14 and the level of 1.2994 is the key support. For the Dollar/Franc pair, the price is in the correction of the downward structure from January 10 and the level of 0.9691 is the key support. For the Dollar/Yen pair, we expect the continuation of the downward cycle from January 8 after the breakdown of 110.40. For the Euro/Yen pair, we expect a resumption of the upward movement after the breakdown of 122.70 and the level of 121.80 is the key support. For the Pound/Yen pair, we expect the subsequent development of the upward cycle from January 3 after the breakdown of 144.53. Forecast for January 17: Analytical review of currency pairs on the H1 scale:
For the Euro/Dollar pair, the key levels on the H1 scale are 1.1204, 1.1177, 1.1151, 1.1115, 1.1087, and 1.1058. We follow the formation of the upward structure from January 10 as the main trend. We expect the upward movement to continue after the breakout of 1.1151. In this case, the goal is 1.1177, and consolidation is near this level. The breakdown of the level of 1.1177 will allow us to count on the movement towards the potential target - 1.1204. The level of 1.1115 is the key support for the top. Its passage by the price will lead to the development of a downward movement. In this case, the first target is 1.1087. We consider the level of 1.1058 as a potential value for the bottom. The main trend is the upward structure from January 10. Trading recommendations: Buy: 1.1153 Take profit: 1.1175 Buy: 1.1178 Take profit: 1.1204 Sell: 1.1113 Take profit: 1.1090 Sell: 1.1085 Take profit: 1.1060
For the Pound/Dollar pair, the key levels on the H1 scale are 1.3243, 1.3178, 1.3126, 1.3082, 1.3027, 1.2994, and 1.2953. We follow the formation of the upward structure from January 14. We expect a short-term upward movement in the range of 1.3082-1.3126. The breakdown of the last value will allow us to count on a move to the level of 1.3178, and consolidation is near this value. We consider the level of 1.3243 as a potential value for the top, upon reaching which we expect a pullback. A short-term downward movement is possible in the area of 1.3027-1.2994, hence there is a high probability of an upward reversal. A breakdown of the level of 1.2994 will lead to the development of a downward movement. In this case, the target is 1.2953. The main trend is the formation of an upward structure from January 14. Trading recommendations: Buy: 1.3082 Take profit: 1.3124 Buy: 1.3127 Take profit: 1.3176 Sell: 1.3025 Take profit: 1.2996 Sell: 1.2992 Take profit: 1.2954
For the Dollar/Franc pair, the key levels on the H1 scale are 0.9691, 0.9667, 0.9650, 0.9623, 0.9597, 0.9581, and 0.9551. We follow the development of the downward cycle from January 10. At the moment, the price is in the correction zone. We expect the downward movement to continue after the breakout of 0.9623. In this case, the target is 0.9597 and in the area of 0.9597-0.9581 is the price consolidation. We consider the level of 0.9551 as a potential value for the bottom, after which we expect a pullback to the top. A short-term upward movement is possible in the area of 0.9650-0.9667 and the breakdown of the last value will lead to a deep correction. The target is 0.9691 and this level is the key support for the bottom. The main trend is the initial conditions for the bottom from January 10, the correction stage. Trading recommendations: Buy: 0.9650 Take profit: 0.9665 Buy: 0.9668 Take profit: 0.9690 Sell: 0.9621 Take profit: 0.9598 Sell: 0.9580 Take profit: 0.9551
For the Dollar/Yen pair, the key levels in the H1 scale are 111.38, 110.78, 110.39, 109.81, 109.58, and 109.23. We follow the development of the upward cycle from January 8. At the moment, we expect to reach the level of 110.39. The breakdown of which will allow us to count on the movement to the level of 110.78 and consolidation is near this value. The breakdown of 110.80 should be accompanied by a pronounced upward movement. The potential target is 111.38. A short-term downward movement is possible in the range of 109.81-109.58 and the breakdown of the last value will lead to an in-depth correction. The target is 109.23 and this level is the key support for the top. The main trend is the upward cycle of January 8. Trading recommendations: Buy: 110.40 Take profit: 110.76 Buy: 110.80 Take profit: 111.35 Sell: 109.80 Take profit: 109.58 Sell: 109.55 Take profit: 109.25
For the Canadian dollar/Dollar pair, the key levels on the H1 scale are 1.3157, 1.3126, 1.3112, 1.3090, 1.3062, 1.3040, and 1.3015. We follow the development of the upward cycle from January 7. We expect the upward movement to continue after the breakdown of 1.3090. In this case, the target is 1.3112 and in the area of 1.3112-1.3126 is the consolidation. We consider the level of 1.3157 as a potential value for the top; upon reaching this level, we expect a downward rollback. The short-term downward movement, as well as consolidation, are possible in the area of 1.3040-1.3015. The breakdown of the latter value will lead to the formation of initial conditions for the downward cycle. In this case, the potential target is 1.2988. The main trend is the upward cycle from January 7, the correction stage. Trading recommendations: Buy: 1.3090 Take profit: 1.3112 Buy: 1.3126 Take profit: 1.3155 Sell: 1.3038 Take profit: 1.3017 Sell: 1.3013 Take profit: 1.2990
For the Australian dollar/Dollar pair, the key levels on the H1 scale are 0.6972, 0.6955, 0.6933, 0.6915, 0.6887, 0.6871, 0.6851, 0.6827, and 0.6793. We follow the formation of the upward structure from January 9. The short-term upward movement is expected in the area of 0.6915-0.6933 and the breakdown of the last value will lead to a pronounced movement. The target is 0.6955. We consider the level 0.6972 as a potential value for the top; upon reaching this value, we expect consolidation, as well as a downward rollback. We expect a short-term downward movement in the range of 0.6887-0.6871 and the breakdown of the last value will lead to the subsequent development of the downward structure. The first target is 0.6851. We consider the level of 0.6793 as a potential value for the bottom, which we expect to move to after the breakout of 0.6825. The main trend is the downward structure from December 31, the formation of the potential for the top from January 9. Trading recommendations: Buy: 0.6915 Take profit: 0.6930 Buy: 0.6935 Take profit: 0.6955 Sell: 0.6887 Take profit: 0.6873 Sell: 0.6870 Take profit: 0.6852
For the Euro/Yen pair, the key levels on the H1 scale are 123.89, 123.32, 123.06, 122.33, 122.09, and 121.80. We follow the development of the upward cycle from January 8. We expect further upward movement after the breakdown of 122.70. In this case, the first target is 123.06 and in the area of 123.06-123.32 is the short-term upward movement, as well as consolidation. A breakdown of the level of 123.35 will lead to a movement to a potential target of 123.89, from this level, we expect a pullback downwards. A short-term downward movement is possible in the area of 122.33-122.09 and the breakdown of the last value will lead to an in-depth correction. The target is 121.80 and this level is the key support for the upward structure. The main trend is an upward cycle from January 8. Trading recommendations: Buy: 122.70 Take profit: 123.05 Buy: 123.06 Take profit: 123.30 Sell: 122.33 Take profit: 122.10 Sell: 122.07 Take profit: 121.84
For the Pound/Yen pair, the key levels on the H1 scale are 146.41, 145.55, 144.93, 144.53, 143.62, 143.26, and 142.59. We follow the development of the upward structure from January 3. We expect a short-term upward movement in the area of 144.53-144.93. The breakdown of the latter value will lead to a movement to the level of 145.55, near which we expect consolidation. We consider the level of 146.41 as a potential value for the top, from which we expect a rollback down. A short-term downward movement is possible in the area of 143.62-143.26. The breakdown of the last value will lead to the formation of initial conditions for the downward cycle. In this case, the potential target is 142.59. The main trend is the upward structure from January 3. Trading recommendations: Buy: 144.53 Take profit: 144.91 Buy: 144.95 Take profit: 145.55 Sell: 143.62 Take profit: 143.28 Sell: 143.24 Take profit: 142.65 The material has been provided by InstaForex Company - www.instaforex.com |
| Trading recommendations for GBP/USD - prospects for further movement Posted: 17 Jan 2020 02:03 AM PST From the point of view of a comprehensive analysis, we see a continuing upward interest from the area of the psychological level of 1.3000, where the quotes had previously found a foothold. In fact, we continue to observe the development of the theory of the Zigzag-shaped model [03.12.19-14.01.20], where the subsequent measure almost reached the control value. The most remarkable situation is that for several weeks there has been a gradual compression of the quote amplitude, which is just expressed in the Zigzag-shaped model. That is, the first correction phase of the Zigzag-shaped model had a value of 609 points, the second phase was already 329 points. The third phase has not yet arrived, since the pulse cycle has not yet been completed, but the deceleration is already evident. Hence, many traders agree that the market is preparing a platform to greatly accelerate quotes, which may come in the near future. In terms of volatility, we have a kind of confirmation of the previously spoken words, that is, there is a slowdown in average daily indicators [95; 79; 57.57 points] from the beginning of the week. From the point of view of the emotional component, we see a similar picture, but at the same time, the coefficient of speculative positions is still high. Analyzing the past minute by minute, we see a general upward move, in the structure of which only at 14: 00-15:30 [UTC+00 time on the trading terminal] there were pulsed candles. The end of the trading day was in terms of narrow amplitude in the region of 20 points. As discussed in a previous review, traders have been in long positions since Tuesday, where they entered trades from a value of 1.3215. Further manipulations were in terms of conducting transactions, where the first partial fixation point came in the area of 1.3050 with the subsequent movement of the restrictive order. The full perspective was considered in the region of 1.3100-1.3122. Considering the trading chart in general terms [the daily period], we see the same ongoing process of upward movement from September last year. If you analyze the history of the chart, in particular, from the end of 2016, that is, a characteristic similarity. Thus, I advise you to consider it on the daily chart. The news background of the past day had statistics on the United States, which turned out to be much better than forecasts. So, the indicators for applications for unemployment benefits declined by 46 thousand [Repeated -36 thousand. The forecast was -11 thousand; Primary -10 thousand, the forecast was + 5 thousand.]. At the same time, we have very good retail sales figures, which were supposed to slow down, according to forecasts, from 3.3% to 2.9%, but instead we saw an acceleration to 5.8%. The reaction of the market to the statistics was extremely surprising, as the news in the United States came out exclusively in positive tones, which clearly should have influenced the growth of the dollar, but there it was. The growth of the dollar was extremely sluggish in comparison with the single currency during the publication period, which showed activity, but more on that in the next EUR/USD article. In terms of a general informational background, we had no fatal noises. The market continues to discuss the previously signed first phase of the trade deal between the USA and China, and in Europe they grieve over Britain lost from the union. In turn, members of the European Parliament urge the EU to learn from Brexit. Today, in terms of the economic calendar, we had data on retail sales in Britain, where we expected acceleration to 2.6%. As a result, we got 0.9%, which locally put pressure on the pound. In the afternoon, we are waiting for statistics from the United States, where the rate of industrial production continues to decline from -0.8% to -1.2%, and construction of new buildings can be reduced by 2.6%, and building permits by 1.6%. The upcoming trading week in terms of the economic calendar begins with a weekend in the United States, where Martin Luther King Day is celebrated. The following days have a stream of statistical data, as well as a meeting of the ECB, where there may be interesting details. The most interesting events displayed below ---> Tuesday January 21 Great Britain 9:30 Universal time - Unemployment Rate: Prev 3.8% ---> 3.9% forecast United Kingdom 9:30 Universal time - Change in the number of applications for unemployment benefits (Dec): Prev 28.8K ---> Forecast 24.5K Wednesday, January 22 United Kingdom 9:30 Universal time - Retail Sales (YoY) (Dec): Prev 1.0% ---> Forecast 2.6% USA 15:00 Universal time - Sales in the secondary housing market (m / m) (Dec): Prev -1.7% ---> Forecast 0.8% Thursday, January 23 ECB meeting, followed by a press conference Friday January 24th Great Britain 9:30 Universal time - Composite PMI Index Great Britain 9:30 Universal time - Services PMI Further development Analyzing the current trading chart, we see that the quote still adheres to the upward mood, locally touching the forecasted area of 1.3100-1.3122. In fact, the Zigzag-shaped model has reached the area of its embodiment, which is good news for most traders. Now, we are faced with the task of understanding how the quotes will behave at a given value, whether there will be a stop with the third phase, where the slowdown will be confirmed. In terms of volatility, we are still in an extremely sluggish state, although it is enough for speculators, but many are waiting for acceleration. By detailing the time interval that we have per minute, we see that the main fluctuation began to occur in anticipation of the publication of data on Britain, having rather remarkable impulse candles. In turn, traders continue to work locally with long positions from the value of 1.3015. Moreover, fixes move to the full volume, as the price has come close to the forecasted area. Having a general picture of actions, it is possible to assume that the theory of the Zigzag-shaped model played a significant part in trading, and there is still a chance of keeping it. Thus, traders are closely monitoring the momentum in order to work on a possible inertial course). If the theory of acceleration is confirmed, we can see a full-fledged inertial move that breaks the boundaries of the Zigzag-shaped model. Based on the above information, we derive trading recommendations: - There were positions for the purchase from the value of 1.3015, and now, deals have already been fixed. - We consider selling positions in the reverse phase from 1.3050, to 1.3000-1.2985. A deeper move is considered if the price is fixed lower than 1.2955. Indicator analysis Analyzing a different sector of timeframes (TF), we see that the indicators of technical instruments have an upward interest in all time intervals, which reflects the current tact of the trading model. Volatility per week / Measurement of volatility: Month; Quarter; Year Measurement of volatility reflects the average daily fluctuation, calculated for the Month / Quarter / Year. (January 17 was built taking into account the time of publication of the article) The current time volatility is 53 points, which is already better than the day before. It is likely to assume that acceleration of volatility will happen soon and so, it is worth being prepared for it. Key levels Resistance zones: 1.3180 **; 1.3300 **; 1.3600; 1.3850; 1.4000 ***; 1.4350 **. Support Areas: 1,3000; 1.2885 *; 1.2770 **; 1.2700 *; 1.2620; 1.2580 *; 1.2500 **; 1.2350 **; 1.2205 (+/- 10p.) *; 1.2150 **; 1,2000 ***; 1.1700; 1.1475 **. * Periodic level ** Range Level *** Psychological level **** The article is built on the principle of conducting a transaction, with daily adjustment The material has been provided by InstaForex Company - www.instaforex.com |
| Is Euro playing cat and mouse with the dollar? Posted: 17 Jan 2020 01:59 AM PST At the end of the week, the European currency cheered up, after a worthy competition with the dollar. Its classic rival for the EUR / USD pair is also on the alert, strengthening against the backdrop of the relatively successful signing of the first phase deal. Experts expect to achieve a balance in tandem, and these hopes can be justified. According to experts, the euro tried to capitalize on the signing of an agreement between Washington and Beijing, but these actions are more reminiscent of stealth maneuvers, like a cat and mouse game. However, analysts warn that it is better not to play such games with the dollar. Recall that on Wednesday, January 15, the leaders of the two leading powers signed a document on the first phase of the trade deal. The negotiation process associated with it lasted more than six months. According to experts, this event did not provide significant support to the greenback. The pound, on the other hand, took advantage of this and tried to break out into the leaders in the EUR/USD pair and thus teasing his rival. According to the agreement, within two years, the Celestial Empire pledged to import a number of industrial and agricultural goods from the United States, as well as energy resources worth $200 billion. In response, the United States completely refused to introduce duties for the PRC, which were to enter into force in December 2019. According to US President Donald Trump, the question of canceling the remaining tariffs will be discussed in the second phase of the trade truce. Experts came to the conclusion that the main negotiations on the most complex and strategically important issues are still ahead, which has disappointed the bulls on the dollar. Fortune may be on the side of the "bears," since the second stage of trade negotiations is likely to take place harder and longer than the first. In such a situation, experts assure that the dollar bulls will not be able to develop and actively maintain the upside trend. The sword of American-Chinese trade relations will again hang over the greenback, which could knock the soil out of the hands of USD buyers. The positive outcome of the negotiations of the second phase is doubtful for most experts and they believe that Beijing is unlikely to make significant concessions to Washington. The successful completion of the second phase of the trade transaction is impossible without significant changes in the industrial policy of China. At the same time, enhanced access for US financial companies to the Chinese market is provided. On the other hand, analysts are not sure that the negotiations of the second stage will end before November 2020, that is, before the presidential election in America. The current situation is disorganizing the dollar, which on Friday, January 17, pulled down a pair of EUR/USD. According to experts, the classic tandem barely overcame a critical milestone, forming the so-called weak "golden cross" when entering the Ichimoku cloud. Currently, the EUR/USD pair has returned to critical levels, continuing to stagnate around 1.1138–1.1139. Earlier, the tandem rose steadily reaching 1.1149, which makes it more painful to fall. Analysts summarize that the EUR/USD pair was exhausted by the end of the week. In general, the fundamental background is in favor of the dollar, which causes the euro to try to prevent this. At a certain point, experts considered that the signing of the first phase of the trade transaction played into the hands of the single currency, but these conclusions were incorrect. However, taking into account the current volatility of the EUR/USD pair, the design of the US-Chinese agreement did not help any of the currencies. At the end of the week, the euro received some support from the ECB. According to the minutes of the December meeting, the regulator chose to take a wait and see attitude. Representatives of the ECB reacted to the latest macroeconomic reports with cautious optimism. This primarily concerns the recovery of core inflation in the eurozone. Representatives of the regulator believe that if the situation worsens, the monetary policy of the ECB can be adjusted. In general, the current situation in the eurozone is far from positive. On Thursday, January 16th, the consumer price index for December last year was published in Germany, which somehow did not change, remaining within 1.5%. At the same time, the general level of inflation in the eurozone countries has also budged. The weakness of German inflation, as well as European inflation, is an extremely negative factor for the single currency, experts also stressed, it almost miraculously keeps itself from falling further. They believe that in order to maintain balance in the EUR/USD pair, a correction will be required. They also added that the protracted trade war between the USA and China played a key role in the subsidence of the European economy, at the same time, the US economy turned out to be more stable, having sustained all the blows. All thanks to three Fed interest rate cuts. According to analysts, at the moment, the euro is striving for equilibrium, while at the same time pushing the US dollar from the leading position. Such a contradiction gives rise to insecurity, which gives the impression that the euro prefers circumventive maneuvers. However, the strong classic EUR/USD tandem quickly reaches a mutually beneficial balance, which is beneficial for market participants, experts concluded. The material has been provided by InstaForex Company - www.instaforex.com |
| Technical analysis recommendations for EUR/USD and GBP/USD on January 17 Posted: 17 Jan 2020 01:22 AM PST Economic calendar (Universal time) We are waiting for statistics from the eurozone in the morning. Among the important ones, it can be noted 9:30 (retail sales, UK) and 10:00 (consumer price index, EU). After lunch, the time will come for news from overseas (USA). The most significant indicators will be published at 13:30 (the number of issued building permits) and 15:00 (the number of open vacancies in the labor market). EUR / USD Yesterday, the players on the decline, having tested the resistance of the final level of the daily dead cross (1.1172), made an attempt to complete the rise again and move to an active decline. Today, we can expect a continued decline in the case of updating yesterday's low (1.1128). At the same time, the main bearish landmarks remain in their places - 1.1110 (weekly levels) - 1.1065 (upper border of the daily cloud + weekly Kijun) - 1.1022 (lower border of the daily cloud + weekly Fibo Kijun). If the bears are unable to continue the pair, they will most likely remain within the zone of attraction in the near future, formed by the key levels of the daily dead cross (1.1141-53) and the monthly short-term trend (1.1144) . With the decline, players on the decline breakthrough the first important support of the lower halves yesterday. Today, this level (central Pivot level) forms a resistance located at 1.1145. The return of the level by the bulls and reliable fixing above level out most of yesterday's conquest of the bears. As a result, there will be uncertainty, with the prospect of further strengthening the players to increase. Currently, the issue of overcoming the second key support is being resolved - the weekly long-term trend (1.1133). A firm hold below may inspire players to decline to continue to decline. Further bearish reference points within the day may be the support of the classic Pivot levels (1.1118 - 1.1100 - 1.1073). GBP / USD An upward correctional upward turn is realized to its first target - a daily short-term trend (1.3082). Quite often, a full correction is limited to this level. Therefore, the formation of rebound will return the bearish opportunities and prospects. The nearest support is located today at 1.3201 (Senkou Span A), and then, we can consider further bearish signs after consolidation in the daily cloud. In the case of breaking through the resistance of the daily Tenkan (1.3082), the interests of the development of the upward correction will be directed to other levels of the daily dead cross (1.3137 - 1.3209 - 1.3281), and the correction may be the elimination of the existing Ichimoku cross. The players on the upside retain key lower halftime support and continue to increase. Today, resistances are the classic Pivot levels located at 1.3096 - 1.3118 - 1.3153. At the same time, key supports are now located at 1.3061 (central Pivot level) and 1.3029 (weekly long-term trend). Consolidation below will change the existing balance of forces and may serve as a beginning for the resumption of decline. Ichimoku Kinko Hyo (9.26.52), Pivot Points (classic), Moving Average (120) The material has been provided by InstaForex Company - www.instaforex.com |
| Technical analysis of EUR/USD for January 17, 2020 Posted: 17 Jan 2020 12:55 AM PST Overview: The EUR/USD pair: Pivot: 1.1162. Time frame: sideways. The market showed signs of instability 3 day ago. Amid the previous proceedings, the price is still trading between the levels of 1.1162 and 1.1085. The daily resistance and support are seen at the levels of 1.1162 and 1.1085 respectively. In consequence, it is recommended to be cautious while placing orders in this area. Thus, we should wait until the sideways channel has completed. The price spot of 1.1162 remains a significant resistance zone. Therefore, there is a possibility that the EUR/USD pair will move to the downside and the fall structure does not look corrective. Resistance is seen at the level of 1.1162 today. So, sell below 1.1162 with the first target at 1.1085 to test last week's bottom. In overall, we still prefer the bearish scenario as long as the price is below the level of 1.1162. Furthermore, if the EUR/USD pair is able to break out the bottom at 1.1085, the market will decline further to 1.1038. However, it would also be sage to consider where to place a stop loss; this should be set above the second resistance of 1.1206. we still prefer a bearish scenario at this period. The material has been provided by InstaForex Company - www.instaforex.com |
| Posted: 17 Jan 2020 12:51 AM PST Good day, dear traders! I present you a trading idea for gold. After the conflict in Middle East, gold entered the zone of a wide flat with fairly clear borders on the extremes of 1563-1535. You can call it a channel: In such flat channels, they usually trade from false breakdowns of the flat borders. I will consider 2 scenarios: Scenario #1: This plan involves capturing the stops of all sellers starting from January 10. Then, with a false breakdown, hold the shorts to the two goals shown in the chart above. Scenario #2: This plan is related to the capture of the local area over the past two days. With a false breakdown, hold longs to sellers' stops from January 10. After that, a false breakdown of 1563 from Scenario #1 will be included :) Good luck in trading and control your risks! P.S. The green on the charts indicate the US sessions. The material has been provided by InstaForex Company - www.instaforex.com |
| Simplified wave analysis of EUR/USD and GBP/JPY for January 17 Posted: 17 Jan 2020 12:47 AM PST EUR/USD Analysis: The price of the euro has been moving down since the end of last year. Judging by the wave level of the first part of the wave, a correction is formed for the entire previous trend section. In the wave structure, the middle part (B) is nearing completion. Forecast: Today, the formation of a reversal and the beginning of a price decline is expected. At the current session, an attempt to re-pressure the resistance is not excluded. You can wait for the start of an active downward move at the end of the day. Potential reversal zones Resistance: - 1.1150/1.1180 Support: - 1.1090/1.1060 Recommendations: During the session, short-term purchases of euros are possible today. It is safer to refrain from trading while the rise is completed, and after confirming the reversal, look for signals to sell the pair.
GBP/JPY Analysis: A downward correction of the trend wave has been developing on the cross chart since mid-December. The movement structure is not complete. It is nearing the end of the middle part (B). The price is located at the upper edge of the large-scale reversal zone. Forecast: Over the next day, the pair's upward trend is expected to be completed, the conditions for changing the course are formed, and the pair's downward trend is expected to start. The expected lower limit of the daily range is shown by the calculated support. Potential reversal zones Resistance: - 144.10/144.40 Support: - 143.30/143.00 Recommendations: Purchases of the pair today can be unprofitable. It is recommended to pay attention to the emerging signals of selling the instrument on the trading systems you use.
Explanations: In the simplified wave analysis (UVA), waves consist of 3 parts (A-B-C). The last incomplete wave is analyzed. The solid background of the arrows shows the formed structure and the dotted background shows the expected movements. Note: The wave algorithm does not take into account the duration of the tool's movements in time! The material has been provided by InstaForex Company - www.instaforex.com |
| Posted: 17 Jan 2020 12:42 AM PST On January 16, the EUR / USD pair lost about 10 basis points and already began to move away from the highs reached this time. The wave markings have not changed much over the past few days, given the very weak activity of the market. I still expect the construction of a downward wave y, which should bring the instrument to the 10th figure and below. However, it should be recognized that the current wave marking is completely ambiguous and may require periodic changes and adjustments. Fundamental component: The news background for the instrument was a bit controversial on Thursday. I already wrote about inflation in Germany yesterday, which has not changed compared to November 2019 and amounted to 1.5%. But today, we have to find out what level of inflation will be recorded in the entire eurozone in December. Markets expect to see 1.3% y / y, all forecasts of various analytical agencies indicate this. This value cannot be called high, so it is unlikely that demand for the euro will increase today after the release of the economic report on inflation. However, statistics in America pleased sellers again. Although the main indicator of retail sales in December did not exceed the forecast of + 0.3% m / m, it turned out to be better than sales excluding automobiles + 0.7% m / m. The evening performance by Christine Lagarde was left unattended, since the chairman of the ECB very superficially hooked on the topic of monetary policy, without reporting anything specific. Today, I recommend paying attention to the report on changes in industrial production in the USA, as well as the consumer confidence index there, in addition to inflation in the EU. Instrument sellers may be disappointed today if industrial production declines in America in December. This will mean that not only the European Union is experiencing problems with the production sector, but America too. And the consumer confidence index will show in which direction the attitude and level of trust of ordinary consumers in the US economy has changed. I would also like to note separately that China and the United States signed the first stage of the trade agreement, which could be the beginning of the end of the trade war. General conclusions and recommendations: The euro-dollar pair allegedly completed the construction of the upward trend section. Thus, I would recommend resuming sales of the instrument with targets located near the levels of 1.1034 and 1.0982, which corresponds to 76.4% and 100.0% Fibonacci, on the new MACD signal "down", which is already present. At the same time, a new successful attempt to break through the level of 23.6% will most likely indicate that markets are not ready for further sales of the instrument. GBP / USD On January 16, the GBP / USD pair increased by 40 basis points and continues to move away from previously reached lows near the level of 38.2% Fibonacci. Wave 3 also does not appear to be completed, so I expect its construction to resume with targets below the 38.2% Fibonacci level. At the same time, the entire wave marking may require corrections given the too long construction of the internal correctional wave in structure 3, but so far I am counting on the option of building a new pulsed bearish wave. Fundamental component: The news background for the GBP / USD instrument was more or less neutral for the pound on Thursday. At the same time, buyers of the pound / dollar instrument should not relax, as the report on retail sales will be released today, which may fix a new discrepancy between market expectations and reality. Let me remind you that earlier this week reports on GDP, inflation, as well as on industrial production in Britain failed miserably. Even if today retail sales show a good increase, this is unlikely to change the general picture of things. By the way, I must say that the pound has not really fallen and amid this disappointing statistics. Demand for the British this week, on the contrary, increased, but not decreased. But at the same time, market activity dropped markedly. On the whole, this set of various factors results in a rise in the British so far, but I think General conclusions and recommendations: The pound / dollar instrument continues to build a new downward trend. I recommend selling the instrument again with targets located near the level of 1.2764, which corresponds to the Fibonacci level of 50.0%, with the new MACD signal "down", as wave 3 does not yet appear to be fully equipped. The material has been provided by InstaForex Company - www.instaforex.com |
| Trader's Diary: EURUSD on 01/17/2020, Market condition Posted: 17 Jan 2020 12:36 AM PST
Correct assessment of market conditions is the key to successful trading. The truth is, if you trade a trend system in a long range, then "you will not collect bones" as they say it. Similarly, if you try to trade a counter-trend model on a strong trend, the trader will face big problems. EURUSD: On the daily chart above, the upper level of 1.1240 is clearly visible that half the trading day remains today so that the level becomes a full weekly one. So, we have a range. That means, we trade a retraceable, counter-trending model with essentially any parameters as long as there is no trend, then this will work. Simply put this way, we sell from above, we buy from below. Important: What will be a signal for a change in market conditions? Key points: Top 1.1240, Bottom 1.09990. (Why is the bottom not 1.1085? Because 1.1085 is the only daily level. Sales on the breakdown of 1.1085 are quite possible, but leaving the range is below 1.0999). The material has been provided by InstaForex Company - www.instaforex.com |
| Democrats are not giving up their hopes (EUR/USD and GBP/USD review on 01/17/2020) Posted: 17 Jan 2020 12:33 AM PST The single European currency as well as the pound behaved in completely different ways again. More precisely, they behaved in approximately the same way in the first half of the day - they grew slightly. However, it was already in the afternoon when the single European currency began to decline in price, while the pound stood still. Moreover, the pound generally began to grow a little later. So, you don't have to get bored. The day began with the publication of inflation data in Germany, which is the latest in anticipation of the publication of data for the entire euro area. Now, inflation rose from 1.1% to 1.5% in Europe's largest economy. Not only is it the largest economy in Europe, but other major countries are also recording an increase in inflation, so it is not surprising that the single European currency has gradually strengthened its position. Inflation (Germany): But then the euro confidently went down, and American statistics are to blame for this, which turned out to be significantly better than the most daring forecasts. Thus, the total number of applications for unemployment benefits decreased by 46 thousand, instead of decreasing by 6 thousand. In particular, the number of repeated applications for unemployment benefits decreased by 36 thousand, although a decrease of 11 thousand was expected. Moreover, the number of initial applications for unemployment benefits, decreased by 10 thousand instead of increasing by 5 thousand. However, the most striking data was on retail sales. The growth rate of which accelerated from 3.3% to 5.8%, although they expected a slowdown to 2 ,9%. And if you recall the recent rise in inflation in the United States, then this is just a fantastic combination in combination with a significant increase in consumer activity. Retail Sales (United States): Such caution is caused by two factors at once. In particular, the Democrats still decided to continue their war with Donald Trump, transferring materials on impeachment to the Senate. Although it is obvious that the Republicans, who have a majority in the Senate, will wrap up this matter, because otherwise they will not have time to pick up a new candidate for president. Yes, even the accusations themselves look simply ridiculous, since the main thing is that Donald Trump allegedly tried to use his position to get incriminating evidence against Joseph Biden, who, only by coincidence, is the main candidate for the presidency from the Democrats. Of course, it sounds just awful, and this is an outrageous example of abuse of power. However, the Democrats do not discuss such an interesting point as the fact that if they were looking for incriminating evidence, that means there is something to look for. It turns out that Donald Trump is charged with an attempt to find out if his competitor was involved in a corruption scandal. At the same time, Joseph Biden himself and his possible participation in the corruption scheme are not considered at all. To simply put it, imagine that the bully who broke the window of your car sues you for your request to your neighbor to submit photos of how this bully carries out his evil deed. At the same time, no one is planning to judge the bully himself. It is more like Alice in Wonderland. In any case, despite the absurdity of what is happening, the very fact that the Democrats still decided to transfer the matter to the Senate adds nervousness, which restrained the dollar. Another intriguing moment was the intention of the European Union to sue the arbitration court of the World Trade Organization over the fact that the agreement between the United States and China, horrifyingly, violates not only the rules of the organization, but also the principles of free trade. At the same time, Europe threatened that the Old World would be forced to take retaliatory measures in the form of a substantial increase in trade duties and the introduction of barrage measures in the form of quotas for imported goods from the United States and China, if Washington and Beijing did not refuse this deal. In short, trade wars will not go anywhere and will only grow. Apparently, the two above factors will continue to put pressure on the dollar together with statistics, which will also lead to a weakening dollar. Thus, everything can begin already with the publication of data on retail sales in the UK. The growth rate of which can accelerate from 1.0% to 3.2%. This will alleviate the negativity due to the recent slowdown in inflation, as well as dispel fears that emerged after major retailers reported failed Christmas sales. The sales failure occurred for the simple reason that people shop less and increasingly order home delivery of goods in various online stores. Retail Sales (UK): After that, inflation data in Europe will be published, which may accelerate from 1.0% to 1.3%. However, there is a possibility that the data will be better than forecasts, as indicated by inflation data in the largest countries of the euro area. At the same time, Christine Lagarde recently sent letters to the members of the European Central Bank's board forbidding any comments before the upcoming meeting of the regulator's board. In addition, it also appears that the leadership of the European Central Bank sees signs of a change in macroeconomic dynamics, which may serve as a reason for revising the current monetary policy. However, no one dares to talk about it ahead of time, apparently wanting to first receive confirmation of their assumptions. Moreover, even hints of such shifts will lead to panic in the markets that no one needs. But the most important thing here is that if we are talking about changing the parameters of monetary policy, then only in terms of tightening it and rising inflation will be just one more confirmation of these assumptions. Inflation (Europe): In turn, American statistics will not help the dollar, and even worsen its situation. So, the volume of construction should be reduced by 2.6%. But much worse is the fact that the number of construction permits issued may be reduced by 1.6%. That is, it is not only about reducing construction right now, but also that it will continue to decline. Moreover, the decline in industrial production may deepen from -0.8% to -1.2%. To simply put it, American statistics will be a dull sight today. Industrial Production (United States): Due to these factors, it is worth waiting for the next attempt of the single European currency to reach the level of 1.1175. The pound can increase to 1.3150, first of all, against the background of a serious growth in retail sales, and then pushed by American statistics. |
| USD/JPY. Unnecessary yen: Japanese currency is actively losing value Posted: 16 Jan 2020 11:32 PM PST The dollar/yen pair reached semi-annual highs, gaining a foothold in the 110th figure. The upward trend for the pair has been actively developing since the beginning of 2020 - the price has stepped over three hundred points for a week and a half. Against the backdrop of geopolitical agreement, the yen is not in demand, while the currency has no arguments for its growth. At the same time, protective assets (with the exception of the franc) show a downward trend in response to recent developments related to US-China relations, Brexit and Iran. The Japanese currency is no exception. The latest surge in interest in the Japanese currency was January 7-8, when the world was on the verge of a "big war." The killing of the Iranian general by the Americans excited the markets: the USD/JPY pair instantly collapsed by almost 100 points, gold reached three-year highs, and the cost of a barrel of Brent oil soared to $ 70. However, the panicked mood quickly became unsuccessful. It became clear within a few days that Iran would not go to a large-scale confrontation: the Iranian authorities announced that "retaliation has come" having fired at the American air base in Iraq. Washington, in turn, did not respond to this shelling, transferring the "dialogue" to the economic plane: the States increased sanctions pressure on Tehran. The reaction of the yen was not happening quickly. After reaching many-month lows (107.66), the USD/JPY pair turned around and began to actively gain momentum, with virtually no price pullbacks. After all, there was a pause in the trade war between the United States and China after the resolution of the US-Iran conflict. And although the parties could not resolve the most difficult issues within the first stage of the negotiations, the yen lives on today - and today, the trade war has been suspended, despite the additional tariffs introduced by the States last year. The situation with Brexit is similar: the probability of Britain's nominal exit from the EU on January 31 is 100%, and this fact also provides indirect support to the USd/JPY pair. At the same time, the yen ignores the risks associated with the prospects for further negotiations in the transition period. Thus, the main conflict situations that worried the traders of the currency exchange market was not achieved one way or another. Well, at least for today. Therefore, it is not surprising that the Japanese currency, as a defensive asset, has ceased to be in strong demand from investors. Moreover, the USD/JPY pair began to focus on other fundamental factors - primarily related to the prospects of monetary policy and macroeconomic reports. Here, the yen leads a deliberately losing game - the Japanese regulator does not get tired of repeating that it is ready to further mitigate monetary policy if the achievement of the target inflation level is in jeopardy. In this regard, the Federal Reserve looks more predictable: the Fed members put the issue of lowering rates on an "indefinite pause" at the end of last year, and it seems that this pause will be in effect (at least) until the end of 2020. The first meeting of the Japanese Central Bank will take place this year which is particularly next Tuesday, January 21. According to the vast majority of experts, the regulator will maintain monetary policy in its original form. It is worth noting here that inflation in Japan shows an extremely weak, but still growth: according to recent data, the consumer price index rose to 0.5% (in annual terms), whereas in the previous month this indicator could only increase to 0. 2%. On a monthly basis, inflation grew by a modest 0.2%. The consumer price index excluding the cost of fresh food (the main indicator for the Japanese regulator) increased by 0.4% year on year after increasing to 0.2%. In general, this dynamics did not come as a surprise to most experts - all indicators came out at the forecast level. According to rumors, the Bank of Japan will revise its economic forecast for the fiscal year (which begins in April) at its January meeting. This need arose due to an increase in the package of incentive measures on the part of the government (their total amount is $ 122 billion). According to preliminary data, the budget package will increase the country's GDP by 1.4% over the next fiscal year (period 2020-2021). According to other sources, the regulator is unlikely to make significant changes to the current forecast, as some members of the Bank of Japan are skeptical of the effectiveness (at least in the medium term) of incentive measures. Thus, traders of the USD/JPY pair will most likely ignore the fact of revising the economic forecast for the next fiscal year. The rhetoric of Haruhiko Kuroda may also have a weak effect on the dynamics of the pair. In one of his interviews, he recently said that he saw a number of signs of weakening Japanese exports, production and corporate business sentiment. On the other hand, he noted the general growth of the Japanese economy. Most likely, he will voice a similar position at the January meeting. This is the usual rhetoric of Kuroda, which has been heard more than once. Therefore, the market most likely does not focus on it. Summarizing the above, it is worth noting that the dollar / yen pair retains the potential for its further growth. In addition, the yen will remain face to face with an external fundamental background, if Kuroda does not announce any steps regarding a change in monetary policy (which is extremely unlikely). In the absence of "global force majeure" (geopolitical conflicts), the Japanese currency will continue to follow the dollar. The closest target of the upward movement is the level of 111.20 (at this price point, the boundaries of the Kumo cloud closed on the monthly chart). The material has been provided by InstaForex Company - www.instaforex.com |
| Posted: 16 Jan 2020 11:24 PM PST 4-hour timeframe
Technical data: Senior channel of linear regression: upward direction Junior channel of linear regression: sideways direction Moving average (20; smoothed) - sideways direction CCI: 108.4670 In recent days, the British pound has been moving without any logic. Because of this, we believe that the current period should be waited out, trying not to take any risks. To begin with, the volatility of the GBP / USD pair fell to 69 points per day, which is extremely low for this instrument. Secondly, there is no flat, but a vague upward movement instead, which is unlikely to lead to the formation of an upward trend. One gets the impression that the market has lost "ground" and does not understand where it should start making trading decisions now. In addition, the macroeconomic statistics of UK continue to be not just frustrating, but disastrous as well. The key indicators of the economy such as inflation, GDP and industrial production were extremely weak. Traders also have to solve a dilemma, as it will not be possible to constantly sell the same currency. Because of this, the pound gets such temporary respites, which are not fundamentally justified in any way. On the last trading day of the week, UK will publish a report on retail sales for December. Unlike the retail sales in the US, Albion is expected to grow by as much as 0.7% m / m, as well as 2.6% y / y. However, do not let such high numbers mislead traders. A month earlier, retail sales decreased by 0.6%. A month before that, there was an increase of 0%, a month before, a decrease of 0.1%, and a month earlier, a drop of 0.4%. Thus, after 4 consecutive failed months, one month with an increase does not indicate any positive trend. Moreover, the forecast of + 0.6% still needs to be justified, and any value below + 0.6% m / m will be considered by traders as not high enough. Meanwhile, in the US, in addition to the report on industrial production, the consumer confidence index from the University of Michigan will be published today. This may be a neutral forecast, but it holds a high value for market participants. Because of this, the pound, in the first half of the day, should be dependent on retail sales, and in the second, on statistics from overseas. It "should", but there's no guarantee that it will. Given the illogical nature of the current movement, we can assume that the reaction of traders will simply not follow today's reports. Despite the consolidation of the pair's quotes above the moving average, we do not believe that there is a sufficient number of chances for a serious upward movement. In the current situation, how can we not once again pay attention to the fact that at the end of the month, there will be a regular meeting of the Bank of England, where members of the monetary committee will again have to solve a serious question : lower the rate immediately, or look back at Brexit, which will take place the next day, and for fear of negative consequences, save such a serious tool in case of emergency? We believe that the probability of lowering the key rate at the next meeting is low, solely due to the fact that Brexit, at the time of January 30, has not yet begun. From the point of view of macroeconomic statistics, the rate should have been lowered a couple of months ago but the head of the Central bank, Mark Carney, and the company did not take this step. At the same time, the January meeting will be Carney's last, where he can finally go on easing the monetary policy. Basically, the next meeting of the British Parliament will be extremely interesting. From a technical point of view, a new upward trend is emerging, however, as we said above, the upward movement is weak, uncertain, and groundless. Thus, it is difficult to imagine what can be expected from the pound now, and whether market participants will react to today's macroeconomic statistics.
The average volatility of the GBP/USD pair over the past 5 days is 69 points, and continues to decline. According to the current level of volatility, the working channel on January 17 is limited to the levels of 1.3005 and 1.3143, but the movement is now weak and flat, so it is unlikely that any of the borders will be worked out today. Nearest support levels: S1-1.3062 S2-1.3031 S3 – 1.3000 Nearest resistance levels: R1 – 1.3092 R2 – 1.3123 R3 – 1.3153 Trading recommendations: The GBP / USD pair continues a weak upward movement, so traders are advised to wait for the price to reverse below the moving average, and sell the pound again with the goals of 1.3000 and 1.2970. You can formally buy the British currency now with the first goal of 1.3123, but it should be remembered that the fundamental background is not on the side of the pound. In addition to the technical picture, you should also take into account the fundamental data and the time of their release. Explanation of the illustrations: The senior channel of linear regression is the blue lines of unidirectional movement. The Junior channel of the linear regression is the purple lines of unidirectional movement. CCI – blue line in the indicator regression window. Moving average (20;smoothed) – blue line on the price chart. Murray levels – multi-colored horizontal stripes. Haiken ASHI is the indicator with colors bars in blue or purple. Possible variants of the price movement: Red and green arrows. The material has been provided by InstaForex Company - www.instaforex.com |
| Technical analysis of ETH/USD for 17/01/2020: Posted: 16 Jan 2020 11:23 PM PST Crypto Industry News: In the announcement published on the Japanese support site Binance, the stock exchange revealed that it would limit access to the stock exchange for the inhabitants of Japan on an indefinite date. The announcement states that the restriction is being implemented gradually and the details will be disclosed later. There are currently no restrictions and Japanese users can use the exchange normally. Binance was based in Japan as soon as he left China. As previously reported, the stock exchange has moved to Malta following an official warning from Japanese regulators due to the lack of a national license to operate the stock exchange. Since then, several headquarters have registered with the regulatory authority. Huobi, a rival of Binance, obtained a license in January 2019, and the BitBox exchange of the Japanese corporation LINE secured it in September. It is possible that Binance has encountered similar regulatory difficulties despite not being in this country. The Kraken crypto exchange ceased to provide services to Japanese residents in April 2018, citing the rising costs of doing business - potentially due to the requirement to obtain a license. Technical Market Overview: The ETH/USD bulls keep consolidating just under the recent swing high at the level of $170.72 and it looks like they are preparing for another wave up. The target is seen at the level of $172.91. Nevertheless, this price rally looks like a classic pump made on extreme volumes, which indicates that some part of the market participants has been actively selling the ETH on the way up. So far the rally has ended with a High-Tide Doji candlestick pattern and since then the bears are trying to push the prices lower to test the broken levels. The next technical support is seen at the levels of $156.77, $150.94 and $146.94. Weekly Pivot Points: WR3 - $163.70 WR2 - $155.20 WR1 - $149.53 Weekly Pivot - $140.92 WS1 - $136.16 WS2 - $127.09 WS3 - $122.67 Trading Recommendations: The best strategy in the current market conditions is to trade with the larger timeframe trend, which is still down. All the shorter timeframe moves are still being treated as a counter-trend correction inside of the uptrend. There is a possibility that the wave 2 corrective cycles are completed, so the market might be ready for another impulsive wave up of a higher degree and uptrend continuation.
|
| Posted: 16 Jan 2020 11:22 PM PST 4 hour timeframe
Technical details: Senior linear regression channel: direction - upward. Junior linear regression channel: direction - upward. Moving average (20; smoothed) - sideways. CCI: 25.1866 On Friday, January 17, the EUR / USD currency pair begins with a downward correction against the upward trend, since the pair recently managed to overcome the moving average line. However, during the upward movement, traders failed to overcome the Murray "6/8" level of 1.1169, from which there was a rebound, and now the pair is quoted near the moving average, again deciding what to do next: to rebound and resume growth or to return to a more justified downward movement, from a fundamental point of view. Yesterday's daytime news reaffirms that point of view, which does not particularly need proof in recent months. The American statistics showed another very good value and exceeded forecasts, while European statistics (German CPI) showed no positive dynamics, again. Thus, the Euro currency fell anew, which is quite logical, Also, over the past day, a protocol was published from the last meeting of the ECB, which was the first for Christine Lagarde. No one doubted that at her first meeting as head of the Regulator, Lagarde would not initiate a change in the key rate. In principle, she herself stated that it would take several months to evaluate all the possibilities and the need for structural changes in the Central Bank, as well as monetary policy. The minutes of that meeting confirmed that the European Central Bank is currently taking a wait and see attitude. At the same time, most members of the monetary committee considered certain optimistic signs in the current state of things. According to the members of the monetary committee, political risks began to decline, and the inflationary pressure is to decrease, at the same time, the manufacturing sector began to show signs of recovery. According to members of the ECB, this is the first sign that the situation has begun to improve. Since we do not sit at the ECB, it is difficult for us to draw a similar conclusion, because we only see specific macroeconomic statistics. And these statistics do not indicate, for example, that business activity in the manufacturing sector of the EU countries which begun to grow. Nevertheless, ECB chief economist Philip Lane said: "The data from the last meeting on monetary policy indicated the continuing weak but stabilizing growth dynamics of the Eurozone." It should also be noted that in the coming months, the ECB should decide on a strategy that will be applied in the work in the coming years. The publication of the December inflation is scheduled on the last day of the European Union trading week. We will then be able to make sure that the ECB is right in speaking of some signs of economic recovery or to verify the opposite. Considering the fact that German inflation remained unchanged in December and British inflation slowed down to 1.3% y / y, and acceleration of European inflation, on the other hand, can hardly be expected. According to experts, inflation in the EU will remain unchanged at 1.3% y / y. We believe that this is the most optimistic forecast. In the best case, inflation will indeed be 1.3%, in the worst, it will start to slow down again. Thus, the euro can today be under pressure from market participants. Separately, it is also worth considering the report on industrial production in the USA. If everything is clear in the European Union, the business activity in the manufacturing sector has long been in the "red zone", industrial production itself is declining, and in the case of the States, everything is not so obvious. Business activity in the manufacturing sector by the ISM index is also in the "red zone" of 47.1, however, the Markit index indicates that "everything is in order", amounting to about 52. But a report on industrial production today may show a decrease in volumes in December by 0.2% m / m. What is it? An accident? Or the consequences of a trade war with China? Will there be a reflection on other economic indicators or will the Fed skillfully smooth out the negative effect of Trump's trade wars? One way or another, The technical picture on January 17 indicates that the pair is preparing to resume a downward trend. If the Murray "5/8" level of 1.1139 is overcome, then the trend will again become downward.
The average volatility of the EUR/USD currency pair is currently 42 points. Thus, we have volatility levels on January 17 at 1.1101 and 1.1185. A turn of the Heiken Ashi indicator up will indicate the resumption of the upward movement. However, we still expect a resumption of the downward movement. Nearest support levels: S1 - 1.1139 S2 - 1.1108 S3 - 1.1078 The nearest resistance levels: R1 - 1.1169 R2 - 1.1200 R3 - 1.1230 Trading recommendations: The EUR/USD is currently being adjusted again. Thus, long positions (formally) with goals 1.1169 and 1.1185 are relevant now, however it is recommended to open them very carefully with small lots. It is recommended that returning to sales of the pair with a target of 1.1108 is not earlier than the reverse overcome by moving traders. In addition to the technical picture, fundamental data and the time of their release should also be taken into account. Explanations for illustrations: The oldest linear regression channel is the blue unidirectional lines. The smallest linear regression channel is the purple unidirectional lines. CCI - the blue line in the indicator window. Moving average (20; smoothed) - a blue line on the price chart. Murray levels - multi-colored horizontal stripes. Haiken Ashi is an indicator that colors bars in blue or purple. Possible price movement options: Red and green arrows. The material has been provided by InstaForex Company - www.instaforex.com |
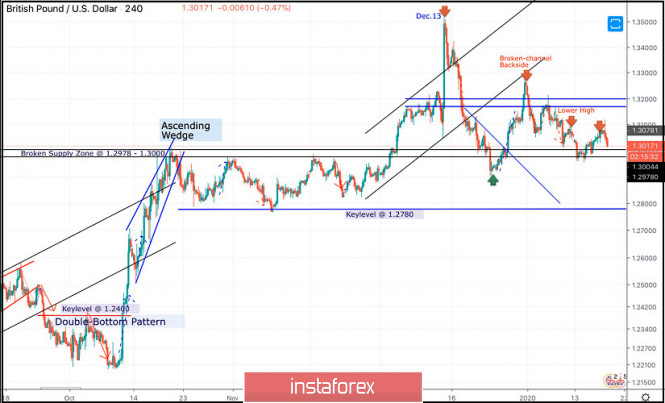
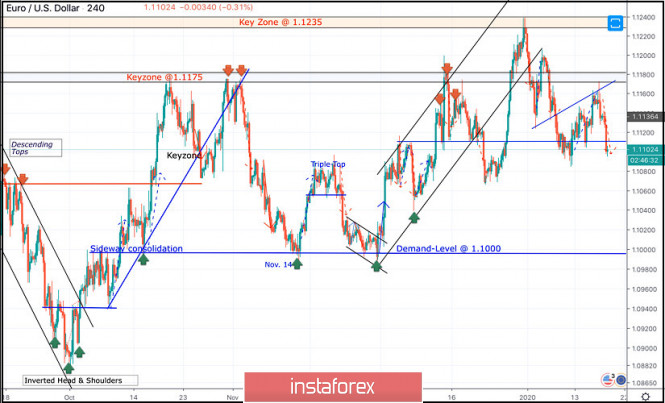
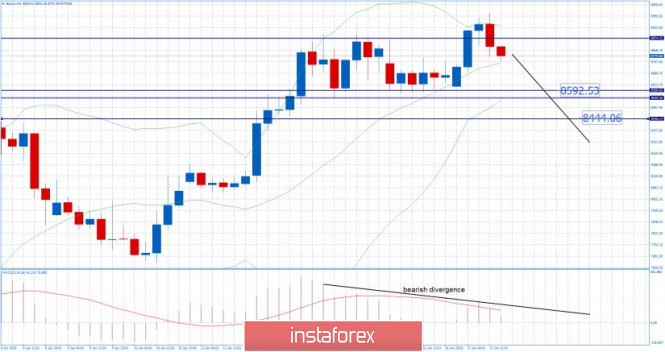
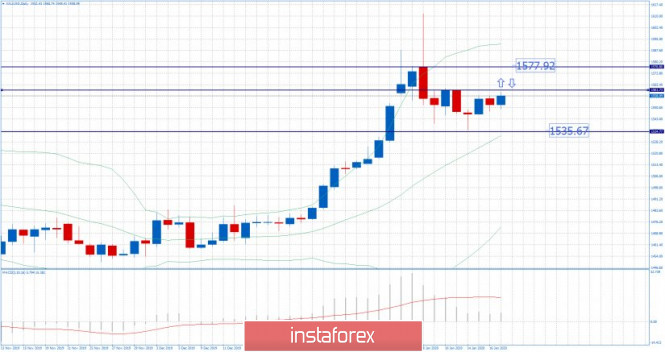
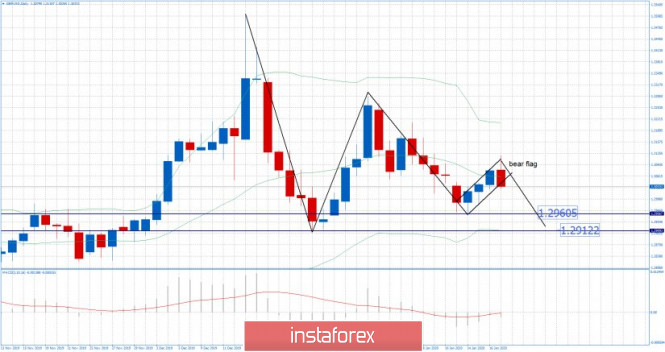
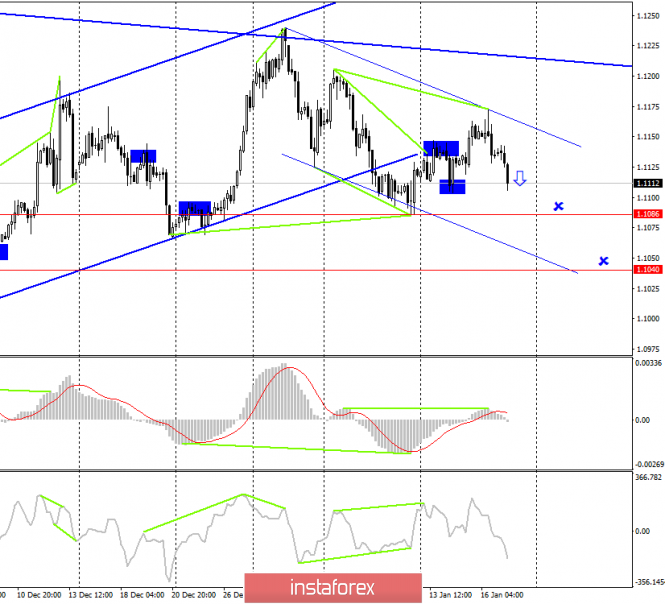
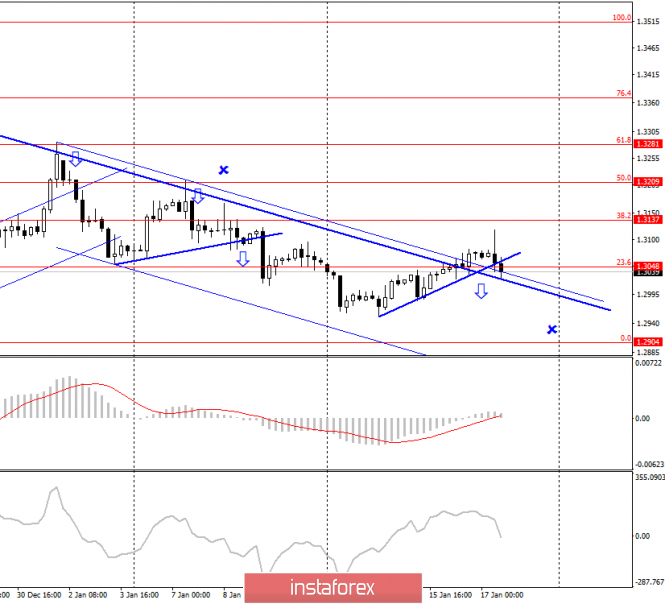
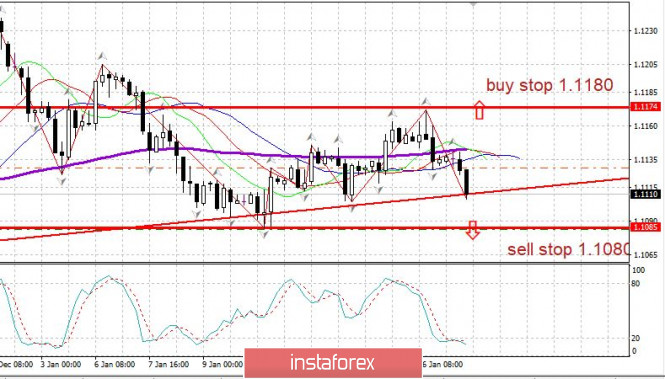

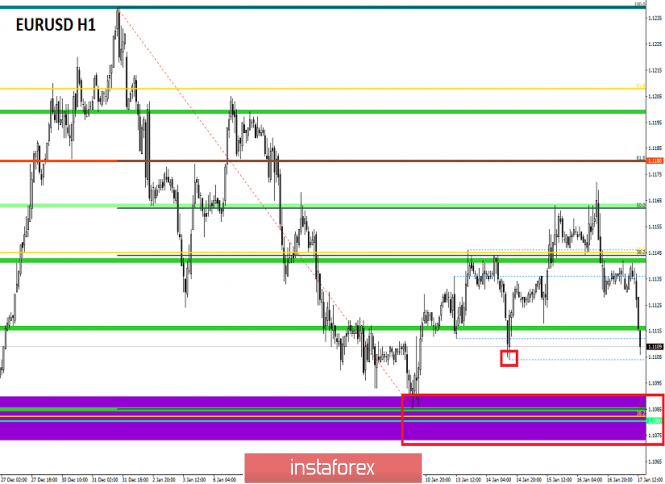
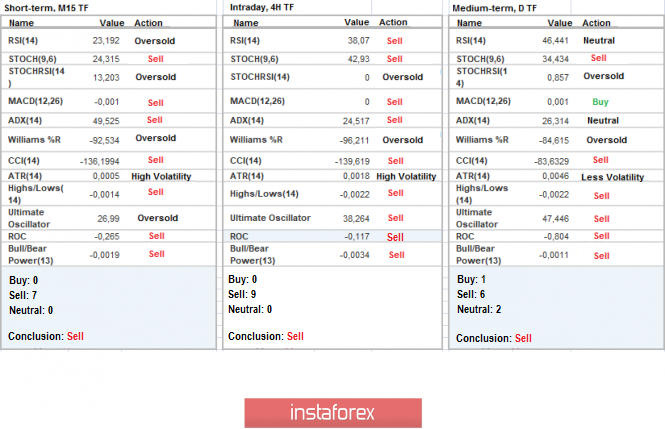
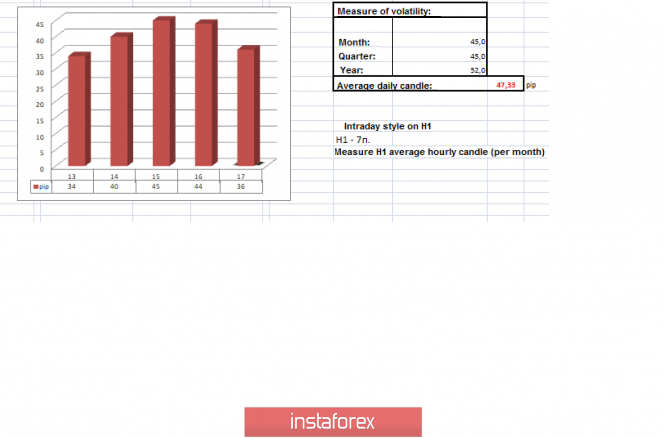
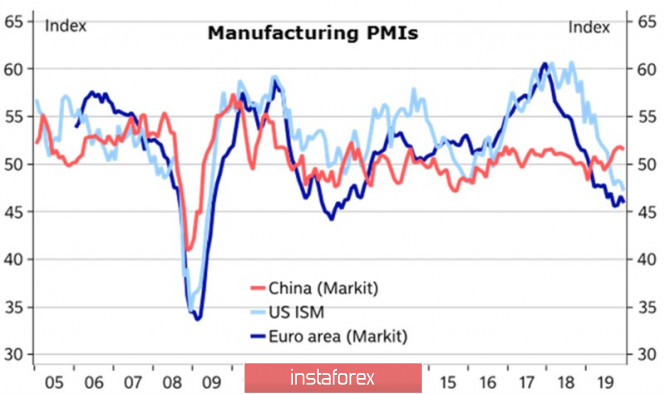
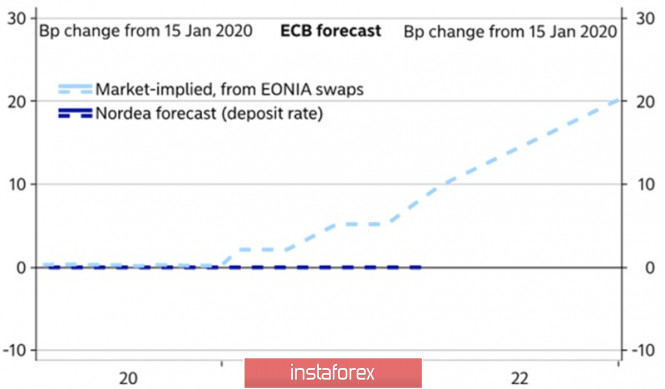
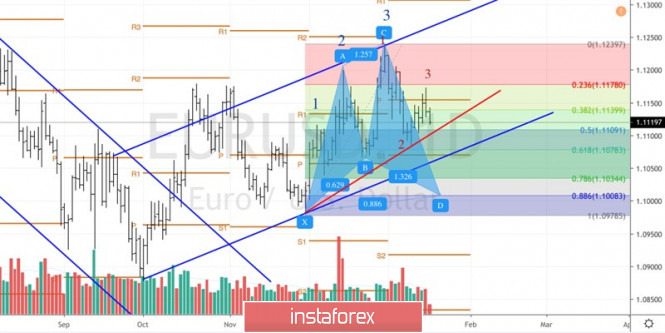
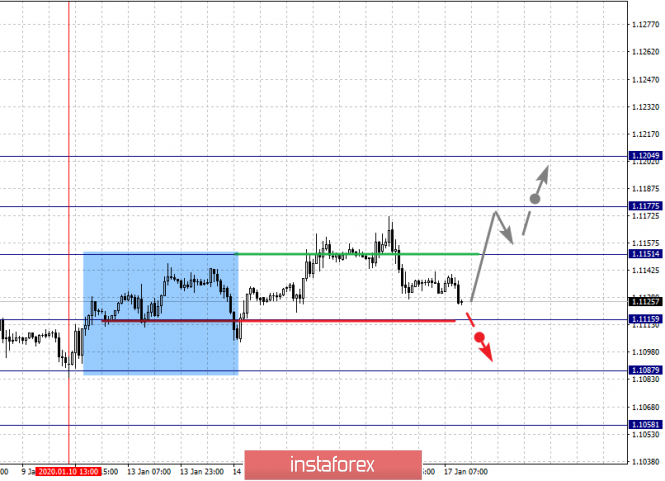
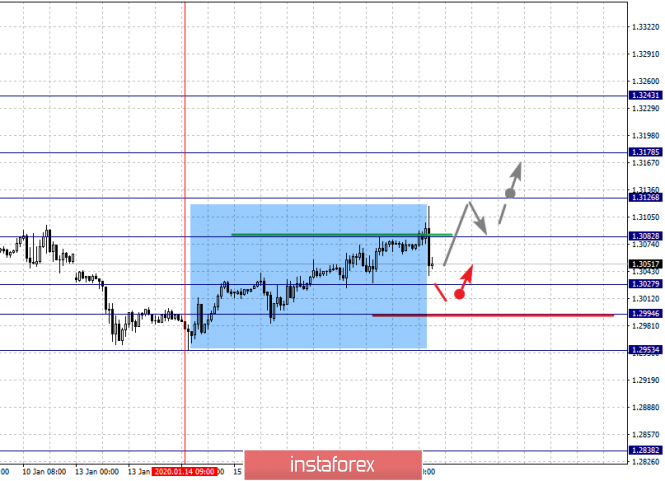
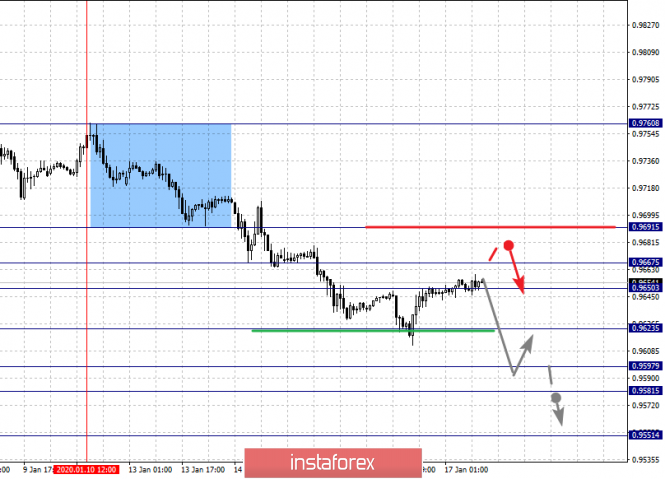
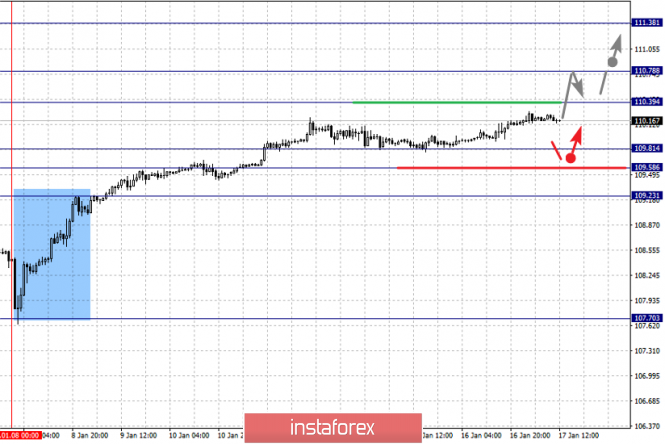
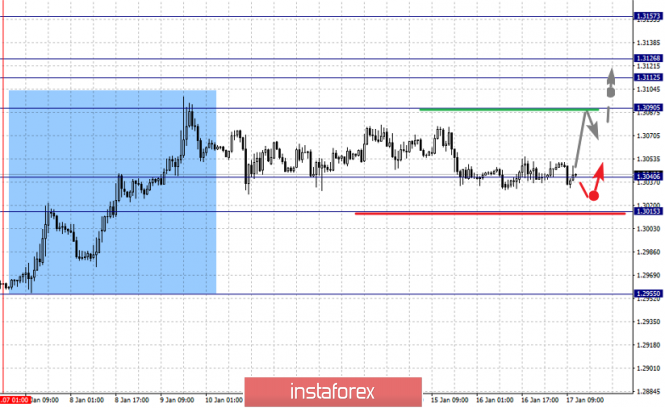
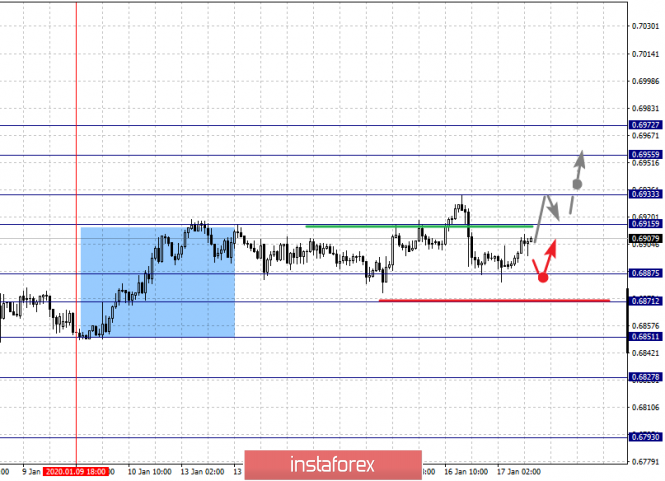
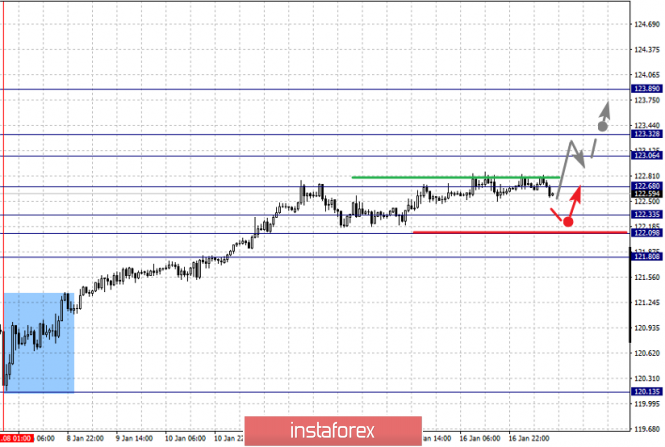
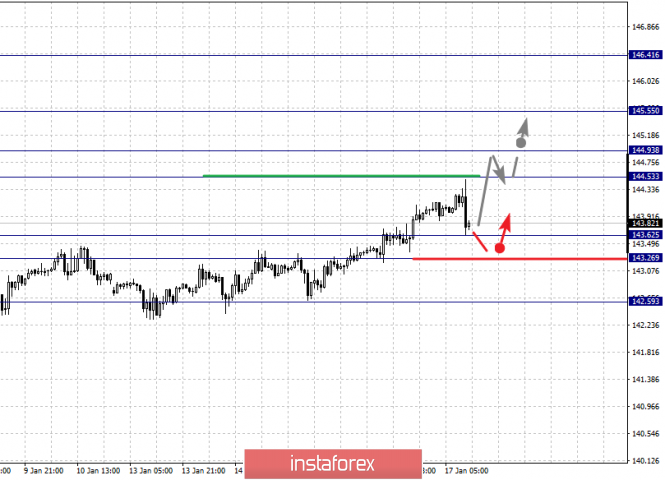
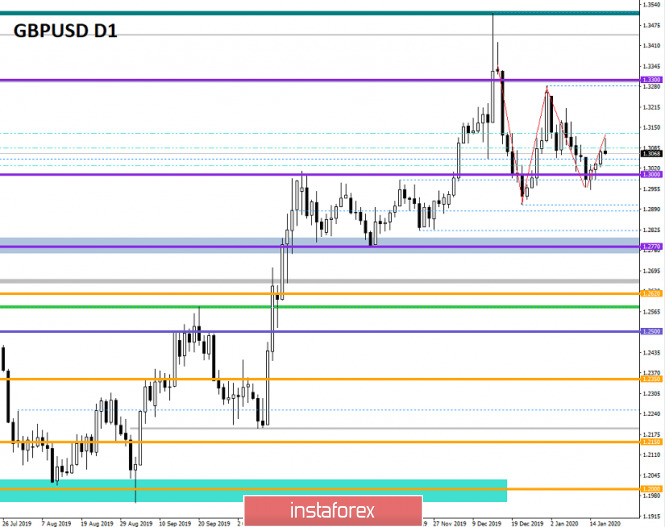
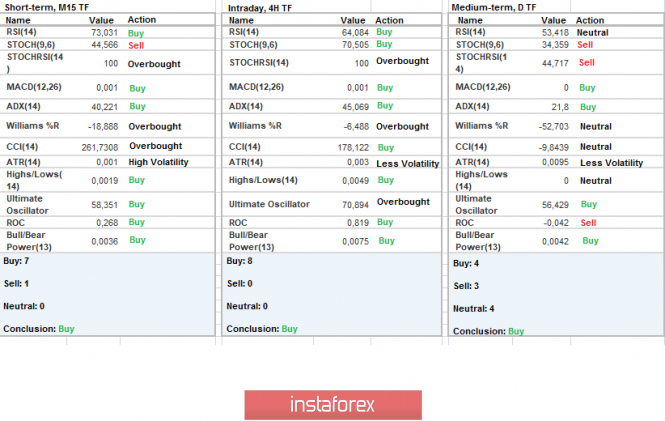
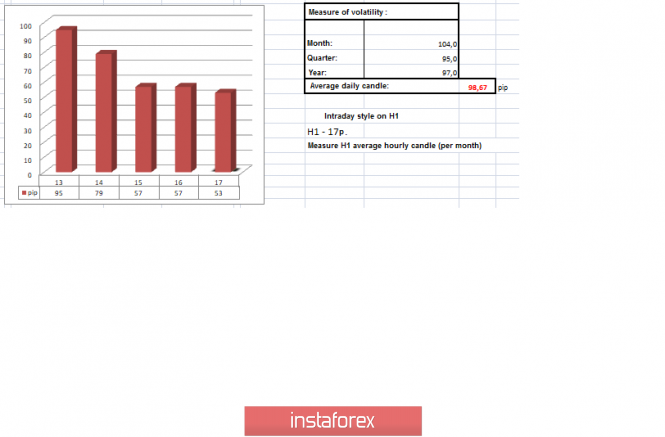
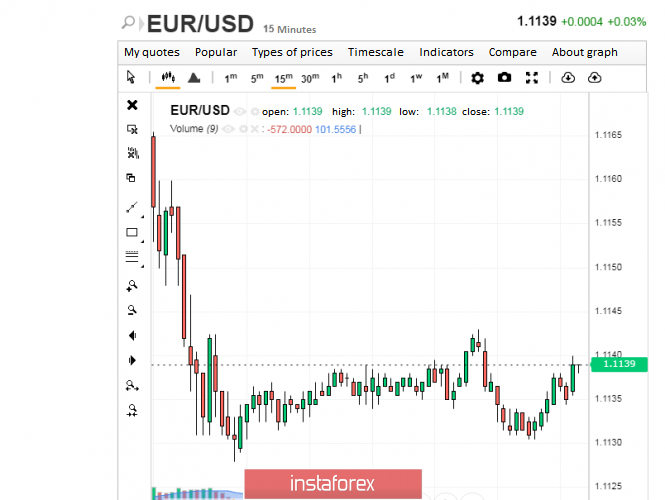
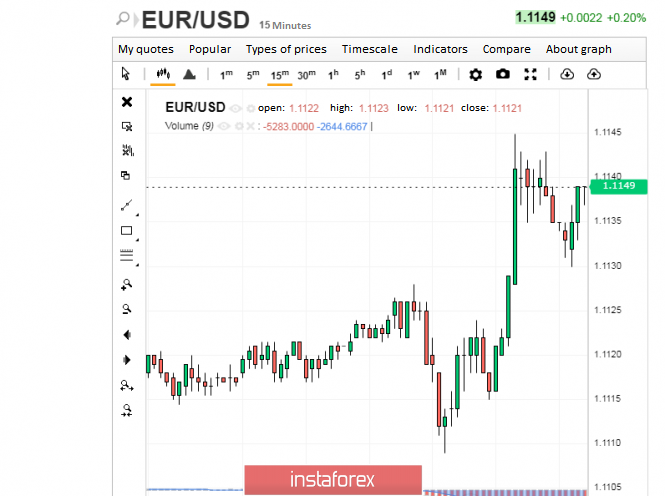
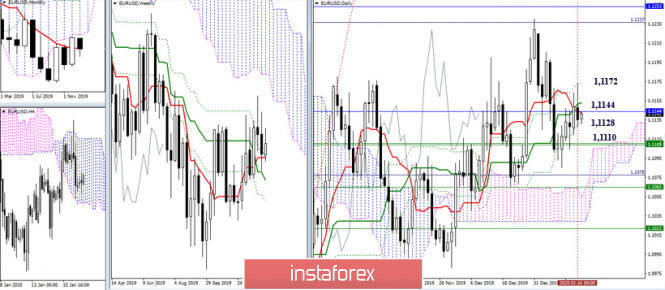
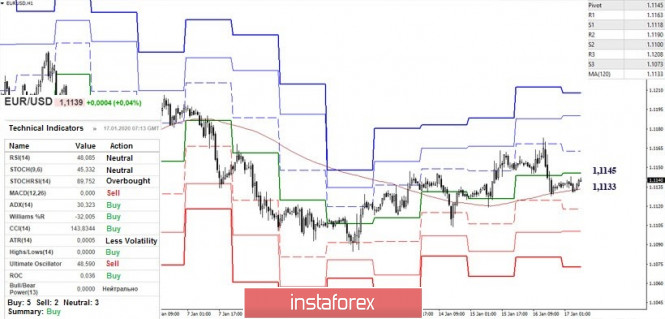
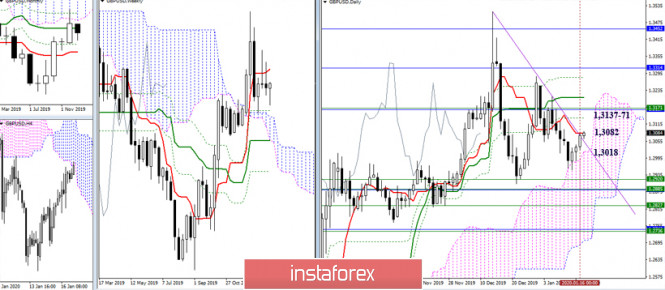
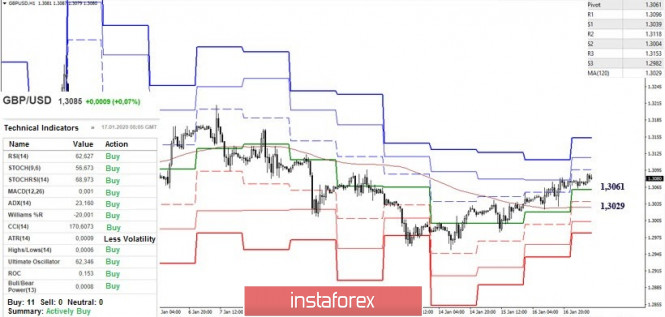
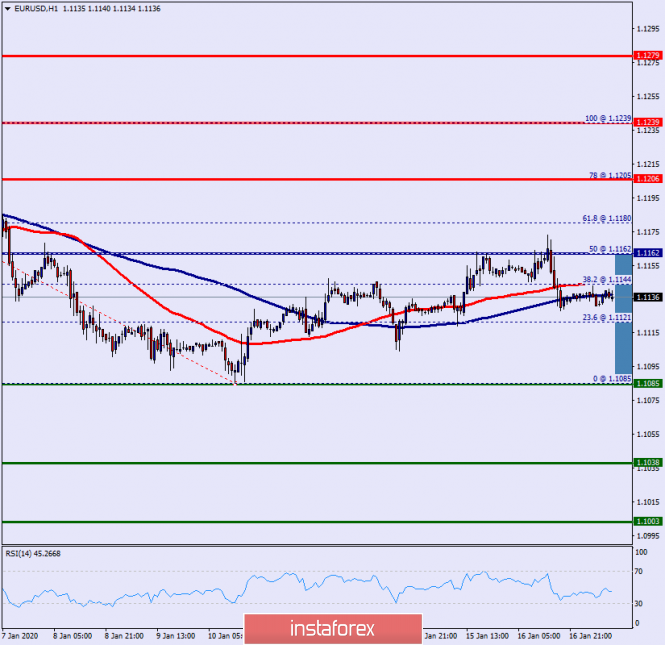
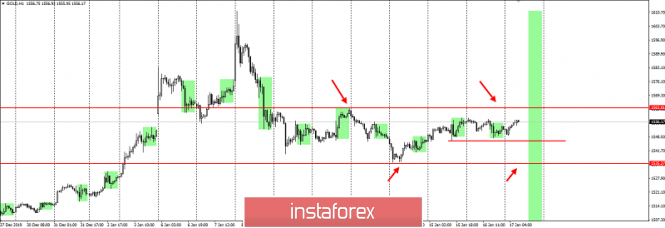
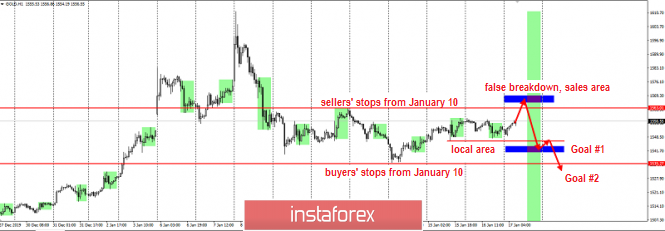
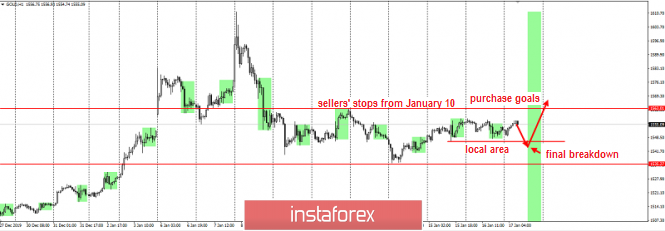
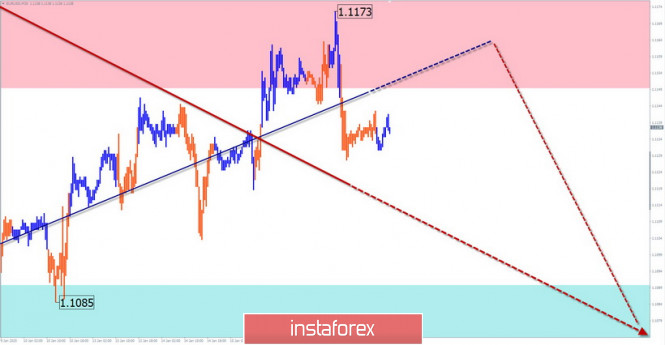
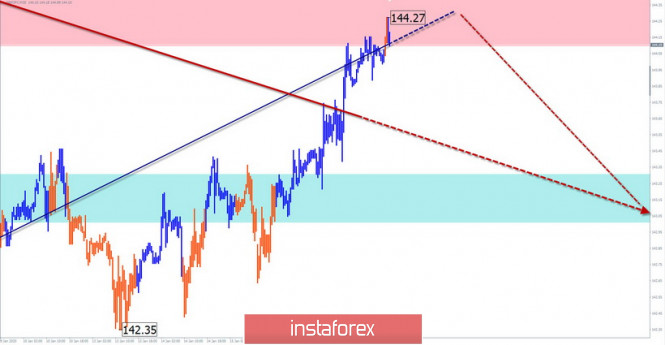
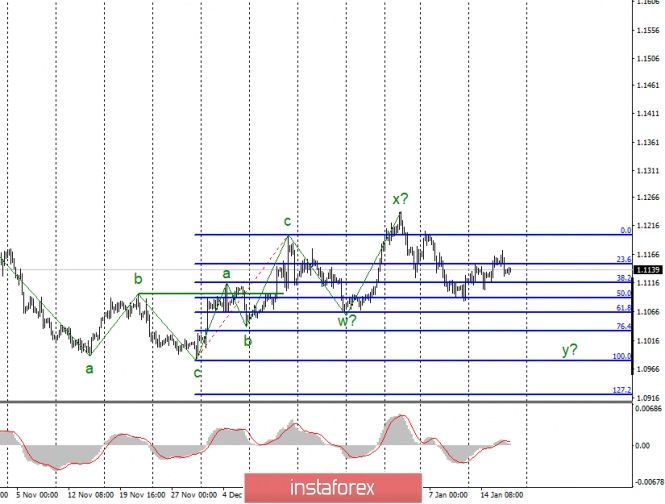
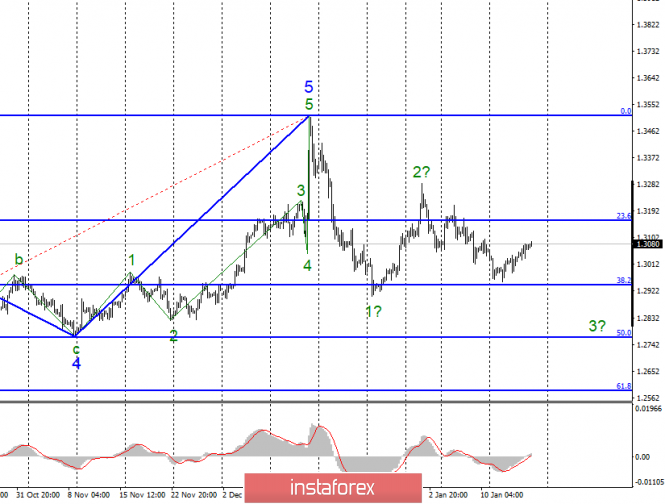
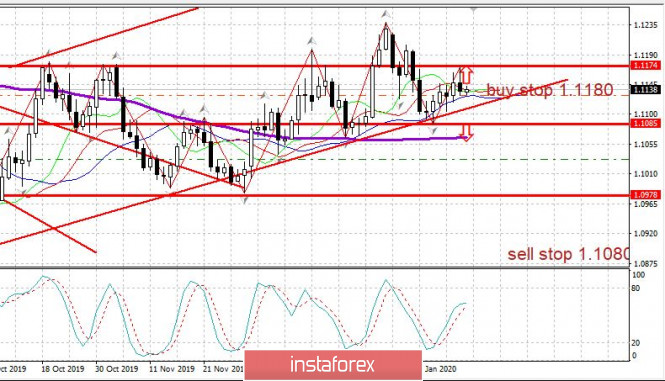

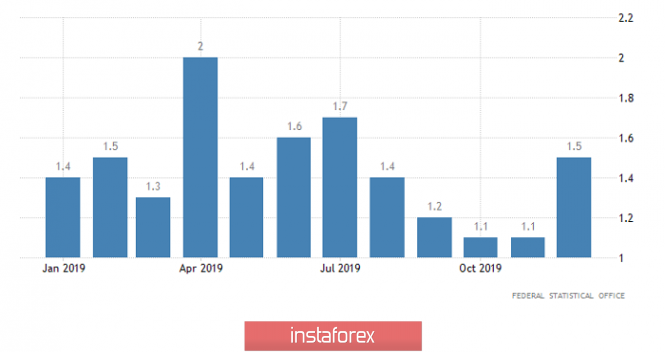
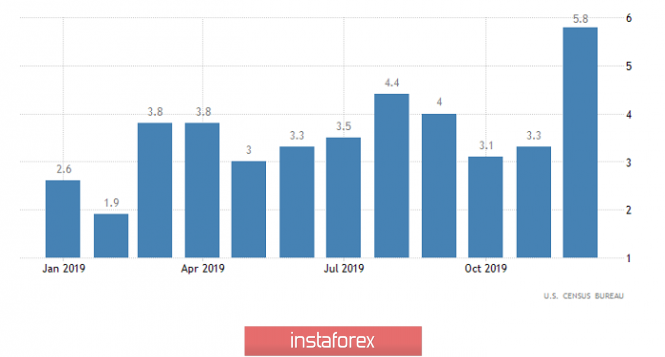

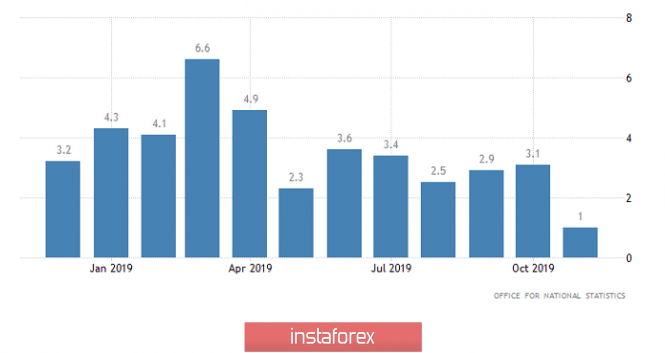
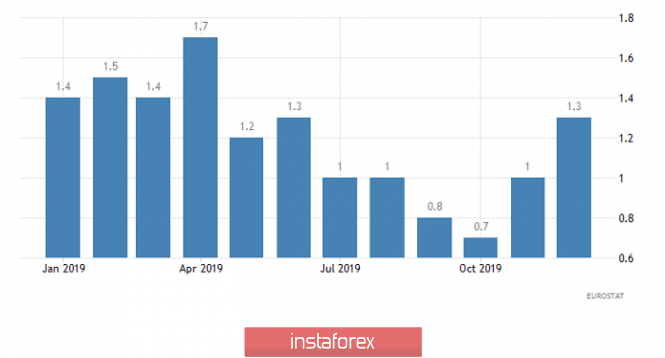
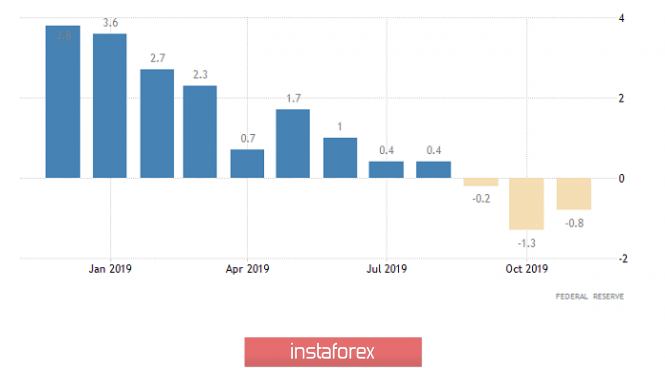
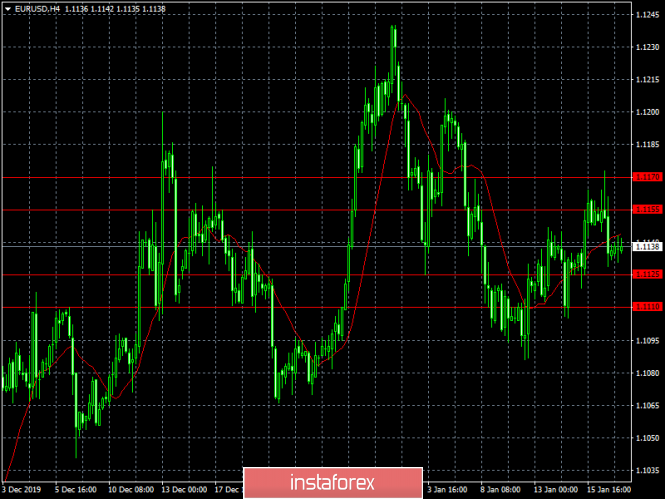
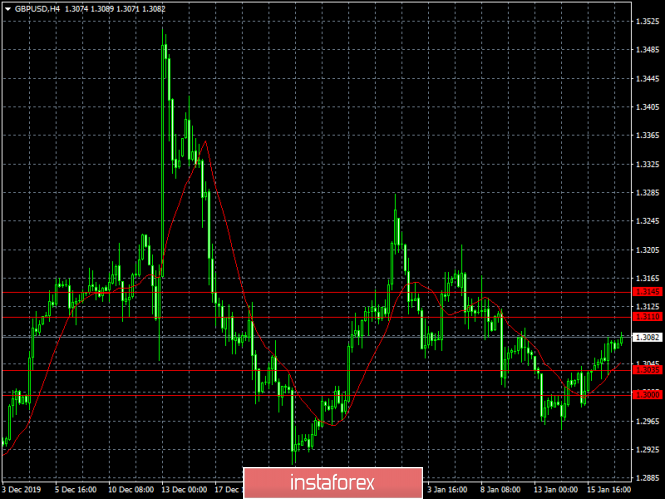

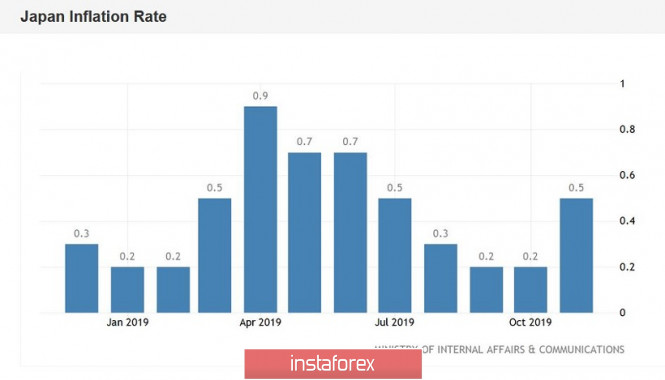
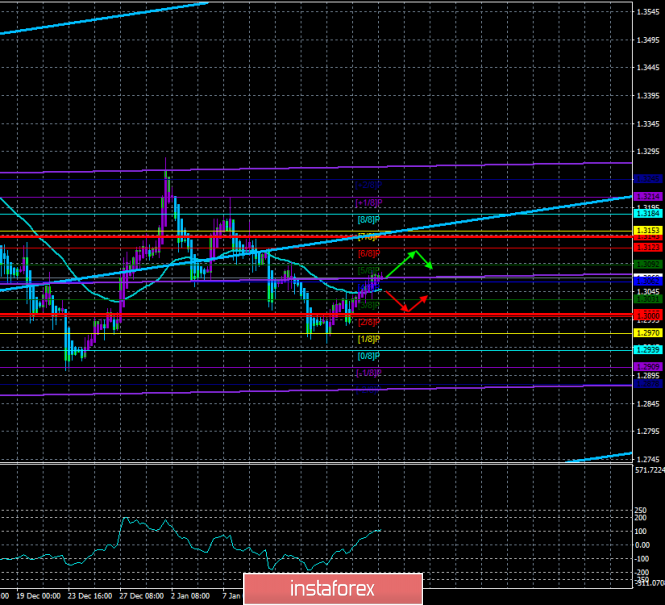
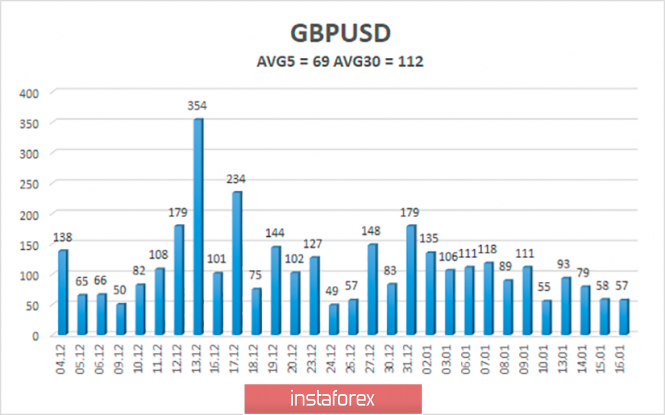
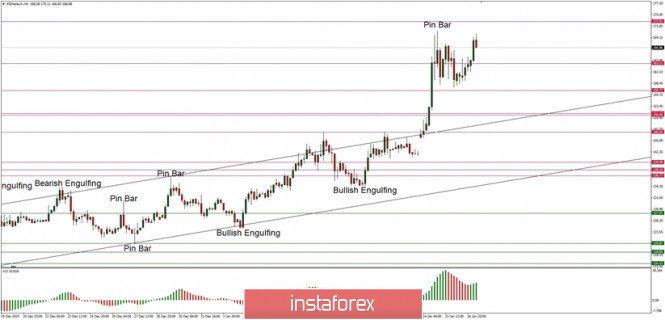
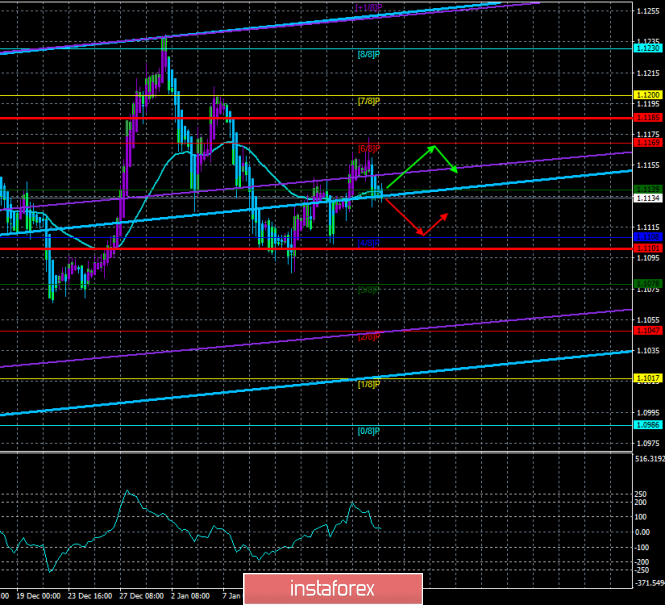
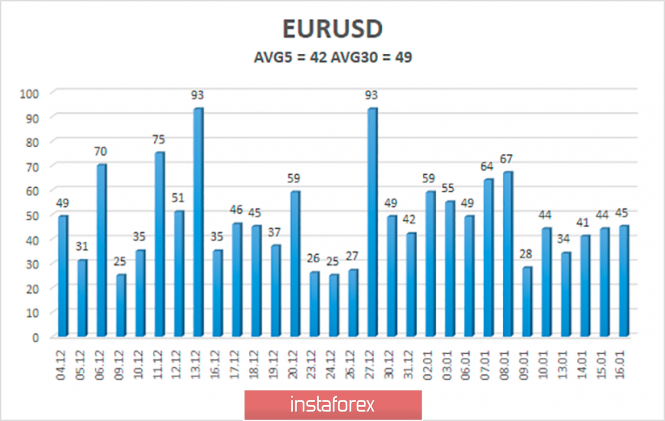
| You are subscribed to email updates from Forex analysis review. To stop receiving these emails, you may unsubscribe now. | Email delivery powered by Google |
| Google, 1600 Amphitheatre Parkway, Mountain View, CA 94043, United States | |
No comments:
Post a Comment