Forex analysis review |
- Forecast for EUR/USD on 1/20/2020
- Forecast for GBP/USD on 1/20/2020
- Forecast for USD/JPY on 1/20/2020
- Forecast for USD/CAD on 1/20/2020
- Control zones of EURUSD 01/20/2020
- Fractal analysis for major currency pairs on January 20
- Control zones of AUDUSD 01/20/2020
- Control zones of USDJPY 1/20/2020
- EUR/USD. Senate will consider Trump impeachment next week. New evidence in the case
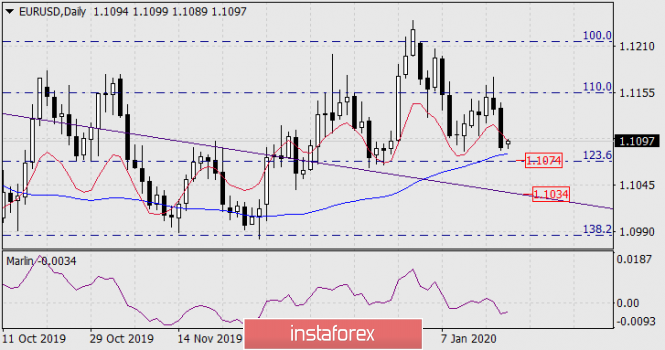
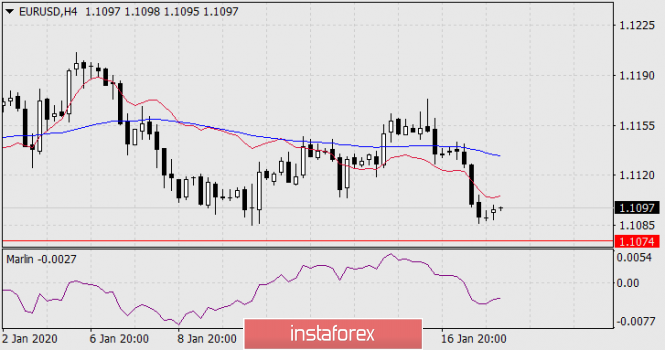
| Forecast for EUR/USD on 1/20/2020 Posted: 19 Jan 2020 08:08 PM PST EUR/USD Good US construction performance came out on Friday last week: 1.608 million y/y were pledged in December against new expectations of 1.38 million y/y - this is the highest figure since January 2007; 1.42 million were issued for new construction permits y/y (forecast was 1.47 million). Industrial production failed - the December decline was -0.3% versus the expected 0.0%, but optimistic investors found positive in the index structure - production in the manufacturing industry increased by 0.2% against the forecast of -0.2%. As a result, the dollar index grew by 0.33% while the euro lost 45 points. On the daily chart of the pair, the signal line of the Marlin oscillator penetrated into the negative trend zone. An important support is the 1.1074 level - the area of the Fibonacci line of 123.6% and the line of MACD. Overcoming support will open an equally important goal at 1.1034 - an embedded price channel line, overcoming of which, in turn, opens the way for pulling down the euro in a medium-term.. On the four-hour chart, the MACD blue indicator line is turning down, the price is also under the line of balance. Marlin consolidated in the decline zone. It is a national holiday in the US today, and there are also no important events expected in the euro area. A calm day (consolidation) is expected on the market before tomorrow's attempt to overcome technical support (1.1074). The material has been provided by InstaForex Company - www.instaforex.com |
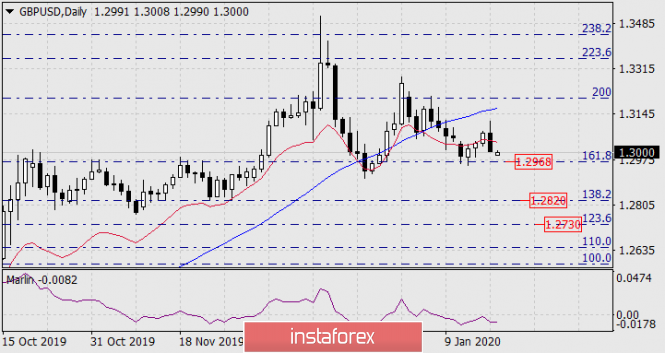
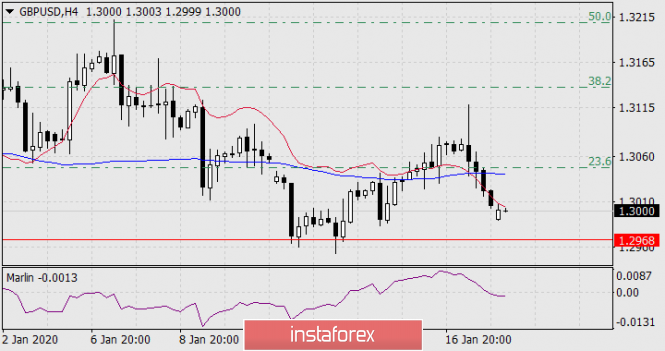
| Forecast for GBP/USD on 1/20/2020 Posted: 19 Jan 2020 08:07 PM PST GBP/USD On Friday, the British pound followed the market after the release of optimistic US data: 1.608 million y/y new homes were pledged in December against expectations of 1.38 million y/y - this is the highest figure since January 2007. On the daily chart, the price sharply returned under the balance indicator line (red). The Marlin oscillator moved down in front of the boundary with the growth zone. The trend has become completely downward. We are waiting for the British pound at the level of the first target 1.2820 (Fibonacci level 138.2%) after consolidation under the Fibonacci level 161.8% (1.2968). Furthermore, it is likely to decrease to the level of 123.6% at the price of 1.2730. On a four-hour chart, the price has been fixed under the lines of balance and MACD, the Marlin oscillator penetrates into the decline zone. There is also a declining trend for all indicators here. |
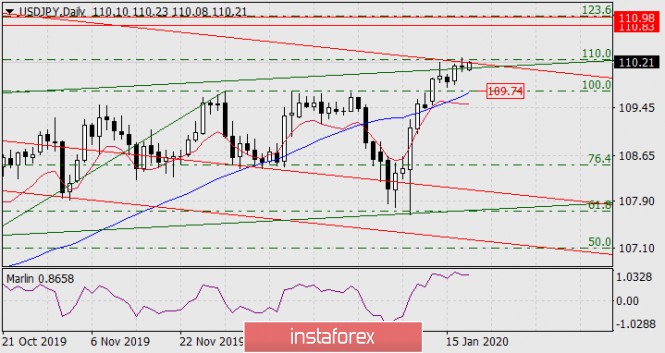
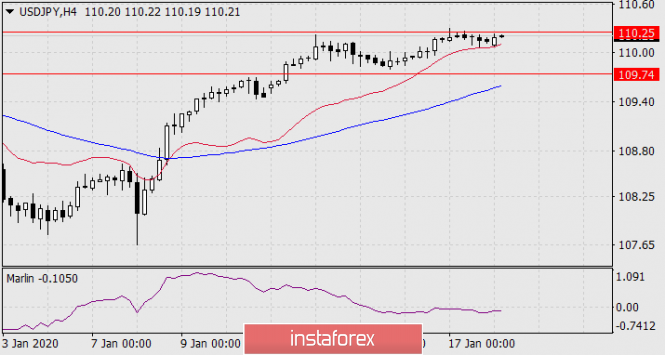
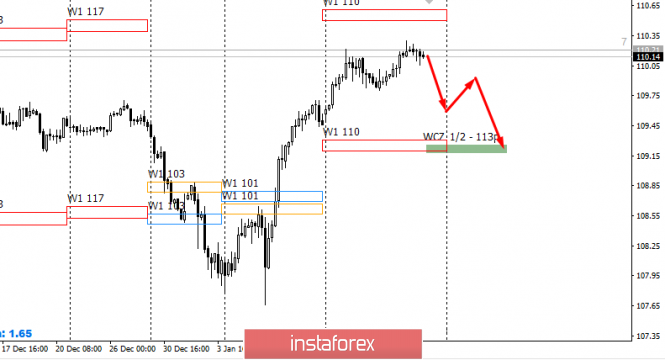
| Forecast for USD/JPY on 1/20/2020 Posted: 19 Jan 2020 08:06 PM PST USD/JPY The Japanese yen successfully completed key resistance on Friday: the triangle of convergence of the two lines of price channels, the Fibonacci reaction line of 110.0%. Now, if the levels are reached (the Friday high), the yen will go to conquer the target range of 110.83/98 near the Fibonacci level of 123.6%. Before such an expected attack, the price may get a little hooked up to the Fibonacci level of 100.0% (109.74), to which the MACD line also approached. On the four-hour chart, the MACDline approaches the level of 109.74, it will strengthen the significance of the level. |
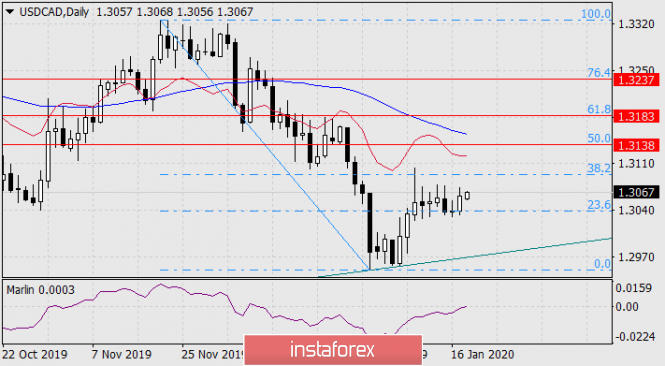
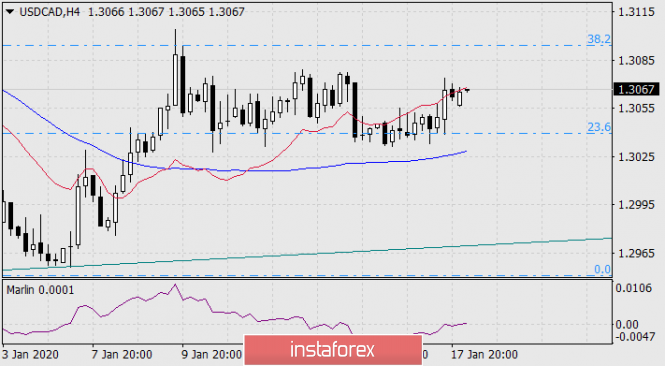
| Forecast for USD/CAD on 1/20/2020 Posted: 19 Jan 2020 08:04 PM PST USD/CAD The Canadian dollar is consolidating its sixth session at a correction level of 23.6% of the movement from November 20 to December 31. Today in the Asian session, the signal line of the Marlin oscillator crossed the boundary of the growth territory, which indicates the possible completion of the observed consolidation. The immediate growth target is the Fibonacci level of 50.0% at the price of 1.3138. It opens the second target for the Fibonacci level of 61.8% at the price of 1.3183, then 1.3237 at the correction level of 76.4%, which coincides with the low on June 10, 2019. On the H4 chart, the price is struggling with the resistance of the balance indicator line and the signal line of the Marlin oscillator at this very moment is trying to overcome the boundary with the growth territory. We believe that this struggle will be on the side of a positive trend and we will see the price at the target level 1.3237 in the future for several days. |
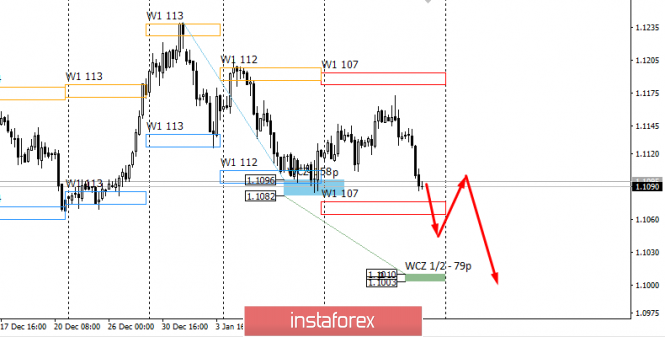
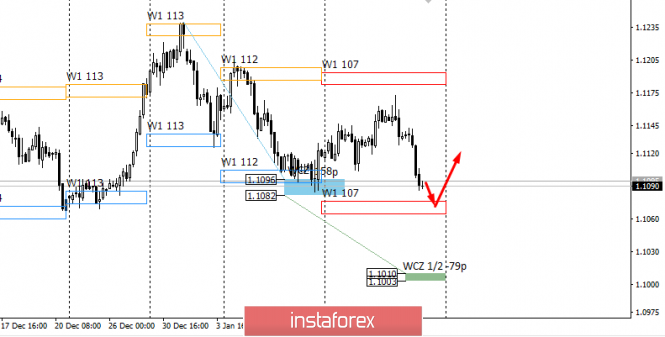
| Control zones of EURUSD 01/20/2020 Posted: 19 Jan 2020 06:30 PM PST The downward movement on the pair is a medium-term impulse. This makes it possible to keep sales open from WCZ 1/2 1.1164-1.1157 to the December low. This goal is medium-term, so part of the position can be consolidated after updating the January low. This is necessary in case of the appearance of large demand after an extreme test and the formation of a correctional upward model. The next target after updating the January low and consolidating below it will be the WCZ 1/2 1.1010-1.1003. These are the levels for possible sales commits that have been converted to breakeven. An alternative model will be developed if the closing of trading on Monday occurs above the opening after updating the monthly low. This will allow you to create a False Breakdown pattern and Absorption of the session level. In this case, corrective purchases will come to the fore. Daily CZ - daily control zone. The area formed by important data from the futures market, which changes several times a year. Weekly CZ - weekly control zone. The zone formed by important marks of the futures market, which changes several times a year. Monthly CZ - monthly control zone. The zone, which is a reflection of the average volatility over the past year. The material has been provided by InstaForex Company - www.instaforex.com |
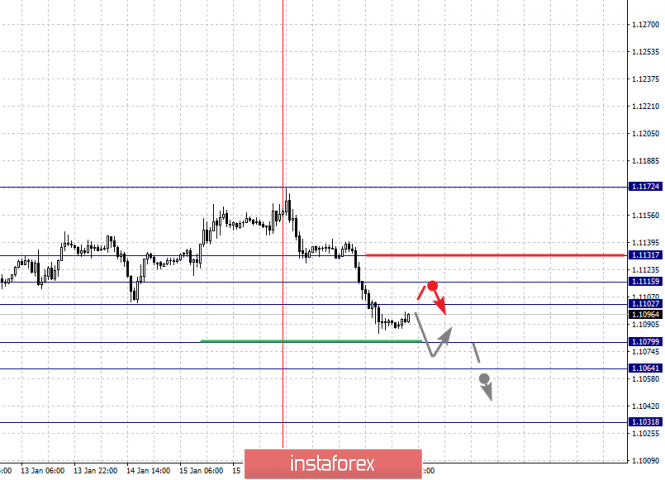
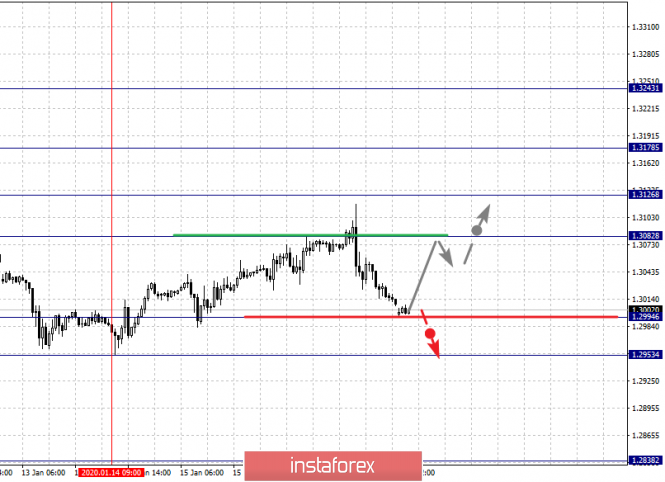
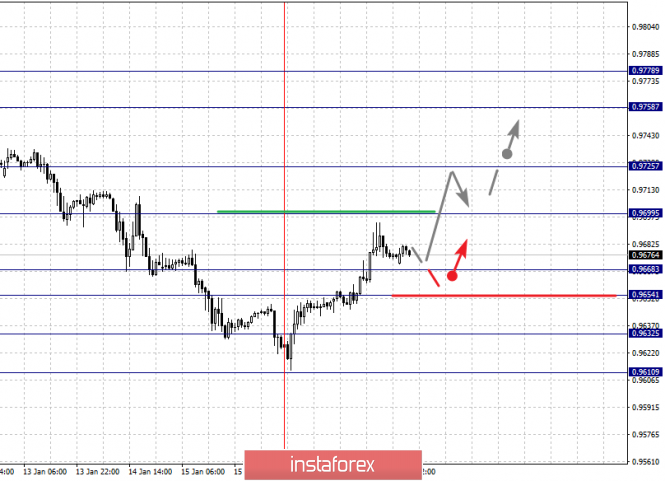
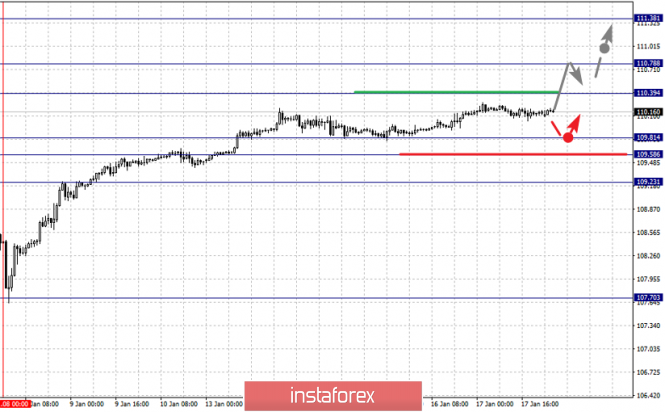
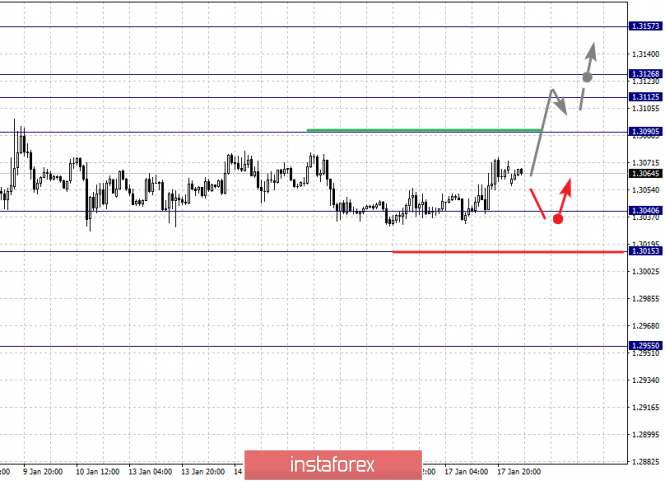
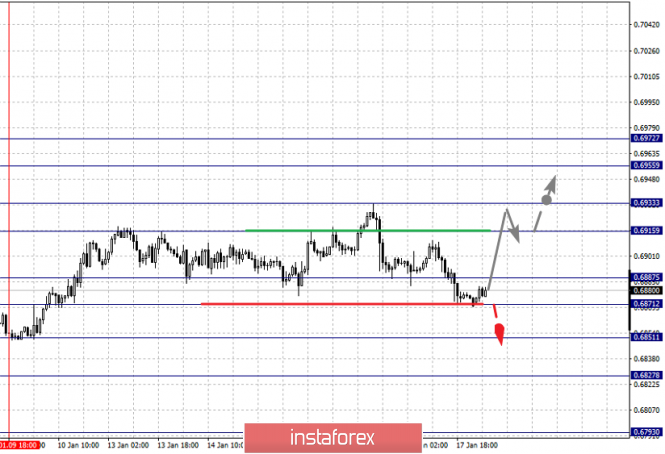
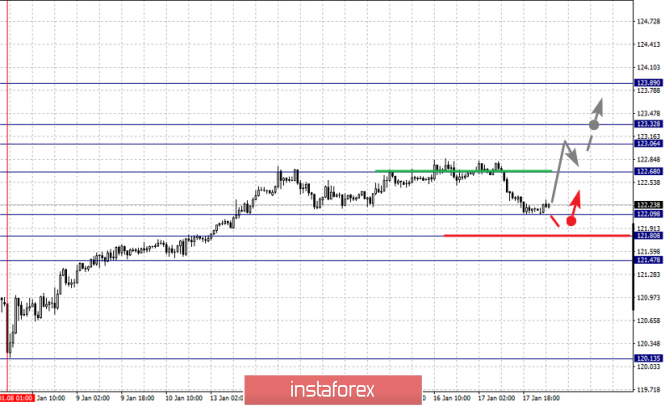
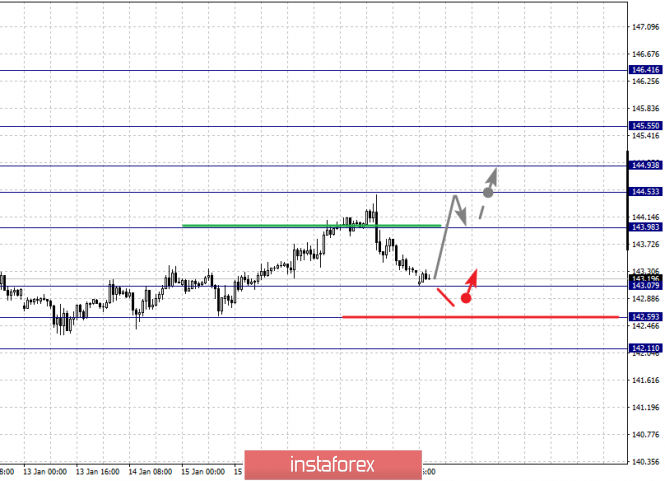
| Fractal analysis for major currency pairs on January 20 Posted: 19 Jan 2020 06:25 PM PST Forecast for January 20: Analytical review of currency pairs on the scale of H1: For the euro / dollar pair, the key levels on the H1 scale are: 1.1131, 1.1115, 1.1102, 1.1079, 1.1064 and 1.1031. Here, the price canceled the development of the upward structure from January 10 and at the moment, we are defining key targets from the downward structure on January 16. Short-term downward movement is expected in the range of 1.1079 - 1.1064. The breakdown of the last value will lead to a pronounced movement. Here, the potential target is 1.1031. We expect a pullback to the top from this level. Short-term upward movement is possibly in the range 1.1102 - 1.1159. The breakdown of the last value will lead to an in-depth correction. Here, the target is 1.1131. This level is a key support for the downward structure. The main trend is the descending structure of January 16 Trading recommendations: Buy: 1.1102 Take profit: 1.1113 Buy: 1.1116 Take profit: 1.1130 Sell: 1.1078 Take profit: 1.1065 Sell: 1.1063 Take profit: 1.1034 For the pound / dollar pair, the key levels on the H1 scale are: 1.3243, 1.3178, 1.3126, 1.3082, 1.2994 and 1.2953. Here, we are following the formation of the ascending structure of January 14. At the moment, the price is close to its cancellation. In this case, a breakdown of 1.2994 is needed, also in this case, the first goal is 1.2953. Short-term upward movement is expected in the range 1.3082 - 1.3126. The breakdown of the latter value will allow us to expect movement to the level of 1.3178. Price consolidation is near this value. For the potential level for the top, we consider the level of 1.3243. Upon reaching which, we expect a pullback. The main trend is the formation of the ascending structure of January 14, the stage of deep correction Trading recommendations: Buy: 1.3082 Take profit: 1.3124 Buy: 1.3127 Take profit: 1.3176 Sell: Take profit: Sell: 1.2992 Take profit: 1.2954 For the dollar / franc pair, the key levels on the H1 scale are: 0.9778, 0.9758, 0.9725, 0.9699, 0.9668, 0.9654, 0.9632 and 0.9610. Here, the price forms the expressed initial conditions for the top of January 16. The continuation of the movement to the top is expected after the breakdown of the level of 0.9700. In this case, the target is 0.9725. Price consolidation is near this level. The breakdown of the level of 0.9725 will lead to pronounced movement. Here, the target is 0.9758. For the potential value for the top, we consider the level of 0.9778. Upon reaching this level, we expect a pullback to the bottom. Short-term downward movement is possibly in the range of 0.9668 - 0.9654. The breakdown of the latter value will lead to an in-depth correction. Here, the target is 0.9632. This level is a key support for the top. The main trend is the formation of initial conditions for the top of January 16 Trading recommendations: Buy : 0.9700 Take profit: 0.9725 Buy : 0.9727 Take profit: 0.9756 Sell: 0.9667 Take profit: 0.9655 Sell: 0.9652 Take profit: 0.9635 For the dollar / yen pair, the key levels on the scale are : 111.38, 110.78, 110.39, 109.81, 109.58 and 109.23. Here, we are following the development of the upward cycle of January 8. At the moment, we expect to reach the level of 110.39. The breakdown of which will allow us to count on movement to the level of 110.78. Price consolidation is near this value. The breakdown of the level of 110.80 should be accompanied by a pronounced upward movement. Here, the potential target is 111.38. Short-term downward movement is possibly in the range 109.81 - 109.58. The breakdown of the last value will lead to an in-depth correction. Here, the goal is 109.23. This level is a key support for the top. The main trend: the upward cycle of January 8. Trading recommendations: Buy: 110.40 Take profit: 110.76 Buy : 110.80 Take profit: 111.35 Sell: 109.80 Take profit: 109.58 Sell: 109.55 Take profit: 109.25 For the Canadian dollar / US dollar pair, the key levels on the H1 scale are: 1.3157, 1.3126, 1.3112, 1.3090, 1.3062, 1.3040 and 1.3015. Here, we are following the development of the upward cycle of January 7. The continuation of the movement to the top is except after the breakdown of the level of 1.3090. In this case, the target is 1.3112. Price consolidation is in the range of 1.3112 - 1.3126. For the potential value for the top, we consider the level of 1.3157. Upon reaching this level, we expect a pullback to the bottom. Short-term downward movement, as well as consolidation are possible in the range of 1.3040 - 1.3015. The breakdown of the latter value will lead to the formation of initial conditions for the downward cycle. In this case, the potential target is 1.2988. The main trend is the upward cycle of January 7, the correction stage Trading recommendations: Buy: 1.3090 Take profit: 1.3112 Buy : 1.3126 Take profit: 1.3155 Sell: 1.3038 Take profit: 1.3017 Sell: 1.3013 Take profit: 1.2990 For the Australian dollar / US dollar pair, the key levels on the H1 scale are : 0.6972, 0.6955, 0.6933, 0.6915, 0.6887, 0.6871, 0.6851, 0.6827 and 0.6793. Here, we are following the formation of the ascending structure of January 9. At the moment, the price is close to the cancellation of this structure, which requires a breakdown of the level of 0.6871. In this case, the first target is 0.6851. Short-term movement to the top is expected in the range of 0.6915 - 0.6933. The breakdown of the latter value will lead to a pronounced movement. Here, the target is 0.6955. For the potential value for the top, we consider the level of 0.6972. Upon reaching this value, we expect consolidation, as well as a pullback to the bottom. The main trend is the formation of potential for the top of January 9, the stage of deep correction Trading recommendations: Buy: 0.6915 Take profit: 0.6930 Buy: 0.6935 Take profit: 0.6955 Sell : 0.6870 Take profit : 0.6852 Sell: 0.6850 Take profit: 0.6828 For the euro / yen pair, the key levels on the H1 scale are: 123.89, 123.32, 123.06, 122.68, 122.09, 121.80 and 121.47. Here, we are following the development of the upward cycle of January 8. The continuation of the movement to the top is expected after the breakdown of the level of 122.68. In this case, the first target is 123.06. Short-term upward movement, as well as consolidation is in the range of 123.06 - 123.32 . The breakdown of the level of 123.35 will lead to a movement to a potential target - 123.89, from this level, we expect a pullback to the bottom. Short-term downward movement is possibly in the range of 122.09 - 121.80. The breakdown of the latter value will lead to an in-depth correction. Here, the goal is 121.47. This level is a key support for the upward structure. The main trend is the upward cycle of January 8, the correction stage Trading recommendations: Buy: 122.70 Take profit: 123.05 Buy: 123.06 Take profit: 123.30 Sell: 122.07 Take profit: 121.84 Sell: 121.80 Take profit: 121.50 For the pound / yen pair, the key levels on the H1 scale are : 146.41, 145.55, 144.93, 144.53, 143.98, 143.07, 142.59 and 142.11. Here, we are following the development of the ascending structure of January 3. At the moment, the price is in correction. The resumption of movement to the top is expected after the breakdown of the level of 144.00. In this case, the first goal is 144.53. Short-term upward movement is expected in the range of 144.53 - 144.93. The breakdown of the latter value will lead to a movement to the level of 145.55, and near which, we expect consolidation. For the potential value for the top, we consider the level of 146.41, from which we expect a pullback to the bottom. Short-term downward movement is possibly in the range of 143.07 - 142.59. The breakdown of the latter value will lead to the formation of initial conditions for the downward cycle. In this case, the potential target is 142.11. The main trend is the upward structure of January 3, the correction stage Trading recommendations: Buy: 144.00 Take profit: 144.51 Buy: 144.53 Take profit: 144.91 Sell: 143.05 Take profit: 142.65 Sell: 142.54 Take profit: 142.11 The material has been provided by InstaForex Company - www.instaforex.com |
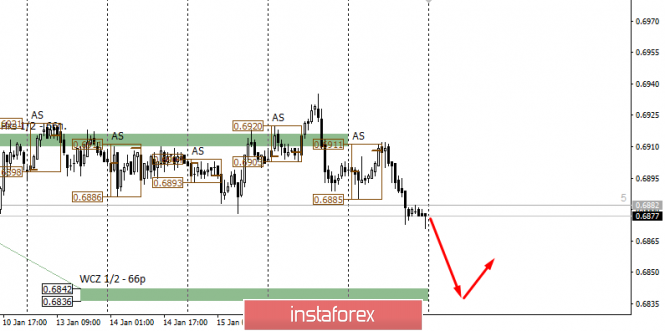
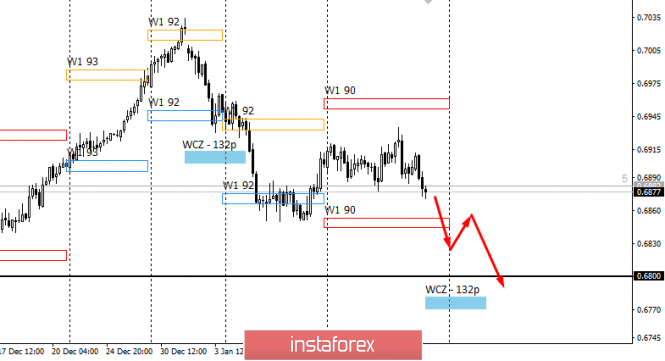
| Control zones of AUDUSD 01/20/2020 Posted: 19 Jan 2020 06:03 PM PST Work in the downward direction is still a priority, since the pair could not gain a foothold above the WCZ 1/2 0.6916-0.6910. This makes it possible to keep a short position open after the test of the specified zone. The first target of the fall is WCZ 1/2 0.6942-0.6836. Upon its achievement, a partial consolidation of the sale will be required, and the remaining part can be transferred to breakeven in case the fall continues. The downward movement is still a medium-term impulse, therefore, the goals for the fall should be considered for one to two weeks. An important support zone will be the monthly control zone of January located below the level of 0.6819. It's better not to consider options with buying a tool, as they will not be profitable from current levels. In the event of updating the January low and consolidating below it, the next fall target will be the December extremum formed at the level of 0.6800. Daily CZ - daily control zone. The area formed by important data from the futures market, which changes several times a year. Weekly CZ - weekly control zone. The zone formed by important marks of the futures market, which changes several times a year. Monthly CZ - monthly control zone. The zone, which is a reflection of the average volatility over the past year. The material has been provided by InstaForex Company - www.instaforex.com |
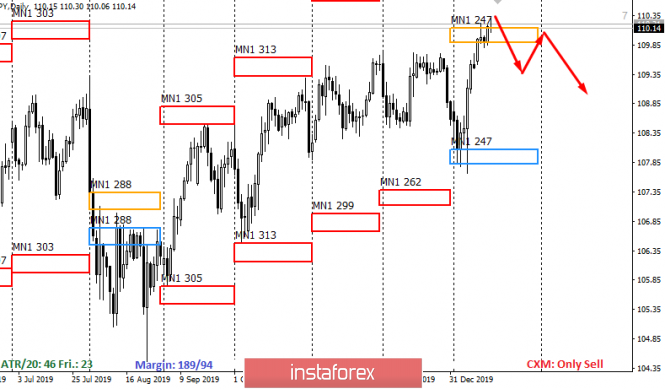
| Control zones of USDJPY 1/20/2020 Posted: 19 Jan 2020 05:51 PM PST Last week's movement made it possible for a local accumulation zone to form. This happened within the average monthly move, which indicates the presence of limit sell orders. Purchases from current levels are not profitable, since the probability of closing the trade in January is above the zone of the monthly move below 30%. A model has not yet been formed for selling, which indicates the need to switch to standby mode. Keeping part of the purchases opened at the beginning of this month is the optimal strategy, since the probability of absorption of the latest growth from current levels is below 20%. To enter a short position requires the formation of an absorption pattern at the daily level. Closing of trading on Monday should occur below the low of last week. This will indicate the appearance of a major offer from significant market players. Work in the downward direction is more profitable, since the monthly range of the average stroke has already been overcome by the pair.... Daily CZ - daily control zone. The area formed by important data from the futures market, which changes several times a year. Weekly CZ - weekly control zone. The zone formed by important marks of the futures market, which changes several times a year. Monthly CZ - monthly control zone. The zone, which is a reflection of the average volatility over the past year. The material has been provided by InstaForex Company - www.instaforex.com |
| EUR/USD. Senate will consider Trump impeachment next week. New evidence in the case Posted: 19 Jan 2020 02:48 PM PST Despite the fact that absolutely everyone understands that the likelihood of Donald Trump being removed from his post is negligible, the impeachment case does not stop and the Democrats are ready to go to the end. We already said earlier that the only chance to entice Republican senators to their side is to provide the Senate with such evidence of Trump's guilt that cannot be interpreted in two ways, which cannot be refuted. Only in this case can one count on some kind of support from the Republicans in the Senate and hopes that the total number of votes (at least 67 out of 100 is required) is enough to impeach Trump. The latest information on this topic is as follows. Democrats took a break almost one month after Congress officially voted "for" the impeachment of Trump. This month was spent collecting new evidence and searching for new witnesses. And it cannot be said that the Democrats, led by Lower House Speaker Nancy Pelosi, were unable to collect anything new. "Time was on our side, and this allowed us to collect additional evidence incriminating the president," the politician said. The new documents are presented in a copy of a letter from U.S. President Rudolph Giuliani's personal lawyer, which clearly confirms that Donald Trump was aware of Giuliani's attempts to compromise his main rival in the 2020 presidential election, Joe Biden. Moreover, Trump personally approved the meeting of Giuliani with Volodymyr Zelensky. The documents also contain a copy of a letter from Giuliani, which was sent to Zelensky, in which the lawyer demands a meeting on May 13 or 14. Earlier, Republicans and Trump himself have repeatedly stated that the US president was completely ignorant of the actions of his personal lawyer. However, new documents indicate the opposite. In addition, there is evidence of Lev Parnas, an American businessman and associate of Giuliani, who was detained and initially refused to participate in the case, but later changed his mind. According to the U.S. intelligence committee, Parnas prepared handwritten notes that seem to be directly related to the presidential scheme aimed at forcing Ukraine to announce investigations useful for his re-election campaign. One of these notes was made public and it reads: 1) Force Zelensky to announce the beginning of the investigation of the Biden case; 2) start negotiations with Zelensky without Pinchuk and Kolomoisky. The documents also provide information that Parnas and Giuliani were monitoring the US ambassador to Ukraine, Marie Yovanovitch, to secure her resignation. In general, the case is overgrown with new details and, it seems, Trump is really guilty of everything that he is accused of. Despite the Democrats' furious desire to force Trump to leave his post, one should also be clearly aware that the impeachment procedure does not begin "out of the blue", simply because of personal hostility towards the US president, as in virtually any other country, there are several political forces that constantly compete among themselves for power. Thus, formal impeachments can be declared to any president, because he always has opposition or a banal list of dissatisfaction with his policy. In the Trump case, there are very serious charges and very high-profile evidence. Thus, more and more ordinary people are inclined to believe that Trump is really guilty. Another thing is that Trump's associates in the Republican Party will decide his fate, of which there is a larger number in the Senate ... The material has been provided by InstaForex Company - www.instaforex.com |
| You are subscribed to email updates from Forex analysis review. To stop receiving these emails, you may unsubscribe now. | Email delivery powered by Google |
| Google, 1600 Amphitheatre Parkway, Mountain View, CA 94043, United States | |


No comments:
Post a Comment