Forex analysis review |
- Forecast for EUR/USD on January 3, 2019
- Forecast for GBP/USD on January 3, 2019
- Forecast for AUD/USD on January 3, 2019
- Fractal analysis for major currency pairs on January 3
- January 2, 2020 : EUR/USD Intraday technical analysis and trade recommendations.
- Gold analsys for 01.02.2019 - Strong upward momentum and potential for test of $1.600
- January 2, 2020 : GBP/USD Intraday technical analysis and trade recommendations.
- EUR/USD. January 2. A sell signal with a target of 1.1125 has been received
- GBP/USD. January 2. All three goals for the previous trading idea have been worked out
- USD/JPY analysis for January 02, 2019 - Broken bearish flag on the 4H time-frame, watch for selling opporutnities
- BTC analysis for 01.02.2020 - Watch for potential drop on the BTC
- Gold price is showing warning reversal signs
- Short-term Elliott wave analysis on GBPUSD
- Analysis of EUR/USD and GBP/USD for January 2. Business activity in the eurozone continues to disappoint
- Technical analysis of GBP/USD for January 02, 2019
- EUR/USD: post-holiday "hangover" and the Fed report
- Trader's diary for 01/02/2019. EURUSD. Market condition
- Pound: faces difficulty in rising
- Trading plan on EUR/USD for January 2, 2020.
- Analysis and trading ideas for GBP/USD for January 2, 2020
- Technical analysis recommendations for EUR/USD and GBP/USD on January 2
- Trading idea for USDJPY
- Overview of the GBP/USD pair on January 2. We expect the pound to fall by 100-120 points in the coming days.
- New year's cross limits
- Overview and recommendations for EUR/USD for January 2, 2020
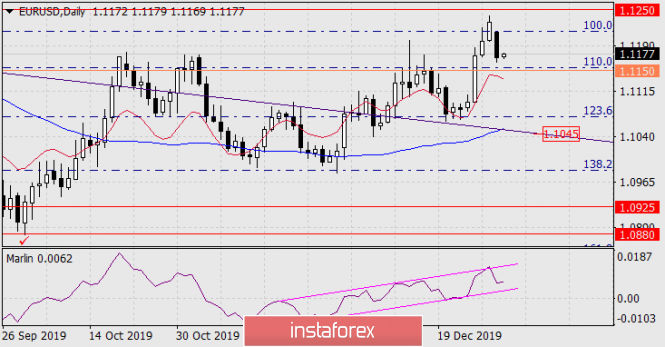
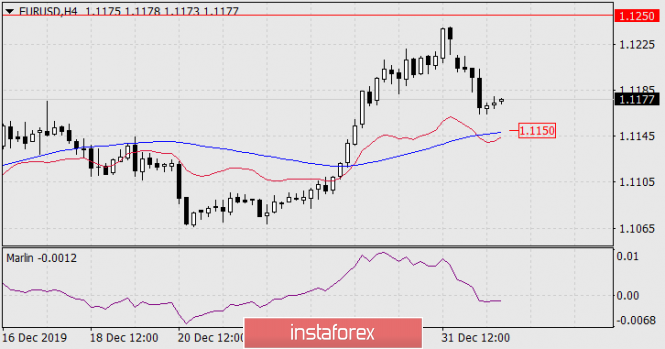
| Forecast for EUR/USD on January 3, 2019 Posted: 02 Jan 2020 06:54 PM PST EUR/USD The euro fell by 57 points on the first trading day of the new year amid a release of macroeconomic statistics. The European Manufacturing PMI in the final assessment for December was raised to 46.3 from 45.9, the US Manufacturing PMI, on the contrary, was revised down from 52.5 to 52.4. This fact confirms the speculative nature of the euro growth in the new year. With the signal level of 1.1150 being overcome below the Fibonacci level of 110.0% on the daily chart, we are waiting for the price to support the embedded line of the price channel in the region of 1.1045. By the time the price goes below the specified signal level, the Marlin oscillator line will exit down its own channel. On the four-hour chart, the signal line of the Marlin oscillator has fixed in the zone of negative values - in the decreasing trend zone. With price consolidating under the MACD line, a full-fledged signal for a decline will take place. Note that the MACD line coincides with the signal level of the higher timeframe (1.1150), this increases the significance of the level. Taking into account that current euro quotes are at the peaks of October and November, preliminary price consolidation (about a day) is possible before continuing the decline. The material has been provided by InstaForex Company - www.instaforex.com |
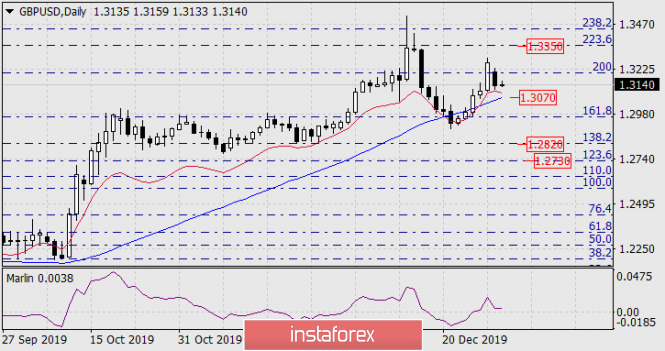
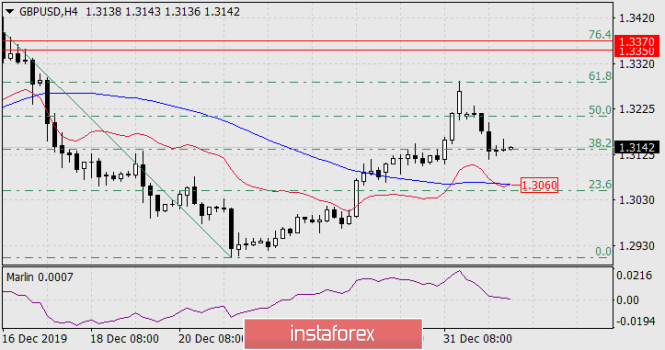
| Forecast for GBP/USD on January 3, 2019 Posted: 02 Jan 2020 06:54 PM PST GBP/USD The British pound grew more than other currencies in the New Year's week, but fell the most with the advent of the new year. Yesterday's decline was 125 points. The immediate goal is the MACD line on the daily chart - 1.3070. And only overcoming the price of this support will unfold the scenario of the pound's further decline. On the H4 chart, yesterday's growth was delayed at the Fibonacci level of 38.2%. The immediate goal is to support the MACD line, located at 1.3060, which is close to supporting the Fibonacci level of 23.6% and supporting the daily timeframe 1.3070. The level is strong, respectively, if it is overcome by the price, an accelerated fall in the British currency is possible. The Marlin oscillator shows intention to infiltrate the negative trend zone. Goals 1.2820, 1.2730 - Fibonacci levels of 138.2% and 123.6% on daily. |
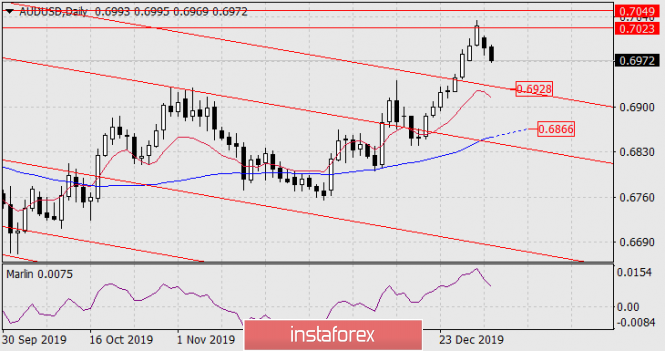
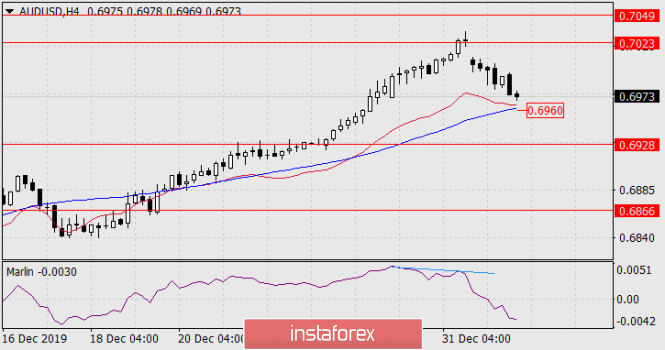
| Forecast for AUD/USD on January 3, 2019 Posted: 02 Jan 2020 06:54 PM PST AUD/USD The Australian dollar worked out a target range of 0.7023/49, after which it turned sharply down. The signal line of the Marlin Oscillator on the daily chart has formed a sharp peak, which is a sign of a reversal or deep correction of the instrument. The target point is the 0.6928 mark - support for the embedded line of the price channel. Overcoming the first goal opens the way to support the MACD line at about 0.6866, which is also a low on May 17 and 23. On the four-hour chart, the price began to fall immediately after the formation of divergence according to Marlin. The oscillator signal line is already in the negative trend zone, but the price is still above the MACD line (blue indicator), for a more reliable downward signal the price should overcome this line, go below 0.6960. |
| Fractal analysis for major currency pairs on January 3 Posted: 02 Jan 2020 05:23 PM PST Forecast for January 3: Analytical review of currency pairs on the scale of H1:
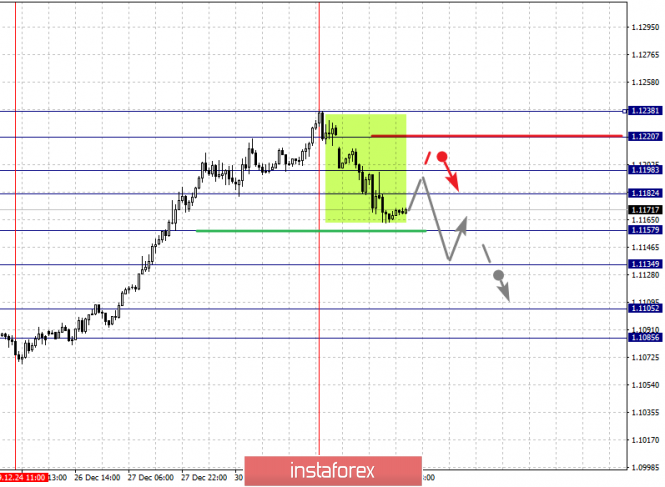
For the euro / dollar pair, the key levels on the H1 scale are: 1.1238, 1.1220, 1.1198, 1.1182, 1.1157, 1.1134, 1.1105 and 1.1085. Here, the price forms the potential for the downward movement of December 31 in the correction of the upward cycle on December 24. The continuation of the movement to the bottom is expected after the breakdown of the level of 1.1157. In this case, the target is 1.1134, wherein price consolidation is near this level. The breakdown of the level of 1.1134 should be accompanied by a pronounced downward movement. Here, the goal is 1.1105. For the potential value for the bottom, we consider the level of 1.1085. Upon reaching which, we expect consolidation, as well as a rollback to the top. Short-term upward movement is expected in the range 1.1182 - 1.1198. The breakdown of the last value will lead to an in-depth correction. Here, the target is 1.1220. This level is a key support for the top. Its passage at the price will lead to the formation of initial conditions for the upward cycle. Here, the potential target is 1.1238. The main trend is the upward cycle of December 24, the correction stage Trading recommendations: Buy: 1.1182 Take profit: 1.1196 Buy: 1.1199 Take profit: 1.1220 Sell: 1.1157 Take profit: 1.1136 Sell: 1.1132 Take profit: 1.1107
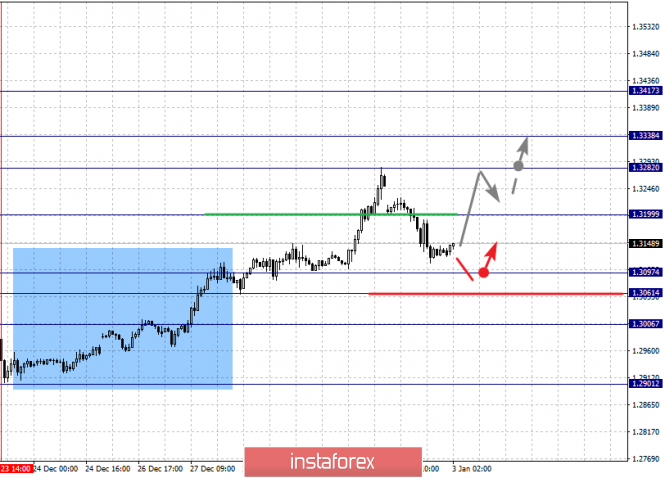
For the pound / dollar pair, the key levels on the H1 scale are: 1.3417, 1.3338, 1.3282, 1.3199, 1.3097, 1.3061 and 1.3006. Here, we follow the development of the ascending structure of December 23. The continuation of the movement to the top is expected after the breakdown of the level of 1.3200. In this case, the target is 1.3282. Short-term upward movement, as well as consolidation is in the range of 1.3282 - 1.3338. For the potential value for the top, we consider the level of 1.3417. Upon reaching which, we expect a pullback to the bottom. Short-term downward movement is possibly in the range of 1.3097 - 1.3061. The breakdown of the last value will lead to an in-depth correction. Here, the target is 1.3006. This level is a key support for the top. The main trend is the upward structure of December 23 Trading recommendations: Buy: 1.3200 Take profit: 1.3280 Buy: 1.3283 Take profit: 1.3336 Sell: 1.3097 Take profit: 1.3061 Sell: 1.3058 Take profit: 1.3008
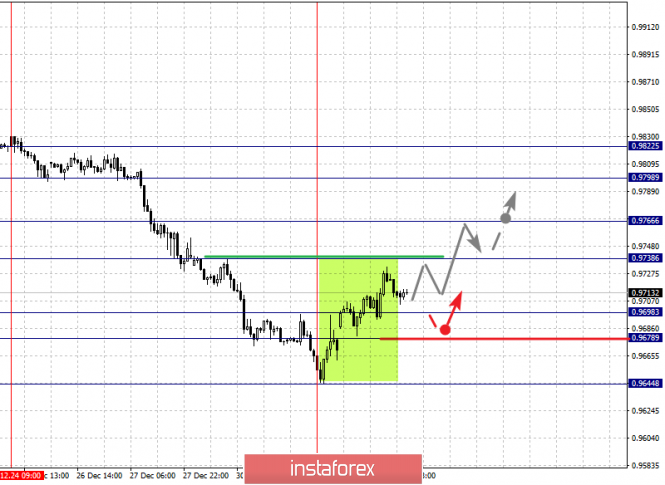
For the dollar / franc pair, the key levels on the H1 scale are: 0.9822, 0.9798, 0.9766, 0.9738, 0.9698, 0.9678 and 0.9644. Here, the price forms the potential for the upward movement of December 31 in the correction of the downward cycle of December 24. The continuation of the movement to the top is expected after the breakdown of the level of 0.9738. In this case, the target is 0.9766, wherein price consolidation is near this level. The breakdown of the level of 0.9766 will lead to a pronounced movement. In this case, the target is 0.9798. For the potential value for the top, we consider the level of 0.9822. Upon reaching which, we expect consolidation, as well as a pullback to the bottom. Short-term downward movement is possibly in the range of 0.9698 - 0.9678. The breakdown of the latter value will favor the development of a downward structure. In this case, the first target is 0.9644. The main trend is the downward cycle of December 24, the correction stage Trading recommendations: Buy : 0.9738 Take profit: 0.9764 Buy : 0.9767 Take profit: 0.9796 Sell: 0.9698 Take profit: 0.9678 Sell: 0.9676 Take profit: 0.9645
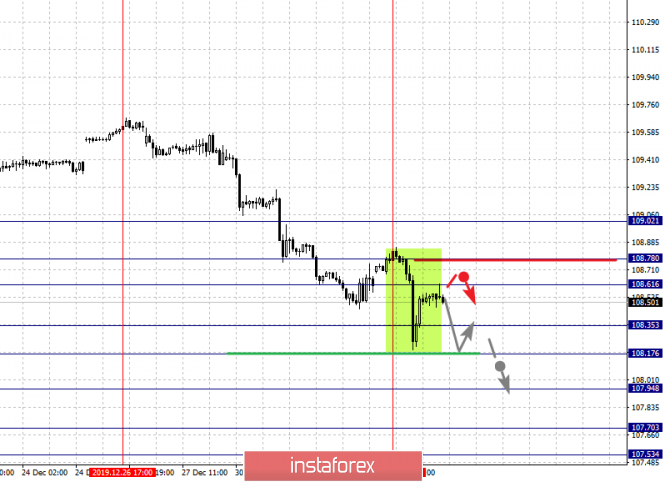
For the dollar / yen pair, the key levels on the scale are : 109.02, 108.78, 108.61, 108.35, 108.17, 107.94, 107.70 and 107.53. Here, we determine the subsequent goals for the bottom from the local descending structure on January 2. Short-term downward movement is possibly in the range of 108.35 - 108.17. The breakdown of the latter value will lead to movement to the level of 107.94. Price consolidation is near this level. The breakdown 107.94 will allow you to count on a pronounced movement towards a potential target - 107.53. Price consolidation is in the range of 107.53 - 107.70 and from here, we expect a correction. Short-term upward movement is possibly in the range 108.61 - 108.78. The breakdown of the latter value will have the potential to form the top. Here, the first goal is 109.02. Main trend: descending structure of December 26, local initial conditions for the bottom of January 2 Trading recommendations: Buy: 108.61 Take profit: 108.76 Buy : 108.80 Take profit: 109.00 Sell: 108.35 Take profit: 108.18 Sell: 108.15 Take profit: 107.94
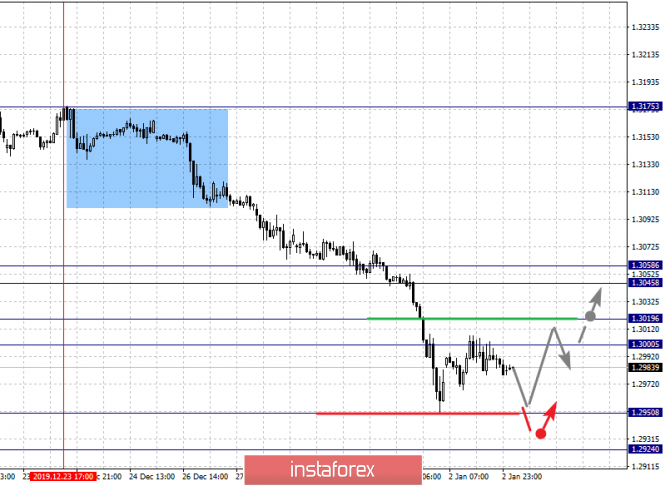
For the Canadian dollar / US dollar pair, the key levels on the H1 scale are: 1.3058, 1.3045, 1.3019, 1.3000, 1.2950 and 1.2924. Here, we are following the development of the local descending structure of December 23. The continuation of movement to the bottom is expected after the breakdown of the level of 1.2950. In this case, the target is 1.2924. We expect a key reversal to the correction from this level. Short-term upward movement is possibly in the range of 1.3000 - 1.3019. The breakdown of the latter value will lead to an in-depth correction. Here, the target is 1.3045. The range 1.3045 - 1.3058 is a key support for the downward structure. We expect the initial conditions for the upward cycle to be formed before it. The main trend is the local descending structure of December 23 Trading recommendations: Buy: 1.3005 Take profit: 1.3017 Buy : 1.3020 Take profit: 1.3045 Sell: 1.2950 Take profit: 1.2926 Sell: Take profit:
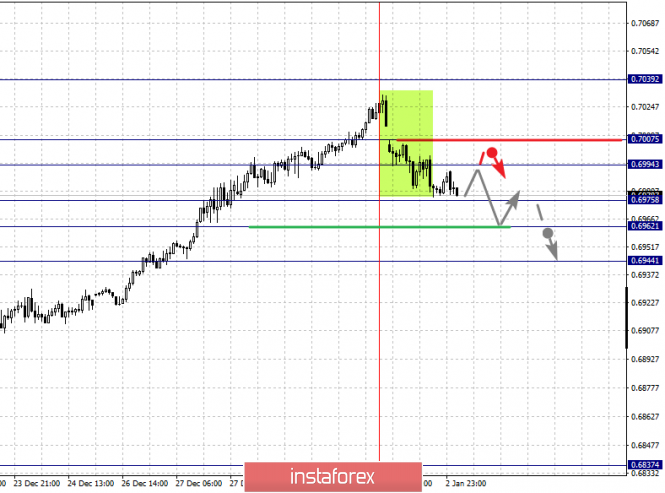
For the Australian dollar / US dollar pair, the key levels on the H1 scale are : 0.7039, 0.7007, 0.6994, 0.6975, 0.6962 and 0.6944. Here, we are following the development of the upward cycle of December 18. At the moment, the price is in the correction zone. Short-term upward movement, as well as consolidation are expected in the range of 0.6994 - 0.7007. For the potential value for the top, we consider the level of 0.7039. Upon reaching this level, we expect a pullback. Short-term downward movement is expected in the range 0.6975 - 0.6962. The breakdown of the last value will lead to an in-depth correction. Here, the target is 0.6944. This level is a key support for the top. The main trend is a local upward cycle of December 18, the correction stage Trading recommendations: Buy: 0.6995 Take profit: 0.7006 Buy: 0.7010 Take profit: 0.7030 Sell : 0.6975 Take profit : 0.6964 Sell: 0.6960 Take profit: 0.6946
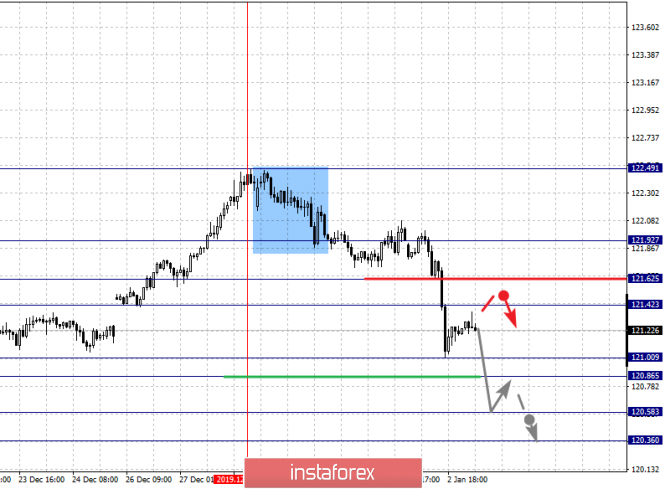
For the euro / yen pair, the key levels on the H1 scale are: 121.92, 121.62, 121.42, 121.00, 120.86, 120.58 and 120.36. Here, we are following the development of the descending structure of December 27. The continuation of movement to the bottom is expected after the passage of the noise range 121.00 - 120.86. In this case, the target is 120.58. For the potential value for the bottom, we consider the level of 120.36. Upon reaching which, we expect consolidation, as well as a rollback to the top. Short-term upward movement is possibly in the range of 121.42 - 121.62. The breakdown of the last value will lead to an in-depth correction. Here, the goal is 121.92. This level is a key support for the downward structure. The main trend is the descending structure of December 27 Trading recommendations: Buy: 121.42 Take profit: 121.60 Buy: 121.64 Take profit: 121.90 Sell: 120.86 Take profit: 120.60 Sell: 120.56 Take profit: 120.36
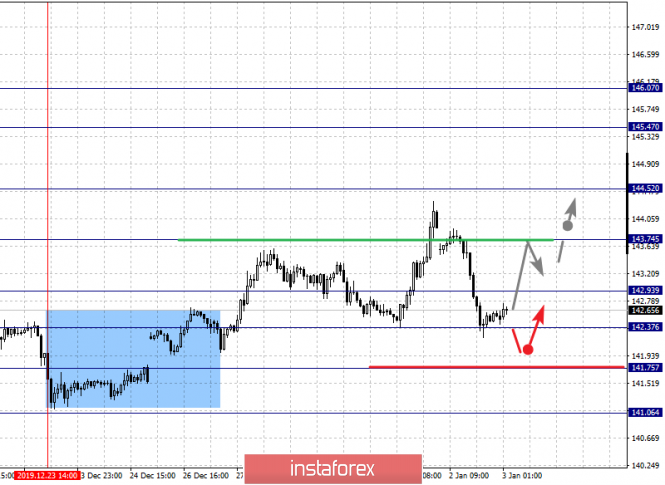
For the pound / yen pair, the key levels on the H1 scale are : 146.07, 145.47, 144.52, 143.74, 142.93, 142.37 and 141.75. Here, we are following the formation of the initial conditions for the top of December 23. The continuation of the movement to the top is expected after the breakdown of the level of 143.75. In this case, the goal is 144.52. Price consolidation is near this level. The breakdown of the level of 144.55 should be accompanied by a pronounced upward movement. Here, the goal is 145.47. For the potential value for the top, we consider the level of 146.07. Upon reaching which, we expect consolidation, as well as a pullback to the bottom. Short-term downward movement, as well as consolidation are possible in the range of 142.93 - 142.37. The breakdown of the latter value will lead to an in-depth correction. Here, the goal is 141.75. This level is the key support for the ascending structure of December 23. The main trend is the formation of initial conditions for the top of December 23 Trading recommendations: Buy: 143.75 Take profit: 144.50 Buy: 144.55 Take profit: 145.45 Sell: 142.35 Take profit: 141.80 Sell: 141.73 Take profit: 141.10 The material has been provided by InstaForex Company - www.instaforex.com |
| January 2, 2020 : EUR/USD Intraday technical analysis and trade recommendations. Posted: 02 Jan 2020 07:55 AM PST
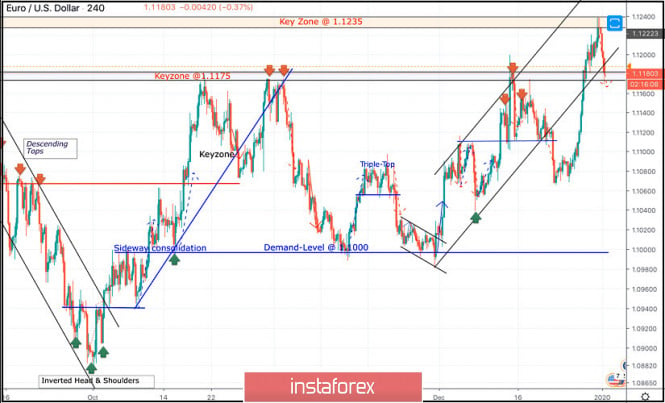
Since November 14, the price levels around 1.1000 has been standing as a significant DEMAND-Level which has been offering adequate bullish SUPPORT for the pair on two successive occasions. Shortly-after, the EUR/USD pair has been trapped within a narrower consolidation range between the price levels of 1.1000 and 1.1085-1.1100 (where a cluster of supply levels and a Triple-Top pattern were located) until December 11. On December 11, another bullish swing was initiated around 1.1040 allowing recent bullish breakout above 1.1110 to pursue towards 1.1175 within the depicted newly-established bullish channel. Initial Intraday bearish rejection was expected around the price levels of (1.1175). Quick bearish decline was demonstrated towards 1.1115 (Intraday Key-level) which got broken to the downside as well. On December 20, bearish breakout of the depicted short-term channel was executed. Thus, further bearish decline was demonstrated towards 1.1065 where significant bullish recovery has originated. The recent bullish pullback towards 1.1235 (Previous Key-zone) was suggested be watched for bearish rejection and another valid SELL entry. Suggested bearish position is currently running in profits while facing the demand level of 1.1175. That's why, partial profit-taking is suggested to offset the associated risk. Moreover, bearish breakout below 1.1175 is mandatory to allow next bearish target to be reached around 1.1120. Trade recommendations : Conservative traders should wait for bearish closure below the price level of (1.1175) as another valid SELL signal. Bearish projection target to be located around 1.1120. Any bullish breakout above 1.1250 invalidates the mentioned bearish trade. The material has been provided by InstaForex Company - www.instaforex.com |
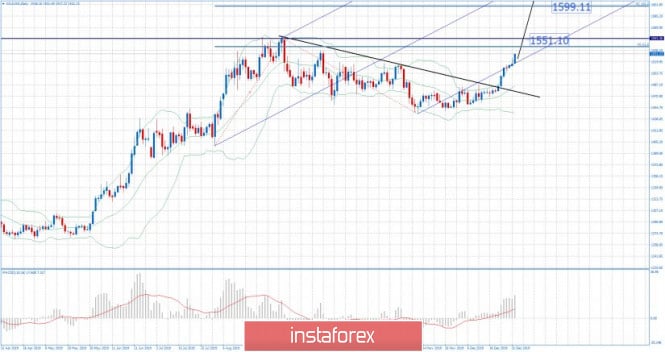
| Gold analsys for 01.02.2019 - Strong upward momentum and potential for test of $1.600 Posted: 02 Jan 2020 07:33 AM PST Gold has been trading upwards with strong momentum. The price tested the level of $1.530. I still see more upside on the Gold and potential test of $1.553 and $1.600.
The breakout of the consolidation last week was the key for strong demand on the Gold. My advice is to watch for buying opportunities on the dips using intraday-frames 5/15 minutes. MACD oscillator is showing increase on the upside momentum and new high, which is good confirmation for the further upside... Resistance levels and upward targets are seen at the price of $1.551 and $1.600. Support levels are set at the price of $1.524 and at the price of $1.516 The material has been provided by InstaForex Company - www.instaforex.com |
| January 2, 2020 : GBP/USD Intraday technical analysis and trade recommendations. Posted: 02 Jan 2020 07:31 AM PST
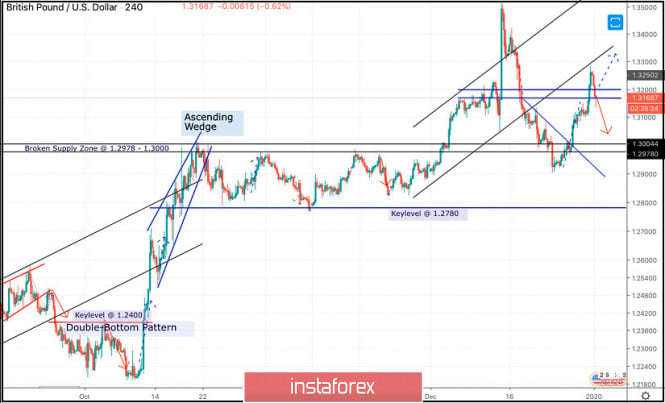
In the period between October 17 to December 4, the GBP/USD pair has been trapped between the Key Levels of 1.2780 and 1.3000 until December 4 when bullish breakout above 1.3000 was achieved. Moreover, a newly-established short-term bullish channel was initiated on the chart. The GBPUSD has recently exceeded the upper limit of the depicted bullish channel on its way towards 1.3500 where the pair looked quite overpriced. This was followed by successive bearish-engulfing H4 candlesticks which brought the pair back towards 1.3170 quickly. Further bearish decline was pursued towards 1.3000 which got broken to the downside temporarily. Technical short-term outlook turned into bearish since bearish persistence below 1.3000 was demonstrated on the H4 chart. However, earlier signs of bullish recovery manifested around 1.2900 denoted high probability of bullish breakout to be expected. Thus, Intraday technical outlook turned into bullish after the GBP/USD has failed to maintain bearish persistence below the newly-established downtrend line. That's why, bullish breakout above 1.3000 was anticipated. Thus allowing the recent Intraday bullish pullback to pursue towards 1.3250 (the backside of the broken channel) where bearish rejection and another bearish swing were suggested for conservative traders in the previous article. Intraday bearish target would be projected towards 1.3000 provided that the current bearish breakout below 1.3170 is maintained by the end of Today's consolidation. On the other hand, if a bullish H4 hammer candlestick is confirmed, further bullish pullback would be expected towards 1.3350 again. The material has been provided by InstaForex Company - www.instaforex.com |
| EUR/USD. January 2. A sell signal with a target of 1.1125 has been received Posted: 02 Jan 2020 07:31 AM PST EUR/USD - 4H.
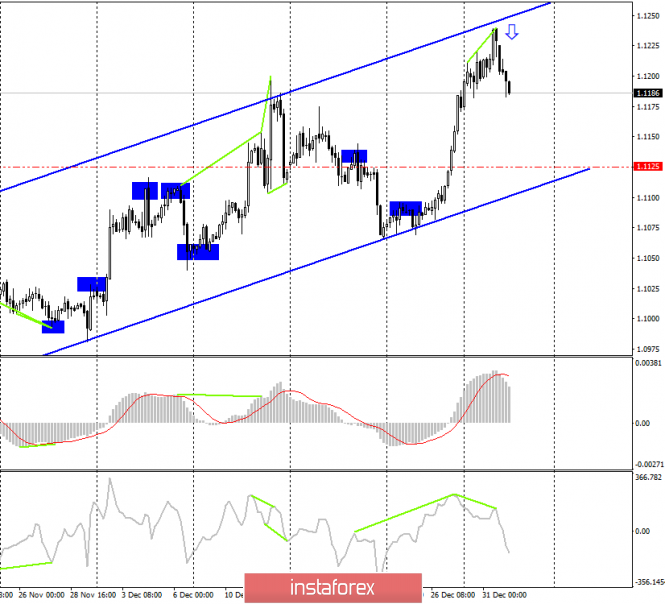
On December 31, the EUR/USD pair performed a reversal in the upper area of the upward trend corridor. The only thing is that the signal was not the most accurate since the upper limit itself could not be reached by bull traders. However, in my previous review, I said that the reversal could be around the level of 1.1248. And so it happened. In addition to the reversal in favor of the US currency, a bearish divergence was formed at the CCI indicator, which also worked in favor of the beginning of the fall in the direction of approximately the level of 1.1125, that is, in the direction of the lower line of the upward corridor. It is around this level that I expect a pair of euro-dollar tomorrow or Monday. In the coming reviews, new trading ideas will be presented, each of which will provide conditions for entering the market and the conditions under which the trading idea loses its meaning. Forecast for EUR/USD and trading recommendations: The trading idea is to sell the pair with a target of approximately around 1.1125. It was best to sell in the area of the upper line of the corridor, but on the correction, after the rollback up, you can try to enter the market with sales to those who are late. The material has been provided by InstaForex Company - www.instaforex.com |
| GBP/USD. January 2. All three goals for the previous trading idea have been worked out Posted: 02 Jan 2020 07:31 AM PST GBP/USD - 4H.
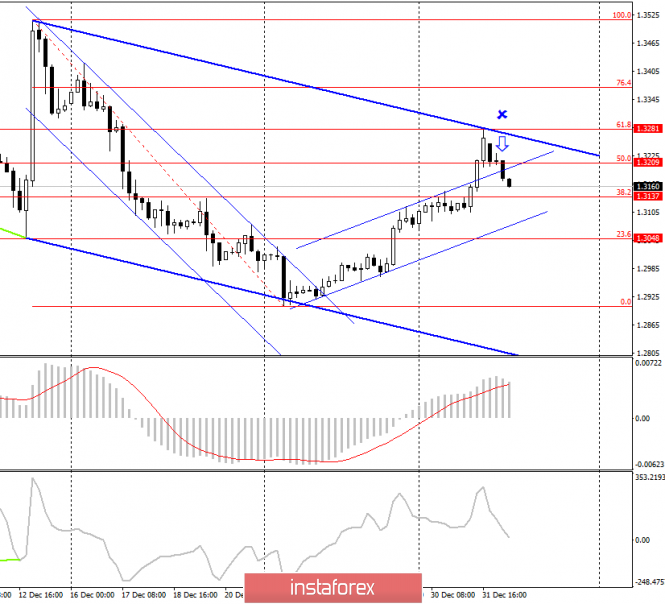
On December 31, the GBP/USD pair completed the growth to the correction level of 61.8% (1.3281), which I designated as the last, third target for purchases on the previous trading idea. Thus, the rebound of the pound-dollar pair from this level worked in favor of the US dollar and allowed traders to consider sales. The pair remains within the larger downward trend corridor and performed a reversal in the upper area. The U-turn occurred even a little above the upper line of the corridor, but "perfect shots-rebounds" do not happen every time. One way or another, but a new sales signal was received with the goals of 23.6% (1.3048), 0.0% (1.2904), and if you take a longer-term plan, then even lower. However, for now, I recommend considering realistic targets of 1.3050 and 1.2900. Forecast for GBP/USD and trading recommendations: The trading idea is to sell the pound with targets of 1.3050 and 1.2900. Ideally, it would be best to sell near the top line of the downward corridor, but now it is also not too late. The price has not moved far from those levels and has a strong potential to fall. The material has been provided by InstaForex Company - www.instaforex.com |
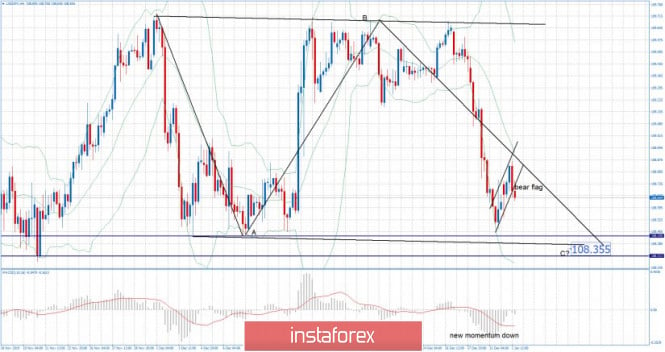
| Posted: 02 Jan 2020 06:59 AM PST USD/JPY has been trading downwards in the recent few days. I found that that JPY is heading to test the important multi-pivot support at the price of 108.35.
I found the potential end of the upward correction (bear flag pattern), which is sign that selling opportunities are preferable. There is potential completion of the bigger ABC consolidation. MACD oscillator did show increase on the downside momentum in the background and potential for the further downside. Resistance level is seen at the price of 108.86 and 109.10 Support levels are set at the price of 108.50 and at the price of 108.35 The material has been provided by InstaForex Company - www.instaforex.com |
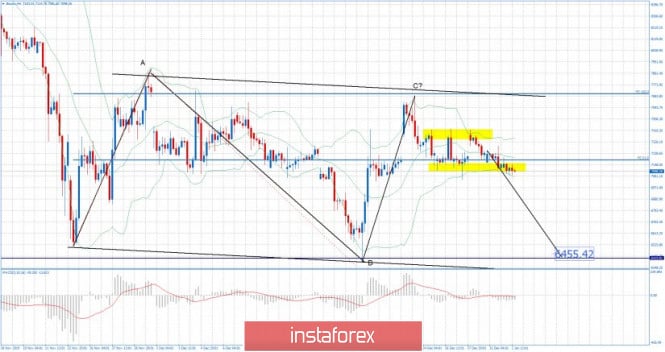
| BTC analysis for 01.02.2020 - Watch for potential drop on the BTC Posted: 02 Jan 2020 06:37 AM PST Industry news: According to data provided by Blockchain, Bitcoin hashrate has reached a new all-time peak of 119 EH/s, which flies in the face of FUD (fear, uncertainty, and doubt) about imminent market capitulation. The Bitcoin network continues to get significantly stronger despite the asset's lackluster price action. Technical analysis:
Bitcoin is still trading inside of the consolidation at the price of $7.103 and there is potential for the further downside movement. My analysis from previous analysis I still the same and I do see potential completion of the upward correction ABC (running flat), which is a sign that selling is in play... Watch for selling opportunities and target at the price of $6.455. MACD oscillator is showing rotation from the natural mode into the bearish mode, which is sign that there is the big move that is coming and potential expansion period. Yellow rectangles – Current trading range Resistance levels are seen at the price of $7.400 and $7.700 Support levels are set at the price of $7.030 and at the price of $6.455The material has been provided by InstaForex Company - www.instaforex.com |
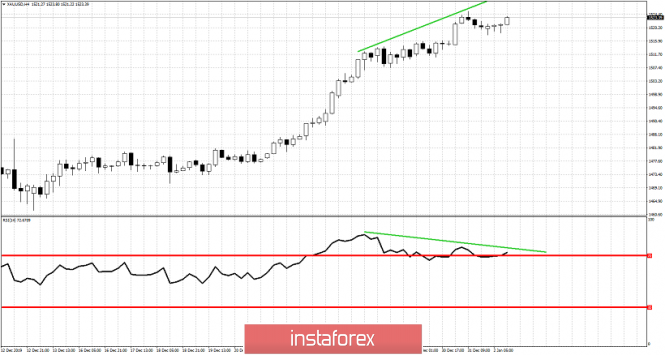
| Gold price is showing warning reversal signs Posted: 02 Jan 2020 05:56 AM PST Gold price continues to make higher highs and higher lows. Price is in a bullish short-term trend and we can soon see a new higher high towards $1,530-40 area. However the RSI is providing us with some warning reversal signs that should be taken under serious consideration.
Gold price is challenging recent highs. However the RSI does not confirm this bullish strength. So far we have one divergent new higher high and a second one most probably today will occur. This would be an important bearish warning sign. Bulls should be very cautious and are now warned by this divergence. Short-term support is at $1,517. Breaking below this support level will open the way for a pull back towards $1,490-$1,500 at least as we have been expecting from the end of last week. I believe this is not the time to chase the price at current levels. Bulls should be very patient and wait for a pull back, while bears could see the new higher high as an opportunity to go against the trend specially if we see another bearish divergence. The material has been provided by InstaForex Company - www.instaforex.com |
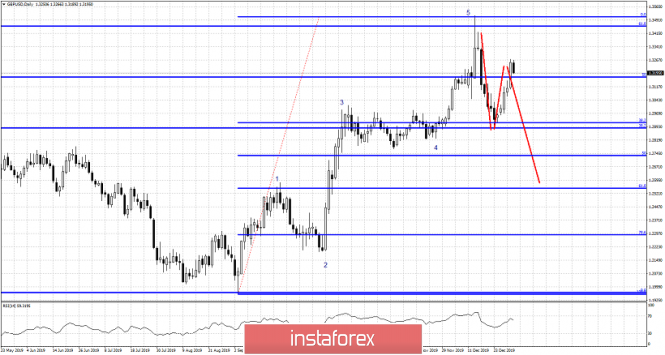
| Short-term Elliott wave analysis on GBPUSD Posted: 02 Jan 2020 05:51 AM PST GBPUSD is following so far our expected path from our past analysis. GBPUSD has pulled back towards 1.29 as expected and has bounced back to 1.32-1.33 area as part of wave B. Will price continue to follow our expected wave path?
GBPUSD is showing reversal signs. This could be the wave B top we were expecting. There are many chances of GBPUSD falling below recent lows at 1.29 as wave C of the corrective pattern that we are in since the top around 1.35. GBPUSD bulls need to be very cautious now. Short-term support is found at 1.31 and next at 1.30. Resistance is at 1.3280. I believe GBPUSD is more likely to continue lower than break above December highs. The material has been provided by InstaForex Company - www.instaforex.com |
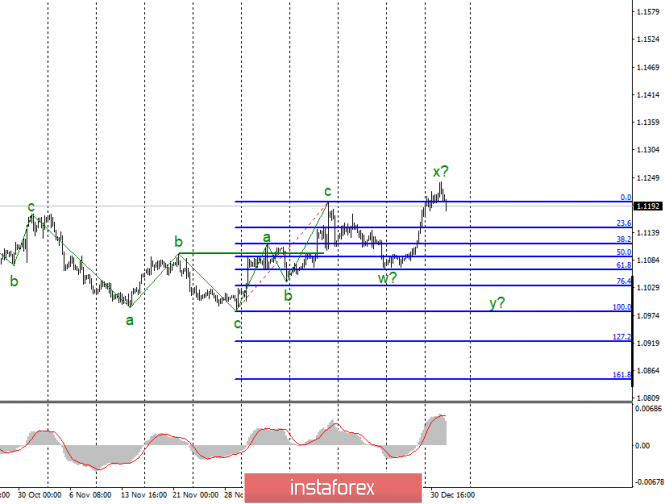
| Posted: 02 Jan 2020 05:37 AM PST EUR/USD
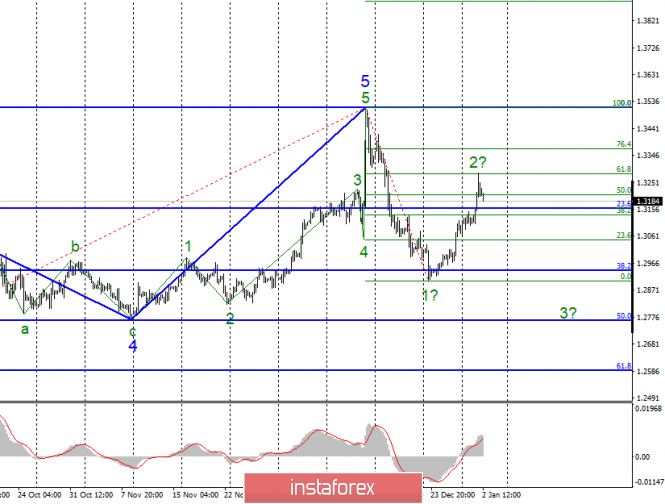
On December 31, the EUR/USD pair increased by another 30 basis points, thus ending 2019 on a major note. However, the year 2020 begins with a decline, and the decline is highly anticipated. The current wave layout has been slightly transformed due to the last day of 2019, but it still assumes the construction of a downward wave. If this assumption is correct, the tool has the potential to reduce under the low of wave w. At the same time, a new update for the peak of wave x is likely to lead to complications of the upward trend and the transformation of the entire wave pattern. Fundamental component: The news background for the euro-dollar instrument is surprisingly present. Immediately on the first day of the new year in the eurozone, business activity indices were released in the production areas of some of the largest countries. It is difficult to say how to interpret all the figures together since the pan-European index was 46.3, which is slightly higher than the value of November. The German and Spanish indexes also rose slightly. But in Italy and the UK - they fell even further, to 46.2 and 47.5. Thus, it is impossible to say that the dynamics are positive. And in any case, the increase in comparison with November is minimal. This is probably why the euro currency did not feel the effect of these economic reports at all. A little later, business activity will be known in America, where no major changes are expected at the end of December. Also, an important factor is the markets' wagering of the new year's rally, in which the euro added much more than the markets expected. In general, we can say that the current values of business activity in the eurozone are not high enough for the euro to continue to increase. So I'm looking forward to building a downward wave, despite the importance of business activity in America's manufacturing sector. General conclusions and recommendations: The euro-dollar pair have presumably completed the construction of an upward trend section. Thus, I would recommend selling the instrument with targets located near the marks of 1.1034 and 1.0982, which corresponds to 76.4% and 100.0% for Fibonacci. The signal from the MACD "down" indicates that the instrument is ready to build a new downward wave. GBP/USD
The GBP/USD pair increased by 150 basis points on December 31. Thus, the correction from the expected first wave of the new downward trend was exactly 61.8%. An unsuccessful attempt to break this mark of 1.3280 indicates that the instrument is ready to build a wave 3 with targets located near the 29th figure and below. A successful attempt to break the maximum of the expected wave 2 will indicate that the market is ready for further purchases and will lead to the need to make additional adjustments to the current wave markup. Fundamental component: The news background for the GBP/USD instrument on Thursday is weak but present. The index of business activity in the UK manufacturing sector was 47.5 in December, with slightly higher expectations of the currency market. I can't say that it was this economic report that affected the low demand of the pound on January 2. Rather, it is the wave pattern that "pushes" the instrument down, since the upward section of the trend is completed with a probability of 90%. Nevertheless, another nondescript report from Britain suggests that the economy continues to experience, if not problems, then certain difficulties. Given this point, the pound has already "exceeded the plan" at the end of 2019. Thus, the decline of the "Briton" is justified now in terms of technology, and in terms of waves, and in terms of news and reports. General conclusions and recommendations: The pound-dollar instrument continues to build a new downward trend. I recommend resuming sales of the instrument with targets located near the mark of 1.2764, which corresponds to the Fibonacci level of 50.0% since wave 2 or b is presumably completed. The material has been provided by InstaForex Company - www.instaforex.com |
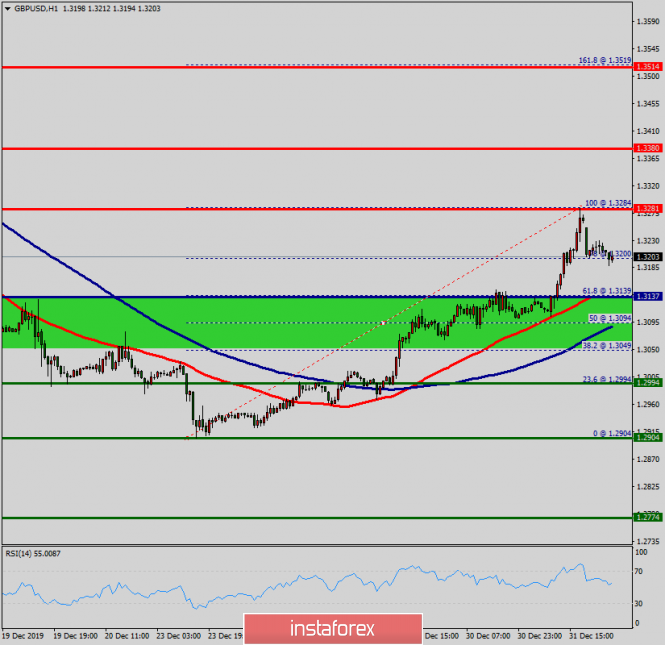
| Technical analysis of GBP/USD for January 02, 2019 Posted: 02 Jan 2020 04:51 AM PST Overview: The GBP/USD pair faced resistance at the level of 1.3281, while minor resistance is seen at 1.3204. Support levels found at the prices of 1.3137 and 1.3048. Pivot point has already set at the level of 1.3137. Undoubtedly, the GBP/USD pair is still moving around the key level at 1.3137, which represents a daily pivot in the H1 time frame at the moment. Last week, the GBP/USD pair continued moving upwards from the level of 1.3137. The pair rose to the top around 1.3281 from the level of 1.3137 (coincides with the ratio of 61.8% Fibonacci retracement). Resulting from, the GBP/USD pair broke resistance, which turned into strong support at the level of 1.3137. The level of 1.3137 is expected to act as the major support today. We expect the GBP/USD pair to continue moving in the bullish trend towards the target level of 1.3284. On the downtrend: If the pair fails to pass through the level of 1.3284, the market will indicate a bearish opportunity below the level of 1.3284. As a consequence of the market will decline further to 1.3137 and 1.3049 to return to the daily support. Additionally, a breakout of that target will move the pair further downwards to 1.2994. By contrast, if a breakout happens at the support level of 1.3281, then this scenario may be invalidated. The material has been provided by InstaForex Company - www.instaforex.com |
| EUR/USD: post-holiday "hangover" and the Fed report Posted: 02 Jan 2020 04:14 AM PST In the last days of December, the EUR/USD pair jumped by 200 points, ending 2019 at 1.1229. After such a rapid price jump, a corrective roll back follows - especially if we are talking about a "thin" market. Therefore, today's price dynamics is quite logical, although many analysts predicted a deeper decline on the price, up to the base of the 11th figure. The first working day in 2020, however, presents its first surprises. EUR/USD bears show a certain weakness where each point they conquered is clearly given to them with difficulty. The PMI data published today only complicated the task for sellers of the pair. The December indices of business activity in the manufacturing sector were revised upward, providing little support to euro. For example, the pan-European index was at 46.3, while the initial estimate was at 45.9 points. And although the indicator still remained below the key 50-point level, the trend itself allowed the pair's bulls to slow down the price decline.
In turn, the US currency, demonstrated its vulnerability. The dollar index is at the base of the 96th figure (for comparison: a month ago it was around 98 points), reflecting the weak demand for the currency. Yesterday, Donald Trump confirmed rumors that the signing ceremony of the first phase of the trade deal will take place in January, however, it will not be held this weekend (as previously expected), but on January 15 instead. The fact that the parties agreed on the first phase was known in mid-December, and the market played this news occasion and began to prepare for the next negotiation process, which promises to be more difficult than last year. Nevertheless, Trump's tweet put pressure on the dollar, as it has recently been used as a defensive asset. A positive stream of news about the prospects for the US-Chinese relations has changed the overall fundamental picture in the market, reducing the interest of traders in the dollar, which served as a kind of "island of security" at the end of last year. It is likely that during the American session on Thursday, the EUR/USD bears will still approach the first support level of 1.1150 (the Tenkan-sen line on the daily chart) – but short positions on the pair still look risky. Tomorrow, the minutes of Fed's last meeting will be published, which may put additional pressure on the US currency. Let me remind you that the results of the December meeting were ambiguous. On one hand, members of the Federal Reserve removed the phrase "uncertainty about future forecasts" from the text of the accompanying statement. In addition, all members of the Committee voted unanimously to maintain the status quo – there has not been such unity in the Committee since May last year. Also, the members focused on the positive aspects of the American economy: they noted the "strength" of the labor market in the United States and moderate economic growth, while expressing confidence that in 2020, inflation will reach the targeted two percent level. All other aspects of the December meeting were more or less negative. First, the regulator said that consumption growth has slowed significantly, while the decline in investment has increased markedly. Company investment and exports remain weak. There's also inflation, which Jerome Powell stated to remain below the targeted two percent level. If this trend continues, it could lead to "unhealthy dynamics" in the country's economy. In addition, Fed's head repeated his opinion on the conditions under which the regulator will begin to tighten monetary policy. According to him, the inflation rate should not only exceed two percent, but also stay at this level for some time before Fed will consider raising the interest rate. Dollar bulls were also disappointed with Fed's dot plots forecast. Most members of the regulator – 13 – were in favor of maintaining a wait-and-see position throughout the next year. At the same time, there were more "hawks" – 9 of the 17 members of the fed voted for a rate increase in 2020 – back in September. At the December meeting, only 4 Committee officials supported this step. It's only on 2021 that the Fed plans to return to raising the interest rate. Nine members of the Fed favored one or two increases while the others either favored maintaining a wait-and-see position, or a more dramatic rate increase.
Overall, the Fed put on a long-term pause in the process of easing monetary policy, while dollar bulls expected at least one round of rate increases in the next year. The report on the December meeting will be published tomorrow, and will help to understand how much the Fed members are concerned about the weak dynamics of inflation growth, in the context of the prospects for monetary policy. If most of them voiced "dovish" rhetoric, dollar may undergo some pressure. The price "ceiling" for the pair is at 1.1240 – a five-month high, which was reached on the last day of last year, and now acts as a resistance level. The support level is at 1.1150 (Tenkan-sen line on the daily chart) and 1.1110 below (Kijun – sen line on the same timeframe). The pair is still on the upper line of the Bollinger Bands indicator on D1, while the Ichimoku indicator continues to show a bullish "Line Parade" signal. All these suggests that the pair has not exhausted the potential for its further growth – at least by the middle of the 12th figure. The material has been provided by InstaForex Company - www.instaforex.com |
| Trader's diary for 01/02/2019. EURUSD. Market condition Posted: 02 Jan 2020 04:00 AM PST
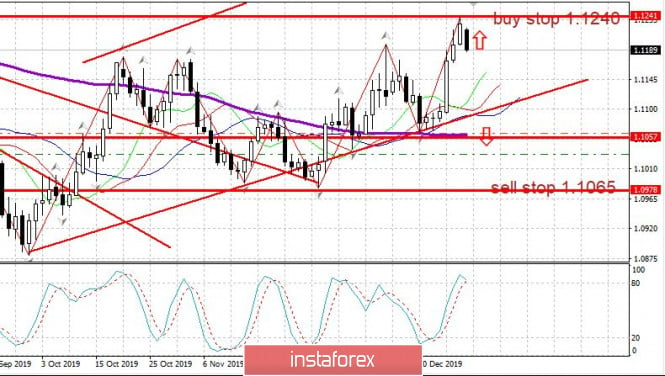
Happy New Year, ladies and gentlemen! Above is the daily chart of the euro. Let's assess the state of the market. The closing of the trading day on December 31 above the weekly level of 1.1200 is a strong technical signal for the upward trend. Cancellation of the trend - a fall below 1.1100. Levels to buy from the rollback: 1.1145; 1.1120. A revolution down - 1.1065. The material has been provided by InstaForex Company - www.instaforex.com |
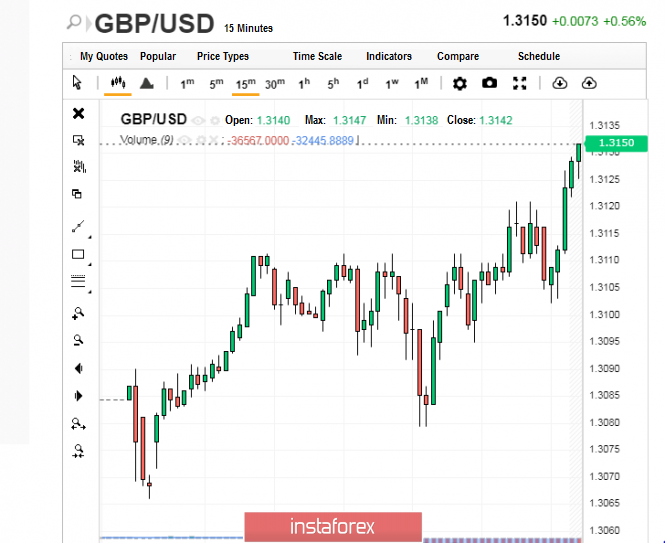
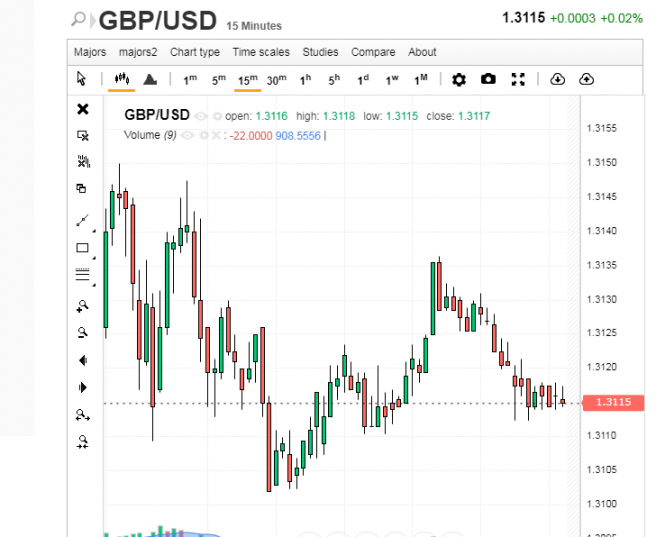
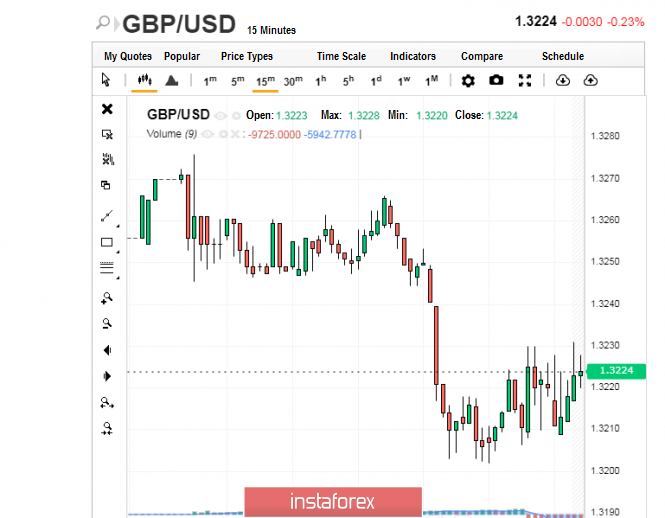
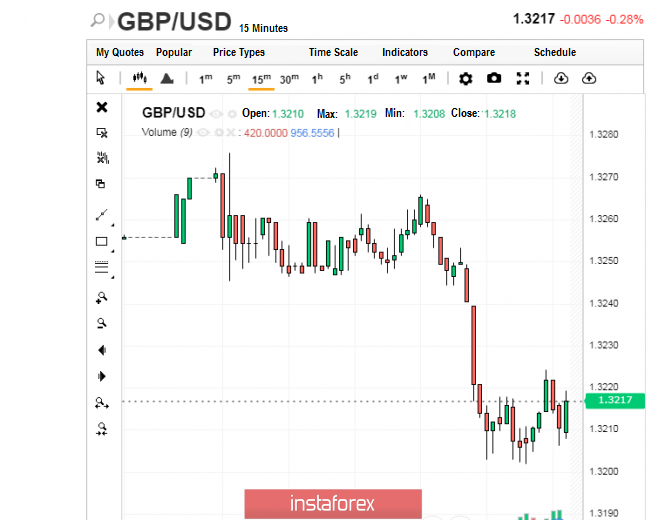
| Pound: faces difficulty in rising Posted: 02 Jan 2020 02:53 AM PST The beginning of the new year and the new trading session did not bring optimism on the dynamics of the British currency. Pound is still at the mercy of conflicting drivers that are slowing its upward movement. At the end of 2019, experts recorded uneven dynamics of pound. On Monday, December 30, it went up sharply, and the GBP/USD pair rose to the level of 1.3150. The currency, however, could not stay at this level. On Tuesday, December 31, the New Year's surprise was a noticeable collapse of the pound. The GBP/USD pair sank to 1.3115, losing its hard-won positions, and experts have recorded a clear tendency of a further fall. The British currency had to put a lot of effort to recover. It was able to overcome a number of obstacles and reach maximum levels on Thursday, January 2, as it rose to an impressive 1.3224, recovering from earlier losses. At the moment, the GBP/USD pair is trading in the range of 1.3216-1.3217, showing an upward trend. Taking advantage of the lull in the market, the British currency is trying to break out in the lead, and so far, it is still succeeding. In the last days of 2019, the price of pound rose along with dollar, adding about 300 points. Since this growth was not due to any fundamental factors or macroeconomic indicators, experts fear a resumption of a downward trend in the GBP/USD pair. Analysts do not rule out a fall to the level of 1.2900 or even 1.2800. In case of increasing interest in the tandem in general and the pound in particular, the top target for the pound will be the level of 1.3514. However, analysts believe that the correction will most likely be smoothly flowing into a downward trend. A number of economists also believe that the coming year will be decisive for the pound as it will have to endure all the difficulties associated with the UK's exit from the EU. Over the past three years, the British currency has experienced huge overloads on the background of Brexit negotiations. In the coming year, UK will have to face the consequences of leaving the European Union and resolve all issues related to this step. According to experts, the country will face geopolitical problems both in Ireland and in Scotland, seeking to leave the United Kingdom. If Prime Minister Boris Johnson fails to reach an agreement on further trade relations with Brussels, it will deal a sensitive blow to the British economy. Another factor undermining the potential growth of the pound may be December's data on the business activity in the UK manufacturing sector. Their publication is expected today, and according to analysts' forecasts, it will be below the expected value, although a small increase is possible (up to 47.6). In November, the figure was at 47.4. According to preliminary estimates, the overall situation in the manufacturing sector will remain the same, and this will deprive the pound of significant support. Experts are expecting the British currency to resume its downward trend at the beginning of this month. Economists believe that the pound will experience frequent failures in the future, and from time to time, will have difficulties in growing. This month, the pound will overcome many obstacles to reach the next heights. Its efforts, however, will not be in vain, as experts still believe that it will still be able to recover. The material has been provided by InstaForex Company - www.instaforex.com |
| Trading plan on EUR/USD for January 2, 2020. Posted: 02 Jan 2020 02:41 AM PST
So, the new trading year 2020 has started. Happy New Year to you! The EUR/USD exchange rate is experiencing a downward pressure on the first hours of trading. However, everything is within the upward trend so far: The signal for the trend is a break and consolidation above 1.1200. Keep buying from 1.1035, like from the beginning of December. It makes sense to keep buying from 1.1100. Buy from 1.1200. I would write about breakeven. Possible rollback on buying from 1.1185. Sell from 1.1065. The material has been provided by InstaForex Company - www.instaforex.com |
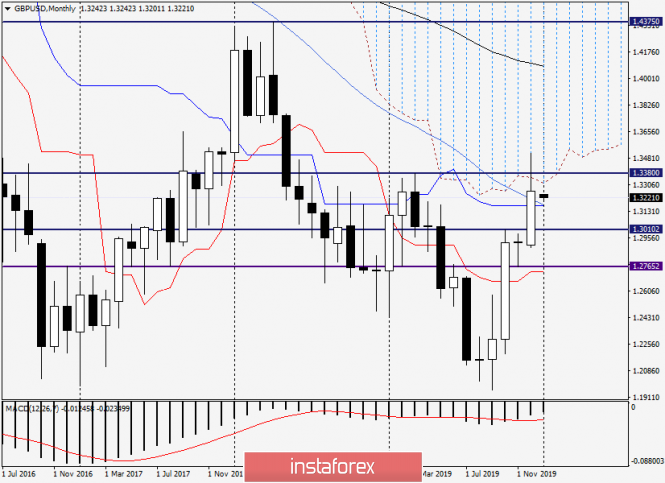
| Analysis and trading ideas for GBP/USD for January 2, 2020 Posted: 02 Jan 2020 01:33 AM PST Hello again everybody! Well, the year 2019 ended, which the British pound spent under the influence of the "divorce" process between the UK and the European Union. Naturally, the price dynamics of the GBP/USD currency pair (as well as all other pairs) were influenced by trade contradictions between the US and China. However, Brexit plays a special role for the pound and, by the way, the euro. Let me remind you that as a result of the victory of the conservatives led by the current Prime Minister Boris Johnson, Great Britain must leave the EU within this month, that is, until January 31. What will happen next and how the completion of the divorce process will affect the dynamics of the British currency is, of course, an interesting question. I would venture to assume that all pairs with the pound will experience increased volatility, accompanied by sharp and strong movements, and in each direction. In this regard, I suggest looking for an answer to the question about the further direction of GBP/USD on the price charts. Since we just closed December, let's start with the monthly timeframe. Monthly
For the pound-dollar pair, the December trading ended with strengthening, but there are several important points to note here. First, it is the long upper shadow of the December candle. Second, a false breakout of the iconic resistance level of 1.3380. Another negative point was the inability of the pair to enter and consolidate the December closing price within the Ichimoku indicator cloud. Of the positive signals, it is worth noting the closing of the last month above the Kijun line and 50 simple moving average. The first trading in 2020 began negatively for the pair. At the time of writing, there is a moderate decline and trading is conducted near 1.3217. If the downward trend continues, I recommend watching the price behavior near 1.3170. It is here that the previously broken Kijun and 50 MA converged. Of course, the schedule is monthly and various price flights are possible, but nevertheless. We simply denote this figure - 1.3170. In the case of a resumption of the rise, we look at what will happen near 1.3313. This is where the lower boundary of the Ichimoku indicator cloud lies, which can resist growth attempts. These are, in my opinion, the nearest landmarks at the bottom and top of the monthly chart. We pass to smaller timeframes. Daily
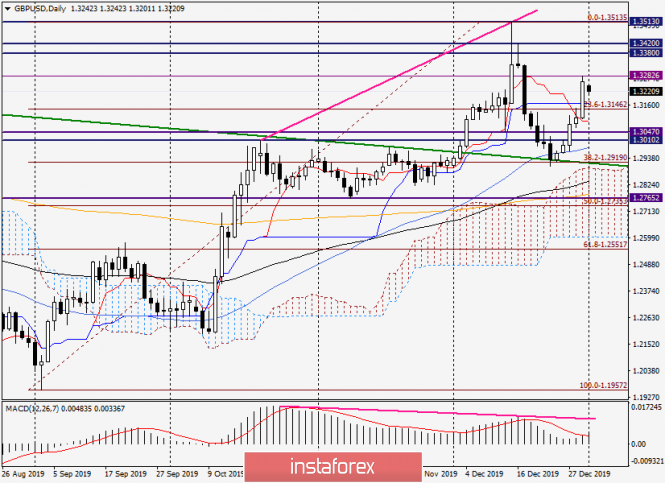
After the rapid growth shown on the last day of last year, trading on January 2 opened with a price gap down. Thus, the assumptions about the gap, which we will see after the opening of trading on January 2, were fully justified. On the technical side, you should pay attention to the presence of bearish divergence of the MACD indicator. Day diver - this is serious, if it starts to work out or at least discharge, it will not seem enough! This means that you need to be extremely careful with purchases and open only if there are good signals. Support on the daily chart can be provided by the Kijun line at 1.3170 and Tenkan at 1.3093. At the same time, the mark of 1.3170 was already mentioned in this review. The nearest resistance is represented by the December 31 highs at 1.3282. Only a true breakout of this level will open the way to a strong technical area of 1.3380-1.3420. Naturally, this will not happen immediately and, most likely, not today. While the market is swinging in anticipation of new drivers for the movement. By the way, the price dynamics of the GBP/USD pair can be affected by data on the PMI manufacturing activity index from the UK, which will be published today at 10:30 (London time). From the American reports, it is worth paying attention to the initial applications for unemployment benefits, which will be released at 14:30 (London time). So, it makes sense to consider sales after the pair rises to the price area of 1.3260-1.3280, and purchases after the decline to the area of 1.3200-1.3170. That's all for now. Good luck! The material has been provided by InstaForex Company - www.instaforex.com |
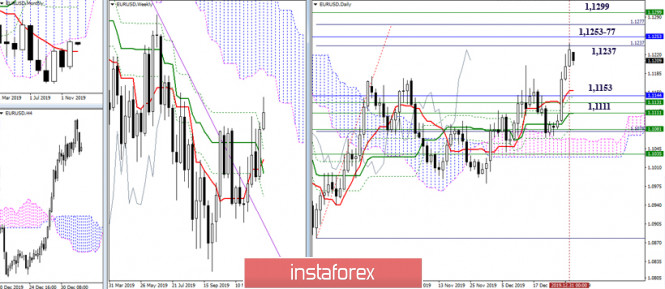
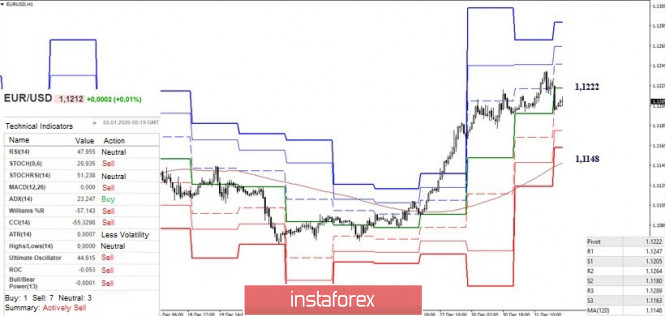
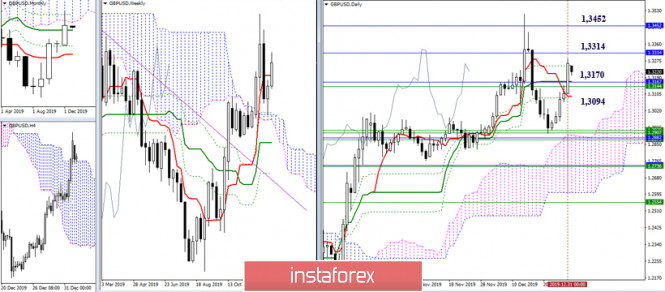
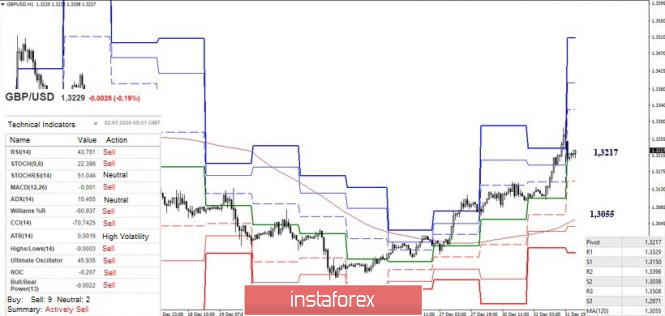
| Technical analysis recommendations for EUR/USD and GBP/USD on January 2 Posted: 02 Jan 2020 01:19 AM PST EUR / USD Players on the upside managed to optimistically close the last month of the outgoing year. During the increase, the pair worked the first target of the daily target for the breakdown of the cloud (1.1237). This level was where we met the first resistance, which is a quite wide, zone of resistance (1.1237 - 1.1253 - 1.1277 - 1.1299). Now, passing these levels will allow the pair to penetrate the Ichimoku clouds at the most upper times (week - month), which will entail the formation of new upward prospects. At the same time, players on the upside can take a break having completed the tasks of closing the month and year. The nearest support zone is now in the area of 1.1153 - 1.1111 (daily cross + weekly cross + monthly Tenkan). The development of the current correction has led the pair to lose support for the central pivot level (1.1222). At the moment, the first support of the classic Pivot levels (1.1205) is being tested for strength, and then the support is located at 1.1180 (S2) - 1.1163 (S3). Today, the closing and most important support is the weekly long-term trend which is located at 1.1148. To change the current balance of forces and the emergence of new opportunities for players to increase in this situation, you need to regain the central Pivot (1.1222) and leave the correction zone (1.1240). GBP / USD Last December, the players on the upside managed to close above the monthly medium-term trend (1.3167), but the resistance met 1.3314 (the lower border of the monthly cloud) - 1.3452 (monthly Fibo Kijun) remained unfulfilled. Now, consolidation above will open up new horizons for players on the upside. At present, the pull is at the daily Fibo Kijun (1.3250), while nearest support is concentrated in the area of 1.3170-1.3094 (daily cross + weekly Tenkan + monthly Kijun). Meanwhile, on the lower time-frames, the development of correction is observed. At the moment, the struggle is for the central Pivot level (1.3217). Further, the weekly long-term trend (1.3055), the nearest Pivot level S1 (1.3150) may act as intermediate support with the continuation of the decline on the way to the key reference point of the correction. Therefore, a conversation about the plans and opportunities for players on the upside will be possible after leaving the correction zone and consolidating above the maximum extremum (1.3284). Ichimoku Kinko Hyo (9.26.52), Pivot Points (classic), Moving Average (120) The material has been provided by InstaForex Company - www.instaforex.com |
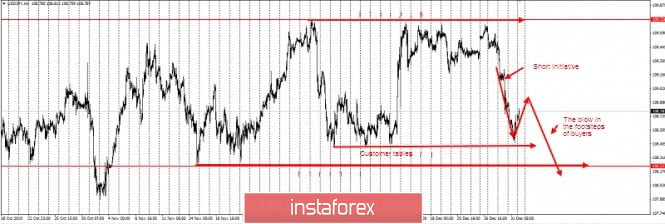
| Posted: 02 Jan 2020 01:06 AM PST Good day, dear traders! I wish you all a Happy New Year! I wish you good, money and peace of mind! The opening of the market on the first trading day of the new year was relatively quiet compared to last year. In my opinion, the most interesting of the major currencies is USDJPY due to the presence of quite powerful stop levels for quotes 108.4-108.2 In this regard, I recommend working on a downgrade to update these levels and fix profits on them. This idea will be relevant as long as the price is within the short initiative shown on the chart. If the market is fixed above 50% of this initiative, the short scenario will be canceled. I remind you that today is the New Year in Japan, and tonight - the protocols of the FOMC. Success in trading and control risks. The material has been provided by InstaForex Company - www.instaforex.com |
| Posted: 02 Jan 2020 12:44 AM PST 4-hour timeframe
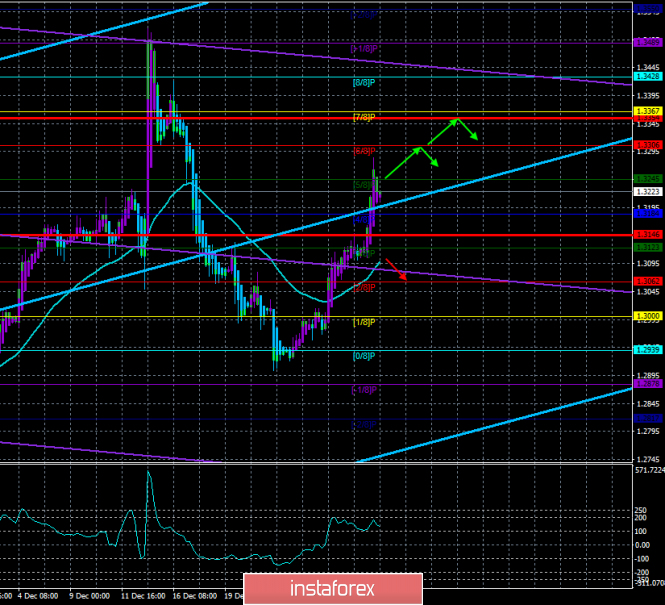
Technical data: The upper channel of linear regression: direction - up. The lower channel of linear regression: direction - down. The moving average (20; smoothed) - up. CCI: 128.9549 The British pound in the last days of the past year also rose in price paired with the US currency and added about 300 points. Just like the euro currency, this growth was not supported by any fundamental factors, macroeconomic events, and so on. Thus, just as in the case of EUR/USD, we believe that now is the time for the pound to resume the downward trend with a fall, at least, to the levels of 1.2900 and 1.2800. Of course, theoretically, if the pound continues to enjoy increased demand, then the growth of the pair will continue. All also without any fundamental grounds. However, we believe that traders will still return to the usual trading mode, using logic. Thus, today or tomorrow, the pound-dollar pair may begin a correction to move, and in the future, it may be closed under this line with a change of trend to a downward one. For the pound, by the way, the most important year in recent decades has come. The last three years have been completely linked to the procedure for bringing Brexit through Parliament. 2020 will be associated with the UK's exit from the European Union and all the consequences of such a step by the government of Boris Johnson. In principle, we have repeatedly noted that in any case, the British economy will be hit hard. In any case, Britain will face geopolitical problems such as riots on the island of Ireland, Scotland's desire to leave the United Kingdom through an independence referendum, problems with the Spanish government on the issue of Gibraltar, and so on. But if Boris Johnson still fails to reach an agreement with Brussels on trade relations after 2020, it will be an additional blow to the British economy. Thus, in the last months of 2019, the British pound has risen in price and this growth is a great acceleration for the pair and traders begin new mass sales of the British currency. There are no other fundamentally justified scenarios for the pound. Today, by the way, the UK will publish the index of business activity in the manufacturing sector for December. As you might guess, the forecasts are again disappointing. A value of 47.6 is expected, compared to the previous month's value of 47.4. As we can see, a small improvement is possible, but not so strong that we can state the "recovery" of the industry. Thus, the general state of things in the manufacturing sector will not change, and the pound is unlikely to receive support based on this macroeconomic report. Moreover, as in the case of the euro, we believe that it is time for the pound to "pay off its debts" a long time ago. We still believe that the clouds are "gathering" over the UK, and the growth of the British pound in the last three months is just a New Year and Christmas gift to the currency from traders. Already at the beginning of this year, in its first months, we are waiting for the resumption of the downward trend and believe that it will be quite strong. Throughout 2020, the multi-year lows of the British currency may be updated. As a result, we recommend waiting for the technical indicators to turn down, especially since the lower linear regression channel has already performed such a turn. Now it is necessary to overcome the moving average line with the change of the trend to a downward one, after which it will be possible to consider short positions again.
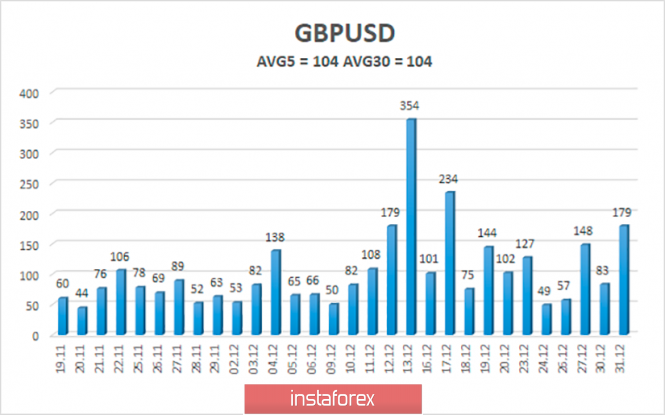
The average volatility of the pound-dollar pair over the past 5 days is 104 points, remaining at a fairly high level. According to the current level of volatility, the working channel on January 2 is limited to the levels of 1.3146 and 1.3354, and we believe that the pair will strive for its lower border. Nearest support levels: S1 - 1.3184 S2 - 1.3123 S3 - 1.3062 Nearest resistance levels: R1 - 1.3245 R2 - 1.3306 R3 - 1.3354 Trading recommendations: The GBP/USD pair is currently continuing its upward movement. Thus, traders are advised to stay in the pair's purchases with the targets of 1.3245 and 1.33306 until the Heiken Ashi indicator turns down. It is recommended to return to the sales of the pound-dollar pair not earlier than the reverse consolidation below the moving average line with the first goal of 1.3000. In addition to the technical picture, you should also take into account the fundamental data and the time of their release. Explanation of the illustrations: The upper channel of linear regression - the blue lines of the unidirectional movement. The lower channel of linear regression - the purple line of the unidirectional movement. CCI - the blue line in the indicator regression window. The moving average (20; smoothed) - the blue line on the price chart. Murray levels - multi-colored horizontal stripes. Heiken Ashi - an indicator that colors bars in blue or purple. Possible variants of the price movement: Red and green arrows. The material has been provided by InstaForex Company - www.instaforex.com |
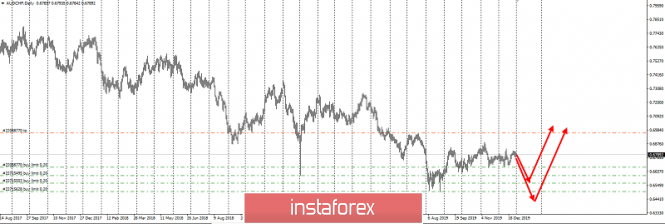
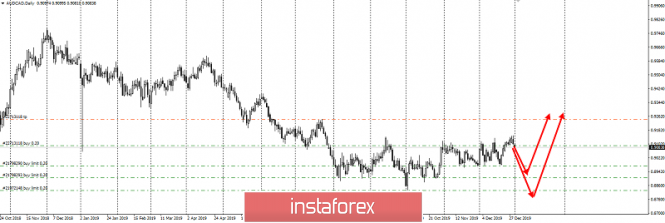
| Posted: 02 Jan 2020 12:34 AM PST Good afternoon, dear traders! Congratulations to all a Happy New Year! I wish you good luck, money, and peace of mind! The opening of the market on the first trading day of the new year was relatively calm, compared with the phenomenal results for the yen and the Australian dollar during 2019. At the end of last year, we unloaded on AUD/CAD in profit, and now, the whole Australian group is rolling back. This is a good opportunity to get longs, and my trading plan for the distribution of limit purchases is on the screen below: AUD/CHF: AUD/CAD: I remind you that these crosses have a fairly narrow range without a pullback, and are now at historical lows. Therefore, the principle of "buy cheap" here works better than anywhere else. I wish you all success in trading and control risks. The material has been provided by InstaForex Company - www.instaforex.com |
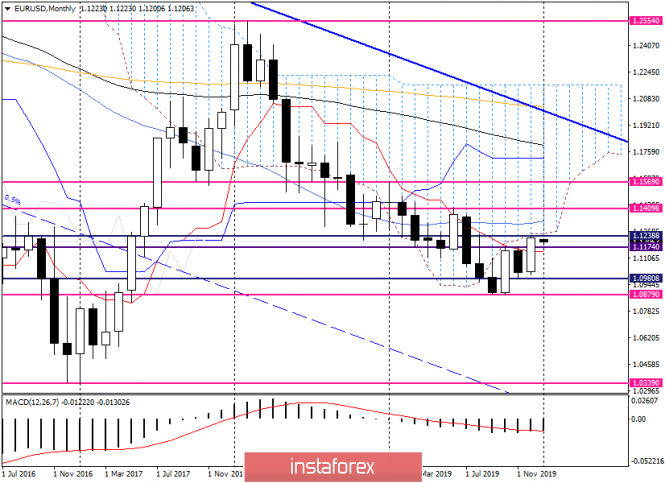
| Overview and recommendations for EUR/USD for January 2, 2020 Posted: 02 Jan 2020 12:30 AM PST Hello, dear colleagues! That's the end of the first winter month and with it, the year 2019. The year was not easy and was marked by a trade standoff between the United States and China. However, trade disputes between countries with the first and second world economies have been going on for about 17 months, and are unlikely to be resolved immediately, at one point. In this light, it is reasonable to assume that in the coming year, the trade conflict between the United States and China will find its continuation. As for the US currency, which is the No. 1 in the Forex market, despite the Fed's rate cut, sometimes ambiguous macroeconomic statistics and the same trade war between Washington and Beijing, the US dollar feels no less confident and is trading without any falls or take-offs. Except that the weakening of the "American" in pairs with commodity currencies, but this is not about it. Since December ended, it makes sense to start the technical part of this review with a review of the monthly chart and see what the prospects for EUR/USD look like on the most senior timeframe. Monthly
As you can see, by the end of December, the main currency pair has significantly strengthened. As a result of the growth, the Tenkan line of the Ichimoku indicator was broken, as well as the resistance of sellers in the area of 1.1080. It is worth noting here that attempts to break through the indicated resistance were observed during the previous two months, but were in vain. The December closing price was 1.1228, which is pretty good in itself. However, at 1.1254, the lower boundary of the Ichimoku cloud passes, and at 1.1333, the 50 simple moving average is located. If the growth continues, the lower limit of the cloud and 50 MA may provide serious resistance, but in the meantime, it is possible to adjust the course to its December strengthening. In general, after the growth in December, the breakdown of resistance near 1.1180 and the closing price above 1.1200, it is likely that the euro-dollar will continue to strengthen, but, as noted above, much will be decided near 1.1250 and 1.1330. Daily
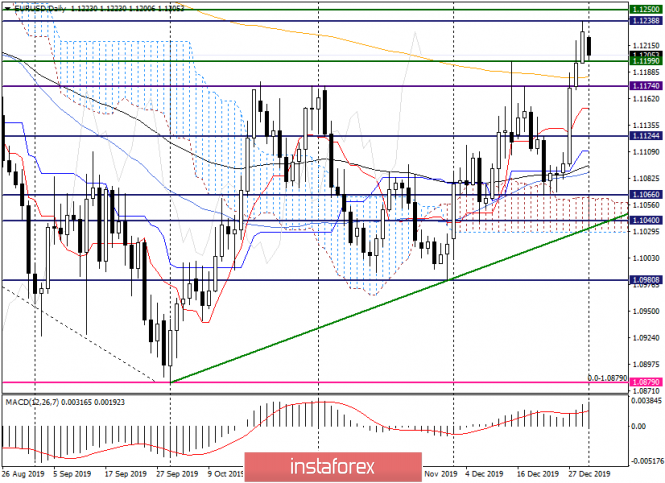
As expected in the last review of last year, trading on January 2 opened with a gap, and with a bearish one. After such a rapid growth of the last three trading days, this factor looks quite justified. The market needs a correction, after which, most likely, the pair will turn in the chosen north direction. At the time of writing, trading is conducted near 1.1205. A little lower is the broken resistance level of 1.1190, which now may well support the price. At 1.1183, there is a 233 exponential moving average, which can also support the rate in case of its decline. Thus, the goals of the expected correction can be identified in the area of 1.1200-1.1180, and when the pair falls in this area, we consider the opening of long positions from here. Let's see how things are in smaller time intervals and whether this idea will find confirmation there. H1
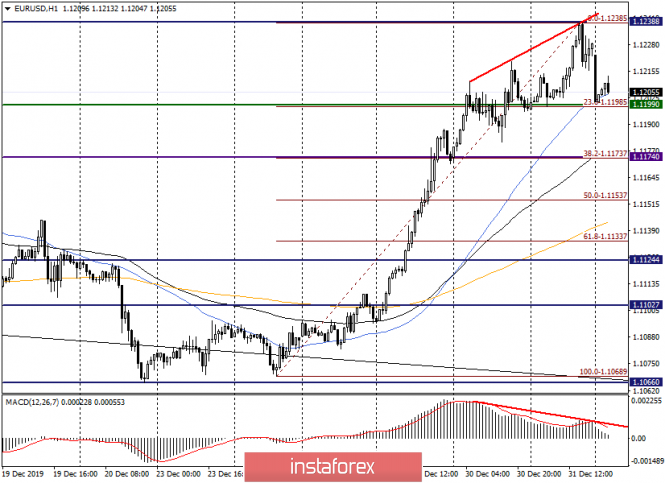
As you can see, trading on January 2 began for EUR/USD extremely negative. Not only did they open with a downward trend, but after that, there was a fairly strong decline. However, at the moment, the pair has found support in the form of 50 MA and began to recover. But how much it will be significant remains a big question. The situation for the euro is complicated by the presence of an obvious bearish divergence of the MACD indicator, but it is necessary to perceive such diversions only as an additional signal. As for the current recovery and the situation in general. Alternatively, they can go up, close the gap and turn down again. If there is a bearish candle or candles near 1.1225, you can try to sell with the removal of the stop above the highs of 1.1238. Fortunately, the stop is small. The goals are in the area of 1.1200-1.1180, from where it is already worth looking at the purchases and again focus on the signals of the Japanese candlesticks. Here is a simple plan for the main currency pair. In conclusion, I want to wish everyone a Happy New Year, wish them good health and success! The material has been provided by InstaForex Company - www.instaforex.com |
| You are subscribed to email updates from Forex analysis review. To stop receiving these emails, you may unsubscribe now. | Email delivery powered by Google |
| Google, 1600 Amphitheatre Parkway, Mountain View, CA 94043, United States | |


No comments:
Post a Comment