Forex analysis review |
- Forecast for AUD/USD on January 21, 2020
- Control zones of GBPUSD 01/20/20
- Fractal analysis for major currency pairs on January 21
- GBP/USD. January 20. Results of the day. Get Brexit done: problems with Gibraltar begin ...
- EUR/USD. January 20. Results of the day. China has signed an unfavorable trade deal. Will the answer come in another form?
- Gold: entering new frontiers postponed, but not canceled
- Confidence above all: yen competes with the dollar
- Weekly forecast for EUR/USD on January 20-24, 2020
- EUR/USD: euro fell, but did not lose hope of growth
- Ichimoku cloud indicator Daily analysis of EURUSD
- January 20, 2020 : EUR/USD Intraday technical analysis and trade recommendations.
- Gold bullish setup for new highs
- January 20, 2020 : GBP/USD Intraday technical analysis and trade recommendations.
- BTC analysis for 01.20.2020 - Important pivot level at the price of $8.440 is on the test, watch carefuly price action around
- USD/JPY. The main goal - 111.20: the pair maintains its growth potential
- EUR/USD for January 20,2020 - Bullish divergence on the MACD oscillator, potential for rally
- EUR/USD. January 20. Demand for the US dollar is rising, the pair is moving towards the second goal
- GBP/USD. January 20. Another approach of the pound to fall to $1.29
- Gold 01.20.2020 - Decision pivot level at the price of $1.562 is on the test, watch carefuly price action around it
- Evening review for EURUSD for 01/20/2020. The euro is at a crossroads
- Trading plan for AUD/USD for January 20, 2020
- Analysis of EUR/USD and GBP/USD for January 20. Inflation in the eurozone does not allow the euro to "breathe"
- Trading plan for NZD/USD for January 20, 2020
- Trading plan for GBP/USD for January 20, 2020
- Trading plan for EUR/USD for January 20, 2020
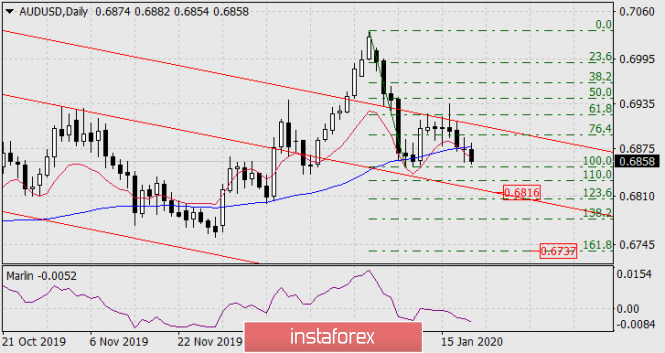
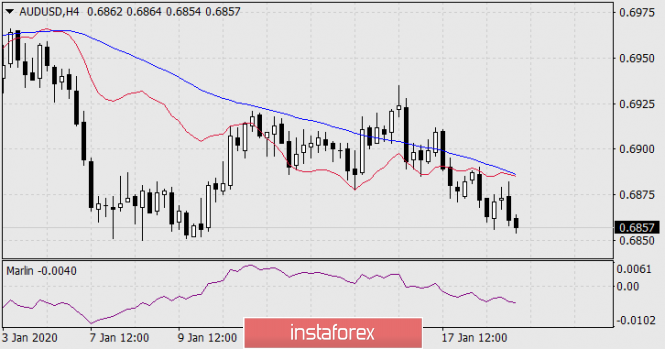
| Forecast for AUD/USD on January 21, 2020 Posted: 20 Jan 2020 08:44 PM PST AUD/USD On the daily chart, the price was consolidated under the blue indicator line of MACD, which is an indicator of the trend and acts as an independent support/resistance. The Marlin oscillator is going down in the negative trend zone. The purpose of the movement is to support the embedded line of the price channel in the region of the Fibonacci reaction line of 123.6% at the price of 0.6816. The target level is at the lows of October 2019. Consolidation under the first target opens the second target at 0.6737 - the Fibonacci reaction level of 161.8%. On a four-hour chart, the price is moving in a downward direction under the indicator lines of balance and MACD, Marlin is also falling. We look forward to further price movement towards the designated goal. |
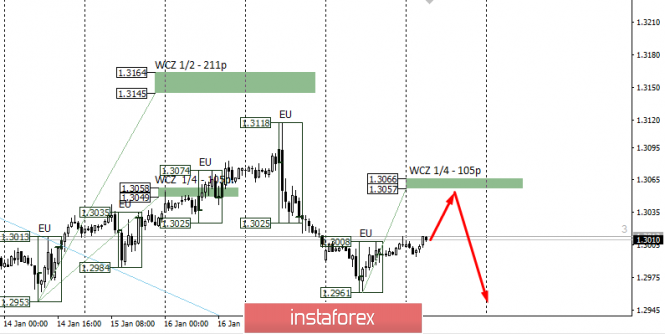
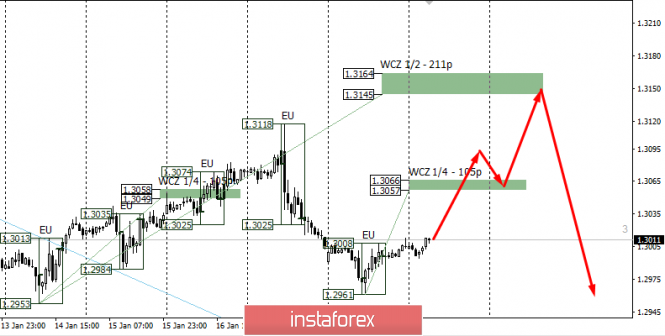
| Control zones of GBPUSD 01/20/20 Posted: 20 Jan 2020 08:42 PM PST The probability of continued downward movement is estimated at 75%, which allows you to keep sales open at the end of last week. To obtain favorable selling prices, the WCZ test 1/4 1.3066-1.3057 may be required. This will provide an opportunity to enter a short position again. The first target of the decline is the January low formed last week, which makes sales profitable in terms of risk/reward ratio. An alternative model will be developed if the closing of today's trading occurs above the WCZ 1/4. This will open the way for further growth and a retest of last week's high. The main goal of the upward corrective movement will be WCZ 1/2 1.3164-1.3145. Daily CZ - daily control zone. The area formed by important data from the futures market, which changes several times a year. Weekly CZ - weekly control zone. The zone formed by important marks of the futures market, which changes several times a year. Monthly CZ - monthly control zone. The zone, which is a reflection of the average volatility over the past year. The material has been provided by InstaForex Company - www.instaforex.com |
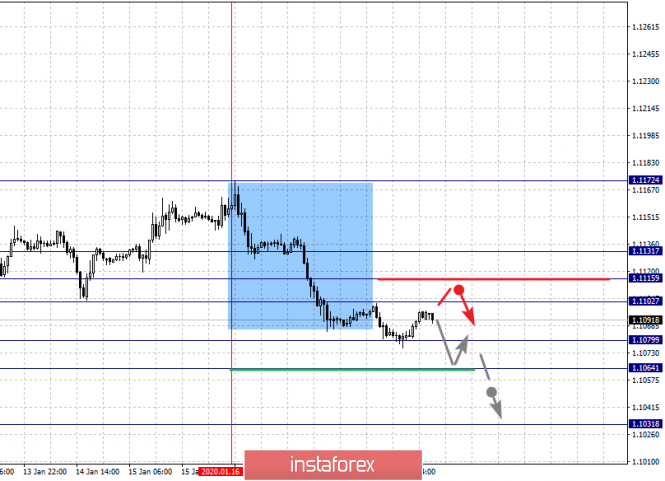
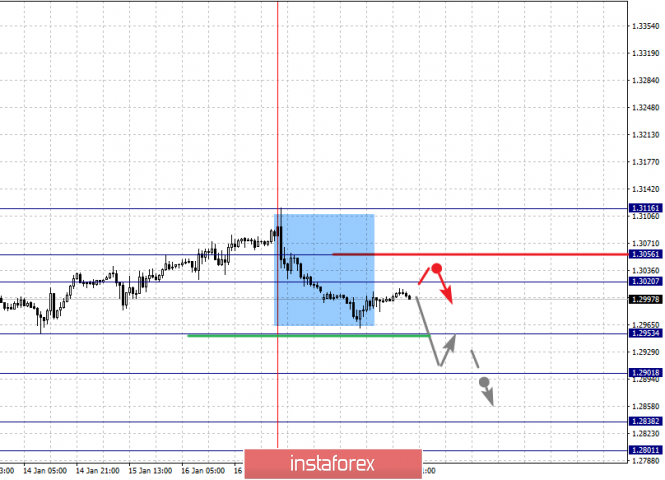
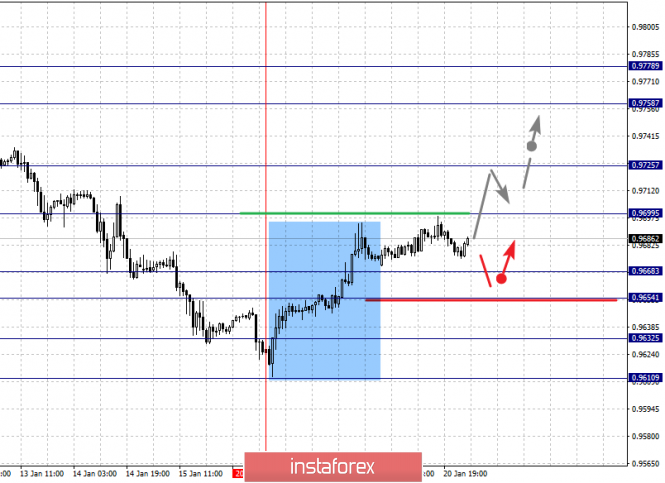
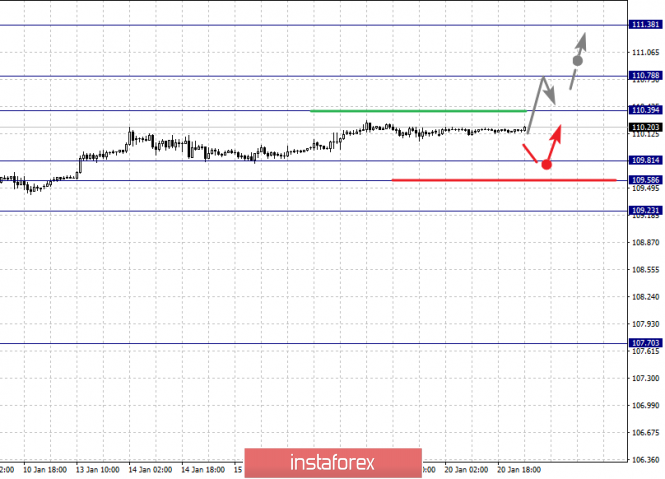
| Fractal analysis for major currency pairs on January 21 Posted: 20 Jan 2020 05:56 PM PST Forecast for January 21: Analytical review of currency pairs on the scale of H1:
For the euro / dollar pair, the key levels on the H1 scale are: 1.1131, 1.1115, 1.1102, 1.1079, 1.1064 and 1.1031. Here, we are following the descending structure of January 16. Short-term downward movement is expected in the range of 1.1079 - 1.1064. The breakdown of the last value will lead to a pronounced movement. Here, the potential target is 1.1031. We expect a pullback to the top from this level. Short-term upward movement is possibly in the range 1.1102 - 1.1159. The breakdown of the last value will lead to an in-depth correction. Here, the target is 1.1131. This level is a key support for the downward structure. The main trend is the descending structure of January 16 Trading recommendations: Buy: 1.1102 Take profit: 1.1113 Buy: 1.1116 Take profit: 1.1130 Sell: 1.1078 Take profit: 1.1065 Sell: 1.1063 Take profit: 1.1034
For the pound / dollar pair, the key levels on the H1 scale are: 1.3116, 1.3056, 1.3020, 1.2953, 1.2901, 1.2838 and 1.2801. Here, we are following the formation of the descending structure of January 17. The continuation of the movement to the bottom is expected after the breakdown of the level of 1.2953. In this case, the target is 1.2901. Price consolidation is near this level. The breakdown of the level of 1.2900 will lead to the development of pronounced movement. Here, the goal is 1.2838. For the potential value for the bottom, we consider the level of 1.2801. Upon reaching which, we expect a pullback to the top. Short-term upward movement is possibly in the range of 1.3020 - 1.3056. The breakdown of the latter value will lead to the formation of initial conditions for the upward cycle. Here, the potential target is 1.3116. The main trend is the descending structure of January 17 Trading recommendations: Buy: 1.3020 Take profit: 1.3053 Buy: 1.3057 Take profit: 1.3114 Sell: 1.2952 Take profit: 1.2904 Sell: 1.2898 Take profit: 1.2838
For the dollar / franc pair, the key levels on the H1 scale are: 0.9778, 0.9758, 0.9725, 0.9699, 0.9668, 0.9654, 0.9632 and 0.9610. Here, the price forms the expressed initial conditions for the top of January 16. The continuation of the movement to the top is expected after the breakdown of the level of 0.9700. In this case, the target is 0.9725. Price consolidation is near this level. The breakdown of the level of 0.9725 will lead to pronounced movement. Here, the target is 0.9758. For the potential value for the top, we consider the level of 0.9778. Upon reaching this level, we expect a pullback to the bottom. Short-term downward movement is possibly in the range of 0.9668 - 0.9654. The breakdown of the latter value will lead to an in-depth correction. Here, the target is 0.9632. This level is a key support for the top. The main trend is the formation of initial conditions for the top of January 16 Trading recommendations: Buy : 0.9700 Take profit: 0.9725 Buy : 0.9727 Take profit: 0.9756 Sell: 0.9667 Take profit: 0.9655 Sell: 0.9652 Take profit: 0.9635
For the dollar / yen pair, the key levels on the scale are : 111.38, 110.78, 110.39, 109.81, 109.58 and 109.23. Here, we are following the development of the upward cycle of January 8. At the moment, we expect to reach the level of 110.39. The breakdown of which will allow us to count on movement to the level of 110.78. Price consolidation is near this value. The breakdown of the level of 110.80 should be accompanied by a pronounced upward movement. Here, the potential target is 111.38. Short-term downward movement is possibly in the range 109.81 - 109.58. The breakdown of the last value will lead to an in-depth correction. Here, the goal is 109.23. This level is a key support for the top. The main trend: the upward cycle of January 8. Trading recommendations: Buy: 110.40 Take profit: 110.76 Buy : 110.80 Take profit: 111.35 Sell: 109.80 Take profit: 109.58 Sell: 109.55 Take profit: 109.25
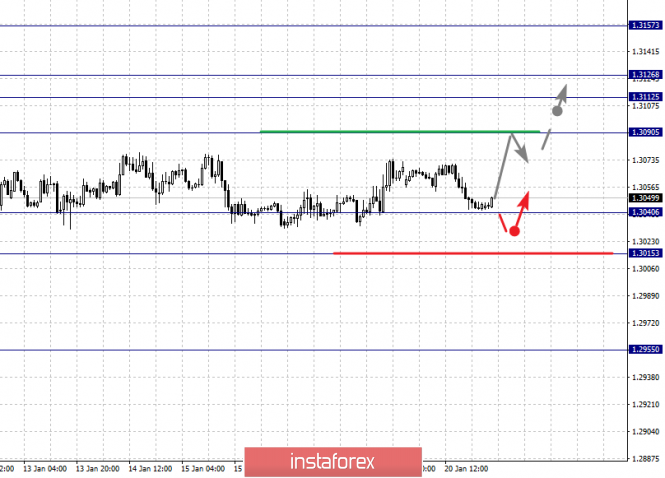
For the Canadian dollar / US dollar pair, the key levels on the H1 scale are: 1.3157, 1.3126, 1.3112, 1.3090, 1.3062, 1.3040 and 1.3015. Here, we are following the development of the upward cycle of January 7. The continuation of the movement to the top is except after the breakdown of the level of 1.3090. In this case, the target is 1.3112. Price consolidation is in the range of 1.3112 - 1.3126. For the potential value for the top, we consider the level of 1.3157. Upon reaching this level, we expect a pullback to the bottom. Short-term downward movement, as well as consolidation are possible in the range of 1.3040 - 1.3015. The breakdown of the latter value will lead to the formation of initial conditions for the downward cycle. In this case, the potential target is 1.2988. The main trend is the upward cycle of January 7, the correction stage Trading recommendations: Buy: 1.3090 Take profit: 1.3112 Buy : 1.3126 Take profit: 1.3155 Sell: 1.3038 Take profit: 1.3017 Sell: 1.3013 Take profit: 1.2990
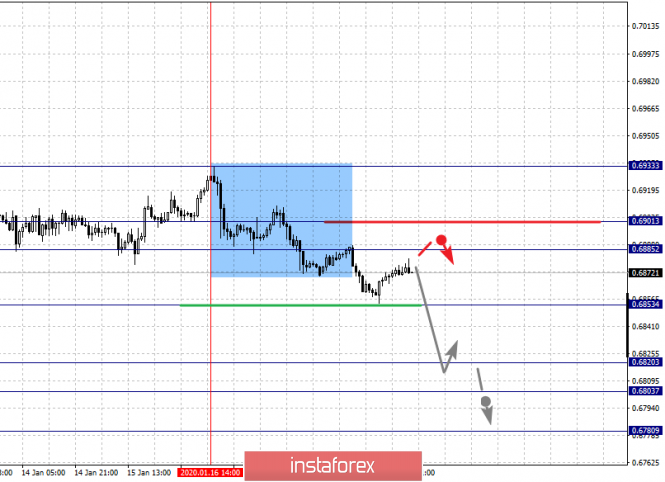
For the Australian dollar / US dollar pair, the key levels on the H1 scale are : 0.6933, 0.6901, 0.6885, 0.6853, 0.6820, 0.6803 and 0.6780. Here, we are following the development of the descending structure of January 16. The continuation of movement to the bottom is expected after the breakdown of the level of 0.6853. In this case, the target is 0.6820. Price consolidation is in the range of 0.6820 - 0.6803. For the potential value for the bottom, we consider the level of 0.6780. Upon reaching this level, we expect a pullback to the top. Short-term upward movement is expected in the range of 0.6885 - 0.6901. The breakdown of the latter value will lead to the formation of initial conditions for the top. In this case, the potential target is 0.6933. The main trend is the descending structure of January 16 Trading recommendations: Buy: 0.6885 Take profit: 0.6900 Buy: 0.6904 Take profit: 0.6930 Sell : 0.6851 Take profit : 0.6823 Sell: 0.6820 Take profit: 0.6804
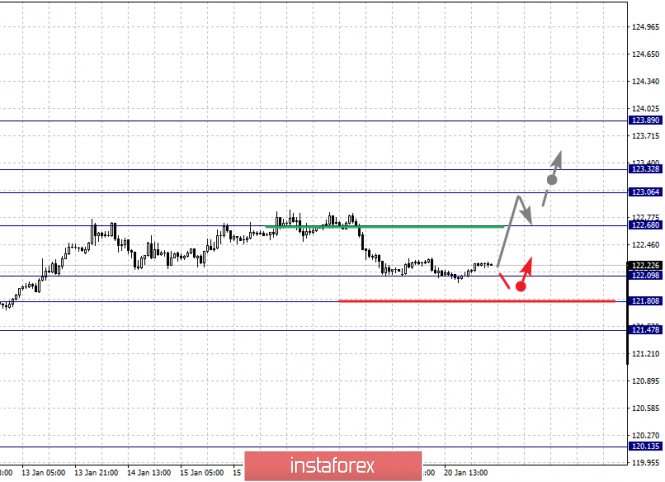
For the euro / yen pair, the key levels on the H1 scale are: 123.89, 123.32, 123.06, 122.68, 122.09, 121.80 and 121.47. Here, we are following the development of the upward cycle of January 8. The continuation of the movement to the top is expected after the breakdown of the level of 122.68. In this case, the first target is 123.06. Short-term upward movement, as well as consolidation is in the range of 123.06 - 123.32 . The breakdown of the level of 123.35 will lead to a movement to a potential target - 123.89, from this level, we expect a pullback to the bottom. Short-term downward movement is possibly in the range of 122.09 - 121.80. The breakdown of the latter value will lead to an in-depth correction. Here, the goal is 121.47. This level is a key support for the upward structure. The main trend is the upward cycle of January 8, the correction stage Trading recommendations: Buy: 122.70 Take profit: 123.05 Buy: 123.06 Take profit: 123.30 Sell: 122.07 Take profit: 121.84 Sell: 121.80 Take profit: 121.50
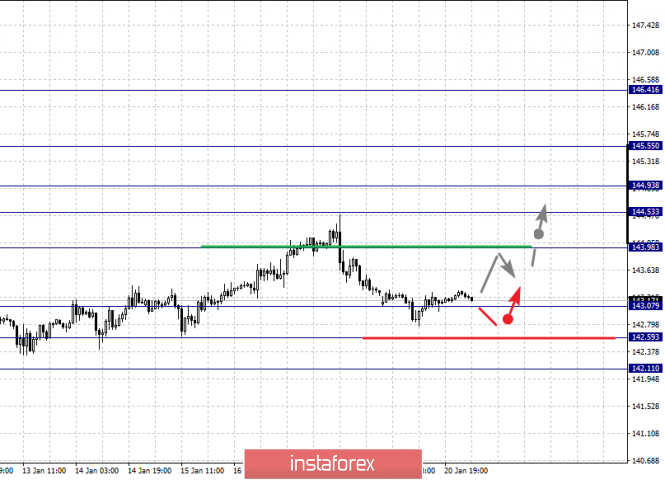
For the pound / yen pair, the key levels on the H1 scale are : 146.41, 145.55, 144.93, 144.53, 143.98, 143.07, 142.59 and 142.11. Here, we are following the development of the ascending structure of January 3. At the moment, the price is in correction. The resumption of movement to the top is expected after the breakdown of the level of 144.00. In this case, the first goal is 144.53. Short-term upward movement is expected in the range of 144.53 - 144.93. The breakdown of the latter value will lead to a movement to the level of 145.55, and near which, we expect consolidation. For the potential value for the top, we consider the level of 146.41, from which we expect a pullback to the bottom. Short-term downward movement is possibly in the range of 143.07 - 142.59. The breakdown of the latter value will lead to the formation of initial conditions for the downward cycle. In this case, the potential target is 142.11. The main trend is the upward structure of January 3, the correction stage Trading recommendations: Buy: 144.00 Take profit: 144.51 Buy: 144.53 Take profit: 144.91 Sell: 143.05 Take profit: 142.65 Sell: 142.54 Take profit: 142.11 The material has been provided by InstaForex Company - www.instaforex.com |
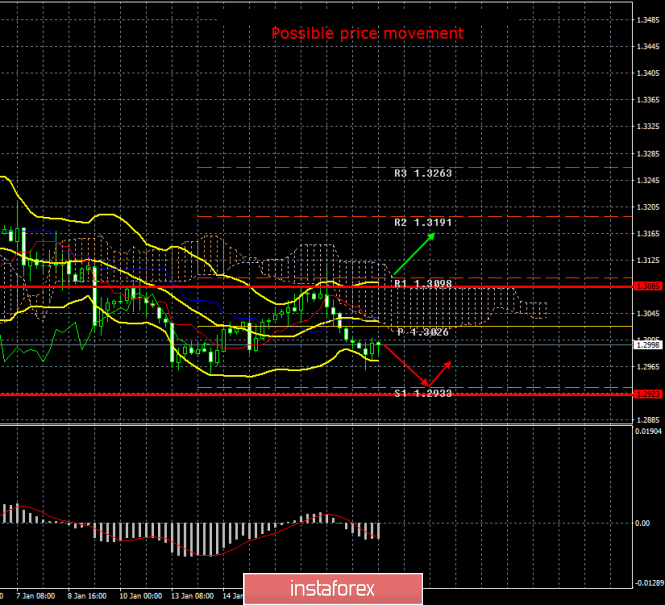
| GBP/USD. January 20. Results of the day. Get Brexit done: problems with Gibraltar begin ... Posted: 20 Jan 2020 02:36 PM PST 4-hour timeframe Amplitude of the last 5 days (high-low): 55p - 79p - 58p - 57p - 115p. Average volatility over the past 5 days: 81p (average). The British pound began a semblance of an upward correction on Monday, January 20, towards the end of the day. There is only one bullish bar at the moment, so it's hard to say whether such an increase in the pair can be considered the beginning of an upward correction. The pound volatility has recently decreased, but remains in the "average" value. The weakness of the bulls is visible to the naked eye, however, there are few sellers around 1.3000. Despite the fact that macroeconomic statistics from the UK fail from time to time. Buyers of the British pound did not manage to overcome the Ichimoku cloud, which is why we are inclined to continue moving down. Today, fortunately for the British currency, there have been no important macroeconomic publications. Nevertheless, some interesting news was made available to traders. This news, as always, is not in favor of the British currency. In past articles, we have repeatedly said that negotiations between London and Brussels will be difficult, and there may be a huge number of potential problems for Great Britain during 2020. Starting with the lack of an agreement with the European Union, which will put an end to the orderly Brexit, ending with problems with Gibraltar, Scotland and Ireland. It is with the problems with Gibraltar that British politicians may face in the near future. The problem is that Spain has claims on Gibraltar, to which it belonged several centuries ago. Gibraltar voted against leaving the European Union. Several thousand people are sent to Gibraltar from Spain every day to work. And if Gibraltar leaves the EU with Britain, the visa regime will be introduced accordingly. That is, from February 1, about 15 thousand people will be forced to pass passport control at the border, which is only 1.8 km, daily. The British government has already stated that after Brexit, Gibraltar will not be able to independently agree on a visa-free regime with the European Union. Government spokesman Boris Johnson said the "issue of the liberals" would be part of a deal between London and Brussels about future relationships. London's position on this issue is clear and logical. The border with Gibraltar needs to be closed (it's not Northern Ireland, where it is just disadvantageous to close the border to London), and then use this trump card in negotiations with the European Union. We have already talked about problems with Scotland. Scotland wants to secede from the United Kingdom, but received an official refusal from Boris Johnson to hold a second referendum on independence. Now the question remains, what is the Scottish National Party ready to do, led by Nicola Sturgeon, to achieve its goal? As long as the UK is covered by geopolitical and macroeconomic problems, traders continue to wonder if the Bank of England will accept a rate cut at its next meeting on January 30. The fact is that this meeting will be the last for Mark Carney, respectively, he can follow the example of Mario Draghi and "slam the door" in the end, lowering the key rate. This decision will not come as a surprise to anyone, since the UK economy needs stimulation. But Mark Carney himself repeatedly showed that he wants to leave such a trump card as lowering the rate for the most critical moment ... The technical picture shows the preservation of the downward trend, at the same time, the pair failed to go below the previous local low. Thus, the correction is likely to begin. Turning the MACD indicator upwards will signal exactly this. Trading recommendations: GBP/USD remains downside. Thus, traders are advised to resume sales of the pound/dollar pair with the target of 1.2933, after the correction is completed. It is recommended that purchases of British currency be returned no earlier than the price consolidation above the Kijun-sen and Senkou Span B lines with the first target of 1.3191. Explanation of the illustration: Ichimoku indicator: Tenkan-sen is the red line. Kijun-sen is the blue line. Senkou Span A - light brown dotted line. Senkou Span B - light purple dashed line. Chikou Span - green line. Bollinger Bands Indicator: 3 yellow lines. MACD indicator: Red line and bar graph with white bars in the indicators window. Support / Resistance Classic Levels: Red and gray dashed lines with price symbols. Pivot Level: Yellow solid line. Volatility Support / Resistance Levels: Gray dotted lines without price designations. Possible price movements: Red and green arrows. The material has been provided by InstaForex Company - www.instaforex.com |
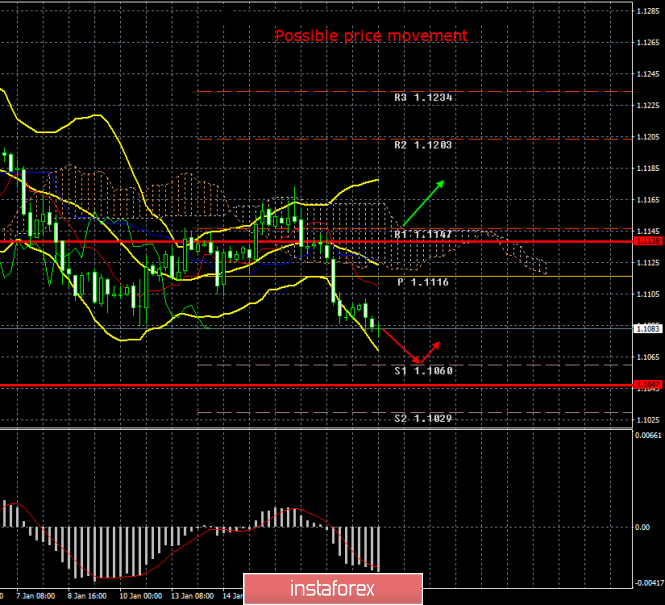
| Posted: 20 Jan 2020 02:36 PM PST 4-hour timeframe Amplitude of the last 5 days (high-low): 34p - 41p - 44p - 45p - 57p. Average volatility over the past 5 days: 45p (average). The first trading day of the new week for the EUR/USD pair was held in quiet and calm trading with a total volatility of as much as 25 points. Not a single macroeconomic report has been planned for today in either the United States or China, which explains the low activity of market participants on Monday. At the same time, the anti-trend correction characteristic of Mondays has not begun today. The euro continued to simply become cheaper after a very obscure attempt to start a correction. Thus, we believe that this is a significant moment, but we should not overestimate it. The indicative fact is that traders are not ready to reduce short positions now, which means that there is a high probability that the downward trend will continue to form. At the same time, today's decline in quotations of the euro/dollar pair may just be an accident. Therefore, we recommend that traders simply stay in euro-currency sales until the formation of correction signals. Meanwhile, analysts and experts around the world continue to analyze the agreement between the United States and China. The fact is that now it is precisely from this trade agreement that the macroeconomic indicators of the European Union and the United States (as well as China) that we are interested in will depend, which will affect the movement of currency pairs. According to many experts, China has concluded the "first phase" of the trade agreement almost "at gunpoint". It seems that China no longer believes that Donald Trump will not be able to be re-elected for a second term and therefore decided to try to negotiate with the conflicting US president. The first phase is absolutely in favor of America. However, it is difficult to imagine that China will not take any "retaliatory step". By and large, the situation is as follows: China and the United States conducted trade in accordance with market realities and rules; Trump decided to balance the trade balance with China and imposed sanctions, which began to hit acutely on Chinese production, since China is an export-oriented country, and the United States is one of its largest markets. From the point of view of market mechanisms, Trump's step with the trade war is an unfair play. On the other hand, China can also be blamed for many sins, some of which are understandable and obvious to absolutely everyone. For example, theft of intellectual property, theft of patents. We all know how many brand fakes are produced in China. Some are exact copies of the products of all world famous brands. Now, according to the agreement with the US, China takes on a whole list of obligations: 1) Beijing guarantees protection of intellectual property. 2) China will open access to its financial sector from April 1, will allow it to engage in investment projects on its territory and trade securities with foreign banks and companies. 3) It guarantees the provision of licenses to various electronic payment companies (Mastercard, Visa). 4) Guarantee purchases of $200 billion or more from the United States over the next two years. 5) Refuses to artificially devalue the renminbi. Under all these conditions, most of the duties on Chinese imports remain in force. That is, Trump left the advantages with him and now has every reason and opportunity to continue to exert pressure on Beijing through the remaining duties in order to force the signing of the agreements of the "second phase", "third phase". The most interesting thing is what Beijing will answer, since, according to many experts, China is used to responding to its opponents on those battlefields where it is stronger. It is understood that in a dispute with Washington, this battlefield will not be trade relations between countries. However, what China will do in the future is not too interesting, as it may still do nothing and will not have to. Already this week, hearings will begin on the case of the impeachment of Trump in the Senate, and although there are practically no chances for his resignation, nevertheless, this event should not be overlooked. So far, Trump has answered with a six-page report to the 111-page document of the Democrats, in which he once again criticized the impeachment process and stated that the whole thing is "purely political". And while the battles between Trump and the Democrats continue, the Washington Post calculated how many times in 1095 days of his reign, President Donald Trump lied or made a misleading statement. According to the study, this happened 16,241 times. That is, the US president lied almost 15 times a day. It is difficult to say how true and accurate this study is, as well as what exactly its authors mean by "misleading", but we see that the fight against Trump in the United States is in full swing. The technical picture of the instrument continues to indicate a downward trend. There are no signs of correction. The fundamental background remains on the side of the US currency (the only thing that makes one doubt it is a decrease in the growth rate of industrial production in America). Trading recommendations: EUR/USD continues to move down. Thus, it is recommended to keep open shorts with targets 1.1060 and 1.1047. It will be possible to consider purchases of the euro/dollar pair no earlier than the traders of the Senkou Span B line overcome with the first goal the resistance level of 1.1203. Explanation of the illustration: Ichimoku indicator: Tenkan-sen is the red line. Kijun-sen is the blue line. Senkou Span A - light brown dotted line. Senkou Span B - light purple dashed line. Chikou Span - green line. Bollinger Bands Indicator: 3 yellow lines. MACD indicator: Red line and bar graph with white bars in the indicator window. Support / Resistance Classic Levels: Red and gray dashed lines with price symbols. Pivot Level: Yellow solid line. Volatility Support / Resistance Levels: Gray dotted lines without price designations. Possible price movements: Red and green arrows. The material has been provided by InstaForex Company - www.instaforex.com |
| Gold: entering new frontiers postponed, but not canceled Posted: 20 Jan 2020 02:36 PM PST According to Credit Suisse experts, gold has good prospects for growth in 2020. "Despite the positive sentiment among investors amid rising stock markets, there is still uncertainty over the trade conflict between the US and China. Brexit also brings confusion. The global economy is on the verge. The situation may change in a negative direction at any moment," they said. Berenberg Bank has adjusted its forecast for the gold exchange rate for 2020 in the direction of its increase. According to the bank's calculations, the average cost of precious metals this year will be $1,525 per ounce, which is slightly lower than the current level - $ 1,560, but almost 3% higher than the previous forecast of the financial institute ($1,482 per ounce). Analysts at Berenberg Bank point to the volatile geopolitical situation in the world, which is the main driver of the growth of the gold exchange rate. This includes trade negotiations between the United States and China, Britain's secession from the European Union, as well as tensions between Washington and Tehran. The bank believes that rising inflation in the United States could create conditions for a further reduction in interest rates by the Federal Reserve, and this, in turn, will support gold. "Ultimately, inflation in the United States will begin to grow amid an increase in the state budget deficit and the country's trade balance, which can happen very quickly or in ten years. But in any case, it is only a matter of time. If you look at the geopolitical struggle, how many companies want to accumulate dollars? Gold in this case becomes a favorite," Saxo Bank said. TD Securities experts believe that the price of gold will no longer fall below $1,550 per ounce, even if the military-political conflict between the US and Iran weakens, and investors are again interested in risky assets. "We expect that in the near future precious metals will be traded in a narrow range. The mark of $1,600 per ounce is also becoming real, as the fundamental drivers remain valid. They will push the cost of precious metals up. The closer the US presidential election, the more expensive gold will become," they said. According to bank estimates, by the end of this year, an ounce of precious metal will cost $1,650. The hedge fund Bridgewater Associates predicts that gold will be able to gain a foothold above the level of $1,540 per ounce, and in case of escalation of political conflicts, the cost of precious metal may even exceed $2,000 per ounce. The material has been provided by InstaForex Company - www.instaforex.com |
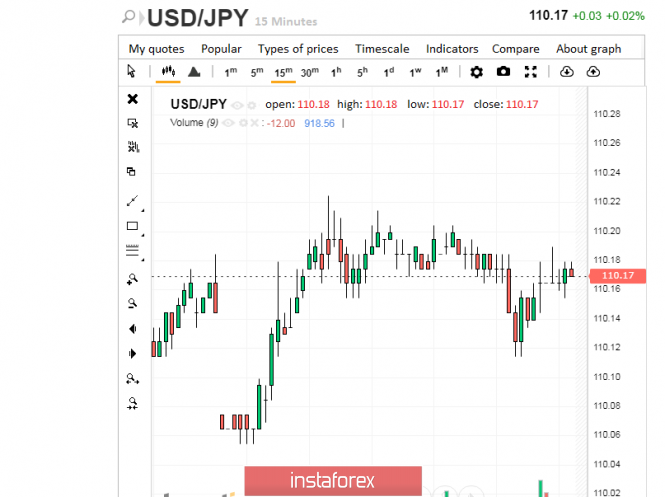
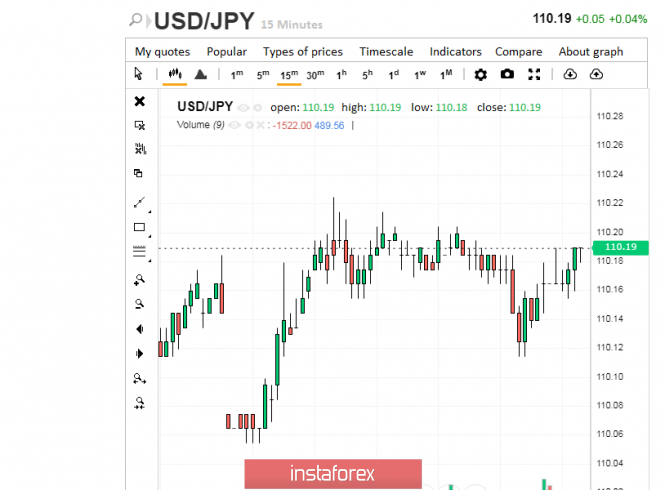
| Confidence above all: yen competes with the dollar Posted: 20 Jan 2020 02:36 PM PST The Japanese currency behaves with restraint at the beginning of the week, but confidently, avoiding excessive volatility. Nevertheless, experts believe that serious changes are brewing in the USD/JPY pair. They will affect the positions of both the greenback and the yen, analysts said. The pair is currently moving towards consolidation near 109.99. Experts predict a price increase to 110.53, and then its collapse to 109.77. However, this is now far away. Monday morning, January 20, the USD/JPY pair started at 110.16-110.17. The pair continues to currently run in this range, sometimes beyond its scope. According to analysts, the upward trend in the USD/JPY pair, continuing from January 8, 2020, is due to increased risk sentiment, and not fundamental factors. At the same time, the current strengthening of the dollar in the Asian pair may reach its limit amid an extremely slow recovery of the global economy. In the coming year, the greenback will be traded within the current range, namely 105–115 yen per US dollar. Experts believe the preservation of a long pause in the monetary policy of the Federal Reserve as the reason for this. In the near future, State Street analysts expect a shift in the base range of the USD/JPY pair to rise to 110-115 yen against the US dollar. Experts believe that the driver of such growth is the increase in investor risk appetite after the trade truce of Washington and Beijing. Note that the USD/JPY pair rose to 114.55 since October 2018, which indicates a high probability of a change in the current trend. Experts do not exclude that the greenback can find support at 110 yen per unit of the US currency, but this is possible only in case of a breakout of 110.20. At the moment, the USD/JPY pair is trying to overcome this bar, but it does not go beyond 110.19. According to preliminary calculations, the market volatility will be low in 2020, as in the past year. Until the end of the first half of the year, the USD/JPY pair will remain in the range of 106–112, consolidating at these levels. Leading strategists of the Asset Management One financial group adhere to this forecast. Most analysts share their opinion. The material has been provided by InstaForex Company - www.instaforex.com |
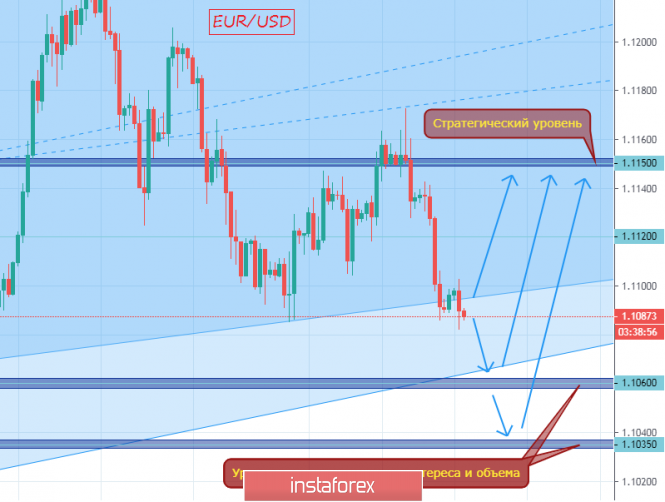
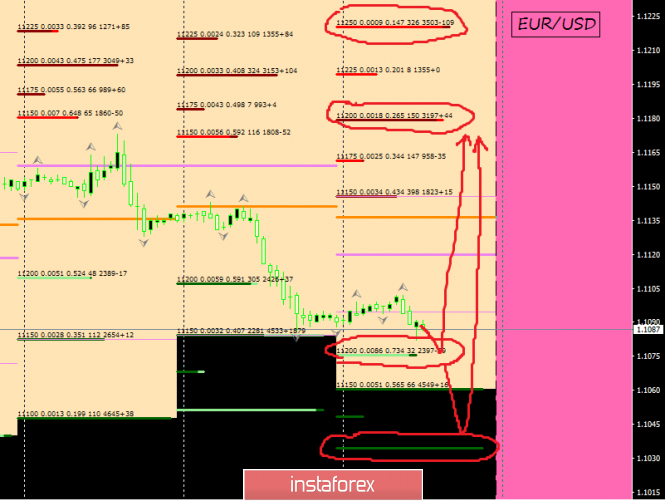
| Weekly forecast for EUR/USD on January 20-24, 2020 Posted: 20 Jan 2020 02:35 PM PST "Everyone chooses his own path. And the more obvious the goal, the easier the path." Good morning, dear colleagues! As always with you, here is the forecast for the likely movement of the EUR/USD currency instrument. Let's start by summing up the results of the past week, after which we will smoothly move on to the current week and end with the report and basic definitions. So here we go! The trading session of the previous week, January 13-17, 2020, presented an "unusual" surprise - the price rose in the first half of the trading week, and after which it formed a "false breakdown" (the price closed just a couple of points above the local maximum, and subsequent testing which is already the support level, turned out to be successful. After which, the price already tested it as a resistance level and could be sold at Fibo 50% -61 / 8%), began to decline, breaking the local weekly lows at 1.1105. The price is now located below which. Why did I write an "unusual surprise"? It is all because I believe that a false breakdown is formed again at the moment and ... And now it is time to talk about the prospects of the EUR / USD currency instrument for the current trading week. Since I wrote a little earlier that, in my opinion, the price formed a "false breakdown" again, and we will proceed from the forecast for the current week: 1. The strategic level is located in the region of 1.1150, which tells us about the likely growth of EUR / USD. 2. The medium-term trend is still upward. 3. A large cluster of levels with high open interest and high volumes is located at 1.1180 and above. Well, dear colleagues, it would seem that you would not want to buy. But oh, if everything were so simple... In fact, it is now necessary to determine the level-range to enter long positions. And here, there are 2 options: 1. The first option, as always, is the most common: entry when the price returns above the level of 1.1105. It is desirable that the return be on an increased volume, which will tell us that, the price will most likely knock down sellers' stops and they may well "roll over" in position. 2. The second option is not so obvious, since you can try to enter long positions only after a downward movement of prices in the area of high open interest and volumes. And such an area exists at 1.1035-1.1060, and you will not believe it - it also coincides with the line of the upward medium-term trend, and, as we well know, the classic signal to buy is testing the price of the line of the upward trend. So, in fact, I explained my point of view on the issue of the likely "false breakdown" of the support level and the return of the price "for the pen with the bulls" to strategic goal 1.1150. The previous forecast for EUR/USD on 01/10/2020 worked perfectly well! "EUR/USD. BUY priority based on melon CME and classic VSA" IMPORTANT! Remember that you should enter the market exclusively by patterns - by graphic patterns that are often repeated on the market. As a result of which, there is a certain pattern of price behavior in the future. In my trading, I use patterns consisting of candlestick analysis and volume analysis. My favorite pattern is absorption on a sharply increasing volume, followed by testing up to 50% -61.8% Fibo. The material has been provided by InstaForex Company - www.instaforex.com |
| EUR/USD: euro fell, but did not lose hope of growth Posted: 20 Jan 2020 02:35 PM PST Since the end of November 2019, the EUR/USD pair has been moving along the upward channel. It reached its upper limit at the level of 1.1240 on December 31, but then changed direction and broke through the lower boundary of the channel at the level of 1.1125 on January 8. Buyers tried to return EUR/USD to the channel last week, until Thursday, January 16, but then their strength weakened and the pair plummeted. Even the signing of the "first phase" of the trade agreement by Washington and Beijing failed to help the bulls. This event caused a slight decrease in the US currency and the growth of EUR/USD, which soon stopped and was facilitated by the publication of the minutes from the last European Central Bank meeting as well as data on US retail sales for December. In the first case, the leadership of the ECB announced that it was not going to raise the key interest rate until inflation in the eurozone reached a target of 2%. Moreover, the regulator did not exclude the possibility of a rate transition from the current zero level to the negative zone. As for the second factor, last month, retail sales in the United States grew by 0.3% in monthly terms. As you know, consumer spending accounts for more than 65% of US GDP. As a result, the euro began to lose ground against the dollar, and the main currency pair completed the trading week at 1.1090. Scotiabank currency strategists believe that a fall in the EUR/USD rate below the psychological mark of 1.1100 offers a good opportunity to open long positions. They maintain an optimistic view of the single European currency in light of the recent improvement in economic indicators in the eurozone. "Now the ECB is likely to refrain from signaling that it sees the possibility of additional stimulus in the future," experts said. "The fall of EUR/USD below 1.1100 slowed down near the level of 1.1097, which corresponds to the value of the 50-day moving average. The strong support area is between 1.1065 and 1.1090. At the same time, the short-term growth outlook is likely to be limited to 1.1145," they added. Meanwhile, UBS experts see a clear bias towards the fall of EUR/USD in the near future below 1.10. "We expect to see the strengthening of the US currency amid the fact that markets will overestimate the probability of lower interest rates in the United States. As global economic growth rates recover, the risk of Federal Reserve interest rate cuts decreases. We think that the euro will return to growth in the long run, so we believe that levels below 1.10 in the EUR/USD pair will offer a good buying opportunity," analysts said. They advise traders to open long positions when the pair falls to 1.09 in order to grow to 1.12. "In the longer term, the signing of an agreement between the United States and China on an interim deal is a positive factor for the euro, as this will reduce uncertainty about world trade, which will lead to increased European exports," UBS said. The material has been provided by InstaForex Company - www.instaforex.com |
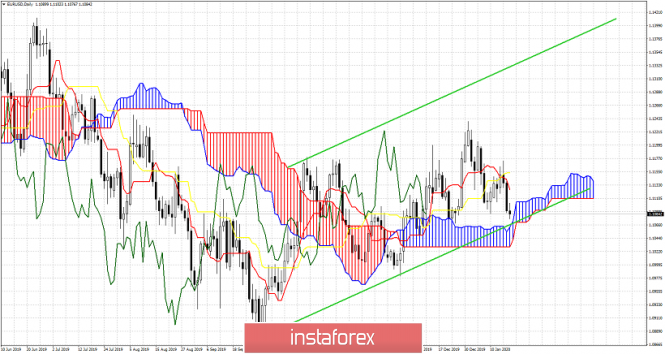
| Ichimoku cloud indicator Daily analysis of EURUSD Posted: 20 Jan 2020 09:49 AM PST EURUSD is trading below 1.11 just above major Ichimoku cloud support. Price is also inside an upward sloping channel and now the conditions favor traders to take bullish positions as the risk relative to the potential profit is very low. Support at 1.1065-1.1050 is key and this should be used as a stop from bulls.
Price is above the Kumo support at 1.1065. The lower channel boundary is at 1.1050-1.1060. As long as price is above this level we are bullish on a daily basis. The Chikou span (green line) is above the candlestick pattern and above cloud support. In fact this line is now challenging the support. If support holds I would expect a bounce and a new upward move maybe towards 1.13 if 1.1155 is recaptured. The risk for being long at current levels is very low and that is why I turn short-term bullish again. Trying to pick a bottom. The material has been provided by InstaForex Company - www.instaforex.com |
| January 20, 2020 : EUR/USD Intraday technical analysis and trade recommendations. Posted: 20 Jan 2020 09:44 AM PST
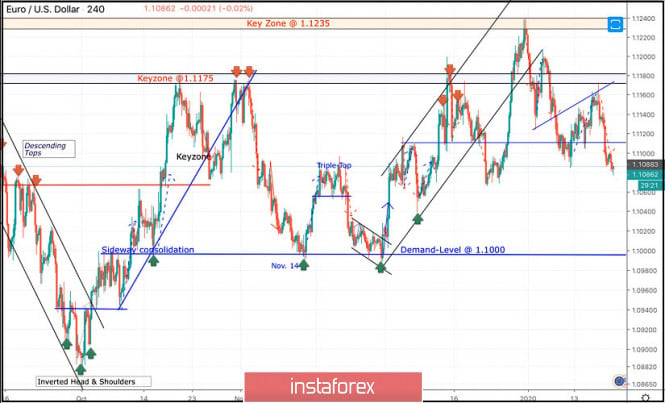
Since November 14, the price levels around 1.1000 has stood as a significant DEMAND-Level offering adequate bullish SUPPORT for the pair on two successive occasions. During this Period, the EUR/USD pair has been trapped within a narrow consolidation range between the price levels of 1.1000 and 1.1085-1.1100 (where a cluster of supply levels and a Triple-Top pattern were located) until December 11. On December 11, another bullish swing was initiated around 1.1040 allowing recent bullish breakout above 1.1110 to pursue towards 1.1175 within the depicted short-term bullish channel. Initial Intraday bearish rejection was expected around the price levels of (1.1175). Moreover, On December 20, bearish breakout of the depicted short-term channel was executed. Thus, further bearish decline was demonstrated towards 1.1065 where significant bullish recovery has originated. The recent bullish pullback towards 1.1235 (Previous Key-zone) was suggested to be watched for bearish rejection and another valid SELL entry. Suggested bearish position has achieved its targets while approaching the price levels around 1.1110. As expected, the Key-Level around 1.1110 has provided some bullish rejection. That's why, the previous bullish pullback was expected to pursue towards 1.1140 and 1.1175 where the depicted key-zone as well as the recently-broken uptrend are located. Recent signs of bearish rejection were demonstrated around 1.1175. That's why, further bearish decline was anticipated towards 1.1110. For the bearish side of the market to dominate, bearish persistence below 1.1110 is needed to enable further bearish decline towards 1.1060 and probably 1.1040. Trade recommendations : For those who caught the initial bearish trade around 1.1175, it's already running in profits. S/L should be lowered to 1.1140 to secure some profits. On the other hand, Conservative traders should wait for a bullish pullback towards 1.1120-1.1135 for another valid SELL signal. Bearish projection target to be located around 1.1060. Any bullish breakout above 1.1175 invalidates the mentioned bearish trading scenario. The material has been provided by InstaForex Company - www.instaforex.com |
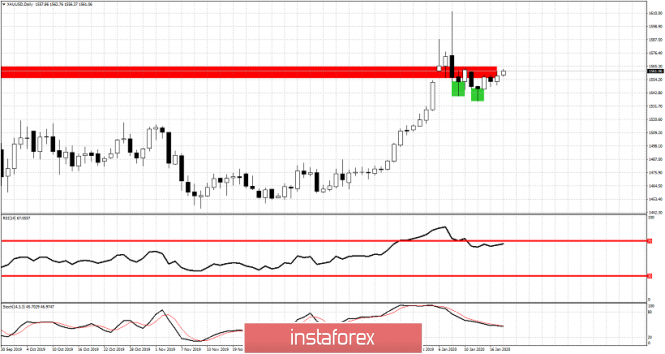
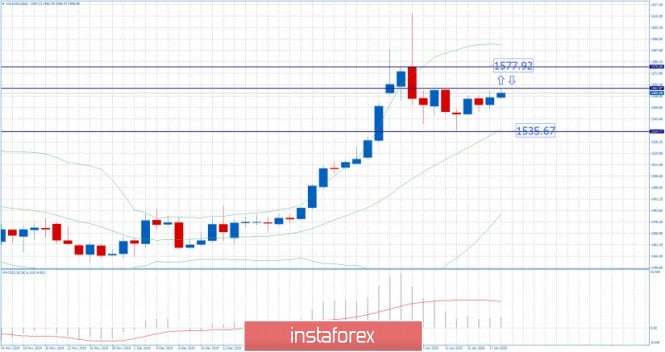
| Gold bullish setup for new highs Posted: 20 Jan 2020 09:41 AM PST Gold price is stabilizing above $1,550 and this is positive for bulls. Price has retraced a bit more than 38% of the rise from $1,445 and there are many chances we see price revisiting $1,600 and higher. The form of the decline is corrective thus far while price has started a new upward move from $1,535.
Green rectangles- support signs The long lower tail candlesticks imply that strong buyers support price for a move higher. Price is at resistance area of $1,560-63 as we have noted from previous posts. Recapturing this area will increase the chances of making a move to $1,600 or higher. Short-term support is at $1,548 and bulls do not want to see price below that level. This could lead to a new lower low towards $1,510.
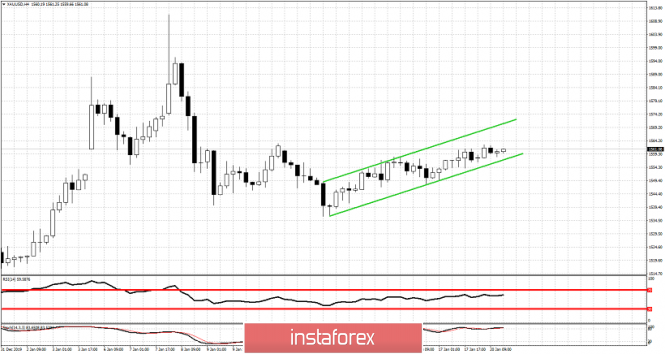
Gold price is inside the green bullish channel. It is important for bulls to stay above the lower channel boundary. As long as this is the case short-term trend will remain bullish. We are bullish as long as price is above $1,548 and specially if price breaks above $1,565. If support fails to hold we expect Gold price to make new lows towards $1,510 where the 61.8% Fibonacci retracement of the rise from $1,445 is found and the previous break out zone, once resistance, now support. The material has been provided by InstaForex Company - www.instaforex.com |
| January 20, 2020 : GBP/USD Intraday technical analysis and trade recommendations. Posted: 20 Jan 2020 09:01 AM PST
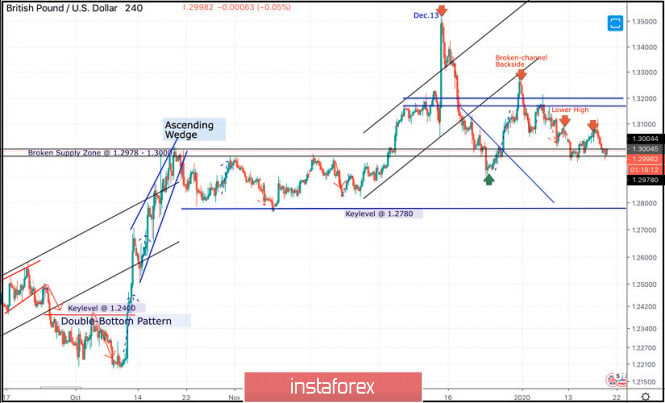
On December 13, the GBPUSD pair looked overpriced around the price levels of 1.3500 while exceeding the upper limit of the newly-established bullish channel. On the period between December 18 - 23, bearish breakout below the depicted channel followed by initial bearish closure below 1.3000 were demonstrated on the H4 chart. However, earlier signs of bullish recovery were manifested around 1.2900 denoting high probability of bullish pullback to be expected. Thus, Intraday technical outlook turned into bullish after the GBP/USD has failed to maintain bearish persistence below the newly-established downtrend line. That's why, bullish breakout above 1.3000 was anticipated. Thus, allowing the recent Intraday bullish pullback to pursue towards 1.3250 (the backside of the broken channel) where bearish rejection and another bearish swing were suggested for conservative traders in previous articles. Intraday bearish target are projected towards 1.3000 and 1.2980 provided that the current bearish breakout below 1.3170 is maintained on the H4 chart. Please also note that two descending highs were recently demonstrated around 1.3120 and 1.3090 which enhances the bearish side of the market. Conservative traders should wait for bearish breakdown below 1.2980, This is needed first to enhance further bearish decline towards 1.2900, 1.2800 and 1.2780 where the backside of the previously-broken downtrend is located. In the Meanwhile, Intraday traders can watch any bullish pullback towards the depicted price zone (1.3170 - 1.3200) for bearish rejection and another valid SELL entry with intraday bearish targets projected towards 1.3000 and 1.2980. The material has been provided by InstaForex Company - www.instaforex.com |
| Posted: 20 Jan 2020 07:44 AM PST Industry news: Block.one, the firm that developed the EOS.IO software, won't be using the public EOC mainnet to launch its cryptocurrency-powered social media platform Voice. According to the company's frequently asked questions page, Voice will instead be using a "purpose-made EOSIO blockchain." In time, the page adds, it hopes Voice will "leverage the EOS Public Blockchain." Technical analysis:
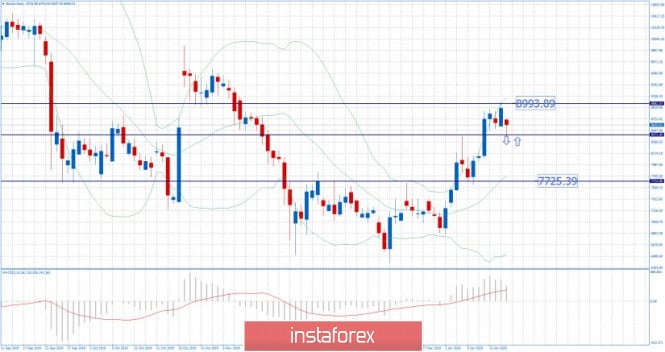
BTC has been trading downwards. As we expected, the price tested the level of $8.440. I found that the level of $8.440 is critical pivot level for BTC and further direction. In case of the downside breakout of $8.440, watch for selling opportunities on the rallies with the main target at $7.725. In case of the rejection of the pivot $8.440, watch for buying on the dips with the main target at $9.000. MACD oscillator is still showing positive reading above the zero. Resistance level is seen at the price of $9.000 Main support pivots are set at $8.440 and $7.725 The material has been provided by InstaForex Company - www.instaforex.com |
| USD/JPY. The main goal - 111.20: the pair maintains its growth potential Posted: 20 Jan 2020 07:36 AM PST Today, the United States celebrates Martin Luther King Day, which is why American trading platforms are closed. However, this does not prevent the dollar from strengthening throughout the market, reflecting the increased interest of investors. The dollar index is held in the middle of the 97th figure, after the December decline to the level of 96.05 (half-year low). Greenback dominates all dollar pairs – even the pound, which grew last week despite negative macroeconomic reports, is gradually losing its positions. But the yen capitulated much earlier, as soon as the market subsided anti-risk sentiment. Today, traders, on the contrary, show increased interest in risky assets, and this fact puts additional pressure on the yen. Also, USD/JPY traders are waiting for tomorrow's meeting of the Bank of Japan, which is rumored to be "pass-through". However, the head of the Japanese regulator Haruhiko Kuroda knows how to surprise – for example, in January 2016, the Japanese Central Bank unexpectedly introduced a negative rate on new deposits. Although a week earlier, the head of the Central Bank convinced parliamentarians that the bank "does not even seriously consider such a scenario." Given this incident, traders should not lose their vigilance: the Bank of Japan can take action at any meeting, despite the seeming improbability of this scenario.
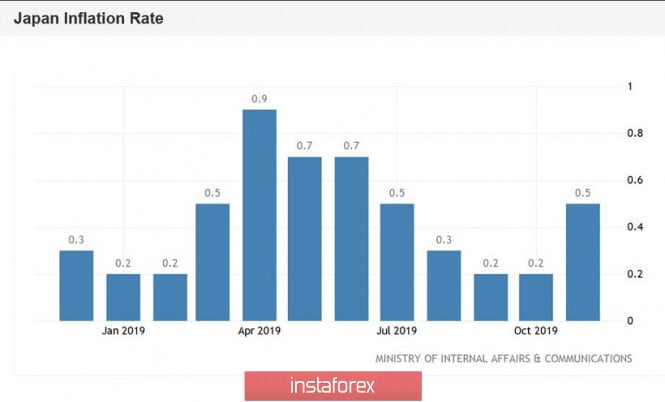
Kuroda himself is now voicing neutral rhetoric, while not excluding the implementation of the "dovish" scenario in the future. But some of his colleagues are in favor of lowering the rate further into the negative area and expanding the stimulus program. It is worth recalling that in July 2018, the Japanese regulator expanded the range, or rather, the limits of long-term interest rates. But it went no further than this decision. The regulator has been taking a wait-and-see position for several years. At the December meeting, Kuroda did not change the parameters of monetary policy – he only tried to put verbal pressure on the yen. He said that wages are growing at an extremely slow pace, and inflation has not risen even to half of its target two percent level, so the Central Bank "reserves the right" to resort to an appropriate reaction. And although he did not elaborate on his idea, the Bank of Japan has additional leverage in its arsenal, in addition to lowering the interest rate. We are talking about increasing the volume of purchases of Japanese government bonds and increasing the monetary base. At what point the regulator will go "from words to deeds" is unknown, but from the experience of previous years, we can assume that this will happen suddenly and without any prior warning. However, at the moment, the probability of such a scenario is low, given the growth of inflation in December and the dynamics of GDP growth. Also, we must not forget about the signing of the first phase of the US-China deal. In addition to the fact of the trade truce, this event has other positive (for the Central Bank) consequences – in particular, the yen in pair with the dollar has fallen by more than 300 points since the beginning of January. Therefore, most likely, the January meeting will still be "pass-through": Kuroda will voice the standard rhetoric, leaving monetary policy in the same form. This result will support the USD/JPY pair, as the yen will remain one on one with the events of the external fundamental background. In general, traders of this pair have a difficult time: the yen is forced to react not only to the internal fundamental background but also to the external one. As a rule, these factors have the opposite value for the yen, so the price dynamics follow the principle of "one step forward – two back". The complexity of the situation is because the north or south momentum of the pair ends abruptly and often unexpectedly.
But even with this uncertainty, we can assume that the USD/JPY pair will retain its potential for further growth soon, due to optimistic sentiments about the prospects of US-Chinese relations, as well as due to the "inaction" of the Japanese regulator at the January meeting. Taking these factors into account, the pair may grow at least to the level of 110.50 (the upper line of the Bollinger Bands indicator on the daily chart). On all higher timeframes (from H1 and higher, but except for MN), the Ichimoku indicator shows a bullish "Line Parade" signal, and the price is located between the middle and upper lines of the Bollinger Bands indicator. To continue the north trend, the pair's bulls need to overcome the above-mentioned mark of 110.50. The main goal of the northern movement is the mark of 111.20 (at this price point, the borders of the Kumo cloud closed on the monthly chart). The material has been provided by InstaForex Company - www.instaforex.com |
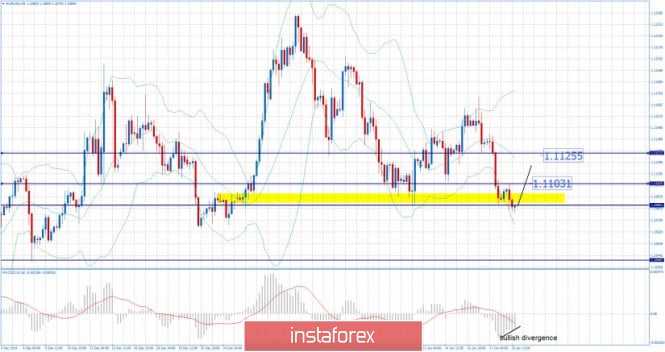
| EUR/USD for January 20,2020 - Bullish divergence on the MACD oscillator, potential for rally Posted: 20 Jan 2020 07:24 AM PST EUR/USD has been trading downwards. The price tested the level of 1.1079. I found that there is potential for oversold condition and that buying opportunities are preferable with the upward targets at 1.1103 and 1.1125.
In case of the stronger downside break, there is chance for test of 1.1040. MACD oscillator is bullish divergence on the 4H time-frame, which is sign that there is the chance for potential rally. Resistance levels are seen at the price of 1.1103 and 1.1125 Support levels are seen at 1.1080 and 1.1066 The material has been provided by InstaForex Company - www.instaforex.com |
| EUR/USD. January 20. Demand for the US dollar is rising, the pair is moving towards the second goal Posted: 20 Jan 2020 07:17 AM PST EUR/USD - 4H.
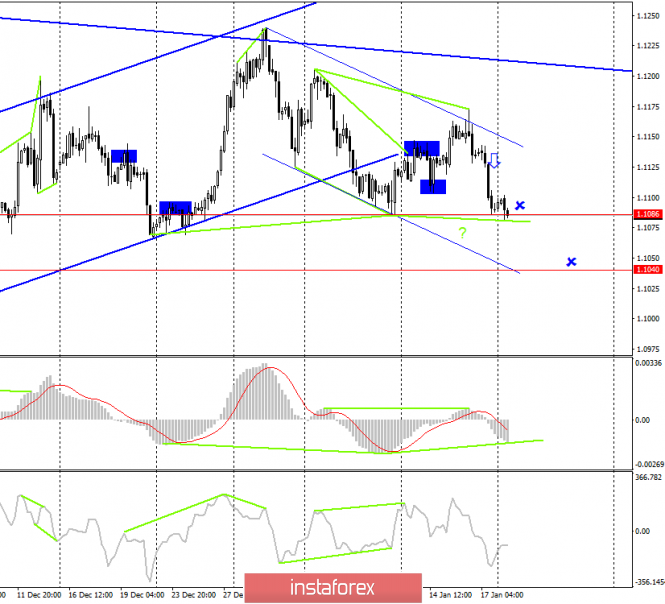
As seen on the 4-hour chart, the EUR/USD pair continues to fall after the formation of a bearish divergence in the MACD indicator. The first goal (level - low 1.1086) has been fulfilled. Now I am waiting for the pair's quotes to consolidate below this level and for the pair to fall further towards the next level - the low of 1.1040. The new downward trend corridor clearly shows the "bearish" mood of most traders in the market. The rebound of quotes from the level of 1.1086 may work in favor of the euro currency and some growth in the direction of the upper line of the corridor, but I still tend to close below the level of 1.1086. Today, January 20, a bullish divergence is brewing for the MACD indicator, but at the moment, it cannot be called formed yet. The information background on Friday was contradictory, as the US and European news were equally weaker than traders' expectations. Nevertheless, most of the "graphic" factors were in favor of the growth of the US currency. Forecast for EUR/USD and trading recommendations: The long-term trading idea remains valid, as the pair's quotes have performed a consolidation under the upward corridor on the 24-hour chart. Traders still have a long-term target for a fall near the level of 1.0850. Terms of execution - 2-3 weeks. The short-term trading idea is to sell the pair with the goal of 1.1040 since the trend on the 4-hour chart is again "bearish". After working out this level, new trading ideas will be generated. The material has been provided by InstaForex Company - www.instaforex.com |
| GBP/USD. January 20. Another approach of the pound to fall to $1.29 Posted: 20 Jan 2020 07:17 AM PST GBP/USD - 4H.
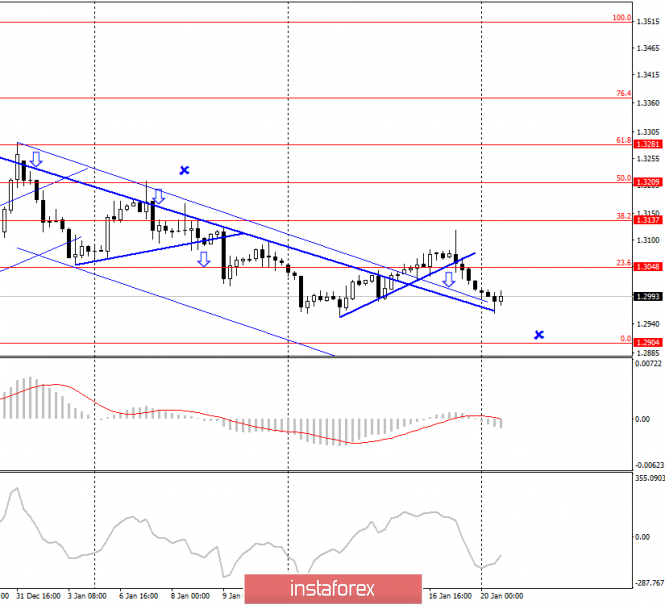
As seen on the 4-hour chart, the GBP/USD pair performed a consolidation under the corrective level of 23.6% (1.3048) and the correction line. This signal is marked with a blue down arrow. Thus, we still have the last undeveloped target - the corrective level of 0.0% (1.2904). The pound-dollar pair exited two downward corridors at once, which eloquently indicates the possible end of the fall in quotes. At the same time, the information background continues to push the quotes down, so the fall can be continued. I continue to believe that the pair will fall to the level of 1.2904, although I admit that I expected this much earlier. In any case, those who opened positions on the signal of consolidation under the correction line can place the Stop Loss level above the level of 1.3048 to minimize possible losses on the transaction. Today, the divergence is not observed in any indicator. The information background on Friday was not on the side of the pound. Retail sales in the UK were significantly weaker than forecasts, so the demand for the pound fell on Friday and remains low today, Monday. Forecast for GBP/USD and trading recommendations: The trading idea is still to sell the pound with a target of 1.2904. Going beyond both of the corridors negate their relevance, at the same time, the "foundation" continues to prevail over the British. Fixing under the correction line and the Fibo level of 23.6% is a new signal for sales. The material has been provided by InstaForex Company - www.instaforex.com |
| Posted: 20 Jan 2020 07:17 AM PST Gold has been trading sideways at the price of $1.560. My analysis from last week is still valid. The price is at the critical decision level at $1.562 and you should watch carefully the price action around it.
The breakout of the $1.562 to the upside will confirm test of $1.557 and in that case you should watch on buying opportunities on the dips. The rejection of the resistance at $1.562 would confirm rotation back towards the level of $1.535. MACD oscillator is showing that slow line turned bearish but the reading is still above the zero. Major resistance is set at the price of $1.562. Support levels and downward target is set at the price of $1.535.The material has been provided by InstaForex Company - www.instaforex.com |
| Evening review for EURUSD for 01/20/2020. The euro is at a crossroads Posted: 20 Jan 2020 07:05 AM PST
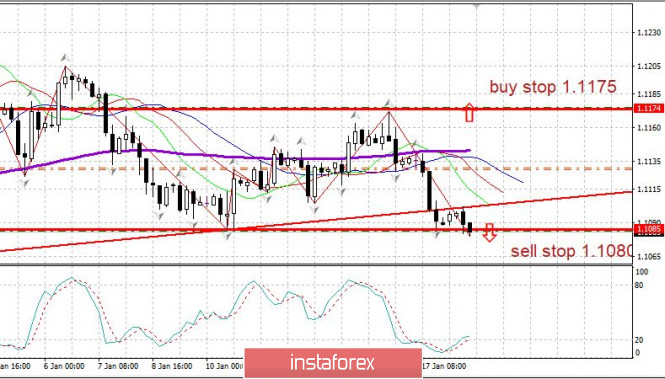
The market is calm. Today is a holiday (Martin Luther King Day) in the US. The main event of the week is the ECB meeting on Thursday on rates. A strong movement in the euro is possible. Sales from 1.1080. Purchases from 1.1175. The material has been provided by InstaForex Company - www.instaforex.com |
| Trading plan for AUD/USD for January 20, 2020 Posted: 20 Jan 2020 04:45 AM PST
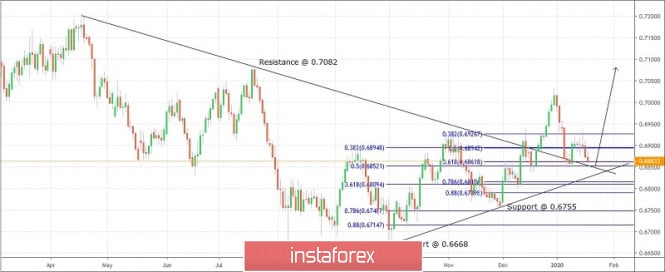
Technical outlook: AUD/USD is seen to be trading lower at around 0.6863 levels at this point in writing and could be forming a bottom soon around 0.6810 before resuming rally. The overall structure remains bullish since AUD/USD formed a major low at 0.6668 in October 2019. Since then, bulls have managed to print a series of higher highs and higher lows, breaking above the dropping trend line resistance and reaching up to 0.7031 levels. Furthermore, it has back tested the resistance turned support trend line at 0.6849 and seems to be testing again, before resuming a rally. In case prices drop below 0.6849, the next in line support comes in at 0.6810 levels, which is also fibonacci 0.618 retracement of the entire rally between 0.6668 and 0.7031 respectively. Please note that bulls should remain poised to push through resistance at 0.7082 before producing any meaningful correction lower. Besides note that trend line support is accompanied by fibonacci convergence around 0.6810/15 levels, hence probability remains high for a bullish reversal if prices manage to reach there. Trading plan: Remain long, stop below 0.6668, target 0.7200. Good luck! The material has been provided by InstaForex Company - www.instaforex.com |
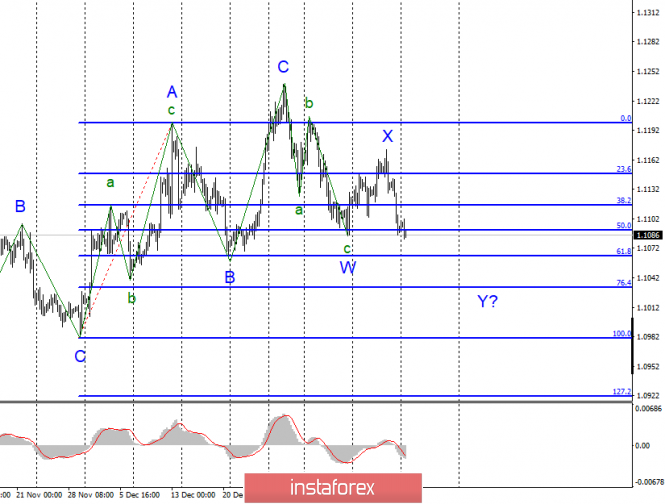
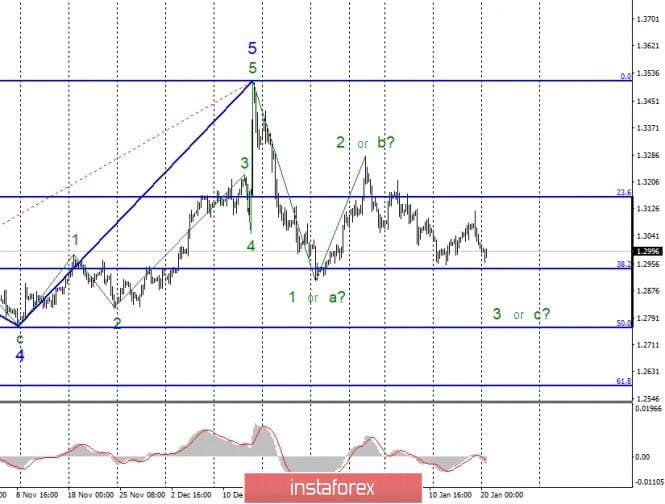
| Posted: 20 Jan 2020 04:36 AM PST EUR/USD On January 17, the EUR/USD pair lost about 45 basis points and thus continues to build a new downward wave, which is identified in the current complex wave markup as Y. The current set of waves is likely to consist of 3 down waves. Recently, the euro-dollar instrument has been moving mainly in three-wave structures. If this is true, then the decline in quotes will continue with targets located near 61.8% and 76.4% of Fibonacci. Fundamental component: The news background for the tool on Friday was quite important. Markets had to find out whether inflation in the eurozone would improve in December or remain at the same level. Unfortunately, the euro area still shows little sign of accelerating the economy, and, in particular, the ECB's most worrying inflation remains at very low levels. In December, consumer prices in the euro area increased by 1.3% compared to December a year earlier. The annual increase in prices of just over 1% is very small, this does not allow the ECB to talk about the possibility of tightening monetary policy. Moreover, a few months ago, inflation was falling to the value of 0.7% y/y, so now we can still regard the current value as relatively high. In any case, there is only one sense: inflation is so weak in the eurozone that demand for the euro currency fell again on Friday. Unfortunately, the economic reports from America also did not particularly please the currency and stock markets. Industrial production fell by 0.3% in December, although markets had expected a reduction of no more than 0.2% m/m. Industrial production – not the strongest report and did not cause a decrease in demand for the US currency on Friday, however, this is not the first drop in production in America. The University of Michigan consumer confidence index was also worse than market expectations – at 99.1. Given the fact that the news background from America and the European Union is not too different now, after the completion of the current wave structure, we can expect the construction of new three waves to the top. General conclusions and recommendations: The euro-dollar pair is presumably continuing to build a downward set of waves. Thus, I would recommend continuing to sell the instrument with targets located around 1.1034 and 1.0982, which corresponds to 76.4% and 100.0% of Fibonacci. GBP/USD The GBP/USD pair lost 65 basis points on January 17 but also continues to remain inside the new downward trend, which can turn out to be both 3-wave and 5-wave. Even if the 3-wave option is implemented, the decline in quotes should continue in the direction of the 50.0% Fibonacci level. Regular waste of quotes from the reached lows slightly complicates the internal structure of wave 3 or C. An unsuccessful attempt to break the 38.2% Fibonacci level may lead to another withdrawal of quotes from the reached lows. Fundamental component: The news background for the GBP/USD instrument on Friday, as usual, was disappointing. Markets didn't even wait for economic reports from America. Having received information about retail sales in Britain in the morning (0.9% y/y, -0.6% m/m), they rushed to sell the British pound again. Thus, in short, the situation is as follows: the Bank of England is preparing to lower the key rate (it remains only to understand how soon this will happen), economic reports from month to month continue to indicate a fall in the British economy, the country is facing difficult negotiations on future trade relations with the European Union. The UK's financial sector continues to suffer. Due to the country's exit from the EU, foreign investment has sharply decreased, some companies have closed their production facilities on British soil, and some are considering such a step. Much will now depend on whether Brussels and London can agree. If there is a deal, it will mitigate the negative effect of Brexit. If there is no deal, it will essentially be called a "hard" Brexit. In any case, the news background remains a factor that exerts strong pressure on the British currency. General conclusions and recommendations: The pound-dollar tool continues to build a new downward trend. I recommend selling the instrument again with targets located around the mark of 1.2764, which corresponds to the 50.0% Fibonacci level. A successful attempt to break the 38.2% level will indicate that the markets are ready to continue selling the British currency. The material has been provided by InstaForex Company - www.instaforex.com |
| Trading plan for NZD/USD for January 20, 2020 Posted: 20 Jan 2020 04:25 AM PST
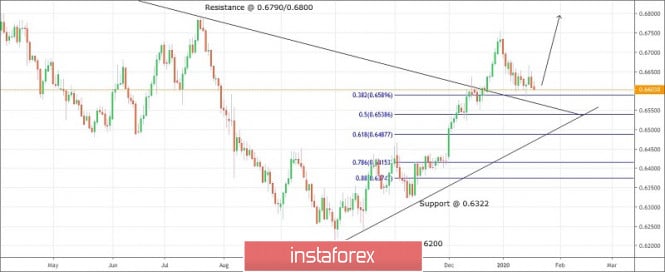
Technical outlook: NZD/USD might be preparing for yet another rally towards 0.6800 levels, to take out resistance at 0.6790. We can expect a meaningful corrective drop thereafter towards 0.6500 levels. Please note that NZD/USD has found interim support at the fibonacci 0.382 retracement of the recent upswing between 0.6322 and 0.6750 levels respectively. Moreover, bulls have already managed to break into the buy zone of the trend line resistance. So, NZD/USD has back tested support around 0.6584 levels. If the recent lows at 0.6580/85 levels remain intact, NZD/USD bulls should remain in control and push prices towards yet another high before giving in to bears again. In accordance to the price resistance at 0.6790, we are expecting a minimum push through the same before pulling back lower again. NZD/USD would maintain its bullish structure until prices stay broadly above 0.6200 levels. Trading plan: Remain long, stop @ 0.6550, target @ 0.6800 levels. Good luck! The material has been provided by InstaForex Company - www.instaforex.com |
| Trading plan for GBP/USD for January 20, 2020 Posted: 20 Jan 2020 04:01 AM PST
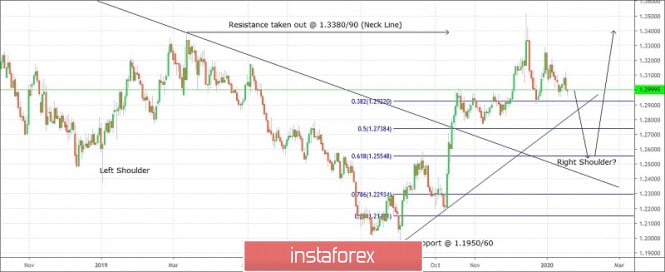
Technical outlook: GBP/USD seems to be carving an inverted head and shoulder pattern as displayed on the daily chart here. The Head is seen at support around 1.1950/60, the Left Shoulder could be around 1.2500/50, the Neck Line was broken at 1.3380/90 earlier respectively. Since GBP/USD hit 1.3515 levels, the Cable pair seems to be retracing lower and may be carving the potential Right Shoulder around 1.2500 levels. Furthermore, please note that fibonacci 0.618 retracement is also converging around 1.2550 levels. GBP/USD is seen to be trading around 1.3000 levels at this moment of writing and could be looking to drop sharply towards the 1.2550 support, before resuming higher again. Please note that the boundary that is being worked upon is between 1.1950/60 and 1.3515 respectively. Once the pullback is complete, we can expect bulls to resume pushing higher at least towards 1.4200 zone. Trading plan: Buy around 1.2550, stop @ 1.1950, a target is open. Good luck! The material has been provided by InstaForex Company - www.instaforex.com |
| Trading plan for EUR/USD for January 20, 2020 Posted: 20 Jan 2020 03:43 AM PST
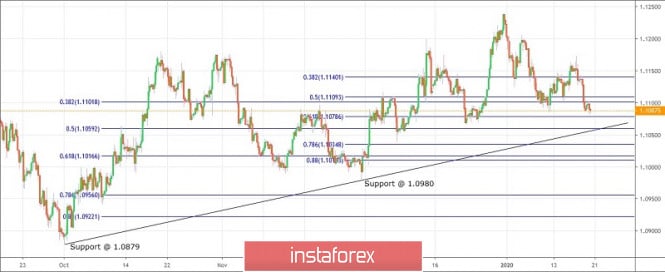
Technical outlook: EUR/USD has been correcting lower since 1.1240 levels over a few weeks. This could be the final corrective drop towards 1.1050 or 1.1000, before the rally resumes. Overall structure remains bullish till prices stay above 1.0879, which is defined as major support here. Intermediary support is seen at 1.0980 and EUR/USD may bounce ahead of that. Please note that a fibonacci convergence is seen around 1.1000 levels, and a bullish bounce there, remains high probability. Besides, note that trend line support is passing close to 1.1000/1.1050 levels respectively. The structure remains bullish since 1.0879 lows and upside targets are projected towards 1.1500 at least. The trading strategy for EUR/USD remains clearly buying on dips with a target potential higher through 1.1500/1.1800 respectively. Prices should hold 1.0879 levels, going forward. Trading plan: Remain long and also buy further around 1.1000/50, stop @ 1.0879, target is 1.1500 Good luck! The material has been provided by InstaForex Company - www.instaforex.com |
| You are subscribed to email updates from Forex analysis review. To stop receiving these emails, you may unsubscribe now. | Email delivery powered by Google |
| Google, 1600 Amphitheatre Parkway, Mountain View, CA 94043, United States | |





No comments:
Post a Comment