Forex analysis review |
- January 3, 2020 : EUR/USD Intraday technical analysis and trade recommendations.
- EUR/USD. January 3. The goal of 1.1125 on the previous trading idea worked out perfectly
- GBP/USD. January 3. The development of a strong sell signal continues
- January 3, 2020 : GBP/USD Intraday technical analysis and trade recommendations.
- Analysis on EUR/USD and GBP/USD for January 3, 2020
- BTC analysis for 01.03.2020 - Intraday overbought condiiton, watch for selling opportunties
- GBP/USD analysis for 01.03.2020 - The breakout of the Pitchfork upward channel and new down cycle on the way
- Gold analysis for 01.03.2020 - First upward objective reached at the price of $1.550, watch for second at $1.600
- GBP/USD: plan for the US session on January 3. Sellers of the pound do not think to retreat from the market, taking advantage
- Trader's diary on EUR/USD for January 3, 2020
- Analysis and forecast for USD/JPY on January 3, 2020
- Analysis and recommendations for EUR/USD as of January 3, 2020
- Euro threw off bonds
- EUR/USD: plan for the US session on January 3. The German labor market did not please the euro. Bears' new target - 1.1119
- EUR/USD. Market is nervous - dollar is growing: the killing of an Iranian general has stirred up the currency market
- Technical analysis of AUD/USD for January 03, 2019
- Overview of EUR/USD for January 3. Business activity in manufacturing in the EU pushed the pair down
- USD/JPY – take profit!
- Simplified wave analysis of EUR/ USD, AUD/USD, and GBP/JPY on January 3
- Is euro always in the background?
- Trading plan on EUR/USD for January 3, 2020
- Technical analysis: Important intraday levels for EUR/USD, January 03, 2020
- Technical analysis: Important intraday levels for USD/JPY, January 03, 2020
- Technical analysis recommendations for EUR/USD and GBP/USD on January 3
- Technical analysis of ETH/USD for 03/01/2020:
| January 3, 2020 : EUR/USD Intraday technical analysis and trade recommendations. Posted: 03 Jan 2020 07:15 AM PST
Since November 14, the price levels around 1.1000 has been standing as a significant DEMAND-Level which has been offering adequate bullish SUPPORT for the pair on two successive occasions. Shortly-after, the EUR/USD pair has been trapped within a narrower consolidation range between the price levels of 1.1000 and 1.1085-1.1100 (where a cluster of supply levels and a Triple-Top pattern were located) until December 11. On December 11, another bullish swing was initiated around 1.1040 allowing recent bullish breakout above 1.1110 to pursue towards 1.1175 within the depicted newly-established bullish channel. Initial Intraday bearish rejection was expected around the price levels of (1.1175). Quick bearish decline was demonstrated towards 1.1115 (Intraday Key-level) which got broken to the downside as well. On December 20, bearish breakout of the depicted short-term channel was executed. Thus, further bearish decline was demonstrated towards 1.1065 where significant bullish recovery has originated. The recent bullish pullback towards 1.1235 (Previous Key-zone) was suggested to be watched for bearish rejection and another valid SELL entry. Suggested bearish position is currently running in profits while moving below the broken demand-level of 1.1175. Moreover, bearish persistence below 1.1175 allows next bearish target to be reached around 1.1120. On the other hand, partial profit-taking is suggested to offset the associated risk. Trade recommendations : Conservative traders should wait for another bullish pullback towards the price level of (1.1175) as another valid SELL signal. Bearish projection target to be located around 1.1120. Any bullish breakout above 1.1250 invalidates the mentioned bearish trade. The material has been provided by InstaForex Company - www.instaforex.com |
| EUR/USD. January 3. The goal of 1.1125 on the previous trading idea worked out perfectly Posted: 03 Jan 2020 07:12 AM PST EUR/USD - 4H.
On January 2, the EUR/USD pair continued to fall in the direction of the previously designated target level of 1.1125. Today, on January 3, the euro-dollar pair worked out this level very precisely, so all traders who used this trading idea made a profit. The rebound of the pair's quotes from the level of 1.1125 at the moment worked in favor of the European currency and the beginning of growth in the direction of the upper area of the upward trend corridor. Thus, from the current situation, there are two options: the pair's growth to the area of the level of 1.1250 (where the current fall started from) or consolidation under the upward corridor, which will change the mood of traders to "bearish" and allow counting on the continuation of the fall. Forecast for EUR/USD and trading recommendations: The previous trading idea was to sell the pair with a target of about 1.1125. Now I suggest that traders wait a bit for either the formation of a new trading idea or fixing the pair's rate under the upward corridor to be able to sell the pair again. The material has been provided by InstaForex Company - www.instaforex.com |
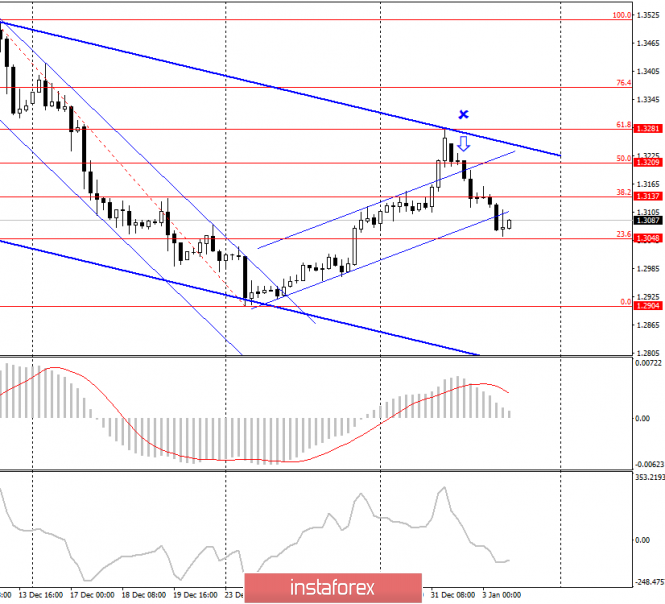
| GBP/USD. January 3. The development of a strong sell signal continues Posted: 03 Jan 2020 07:12 AM PST GBP/USD - 4H.
On January 3, the GBP/USD pair continues to fall in the direction of the corrective level of 23.6% (1.3048), from which it can perform a rebound and start the growth process. However, the pound-dollar pair remains within a largely downward trend corridor and performed a reversal in favor of the US dollar in its upper area. Thus, I believe that the fall in the pair's quotes will continue and this requires fixing under the Fibo level of 23.6% (1.3048). In this case, the fall will continue with the goal of a corrective level of 0.0% (1.2904), after reaching which you will need to look at what will be the mood of traders, as the potential fall of the pound may continue even lower. However, I still recommend considering the level of 1.2904 as the final trading idea for the pair's sales. Forecast for GBP/USD and trading recommendations: The trading idea is to sell the pound with targets of 1.3050 and 1.2900, and the first of these goals have already been worked out. Thus, already around the level of 1.3050, it is quite possible to fix a profit. I believe that the second goal near the level of 1.2904 will also be worked out next week. The material has been provided by InstaForex Company - www.instaforex.com |
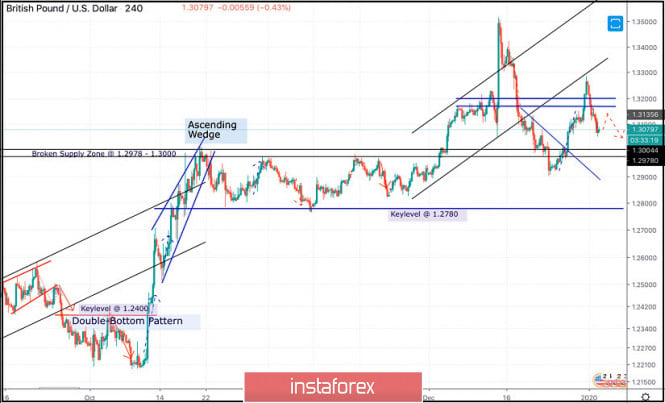
| January 3, 2020 : GBP/USD Intraday technical analysis and trade recommendations. Posted: 03 Jan 2020 06:39 AM PST
In the period between October 17 to December 4, the GBP/USD pair has been trapped between the Key Levels of 1.2780 and 1.3000 until December 4 when bullish breakout above 1.3000 was achieved. Moreover, a newly-established short-term bullish channel was initiated on the chart. The GBPUSD has recently exceeded the upper limit of the depicted bullish channel on its way towards 1.3500 where the pair looked quite overpriced. This was followed by successive bearish-engulfing H4 candlesticks which brought the pair back towards 1.3170 quickly. Further bearish decline was pursued towards 1.3000 which got broken to the downside temporarily. That's why, Short-term outlook turned into bearish since bearish persistence below 1.3000 was demonstrated on the H4 chart. However, earlier signs of bullish recovery manifested around 1.2900 denoted high probability of bullish breakout to be expected. Thus, Intraday technical outlook turned into bullish after the GBP/USD has failed to maintain bearish persistence below the newly-established downtrend line. That's why, bullish breakout above 1.3000 was anticipated. Thus allowing the recent Intraday bullish pullback to pursue towards 1.3250 (the backside of the broken channel) where bearish rejection and another bearish swing were suggested for conservative traders in the previous articles. Intraday bearish target remains projected towards 1.3000 and 1.2980 provided that the current bearish breakout below 1.3170 is maintained. Bearish breakdown below 1.2980 enhances further bearish decline towards 1.2900 where the backside of the previously-broken downtrend. On the other hand, earlier bullish pullback towards the depicted price zone (1.3170 - 1.3200) should be watched for bearish rejection and another valid SELL entry. The material has been provided by InstaForex Company - www.instaforex.com |
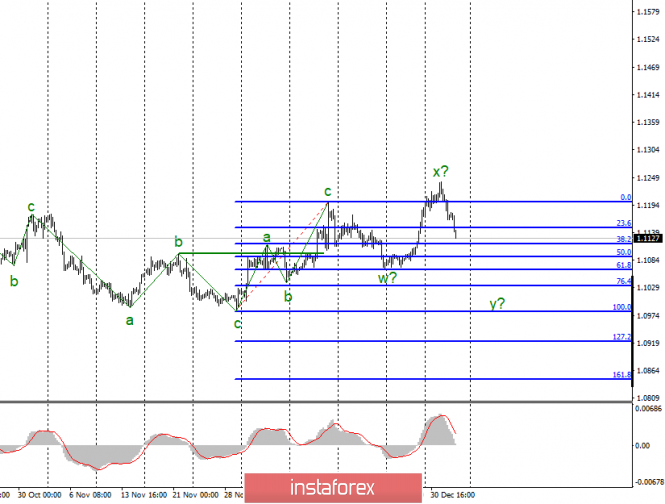
| Analysis on EUR/USD and GBP/USD for January 3, 2020 Posted: 03 Jan 2020 04:53 AM PST EUR/USD
On January 2, the EUR/USD pair lost about 50 basis points, and another 45 on Friday, January 3. This will consequently move the trading instrument to the construction of the expected downward wave y. If that happens, the quotes will continue to decline to the goals located below the minimum of the wave w which is below the 61.8% Fibonacci. In recent months, the instrument has been predominantly building three-wave structures, so the current wave structure can be completed in about 10 figures. Fundamental component: The news background for the EUR/USD pair was unfavorable yesterday, as most of the indices of business activity in the production areas of the Eurozone countries, although showed positive dynamics, still remained at fairly low values. Today, it will be interesting to look at the ISM index of the gradual acceleration of inflation, the index of business activity in the ISM services sector, and the publication of Fed's report regarding open markets. The ISM index for the manufacturing sector will be of the greatest interest. Let me remind you that yesterday, the Markit index was at 52.4, allowing us to judge the positive dynamics of business activity in the US. However, the ISM index in November was at 48.1, so today, the markets expect to see a value of about 49.0, making a value of not lower than 49.0 to lead a further increase in the US currency and a decrease in the EUR/USD instrument. The event with a louder sign "Fed report", however, is unlikely to affect the market and its behavior today. It will be published late in the evening a few hours before closing for the weekend. It is more statistical in nature, so all the information from the last meeting has long been known, and it only emphasizes the results. Let me remind you that the Fed took a pause in the cycle of lowering the key rates, which in some ways, is a bullish factor for the US currency. General conclusions and recommendations: The EUR/USD pair has presumably completed the construction of an upward trend section. Therefore, I would recommend continuing to sell the instrument with targets located near the 1.1034 and 1.0982 marks, which corresponds to 76.4% and 100.0% for Fibonacci. GBP / USD
The GBP / USD pair fell by 110 basis points on January 2 and thus moved to the active construction of wave 3 as part of a new downward trend section. Given the size of the expected wave 1, wave 3 may be very long, which leads to the idea of a potential rise in the US currency in the coming months. The minimum targets of the current wave structure are currently seen around 29 and 28 figures. Everything will then depend on the news background and events related to Brexit. Fundamental component: The news background for the GBP/USD instrument on Friday can be said to be exactly the same as that of the EUR/USD instrument, since economic reports are coming from America today. Thus, a strong ISM business activity index can help the pair. For the GBP, "Brexit" remains the number one topic, and no new information is received, as it is the holidays after all. However, the situation may change next week. Let me remind you that Brexit will enter its final phase on January 31, 2020, after which a transition period will begin, where the parties will need to agree on all aspects of further relations between the EU and Britain. British Prime Minister Boris Johnson is already taking a very hard line in these negotiations even though it has not started yet. Johnson wants to get an agreement that will suit him, and at the same time, to negotiate as soon as possible, as December 31, 2020 will be the final break between Brussels and London. According to most experts, it is impossible to reach an agreement of this size in 1 year. This factor is what will dominate the pound throughout 2020. General conclusions and recommendations: The GBP/USD pair continues to build a new downward trend. I recommend selling the instrument now with targets located near the 1.2764 mark, which corresponds to the 50.0% Fibonacci level, since wave 2 or b is presumably completed, as indicated by the unsuccessful attempt to break the 61.8% Fibonacci level. The material has been provided by InstaForex Company - www.instaforex.com |
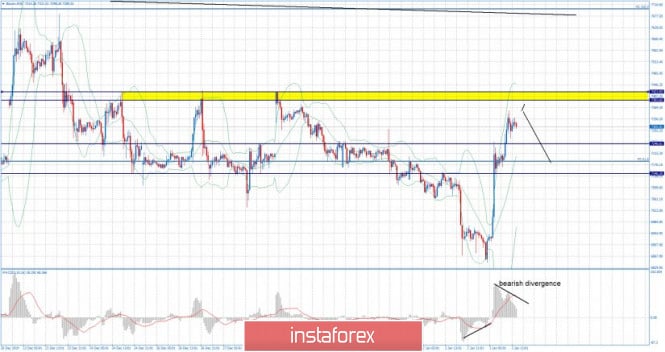
| BTC analysis for 01.03.2020 - Intraday overbought condiiton, watch for selling opportunties Posted: 03 Jan 2020 04:49 AM PST Industry news: Over the past two hours a $36.5 mln worth of BTC has been moved between the Bitstamp exchange and several unknown wallets. On January 1, Whale Alert showed one more transaction between an unknown wallet and Bitstamp totalling $8,974,648 (1,250 BTC). In the comment threads, some are expressing opinions that Bitcoin whales are moving their funds. Technical analysis:
Bitcoin has been trading upwards. The price reached the level of $7.300. Strong resistance cluster can be found at $7.400-$7.450. I see that watching the Intrraday frame 30M, buying seems like due to overbought condition. Watch for intraday selling opportunities and potential testing of $7.246 nadf MACD oscillator is showing neutral stance and contraction, which is sign that there is the big move that is coming and potential expansion period. Yellow rectangles – Current trading range Resistance levels are seen at the price of $7.400 and $7.700 Support levels are set at the price of $7.250 and at the price of $7.150The material has been provided by InstaForex Company - www.instaforex.com |
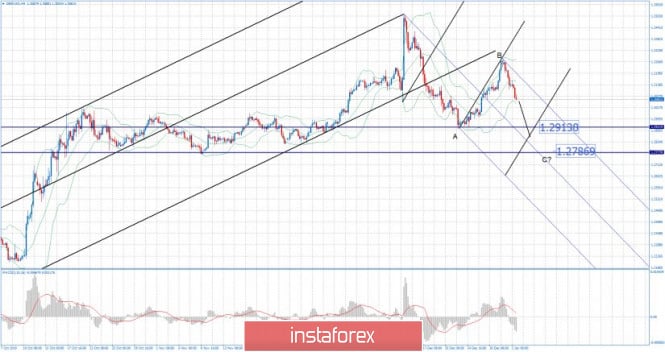
| Posted: 03 Jan 2020 04:28 AM PST GBP/USD has been trading downside. The price tested the level of 1.3060 I found breakout of the upward channel in the background and potential C wave in creation, which is sign that sellers are in control.
My advice is to watch for selling opportunities on the rallies using intraday-frames 5/15 minutes. The downward targets are set at the price of 1.2915 and 1.2790 MACD oscillator is showing increase on the downside momentum, which is good confirmation for the further downside... Resistance levels and upward targets are seen at the price of 1.3120 and 1.3157. Support levels are set at the price of 1.2915 and at the price of 1.2790 The material has been provided by InstaForex Company - www.instaforex.com |
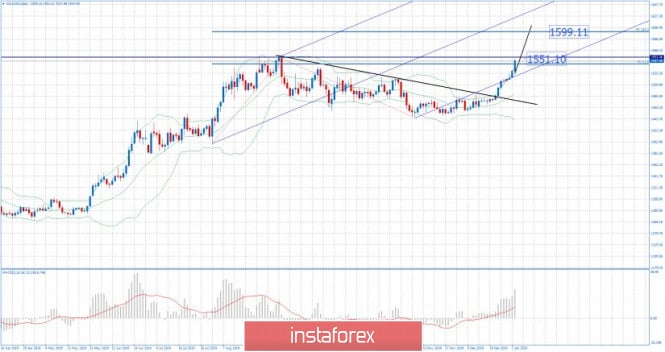
| Posted: 03 Jan 2020 04:19 AM PST Gold has been trading upwards with strong momentum. The price reached our first upward target at level of $1.550. I still see more upside on the Gold and potential test of $1.600 (second target). The breakout of the consolidation last week was the key for strong demand on the Gold.
My advice is to watch for buying opportunities on the dips using intraday-frames 5/15 minutes. MACD oscillator is showing increase on the upside momentum and new high, which is good confirmation for the further upside... Resistance levels and upward targets are seen at the price of $1.554 and $1.600. Support levels are set at the price of $1.524 and at the price of $1.516 The material has been provided by InstaForex Company - www.instaforex.com |
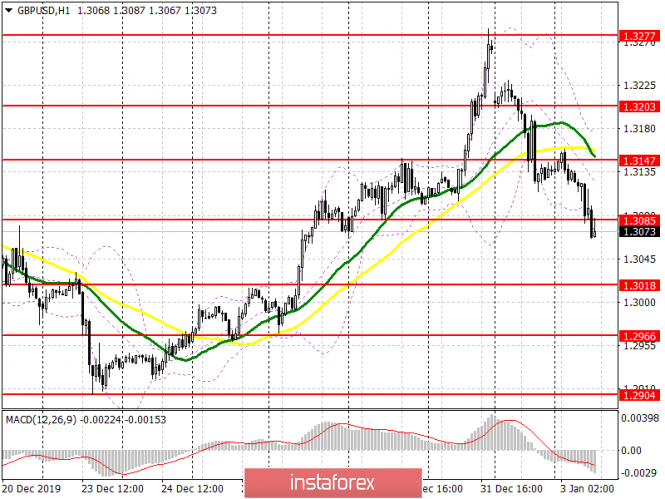
| Posted: 03 Jan 2020 04:11 AM PST To open long positions on GBPUSD, you need: Buyers failed to hold the support level of 1.3085 after a weak report on slowing activity in the UK construction sector. At the moment, the priority will be to return this range with the formation of an upward correction in the area of 1.3147 and update the maximum of 1.3203, where I recommend fixing the profit. However, such growth can occur only under the scenario of a negative reaction of major players to the protocols of the Federal Reserve System. If the pair declines further, it is best to return to long positions only after the test of large support of 1.3018 or buy the pound on a rebound from the minimum of 1.2966. To open short positions on GBPUSD, you need: Sellers are moving according to the planned scenario, which I paid attention to in the morning forecast. While trading is below the resistance of 1.1085, we can expect the continuation of the downward correction to the lows of 1.3018 and 1.2966, where I recommend fixing the profit. If the bears miss the resistance of 1.1085 after the data from the Fed, it is best to return to short positions on the update of the maximum of 1.3147 or sell the pound immediately on the rebound from 1.3203. Indicator signals: Moving Averages Trading is below the 30 and 50 daily averages, which indicates a further decline in the pound. Bollinger Bands If the pair grows in the second half of the day, the average border of the indicator around 1.3130 will act as a resistance.
Description of indicators
|
| Trader's diary on EUR/USD for January 3, 2020 Posted: 03 Jan 2020 04:05 AM PST
The market's mood is changing against the euro. The EUR/USD rate has declined significantly for the second day in a row. The growth of euro is questionable. There are no big reasons for selling euros. The market is still very narrow, as the main players will come to the market after the weekend, making the current fall to end up being a normal correction. On the decline, there is a serious support at the 1.1100-1.1120 zone. If euro falls to 1.1080 and fixes there, the growth trend will be cancelled. Keep buying from 1.1035. If it falls to 1.1065, there will be a turnover. The material has been provided by InstaForex Company - www.instaforex.com |
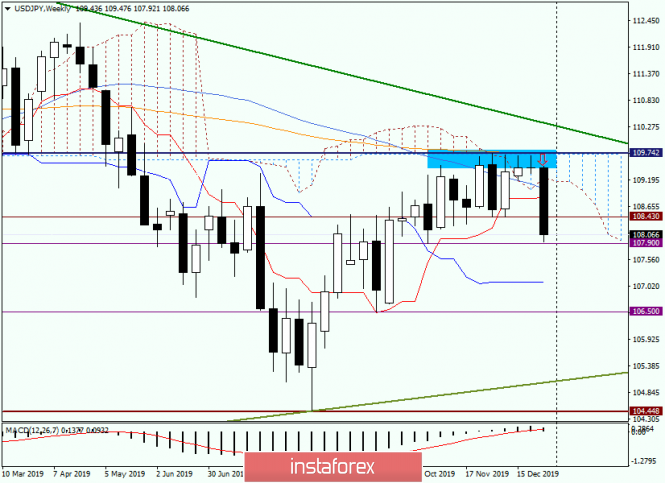
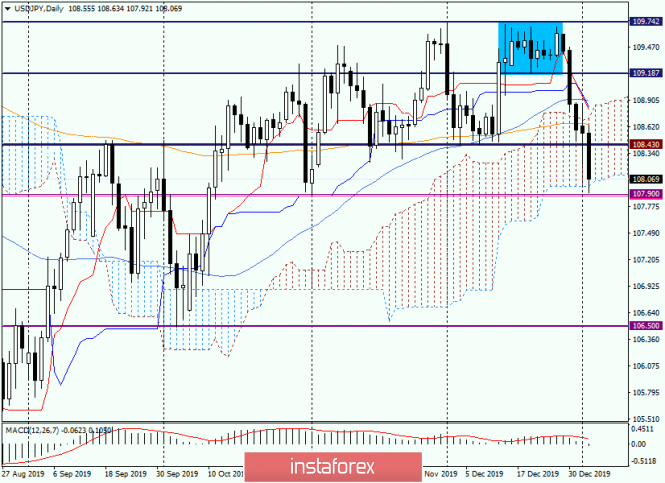
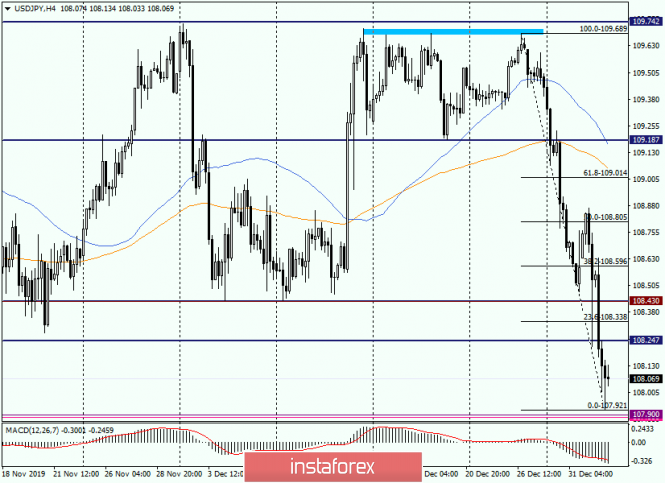
| Analysis and forecast for USD/JPY on January 3, 2020 Posted: 03 Jan 2020 03:34 AM PST The US dollar continues to systematically decline against the Japanese yen, and it is already quite strong. However, FOMC protocols can support the US currency and the pair USD/JPY is quite capable of adjusting and reducing existing losses. On the other hand, a scenario is possible in which the dollar will come under pressure. Everything will depend on what is reflected in the protocols and how market participants will react to this. Recently, many Fed leaders have expressed the view that the refinancing rate will remain unchanged in the near future. Representatives of the Federal Reserve said that the economic situation is quite stable and there is no need to change the parameters of monetary policy. In this regard, it can be assumed that the same rhetoric will find its place in today's protocols, which will be published at 19:00 (Universal time). If this assumption is correct, then much of the price dynamics of the US dollar will depend on various nuances. In general, I believe that after the publication of the protocols, cardinal changes will not occur. Increased volatility and sudden movements to each side are quite possible, but in order to win back all the losses incurred at the moment, you need a truly extraordinary positivity and where does it come from? Weekly Now, contrary to my own principles again, I will begin the technical part of this review with a review of the weekly schedule. A significant decline, which began after the players' inability to increase to break above the strong resistance of sellers in the area of 109.75, reached the support of 107.90. As you can see on the graph, this is a fairly strong technical level, from which there are attempts to bounce. We must immediately determine that the closure of weekly trading below 107.90 will open the way to the Kijun line of the Ichimoku indicator, which runs at 107.10. The breakdown of Kijun and consolidation at a significant level of 107.00 may trigger a continuation of the downward trend to the area of 106.50, where support is also taking place. In my opinion, it's still too early to talk about the further goals of sellers. Let's see how things are on the lower time frames. Daily On the daily chart, there is a struggle between the opposing sides for going down from the Ichimoku cloud. Naturally, the bears try to push the pair down, but the situation is complicated by the presence of the support level of 107.90, which is the reason for the upward rebound together with the lower border of the cloud. It is very interesting and important how long the current rebound will be and what kind of day candle will eventually form. I do not exclude that today's candlestick will be with a long lower shadow and a closing price in the region of 108.20-108.40 but we will see. The situation is not simple and extremely important. I believe that a lot will be decided at the end of today's auction, after the publication of the FOMC protocols. H4 On this time frame, the downward movement is particularly noticeable. Thus, you can expect a course correction given the last closed candle with a long lower shadow. In this regard, I stretched the grid of the Fibonacci instrument to decline to 109.69-107.92. As I have repeatedly expressed my opinion, the correction is often limited to the first pullback level of 23.6 Fibo after such strong movements. It is characteristic that in our case 23.6 Fibo is located at 108.33, that is, it falls into the area indicated above 108.20-108.40. From a technical point of view, climbing to 23.6 is a good option for opening short positions on USD/JPY. Moreover, sales at more attractive prices are worth looking for when the rate rises to the area of 108.60-108.80, where in addition to the strong levels themselves, there are 38.2 and 50.0 Fibo levels from a decrease of 109.69-107.92. However, I consider purchases to be more risky. Why not wish to buy in the support area 107.90-108.00? In addition, the stop is small at 107.92, although the profit is small, it's the same price range 108.20-108.40. However, staying ahead of the close of weekly trading and ahead of the publication of Fed protocols outside the market is also a position. In any case, the decision is individual. Good luck! The material has been provided by InstaForex Company - www.instaforex.com |
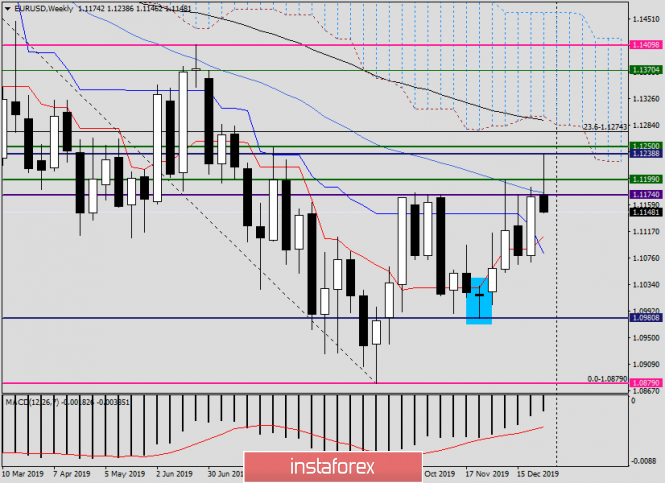
| Analysis and recommendations for EUR/USD as of January 3, 2020 Posted: 03 Jan 2020 03:32 AM PST FOMC protocols will put everything in its place. Hello, dear colleagues! After yesterday's review of EUR/USD, I was thinking of returning to the main currency pair on Monday, however, I think it is worth it to pay attention on what is happening at the moment, on the past and upcoming events. Yesterday's reports on initial applications for unemployment benefits in the United States were positive and exceeded the economists' expectations. It was predicted to be 225 thousand, but received 222 thousand instead. I believe that this factor did not go unnoticed by the market participants, and supported the US dollar. The US currency, however, has already started trading confidently in 2020, strengthening against the Euro. Today, we are waiting for a block of statistics on Germany, but the main event of the day and the whole week will be the publication of the FOMC report, scheduled for 20:00 (London time). I believe that this will put everything in its place, and the technical picture for EUR/USD will finally be clear. Weekly
In the meantime, you should pay attention to the candle, which at the moment of writing, is formed on the weekly chart. This is nothing but a reversal model of candlestick analysis "Tombstone". The model is very strong, especially when it is formed after an unsuccessful attempt to break the key resistance zone. In our case, the price area 1.1230-1.1250, as expected, showed a strong resistance and turned the quote down. I believe that the 50 simple moving average played the least role, which also prevented any further upwards movement of the pair. If trading ends at 1.1174 and below 50 MA, there will be less doubt on the course reversal. At the moment, it is difficult to imagine what should happen and what negative should be contained in the Fed's for the US dollar's situation to change dramatically. Right now, the pair is clearly dominated by bearish sentiment, and in my opinion, it is unlikely that the Eurobonds will find the strength to turn the market up and restore the losses suffered before, which were significant, as indicated by the huge upper shadow of the weekly candle. All would be nothing, and now, it is already possible to look for options regarding selling of EUR/USD, however, the report's publication is still ahead and much may still change. Daily
At the moment of writing, the pair is testing the Tenkan line of the Ichimoku indicator for a break down. Passing this line will open the way to the area of 1.1111-1.1088, where Kijun, 89 EMA and 50 MA have accumulated. In my opinion, this is technically a good area to consider buying, however, before that, it is better to enlist the support of a bullish candlestick model before opening long positions. At the same time, I am not excluding the possibility that after the publication of the report, there will be a sharp and rapid decline in the area of 1.1111-1.1080, which from there, the price will bounce up, giving today's daily candle a long lower shadow. With this, the candlestick signals on the weekly and daily charts may turn out to be in conflict. Let's wait and see. In any case, the signals on the higher timeframes are considered to be stronger, so the priority is on the Weekly timeframe. For trading ideas, in my opinion, there is a reversal for the EUR/USD pair, which began after an unsuccessful attempt to break through the resistance area of 1.1174-1.1190 and the zone of 1.1200-1.1250. This makes selling the priority position for EUR/USD. From a technical point of view, I assume that the price zone 1.1174-1.188 is quite good for opening short positions. Purchases, in my opinion, are more risky and will be designed exclusively for corrective and short-term upward movements. However, for more definite conclusions, it is beneficial to wait the closing of the current weekly candle. I don't think that it makes sense to open fresh positions before the close of trading, or even before the publication of the FOMC report. However, everyone has their own opinion. Good luck! The material has been provided by InstaForex Company - www.instaforex.com |
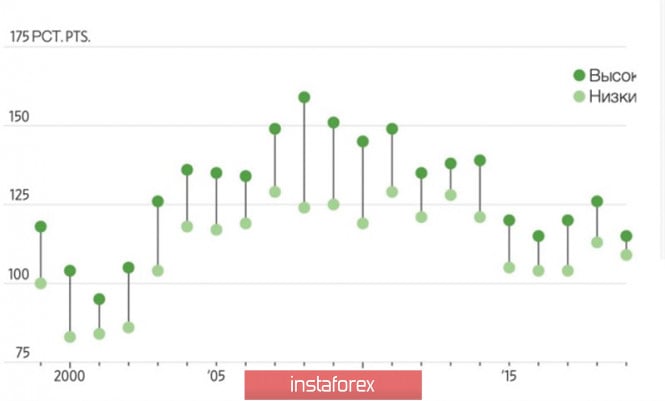
| Posted: 03 Jan 2020 03:15 AM PST The single European currency could not stay above the base of the 12th figure due to weak statistics on business activity in the eurozone and Donald Trump's statement on the signing of a trade agreement between the United States and China on January 15. The latter allowed the S&P 500 to renew historic highs. However, during the Asian Forex session, futures on the US stock index already fell amid growing geopolitical tensions in the Middle East. In 2020, investors will most likely get used to the frequent ups and downs of both the US stock market and the main currency pair. 2019 was a record year for the euro in terms of the narrowness of the trading range. The pair EUR / USD was trading between 1.09 and 1.15. That is, we are talking about 6 pp On average, since its birth in 1999, the annual trade corridor has been 18 percentage points. Dynamics of annual trading ranges in EUR / USD pair:
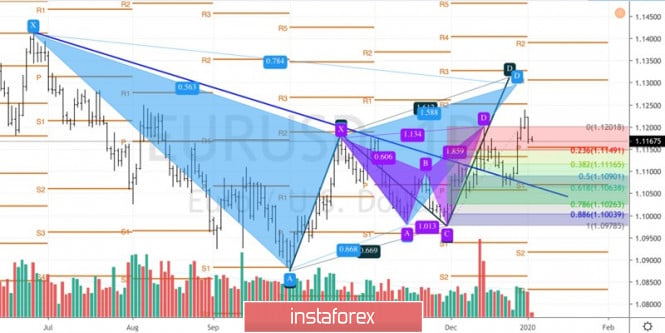
At first glance, factors such as the negative interest rates of the ECB, the weakness of the eurozone economy, the passivity of the Fed and the steady pace of US GDP make the prospects for EUR / USD grim. However, in 2019, the euro faced many difficulties, including Brexit, the Washington and Beijing trade war, Italian elections, lowering of the ECB rates, resuscitation of the European QE, and somehow still managed to survive. These problems will either disappear or become less painful in 2020, which allows the Wall Street Journal experts to predict the growth of the single European currency to $ 1.15 by the end of December. Specialists surveyed by Bloomberg, and even give out a figure of $ 1.16. An ambiguous opinion is present on the market regarding the status of the euro as a funding currency. On the one hand, the recovery of the Chinese, European and global economies as a whole is a positive factor for risky assets, which makes the potential of the EUR / USD rally limited. Another one is the corrections of the S&P 500 will lead to the closure of carrying positions by traders, and there is little doubt that the US stock market will face serious pullbacks in the new year. The slowdown in the US economy, presidential elections, geopolitical risks, and other "bearish" drivers will not allow the stock index to grow quietly. The central event for this week is on January 9, which will be the release of data on the labor market and business activity in the non-manufacturing sector of the United States, as well as the publication of the minutes of the last ECB meeting. There were rumors that last December, Christine Lagarde did not address the issue of the harm of negative interest rates due to a reluctance to allow the euro to strengthen at a press conference. In the minutes of the meeting, this moment will probably be reflected in what should be considered as a "bullish" factor for the EUR / USD pair. As for employment, Reuters experts expect to see its increase by 165 thousand by the end of the last month of 2019. It is a pretty decent figure, but if the actual data turns out to be worse, the main currency pair will resume its northern campaign. Technically, on the daily EUR / USD chart, the 5-0, AB = CD and Gartley patterns are realized. The last two targets are located near the 1.13 mark. A necessary condition for their implementation is to keep the "bulls" support at 1,115-1,1155 in their hands. EUR / USD daily chart:
|
| Posted: 03 Jan 2020 03:02 AM PST To open long positions on EURUSD, you need: According to the data on the German labor market, which was released in the first half of the day, there was an increase in the number of applications for benefits, as well as maintaining the level of lending to the eurozone unchanged, all these factors led to continued pressure on the European currency, which began the new year with a decline against the US dollar. Buyers failed to do anything at the level of 1.1145, the breakdown of which opened the possibility of updating the support of 1.1119, where I recommend opening long positions in the euro immediately on the rebound. An equally important task for the bulls will be to return to the area of 1.1145, above which we can expect a correction to the resistance area of 1.1174, from where the main sale of the euro took place today, and where I recommend fixing the profits. You can also count on the protocols of the Federal Reserve System, the publication of which can also lead to the restoration of EUR/USD. To open short positions on EURUSD, you need: The bears coped with the primary task of the morning, which I paid attention to in my review, and broke below the support of 1.1145. As long as trading is conducted under this range, the pressure on the euro will remain, and an unsuccessful consolidation at this level with the formation of a false breakout will be an additional signal to open short positions. This can be helped by weak inflation data in Germany, as well as a report on the US manufacturing ISM index. The immediate goal of sellers is the support of 1.1119, the breakout of which will collapse EUR/USD to a minimum of 1.1095, where I recommend fixing the profit. In the scenario of the bulls returning to the level of 1.1145, short positions can be returned immediately on the rebound from the morning high of 1.1174. Indicator signals: Moving Averages Trading is below the 30 and 50 moving averages, which indicates that the pressure on the euro continues. Bollinger Bands The bears have already reached the lower limit of the indicator and broke it. In the case of a correction, the average border of the indicator around 1.1175 will act as an intermediate level of resistance.
Description of indicators
|
| Posted: 03 Jan 2020 02:27 AM PST The fundamental background in the currency exchange market has changed dramatically literally in a day: anti-risk sentiment has prevailed again, increasing interest in protective instruments. The yen is already testing the 107th figure, and gold has updated a 3-month high, showing impulse growth. At the same time, the American currency was also among the beneficiaries of this situation: the dollar index is growing, as the dollar is traditionally in demand during periods of geopolitical tensions. It should be noted right away that anti-risk sentiments are growing not only due to the assassination of the Iranian military leader by the US military - the latest news from the DPRK and Turkey also made their respective contributions. Due to this, recent events have been overshadowed by many fundamental factors that traders of the EUR/USD pair have focused on. Moreover, optimism regarding the prospects for US-Chinese relations gave way to anxiety about a possible retaliatory action by Iran. Indeed, in the opinion of the overwhelming number of political experts, the Iranians will take retaliatory steps in any case - the only question is how large and deadly they will be. Such a nervous situation puts pressure on EUR/USD, primarily due to the growth of the American currency throughout the market. Let me remind you that the international airport in Baghdad was bombed last night, as a result of which the Iranian general Qassem Soleimani, who led the special unit of the Islamic Revolutionary Guard Corps, was killed. A few hours after the air raid, a Pentagon message appeared according to which a senior Iranian military commander was liquidated on the personal instructions of US President Donald Trump. In addition to General Soleimani, another 8 people died, including the deputy head of the pro-Iranian armed group Al-Hashd al-Shaabi, Abu Mahdi al-Muhandis. According to the American authorities, General Soleimani was engaged in "developing plans for an attack on US diplomats and members of the diplomatic service in Iraq and throughout the region." Moreover, The Pentagon accused Soleimani of approving the assault on the US embassy in Baghdad by supporters of the Kata'ib Hezbollah militia. This attack was committed on the last day of 2019. As many analysts note, the death of such a high-ranking Iranian military official could be a turning point in the relations between Washington and Tehran. Iran's supreme leader, Ayatollah Ali Khamenei, has already promised "severe revenge" to those who killed the commander of the Iranian elite unit. Iranian Foreign Minister Javad Zarif, in turn, called the killing of Soleimani an act of international terrorism. After these threats, US authorities ordered the Armed Forces to be fully operational. On the other hand, there is no consensus among experts about possible actions on the part of Tehran, and indeed - what will lead to another aggravation of the US rivalry with Iran. Many analysts believe that Iranians are attacking American targets in Iraq. The US command has already deployed additional forces to protect the US Embassy in the country, including a hundred marines and combat helicopters. Infrastructure or military facilities (or representatives) of US allies in the region may also be affected - first of all, we are talking about Saudi Arabia and Israel. In the context of the currency market, the very fact of growing geopolitical tensions is important and not only military in nature. Let me remind you that in 2013, Iran threatened to block the Strait of Hormuz (though it did not fulfill its intentions at that time) - and now, there is a probability that Tehran will resume such threats. Meanwhile, oil has already updated its multi-month highs (in particular, Brent is approaching the $ 70 mark), exerting a corresponding effect on commodity currencies. If "black gold" holds out at these price heights, the European currency will receive its "reward" (though in time), as the growth of the oil market will positively affect inflation in the eurozone. But all this will be later: at the moment, the market is focused on possible retaliatory actions by Iran with regard to the States or their allies. As I said above, the assassination of an Iranian general is not the only cause for concern for traders. North Korea made itself known again, and, as they say, "not on the best side" - on December 31, DPRK leader Kim Jong-un announced plans to no longer extend the moratorium on nuclear weapons tests. Earlier, the chief of the General Staff of the Korean People's Army, Park Jong-chon, declared the risk of the development of relations between the DPRK and the United States into a "full-scale armed conflict." The Pentagon, in turn, announced the readiness of the American side to respond to possible aggression from North Korea. The fundamental picture of the day was supplemented by news from Turkey. Yesterday, the parliament of this country approved the sending of troops to Libya. The adopted document states that this conflict will affect Turkey's interests in the Mediterranean basin and in northern Africa if the Libyan government cannot stop the advance of the rebels and the clashes turn into a mass civil war. In other words, Ankara decided to intervene in the internal Libyan conflict, which has been in an active phase for almost a year. One side of the conflict is the internationally recognized government of national unity, which controls Tripoli, the other side is the "Tobruk government", whose armed forces are commanded by the leader of Libyan militias Khalifa Haftar. Thus, the strengthening of geopolitical tensions will continue to exert pressure on the pair EUR/USD, due to the strengthening of the dollar. The pair overcame the support level of 1.1150 (Tenkan-sen line on the daily chart) and will probably overcome the second support level of 1.1110 (Kijun-sen line on the same time-frame). Most likely, the price will stop its decline in the area of 1.1060 - this is the upper border of the Kumo cloud on D1. The material has been provided by InstaForex Company - www.instaforex.com |
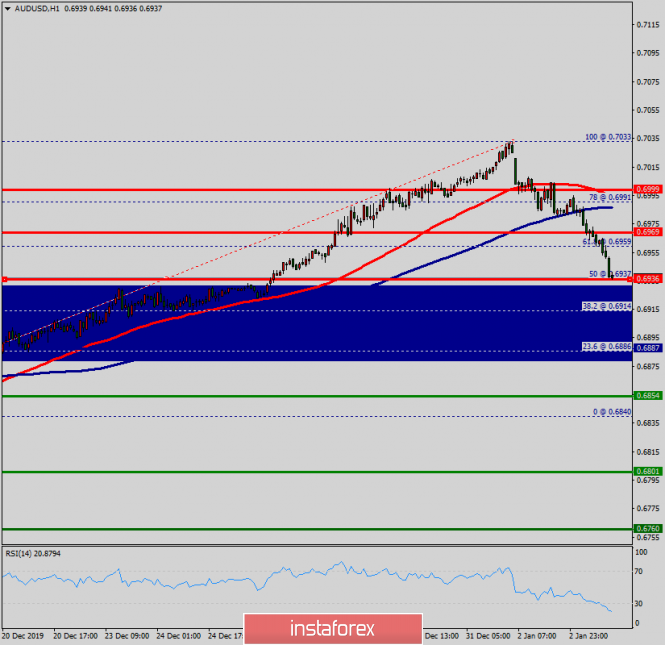
| Technical analysis of AUD/USD for January 03, 2019 Posted: 03 Jan 2020 02:23 AM PST Overview: Pivot: 0.6887. The AUD/USD pair is continuing trading upwards from the level of 0.6887. Last time, the pair rose from the level of 0.6887 to the top around 0.6936. Subsequently, it should be noted that the level of 0.6887 coincides with the ratio of 23.6% Fibonacci retracement levels. The AUD/USD pair broke resistance at the level of 0.6887 which turned into strong support at the golden ratio. In the H1 time frame, the level of 0.6887 is expected to act as major support today. Currently, the price is moving in a bullish channel. This is confirmed by the RSI indicator signaling that we are still in a bullish market. To summarise, the price is still above the moving average (100) and (50). From this point, we expect the AUD/USD pair will be continuing to move in the bullish trend from the support level of 0.6887 towards the target level of 0.6940. The double top is set at the point of 0.6940 at the same time frame. If the pair succeeds in passing through the level of 0.6940, the market will indicate the bullish opportunity above the level of 0.6940 so as to reach the second target at 0.6969. On the contrary, in case a reversal takes place and the AUD/USD pair breaks through the support level of 0.6887, a further decline to 0.6801 can occur in order to indicate a bearish market. Overall, we still prefer the bullish scenario, which suggests that the pair will stay above the zone of 0.6887. The material has been provided by InstaForex Company - www.instaforex.com |
| Overview of EUR/USD for January 3. Business activity in manufacturing in the EU pushed the pair down Posted: 03 Jan 2020 01:25 AM PST 4-hour timeframe
Technical data: The upper channel of linear regression: direction - up. The lower channel of linear regression: direction - up. The moving average (20; smoothed) - sideways. CCI: -16.9567 The first trading day of the week ended for the EUR/USD pair exactly as we expected. The euro moved lower and worked out the moving average line by the end of the day. Even today, the pair's quotes can overcome the moving, which will mean a change in the trend for the pair to a downward one. Thus, today or at the beginning of the next week, it will be possible to state the resumption of the downward trend. We have already said that, from our point of view, it is time for the euro currency to "pay off its debts". The euro rose too much at the end of last year. Too strong and too unreasonable. The general fundamental background remains not in favor of the euro currency, which, by the way, was confirmed by yesterday's macroeconomic publications of business activity indices in the spheres of production in the EU countries. Let's look at them in more detail. Let's start with the fact that the overall indicator of business activity in the EU production sector exceeded the forecast values and amounted to 46.3. However, any value below 50.0 is considered negative and does not support the currency in which the indicator is published. Thus, we can only state a slight improvement in the weak indicator of business activity. The situation is even worse in Germany, where business activity also increased slightly to 43.7. Such a meaning can be characterized by the phrase "below the plinth". Although formally, there is also some improvement in the situation. In Italy, business activity in the production sector fell to 46.2 in December. Thus, we can draw an almost unambiguous conclusion: macroeconomic statistics from the EU on Thursday could not support the euro currency. As for American business activity in the manufacturing sector according to Markit, there was a slight decrease from 52.5 to 52.4. However, the key point is the very value of the indicator 52.4 - above 50.0 - the industry is growing. Such a small decrease in the indicator compared to the previous month, by only 0.1, cannot be regarded as a deterioration at all, since no indicator can constantly show growth. So it turns out that, in general, we have a stable state of business activity in the States and weak - in the EU. Thus, industrial production in the European Union may also disappoint, and other indicators of the state of the European economy. On Friday, January 3, it is planned to publish the index of business activity in the US manufacturing sector according to the ISM version, which is considered more important and significant and which is under the key mark of 50.0. According to experts, the indicator can grow to 49.0, which will be a big step towards a return to the area "above 50.0". Thus, a higher value than 49.0 may support the US currency. Also, today, the consumer price index in Germany will be published, a preliminary value for December, which, according to experts, may accelerate to 1.4% y/y. If this happens, it will be a positive moment for the euro, but only in the context of the future publication of inflation in the European Union. And at the end of the review, we will pay attention to the technical picture. Already at the current bar, the euro-dollar pair may consolidate below the moving average line, which will indicate the readiness of traders to continue the downward movement in the medium term. Both linear regression channels are directed upwards but may start to reverse downwards if the pair spends 5-6 days below the moving average. As we have said many times, we believe that the most likely scenario is a new long-term downward movement.
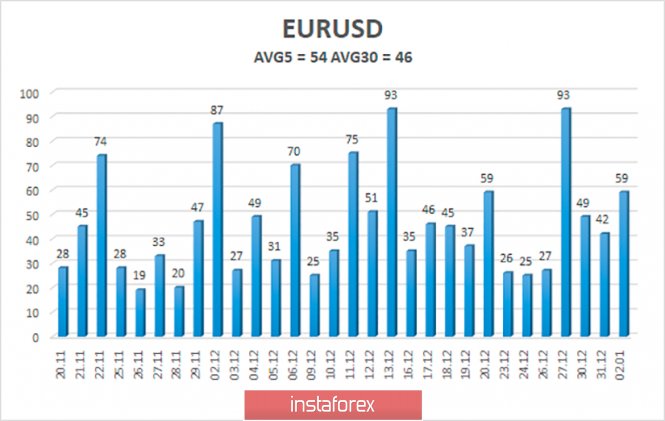
The average volatility of the euro-dollar currency pair is now 54 points, which is the average value for the euro currency. Thus, we have volatility levels on January 3 - 1.1118 and 1.1226. Thus, today we again expect to work out the lower limit of the volatility channel. Nearest support levels: S1 - 1.1139 S2 - 1.1108 S3 - 1.1078 Nearest resistance levels: R1 - 1.1169 R2 - 1.1200 R3 - 1.1230 Trading recommendations: The euro-dollar pair continues its downward movement. Thus, it is recommended to wait until the price is fixed below the moving average, and then start trading on the downside with the targets of 1.1139 and 1.1118. The general fundamental background remains not on the side of the euro currency, so the pair's fall is more preferable. It is recommended to return to buying the euro-dollar pair only if the price rebounds from the moving average line. In addition to the technical picture, you should also take into account the fundamental data and the time of their release. Explanation of the illustrations: The upper channel of linear regression - the blue lines of the unidirectional movement. The lower channel of linear regression - the purple lines of the unidirectional movement. CCI - the blue line in the indicator window. The moving average (20; smoothed) - the blue line on the price chart. Murray levels - multi-colored horizontal stripes. Heiken Ashi - an indicator that colors bars in blue or purple. Possible variants of the price movement: Red and green arrows. The material has been provided by InstaForex Company - www.instaforex.com |
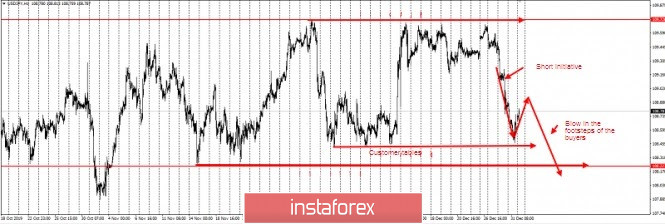
| Posted: 03 Jan 2020 01:25 AM PST Congratulations to those who took advantage of yesterday's idea to sell USDJPY. Let me remind you that the idea was to work out the short initiative for the breakdown of the area of 108.4-108.2 Plan: Adjustment: The passage was a little more than 500 p and worked on the same day. Good luck with trading and control risks! The material has been provided by InstaForex Company - www.instaforex.com |
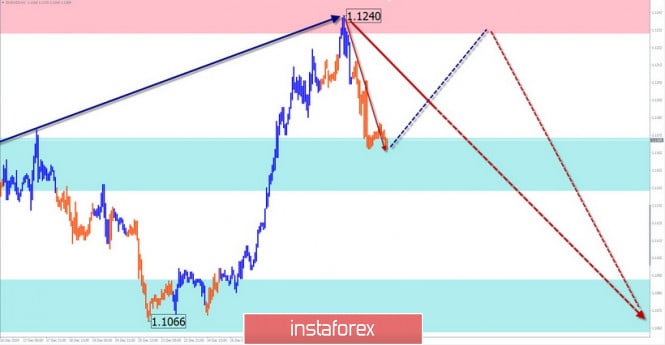
| Simplified wave analysis of EUR/ USD, AUD/USD, and GBP/JPY on January 3 Posted: 03 Jan 2020 01:25 AM PST EUR/USD Analysis: The upward wave from September 3 to the present time demonstrates the completeness of its structure. The price has reached the lower limit of the wide potential reversal zone. In the last 3 days, the price moves down, forming a correction of the last part (C). The price is in the support area. Forecast: Due to the high wave level, the downward movement can be continued, turning into a full-fledged correction of the entire main wave. Today, the price is expected to move sideways. In the first half of the day, an upward vector is more likely. If the volatility decreases, the pair may increase. Potential reversal zones Resistance: - 1.1230/1.1260 Support: - 1.1170/1.1140 - 1.1090/1.1060 Recommendations: Purchases of the euro are possible today as part of session trading with a reduced lot. Sales of the instrument will become more promising.
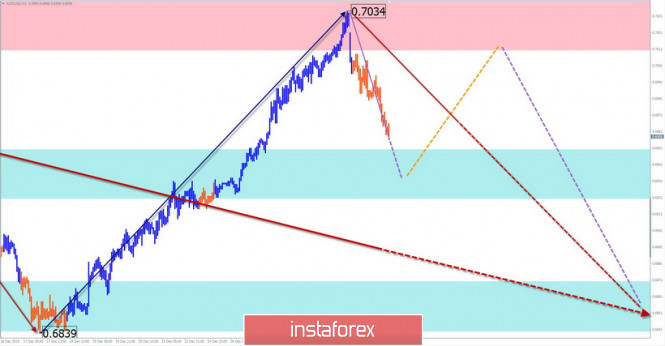
AUD/USD Analysis: The dominant wave on the chart of the "Australian" has a downward course but is formed in the form of an incorrect design. On the chart, it looks like an upward pennant. Its structure still lacks the final part. The price has reached an intermediate resistance level. Forecast: A reversal on the final decline can occur at any time. The trend change will likely occur from the current resistance. In the first half of the day, a rollback of the course is possible today. A lateral flat is likely, but a short-term rise to the resistance area is not excluded. A return to decline can be expected by the end of the day. Potential reversal zones Resistance: - 0.7010/0.7040 Support: - 0.6950/0.6920 - 0.6870/0.6840 Recommendations: Buying a pair in the coming sessions can be risky. It is recommended that the main attention be paid to the search for instrument selling signals.
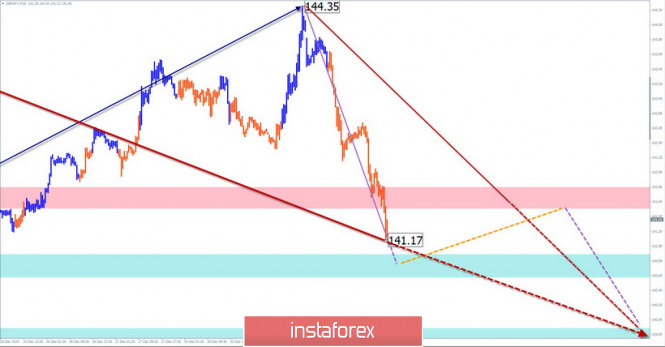
GBP/JPY Analysis: As part of the main wave, a bearish wave has been forming since December 13. Previously, it will take the place of correction of the entire wave. There was a clear zigzag in the structure of the movement. The decline that began on December 31 may give rise to the final part (C). Forecast: The downward trend of the cross movement is expected to continue in the coming sessions. The nature of the movement is likely to be impulsive. A short-term pullback is possible from the nearest support. Most likely, there will be a "sideways", but the option of a rebound to the resistance zone cannot be excluded. Potential reversal zones Resistance: - 141.60/141.90 Support: - 141.00/140.70 - 140.00/139.70 Recommendations: The purchase of the pair today is unpromising. At the ends of all counter price movements, it is recommended to track the reversal signals to find the pair's selling points.
Explanations: In the simplified wave analysis (UVA), waves consist of 3 parts (A-B-C). The last incomplete wave is analyzed. The solid background of the arrows shows the formed structure, the dotted background shows the expected movements. Attention: The wave algorithm does not take into account the duration of the tool movements in time! The material has been provided by InstaForex Company - www.instaforex.com |
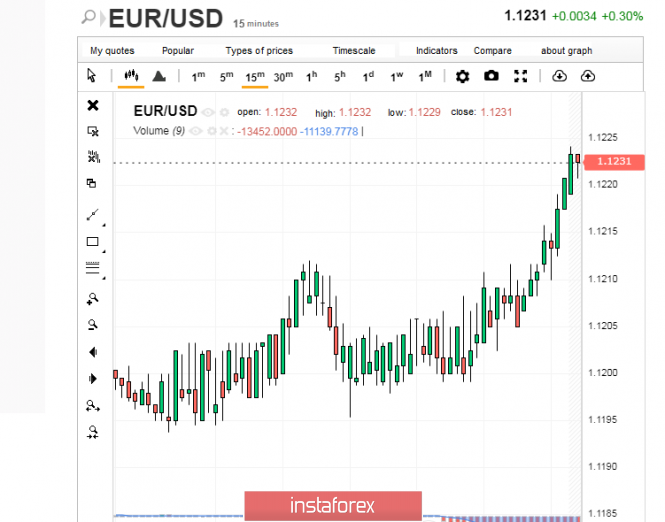
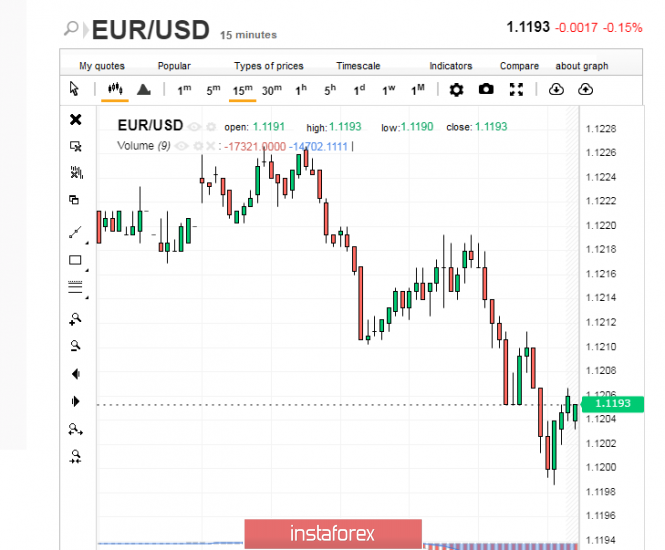
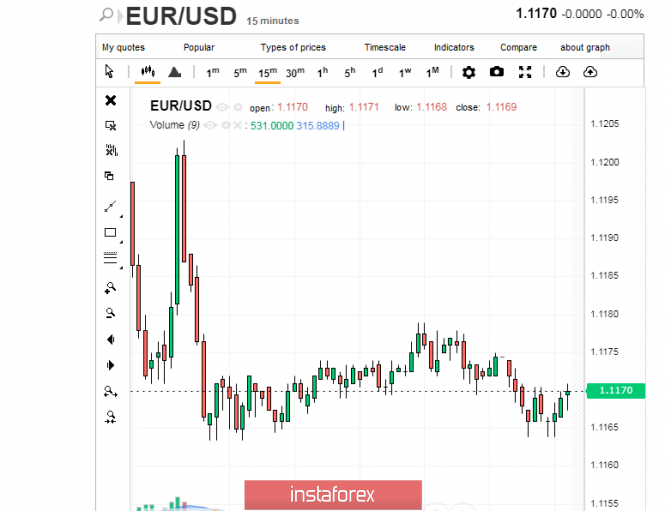
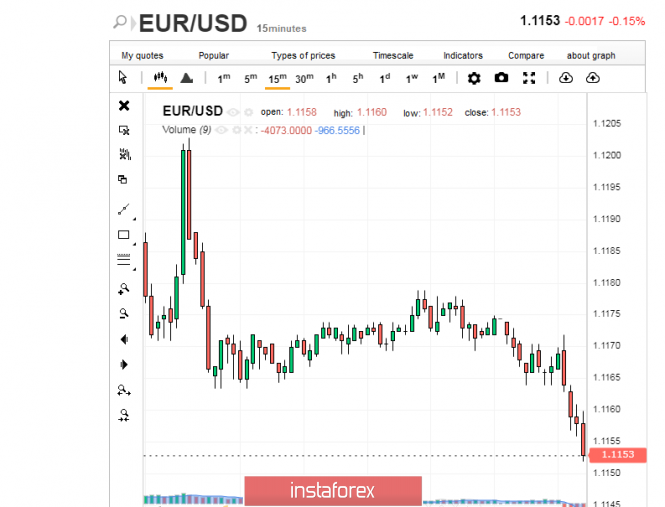
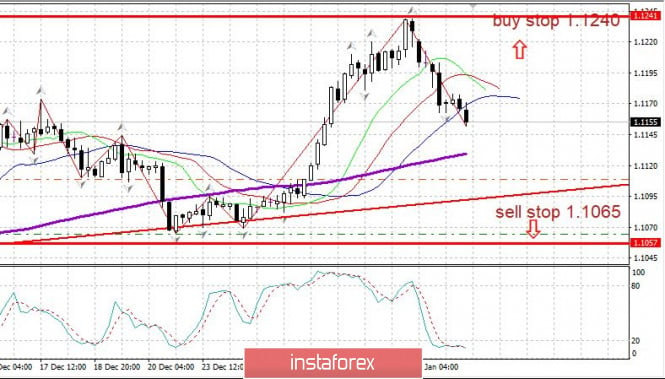
| Is euro always in the background? Posted: 03 Jan 2020 01:18 AM PST Many analysts agree that the position of the European currency paired with the American will always remain secondary. Last year, the "European" currency made several attempts to get around the dollar, but this was rarely possible. The dollar regained its position again, and the euro had to be contented with the second line in the rating of world currencies. Moreover, the EUR / USD pair added 200 points shortly before the New Year, reaching 1.1231. In the future, a sharp jump gave way to a price pullback, which is not surprising for the pre-holiday market. At the same time, significant support for the European currency was provided by strong data on business activity in the eurozone manufacturing sector for December 2019. The pan-European index reached 46.3 points, which slightly exceeds the figure for November 2019. However, the current values of business activity in the eurozone are not so high as to help the euro strengthen. In this regard, one should not expect the rise of the "European", experts summarize. At the beginning of the new year, the American currency turned out to be vulnerable to negative factors despite a slight subsidence of the competitor in the pair. The dollar index fell slightly, demonstrating weak demand for dollars. Therefore, some support for the dollar was provided by a statement by US President Donald Trump on the signing of the first phase of the trade agreement on January 15, 2020. However, in general, traders did not show interest in the "American" currency. On Friday, January 3, the publication of the minutes of the last Fed meeting is expected. According to experts, this can put additional pressure on the dollar due to the fact that the previous December meeting of the Federal Reserve left a negative impression. Earlier, the regulator announced a significant decrease in consumption growth and a noticeable decline in investment. They still remain weak, the agency stressed. At the same time, the Fed took an indefinitely long pause in the process of easing monetary policy, which greatly disappointed the dollar bulls. The Federal Reserve is also concerned about the weak dynamics of inflationary growth. Thus, analysts are sure that the current situation may negatively affect the dynamics of the EUR / USD pair. At the moment, experts consider the price ceiling for the pair – 1.1240, which is the level of resistance. The EUR / USD pair does not reach it in any way, demonstrating a clear downward trend. On Thursday, January 2, the pair was trading within 1.1192 – 1.1193, trying to rise higher. But unfortunately, attempts to raise the EUR / USD pair were unsuccessful. On the morning of Friday, January 3, the pair held at 1.1170, but then lost ground. The rollback was growing, and the EUR / USD pair went down. Currently, the pair runs near 1.1152-1.1153, trying to rise higher from time to time. Sometimes these efforts are not in vain, but in general, the EUR / USD pair rarely succeeds. However, both the euro and the dollar do not stop trying to enter an upward trend. Summing up the past year, experts note that the European currency was able to become a full-fledged competitor to the "American" one. Experts explain this by several reasons, including the existence of different economies in the eurozone, both strong and weaker, as well as the presence of negative interest rates, and because of which, investors prefer to invest in the dollar. In 2019, the "European" currency has fallen in price in relation to the dollar by 3%, and in 2020, the single currency may collapse by another 5%, analysts say. Nevertheless, experts give the euro a chance for further "carte blanche" paired with the "American". According to analysts, the merit of the European currency for its entire existence, which is 21 years, is to undermine the unconditional dominance of the dollar. According to SWIFT calculations, the share of the euro in global trade is 35% and the dollar is 40%. This gap is quite small, experts emphasize. They believe that the European currency took place as a global phenomenon. However, it remains on the sidelines in relation to the American currency. The material has been provided by InstaForex Company - www.instaforex.com |
| Trading plan on EUR/USD for January 3, 2020 Posted: 03 Jan 2020 12:50 AM PST
According to media reports, a prominent Iranian General was killed in Baghdad by US forces during an operation. According to unofficial information, this operation was authorized by Trump - the United States strongly opposes Iran's actions in Iraq and Syria. Trump did not voice any messages, but tweeted the US flag after the operation. Meanwhile, Iran's top leader has promised retaliation. Consequently, markets reacted nervously. Oil increased by 4% to $70 while gold rose to $1,543. Euro, on the contrary, continued to decline. Futures in the S&P500 fell after a new historic high on January 2. EUR/USD: Despite the second day of decline, euro is still within the correction. You can buy from 1.1145 and below. Cancellation of the growth trend is below 1.1100. Sell from 1.1065. The material has been provided by InstaForex Company - www.instaforex.com |
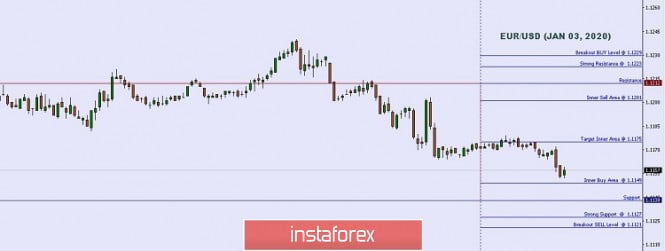
| Technical analysis: Important intraday levels for EUR/USD, January 03, 2020 Posted: 03 Jan 2020 12:29 AM PST
|
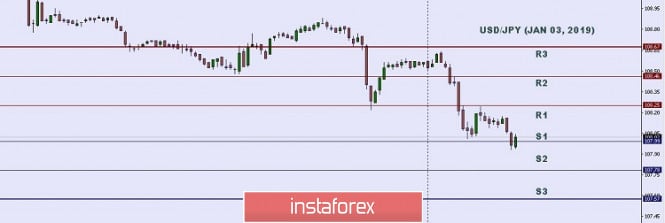
| Technical analysis: Important intraday levels for USD/JPY, January 03, 2020 Posted: 03 Jan 2020 12:27 AM PST
|
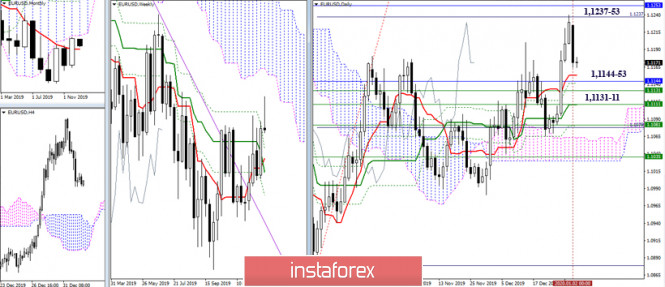
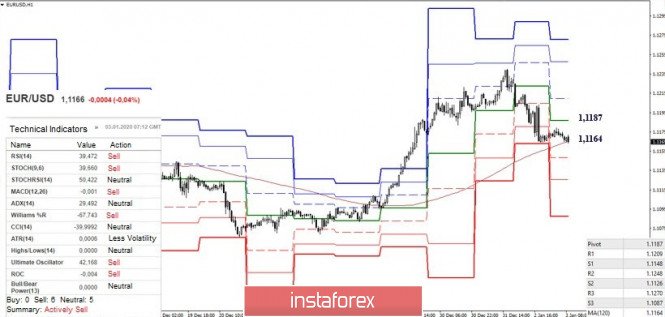
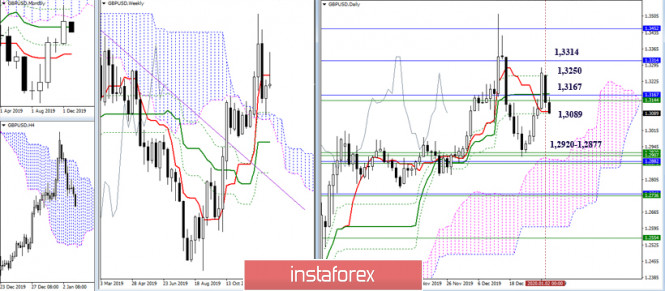
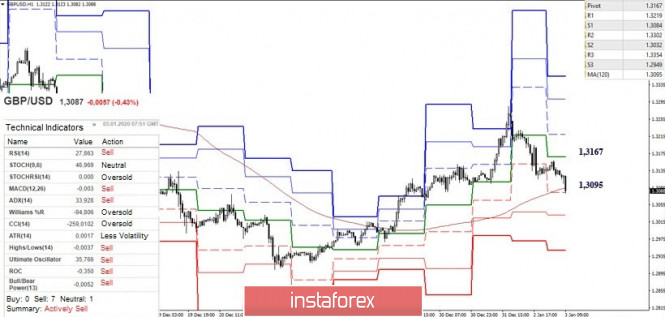
| Technical analysis recommendations for EUR/USD and GBP/USD on January 3 Posted: 03 Jan 2020 12:18 AM PST EUR / USD The players took a break for an increase, which was immediately actively used by the opponent after the optimism which we managed to consolidate in the results of the story. Thus far, a downward correction has brought the pair closer to the supports, forming a fairly wide area. The first one on the direction is the daily short-term trend (1.1153), then the levels of different halves are located at 1.1144 - 1.1131 - 1.1111. Now, it is important for promotion players to find support in the designated support area to maintain their capabilities and advantages. The consolidation below will require clarification of the situation, as it may change current plans and priorities. In the lower halves, the pair has so far performed a correction to support the weekly long-term trend (1.1164). Today, the following intraday support can be noted at 1.1148 (S1) - 1.1126 (S2) - 1.1087 (S3). At the same time, the nearest resistance, which may affect the current balance of power, is now located at 1.1187 (central pivot-level of the day). GBP / USD The rebound from which the resistance met 1.3250 - 1.3167 - 1.3089 (daily cross + monthly medium-term trend + weekly short-term trend), which are still attracting and restraining the decline, will lead to the continuation of the decline and new testing of the strengthened support zone in the area 1.2920 - 1.2877 (weekly cloud + monthly Fibo Kijun + upper border of the daily cloud). On the other hand, a correctional decline in the lower halves led the players to lower to the union of supports for the weekly long-term trend (1.3095) and S1 of the classic Pivot levels (1.3084), as a result, braking is possible in the near future. Overcoming levels will open the way to 1.3032 (S2) - 1.2949 (S3). Now, resistance and benchmark. Consolidation above which will confirm the rebound from the support they met and will allow us to consider further plans to restore the positions of players to increase to the level of 1.3167 (central Pivot-level of the day) today. Ichimoku Kinko Hyo (9.26.52), Pivot Points (classic), Moving Average (120) The material has been provided by InstaForex Company - www.instaforex.com |
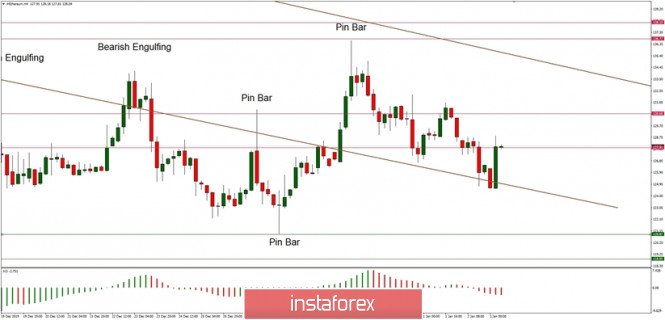
| Technical analysis of ETH/USD for 03/01/2020: Posted: 02 Jan 2020 11:47 PM PST Crypto Industry News: Mark Hipperson, former head of technology at the Barclays Group, as well as co-founder and former technical director at US Starling Bank, plans to launch his latest digital banking venture, Ziglu, in the first quarter of 2020. The fully digital account, which is the next step in the bank's concept, will allow you to store multiple currencies, both fiat and digital, in the same account. A free account will not only be able to keep balances in many currencies, but also freely exchange funds between them. Foreign currencies will be available to buy and sell at interbank rates, and cryptocurrency purchases and sales will be available at the best price among many exchanges. What's more, according to the Ziglu website, any currency stored on your account can be spent anywhere in the world using a Mastercard debit card. This includes cryptocurrencies that will be immediately converted at the point of sale. Hipperson has been the CEO of Ziglu since September 2018, and the company has submitted an application to the UK Financial Supervisory Authority (FCA) to become an issuer of electronic money. Pre-release applications are currently being downloaded, but only from UK residents, although there are plans to expand in the future. Ziglu is certainly not the first company to offer a combined fiat/crypto account. In August of last year, the battle launched an account with an attached Bitcoin wallet and has since also added Ethereum functionality. Technical Market Overview: The ETH/USD pair has dropped from the local high at the level of $136.64 to the lower channel line located around the level of $125.00 ( the actual low has been made at the level of $124.48). The bulls have temporary control as they have managed to make a Bullish Engulfing pattern at the lower channel line support and the market is currently trading around the level of $128.00. It is worth to keep an eye on the current developments of the Ethereum market, despite the fact, that the market is still trading aimlessly inside of a range. An important breakout higher or lower can happen anytime now. Weekly Pivot Points: WR3 - $156.40 WR2 - $145.89 WR1 - $141.32 Weekly Pivot Point - $130.81 WS1 - $125.47 WS2 - $114.97 WS3 - $109.88 Trading Recommendations: The best strategy in the current market conditions is to trade with the larger timeframe trend, which is down. All the shorter timeframe moves are still being treated as a counter-trend correction inside of the downtrend. When the wave 2 corrective cycles are completed, the market might will ready for another wave up.
|
| You are subscribed to email updates from Forex analysis review. To stop receiving these emails, you may unsubscribe now. | Email delivery powered by Google |
| Google, 1600 Amphitheatre Parkway, Mountain View, CA 94043, United States | |










No comments:
Post a Comment