
Forex analysis review |
- Forecast for EUR/USD on January 31, 2020
- Forecast for GBP/USD on January 31, 2020
- Forecast for AUD/USD on January 31, 2020
- Fractal analysis of the main currency pairs for January 31
- EUR/USD. January 30. We are waiting for the rollback of Euro currency and the formation of new sell signals in the area of
- GBP/USD. January 30. Pound is trapped in the "triangle". We are waiting for quotes to come out of it and open new deals!
- GBP/USD review as of January 30, 2020
- GBP/USD: Bank of England patience, 0-2-7 alignment and Bernie Sanders' shadow
- GBP/USD. January 30. Results of the day. The Bank of England left the rate unchanged, which provoked a wave of purchases
- EUR/USD. January 30. Results of the day. Fed reassured markets, but US macroeconomic data continued to weaken
- Dollar keeps Fed rate cut in mind and prepares for the election
- GBPUSD and EURUSD: Pound buyers walked on "very thin ice." Will pound growth be limited in the near future? Bank of England
- January 30, 2020 : EUR/USD Intraday technical analysis and trade recommendations.
- January 30, 2020 : GBP/USD Intraday technical analysis and trade recommendations.
- Evening review for EURUSD on 01/30/2020. The pound is growing and the euro is determined by the direction
- Analysis of EUR/USD and GBP/USD on January 30. Market expectations for the Bank of England's rate were not met!
- GBP/USD: plan for the US session on January 30. The pound soared after the Bank of England left rates unchanged
- BTC analysis for 01.30.2020 - Median Pitchfork line at the prrice of $9.350 is main pivot to watch
- EUR/USD: plan for the US session on January 30. Buyers of the euro are waiting for the US GDP report and the breakthrough
- Trading recommendations for EURUSD on January 30
- EUR/USD for January 30,2020 - Sell zone on the EUR and test of the major resitance cluster at 1.1030-1.1036
- Trading plan for USDJPY for January 30, 2020
- Gold 01.30.2020 - Resistance at the price of $1.582 on the test, watch for potential rotation to the downside, major pivot
- Trading plan for AUD/USD for January 30, 2020
- Trading plan for GBP/USD for January 30, 2020
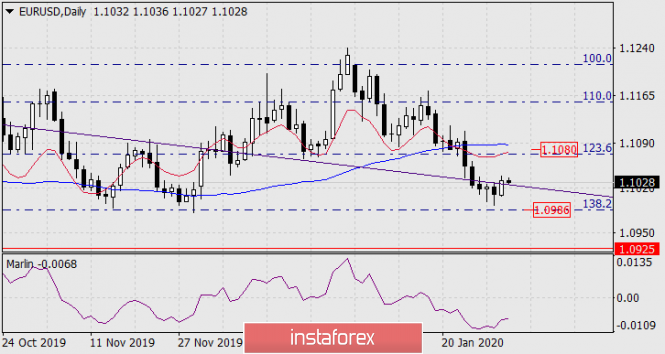
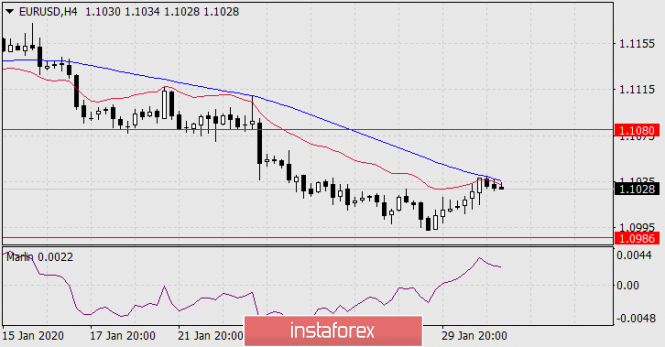
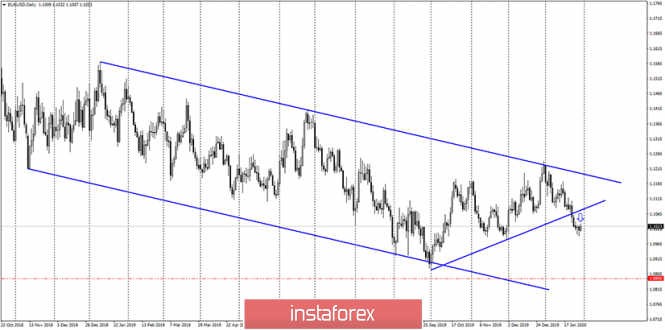
| Forecast for EUR/USD on January 31, 2020 Posted: 30 Jan 2020 08:07 PM PST EUR/USD The euro grew by 21 points on Thursday, overcoming the resistance of the embedded line of the price channel on the daily chart. The reason for this was the data on GDP growth for the fourth quarter by the expected 2.1% along with a fall in personal consumption spending; real consumer spending fell from 3.2% to 1.8% for the fourth quarter, although in the structure of GDP, sales increased from 2.1% to 3.2%, indicating an increase in inflation and a weak GDP base. As a result, the market probability of a rate cut at the June meeting increased in one day from 36.5% to 41.2%, while a week earlier this expectation was 19.5%. Yields on 5-year US government bonds rose from 1.388% to 1.414% this morning - American securities began to sell - since the yield is inversely dependent on purchases. Today, eurozone GDP data for the fourth quarter will be released - a forecast of 0.2%, and inflation for January - a forecast for the core CPI of 1.2% y/y against 1.3% y/y earlier. The general CPI index can grow from 1.3% y/y to 1.4% y/y. US data on personal spending and consumer income for December and inflation data on personal consumption spending (PCE) will be released in the evening, which is important for comparing with yesterday's data on consumer spending. The forecasts are good: 0.3% for revenue, 0.3% for expenses, no forecast for PCE. The index of business activity in the manufacturing sector of the Chicago region for the current month is expected to remain unchanged at 48.9 points. An important index of business activity in the US manufacturing sector (ISM Manufacturing PMI) for January will be released on Monday, the forecast for which is 48.0 versus 47.2 earlier; industrial orders for December on Tuesday, with a forecast at 0.7% against -0.7 % in November. On Wednesday, the PMI in the services sector is projected to grow from 52.8 to 53.2. On Friday, Non-Farm Employment Change for January is projected at 156 thousand against 145 thousand in December. All this indicates to us that investors will not rush to sell the dollar. On the four-hour chart, the growth of the euro stopped at the MACD line at the point of coincidence with the line of balance. It is very possible that from current levels the price will return to yesterday's low, which will restore the falling movement of the euro with targets at 1.0986, 1.0925. A rise in price to 1.1080 is possible in the case of today's obviously weak US data. But the price in this case must first be consolidated above the top of yesterday. The material has been provided by InstaForex Company - www.instaforex.com |
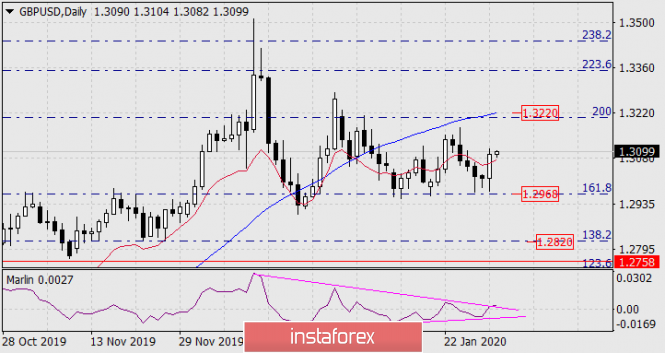
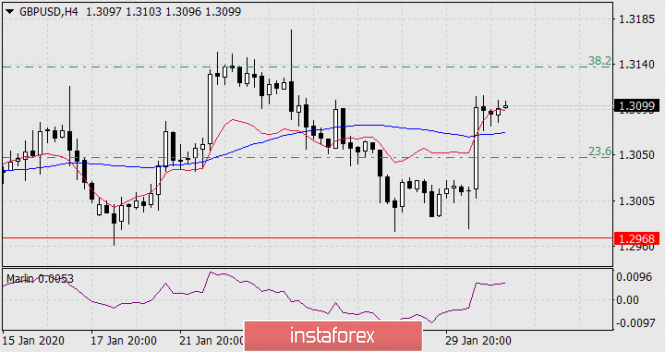
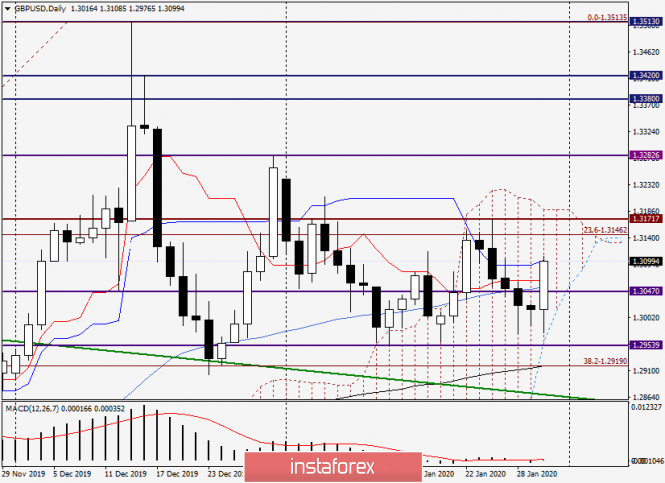
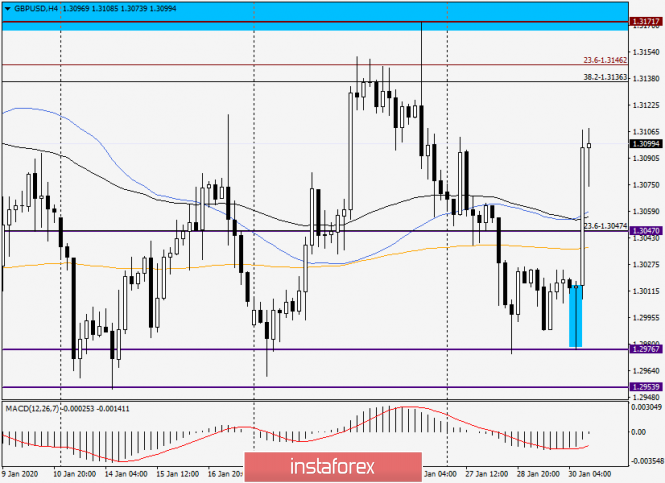
| Forecast for GBP/USD on January 31, 2020 Posted: 30 Jan 2020 08:05 PM PST GBP/USD Yesterday's meeting of the Bank of England brought a pleasant surprise for the pound - 7 members of the monetary policy committee spoke out for maintaining the rate against the expectation of 6 or even 5 members. The pound grew by 75 points due to this. On the daily chart, the signal line of the Marlin oscillator entered the growth zone and goes above the upper boundary of its own wedge. Price above the balance line. The growth target of 1.3220 is the area of accumulation of the Fibonacci level of 200.0% with the indicator line of MACD. On a four-hour chart, the price is higher than both indicator lines - balance sheet and MACD, Marlin in the trend growth zone. We look forward to continued growth. |
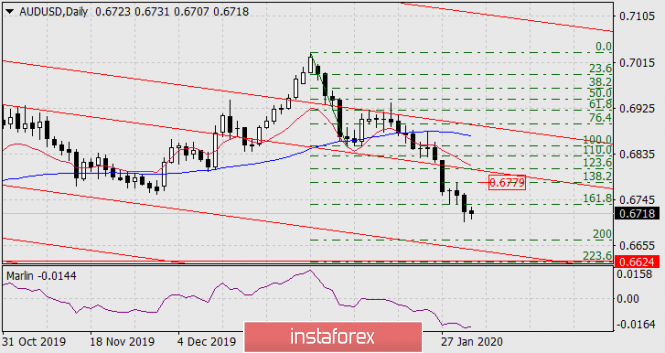
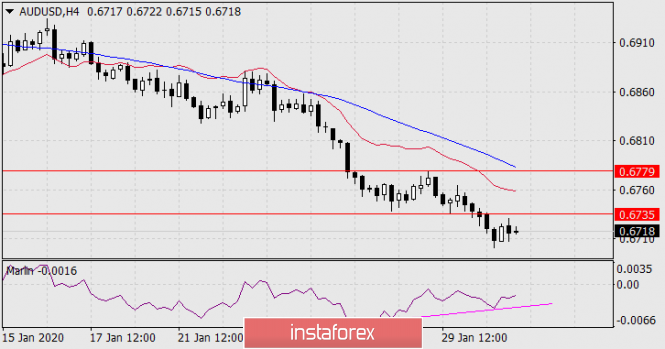
| Forecast for AUD/USD on January 31, 2020 Posted: 30 Jan 2020 08:02 PM PST AUD/USD The Australian dollar has been falling for two weeks without a noticeable correction. Yesterday, a convergence on the Marlin oscillator formed on a four-hour chart. Such a correction will probably take place today and on Monday. A signal to increase to the target level of 0.6779 - the peak of January 29 and the resistance of the MACD line, will be the price exit above the level of 0.6735 - support on January 28 and 29 and the Fibonacci level of 161.8% on the daily chart. At daily target level 0.6779, the Fibonacci level is 138.2%. Consolidating the price below yesterday's low will continue the downward movement to the support of the price channel line at daily (0.6642) or even slightly lower, to the Fibonacci level of 223.6% (0.6624), where we are already waiting for a more likely correction. The material has been provided by InstaForex Company - www.instaforex.com |
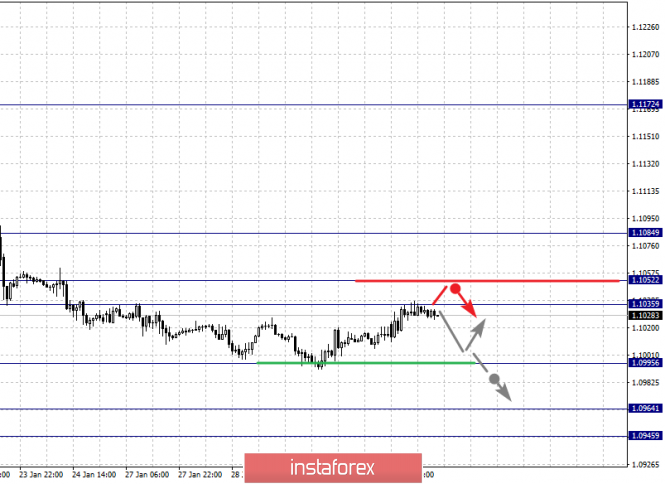
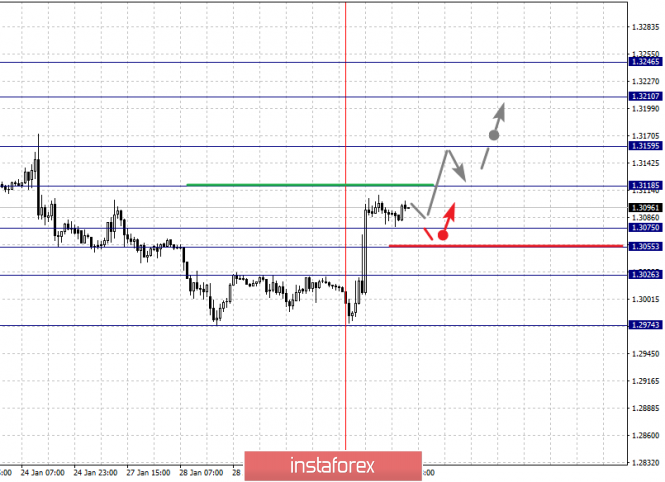
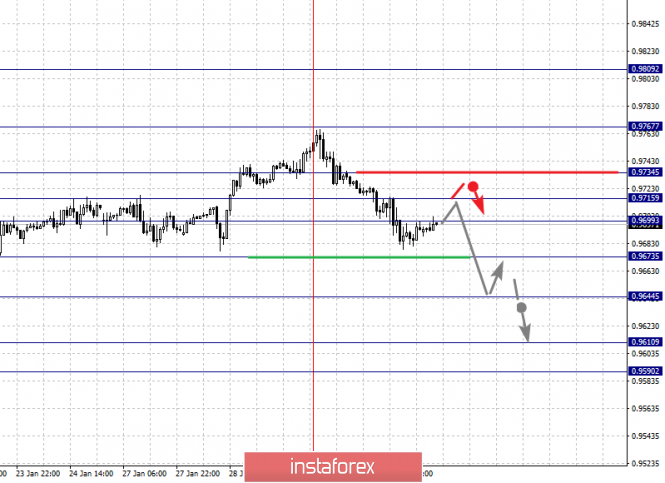
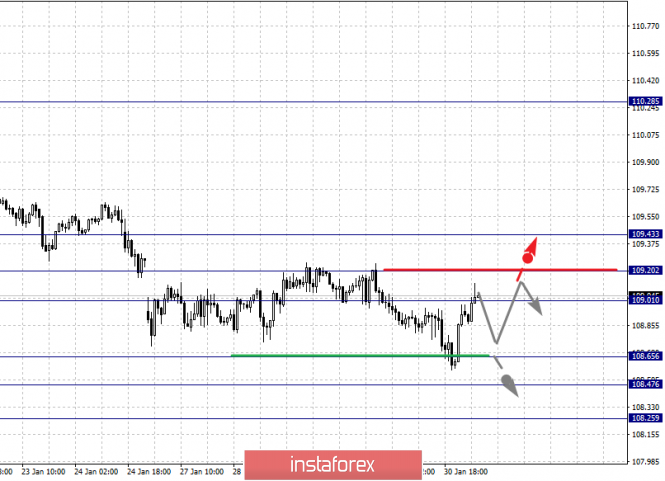
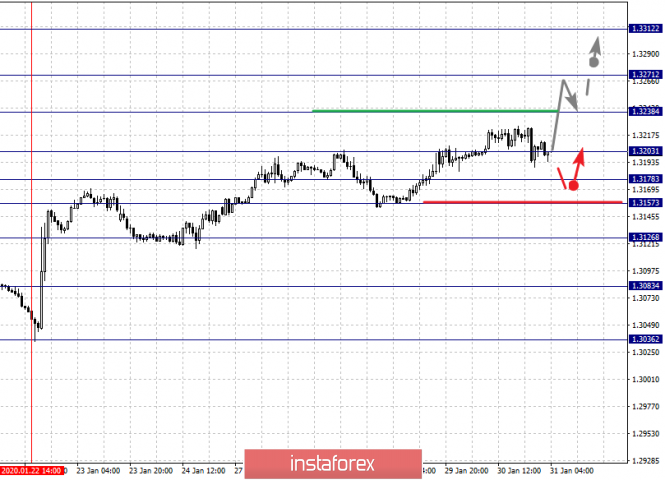
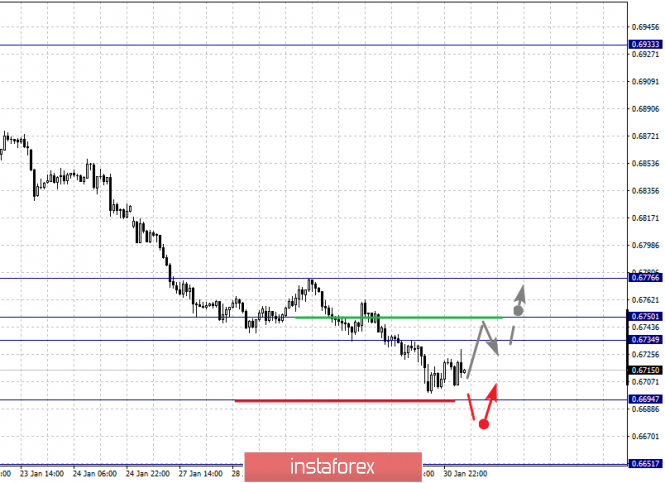
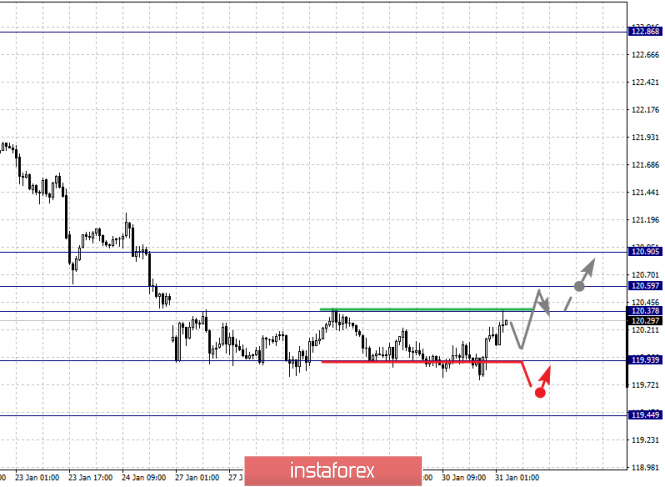
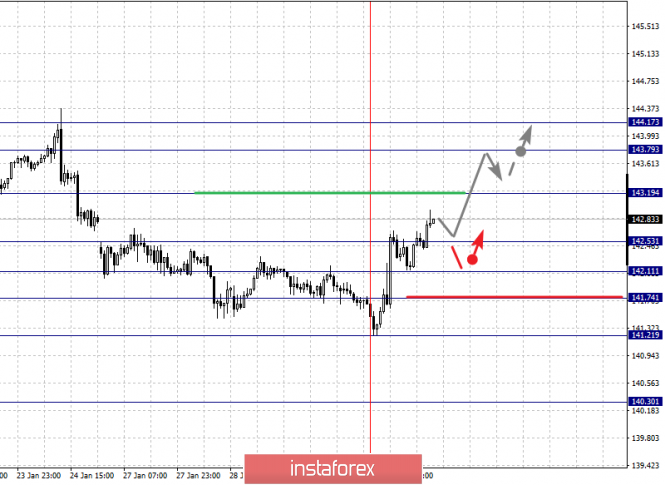
| Fractal analysis of the main currency pairs for January 31 Posted: 30 Jan 2020 06:38 PM PST Forecast for January 31: Analytical review of currency pairs on the scale of H1: For the euro / dollar pair, the key levels on the H1 scale are: 1.1084, 1.1052, 1.1035, 1.0995, 1.0964 and 1.0945. Here, we continue to monitor the downward structure from January 16. At the moment, the price is in the correction zone. The continuation of the movement to the bottom is expected after the breakdown of the level of 1.0995. In this case, the target is 1.0964. For the potential value for the bottom, we consider the level of 1.0945. Upon reaching this level, we expect a pullback to the top. Short-term upward movement is possibly in the range of 1.1035 - 1.1052. The breakdown of the last value will lead to an in-depth correction. Here, the goal is 1.1084. This level is a key support for the downward structure. We expect the initial conditions for the upward cycle to be formed before it. The main trend is the descending structure of January 16 Trading recommendations: Buy: 1.1035 Take profit: 1.1051 Buy: 1.1054 Take profit: 1.1082 Sell: 1.0995 Take profit: 1.0970 Sell: 1.0964 Take profit: 1.0947 For the pound / dollar pair, the key levels on the H1 scale are: 1.3246, 1.3210, 1.3159, 1.3118, 1.3075, 1.3055 and 1.3026. Here, the price forms a pronounced upside potential for January 30. The continuation of the movement to the top is expected after the breakdown of the level of 1.3118. In this case, the target is 1.3159. Price consolidation is near this level. The breakdown of the level of 1.3160 will lead to a pronounced movement. Here, the target is 1.3210. Price consolidation is also near this level. For the potential value for the top, we consider the level of 1.3246, upon reaching which, we expect a pullback to the bottom. Short-term downward movement is possibly in the range of 1.3075 - 1.3055. The breakdown of the last value will lead to an in-depth correction. Here, the target is 1.3026. This level is a key support for the top. The main trend is the formation of potential for the upward cycle of January 30 Trading recommendations: Buy: 1.3118 Take profit: 1.3157 Buy: 1.3160 Take profit: 1.3210 Sell: 1.3075 Take profit: 1.3055 Sell: 1.3053 Take profit: 1.3026 For the dollar / franc pair, the key levels on the H1 scale are: 0.9767, 0.9734, 0.9715, 0.9699, 0.9673, 0.9644, 0.9610 and 0.9590. Here, we are following the formation of the descending structure of January 29. The continuation of movement to the bottom is expected after the breakdown of the level of 0.9673. In this case, the target is 0.9644. Price consolidation is near this level. The breakdown of the level of 0.9644 will lead to the development of pronounced movement. Here, the goal is 0.9610. For the potential value for the top, we consider the level of 0.9590. Upon reaching which, we expect a pullback to the top. Short-term upward movement is possibly in the range of 0.9699 - 0.9715. The breakdown of the latter value will lead to an in-depth correction. Here, the target is 0.9734. This level is a key support for the downward structure. The main trend is the formation of the downward structure of January 29 Trading recommendations: Buy : 0.9700 Take profit: 0.9714 Buy : 0.9716 Take profit: 0.9732 Sell: 0.9672 Take profit: 0.9646 Sell: 0.9642 Take profit: 0.9612 For the dollar / yen pair, the key levels on the scale are : 109.43, 109.20, 109.01, 108.65, 108.47 and 108.25. Here, we are following the downward cycle of January 17. At the moment, the price is in correction. Short-term downward movement is possible in the range of 108.65 - 108.47. The breakdown of the last value will lead to a movement to a potential target - 108.25, and upon reaching this level, we expect a pullback to the top. Consolidated movement is possibly in the range of 109.01 - 109.20. The breakdown of the last value will lead to an in-depth correction. Here, the goal is 109.43. This level is a key support for the downward structure. Main trend: potential downward structure of January 17, correction stage Trading recommendations: Buy: 109.01 Take profit: 109.18 Buy : 109.23 Take profit: 109.40 Sell: 108.65 Take profit: 108.48 Sell: 108.45 Take profit: 108.25 For the Canadian dollar / US dollar pair, the key levels on the H1 scale are: 1.3312, 1.3271, 1.3238, 1.3203, 1.3178, 1.3157 and 1.3126. Here, we are following the development of the upward cycle of January 22. The continuation of the movement to the top is expected after the breakdown of the level of 1.3203. In this case, the target is 1.3238. Price consolidation is near this level. There is a short-term upward movement in the range of 1.3238 - 1.3271, hence, a reversal to a correction is also possible. The potential value for the top is considered to be the level of 1.3312. Consolidated movement is possibly in the range of 1.3178 - 1.3157. The breakdown of the latter value will lead to an in-depth correction. Here, the target is 1.3126. This level is a key support for the top. The main trend is the local ascending structure of January 22, the correction stage Trading recommendations: Buy: 1.3198 Take profit: 1.3236 Buy : 1.3240 Take profit: 1.3270 Sell: Take profit: Sell: 1.3155 Take profit: 1.3130 For the Australian dollar / US dollar pair, the key levels on the H1 scale are : 0.6776, 0.6750, 0.6734, 0.6694 and 0.6651. Here, the price is near the limit value for the descending cycle of January 16. We expect a rollback to correction from the level of 0.6694. Its passage by the price will be accompanied by an unstable movement to the bottom. Here, the potential target is 0.6651, but it is not recommended to work towards this value. Short-term upward movement is expected in the range of 0.6734 - 0.6750. The breakdown of the latter value will lead to an in-depth correction. Here, the target is 0.6776. This level is key support for the bottom. We expect the initial conditions for the upward cycle to be formed before it. The main trend - we expect a correction Trading recommendations: Buy: 0.6734 Take profit: 0.6750 Buy: 0.6752 Take profit: 0.6774 Sell : Take profit : Sell: 0.6694 Take profit: 0.6680 For the euro / yen pair, the key levels on the H1 scale are: 120.90, 120.59, 120.37, 119.93 and 119.44. Here, given the situation for the pound / yen, we mainly expect a correction. Short-term upward movement is possibly in the range of 120.37 - 120.59. The breakdown of the last value will lead to an in-depth correction. Here, the goal is 120.90. This level is a key support for the downward structure. The continuation of movement to the bottom is expected after the breakdown of the level of 119.90. In this case, the potential target is 119.44. Upon reaching this level, we expect a pullback in correction. The main trend is a downward structure from January 16, we expect a correction Trading recommendations: Buy: 120.37 Take profit: 120.57 Buy: 120.61 Take profit: 120.90 Sell: 119.90 Take profit: 119.48 Sell: Take profit: For the pound / yen pair, the key levels on the H1 scale are : 144.17, 143.79, 143.19, 142.53, 142.11, 141.74, 141.21 and 140.30. Here, the price forms a pronounced upside potential for January 30. The continuation of the movement to the top is expected after the breakdown of the level of 143.19. In this case, the goal is 143.79. For the potential value for the top, we consider the level of 144.17. Upon reaching which, we expect consolidation, as well as a pullback to the bottom. Short-term downward movement is expected in the range of 142.53 - 142.11. The breakdown of the last value will lead to an in-depth correction. Here, the goal is 141.74. This level is the key support for the ascending structure. Its breakdown will allow us to count on movement to the level of 141.21, which, in turn, is the key resistance to continue the development of a downward trend. The main trend is the descending structure of January 22, the correction stage Trading recommendations: Buy: 143.20 Take profit: 143.79 Buy: 143.80 Take profit: 144.17 Sell: 142.53 Take profit: 142.13 Sell: 142.10 Take profit: 141.76 The material has been provided by InstaForex Company - www.instaforex.com |
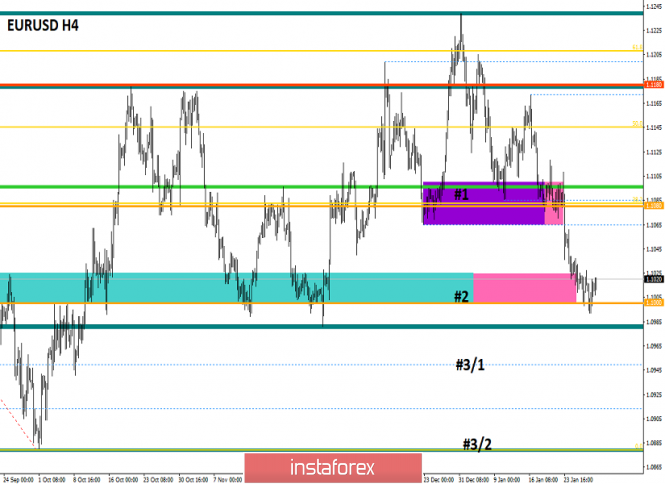
| Posted: 30 Jan 2020 03:39 PM PST EUR / USD - 4H. Good evening, dear traders! The trading idea that I described in recent reviews has worn out all its working capacity. Yesterday,, the quotes of the pair completed a reversal immediately after the formation of two bullish divergences in favor of the European currency and began the growth process. The euro-dollar pair did not reach the target level by just 3-4 points, but in my review yesterday, I said that the pair could pullback to the top, and the goal can be considered completed. In this case, the pair remains inside the downward trend range, which continues to show what mood the traders have at the moment - "bearish". A new trading idea is as follows: I recommend waiting for the quotes to roll back to the area of the upper line of the downward range. The levels of correction to the last decline of the pair - 38.2%, 50.0% and 61.8% are near this line. From one of them, provided that they do not leave the trend anger itself, they can rebound with a reversal in favor of the American currency and resume falling below the level of 1.1000. Let me remind you that, traders have the right to count on quotes falling in the direction of the low level of 1.0850, according to a long-term trading idea. Thus, I recommend waiting for the pair to increase in the coming days and looking for entry points for new sales. Otherwise, in case that quotes complete fixing over the range, then this trading idea will be canceled. EUR / USD - Daily. There are no changes on the 24-hour chart. After the pair closes below the trend line, I recommend counting on a continued decline in the direction of the level of 1.0850. This goal is relevant as long as the quotes are located inside the global trend downward range. Forecast on EUR / USD and recommendations to traders: The long-term trading idea remains valid. Traders still have a long-term target for declining near the level of 1.0850, confirmed by the pair closing below the trend line. In this regard, the terms of its implementation can be 1-2 weeks. The short-term trading idea is the pair's new sales with rebound from correction levels of 38.2%, 50.0% or 61.8%. A prerequisite is the absence of quotes outside the downward range. The material has been provided by InstaForex Company - www.instaforex.com |
| Posted: 30 Jan 2020 03:39 PM PST GBP / USD - 4H.
Good evening, dear traders! As I said in yesterday's review, the pair completed another rebound from the upward global correction line, and this completed the development of our previous signals. The target level of 76.4% 1.2995 already developed with a margin. Thus, now, it is time to formulate a new trading strategy and outline new trading ideas. On the 4-hour chart, the GBP / USD pair reversed in favor of the British currency and began the growth process in the direction of a new downward trend. Therefore, the trend line and the correction line formed a kind of a narrowing triangle. In this regard, a new trading idea is to wait for the pair quotes to exit this triangle, then it will become clear what mood the traders will form in the coming days. After that, consolidating the quotes of the pair above the upper trend line will increase the probability of continuing the growth in the direction of 1.32 and 1.33. The rebound of quotes from this line will develop in favor of the US dollar and the resumption of decline to the bottom line of correction. On the other hand, further closing under the correction line will increase the chances of the pair to continue the decline, which I will recommend working out. Forecast and recommendations of GBP/USD for traders: The new trading idea is to sell the pound when fixing below the correction line from which the pair rebounded yesterday, as well as to buy the pair if it closes above the upper trend line. In turn, the goals will be indicated after one of the signals is triggered. The material has been provided by InstaForex Company - www.instaforex.com |
| GBP/USD review as of January 30, 2020 Posted: 30 Jan 2020 02:39 PM PST Hello, dear market participants! I will not spend time on events from yesterday that are related to the Federal Reserve. I only note that virtually everything was left within expectations. The refinancing rate remained in the range of 1.5% -1.75%, and no significant rhetoric in the speech of the Fed Chairman Jerome Powell occurred. But today's meeting of the Bank of England has significantly affected the dynamics of the British currency, which has shown significant appreciation. This despite the fact that the British central bank kept the interest rate unchanged at 0.75%. I believe that the Bank of England Monetary Policy Committee (MPC) voted by a majority of 7 against 2 to maintain its basic interest rate at 0.75% in January. The volume of the asset purchase program, 435, was also preserved, which coincided with the forecasts of market experts. Thus, the pessimistic forecasts of some analysts to reduce rates by 25 basis points did not materialize. In addition, the EU by a majority vote approved the UK exit from the European Union, and this is another positive point for the pound. Let's look at the charts of the pound/dollar currency pair to understand what its future prospects are. Daily As a result of today's growth, the pound/dollar pair has appreciably increased on the decision and comments of the BoE, and was trading near the significant mark of 1.3100. This level is really very important and, in my personal opinion, is in no way inferior to the psychological mark of 1.3000. The pound is trying to overcome the level of 1.3107, and if successful, the rise in quotes will continue towards the levels 1.3136 and 1.3146, as the nearest goals of possible growth. If market sentiment suddenly changes (which is unlikely), the pair will go down to the significant record and psychological level 1.3047, which was repeatedly mentioned in previous GBP/USD reviews. These are the prospects for GBP/USD on the daily timeframe. We are going further. H4 A circled candle with a long bottom shadow was nothing more than a reversal signal for growth. As you can see, this is exactly what happened. Moreover, it does not matter if this was a reaction of investors to the BoE or not. There is always a reason. There would be a good signal! In order not to load you with an abundance of information (I think I have already outlined the main ones), I will turn to trading recommendations, if any. So, the situation on the pound has changed, and now the main scenario looks upward. At the same time I would not recommend buying at the current peak. Too risky, and at any time a correctional rollback may occur. I think it's time to move on to trading ideas on GBP/USD. So, the main and very strong resistance of sellers is concentrated in the area of 13171. If near this level on the daily, 4-hour or hourly charts appear reversal signals to decrease, we sell with targets in the area of 1.3120-1.3100. In case of a breakout of resistance at 1.3171 and consolidation above this level, at the pullback we buy with the nearest targets in the area of 1.3220. Have a successful bid! The material has been provided by InstaForex Company - www.instaforex.com |
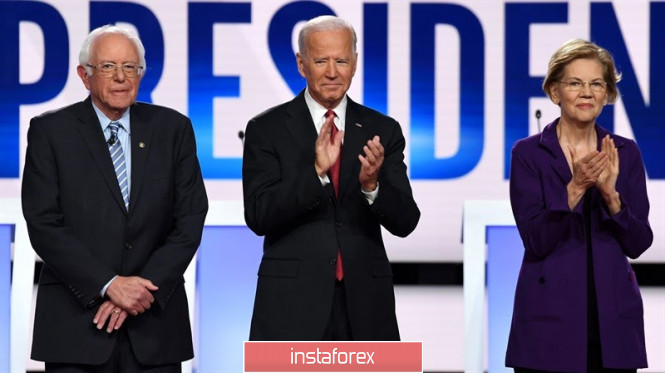
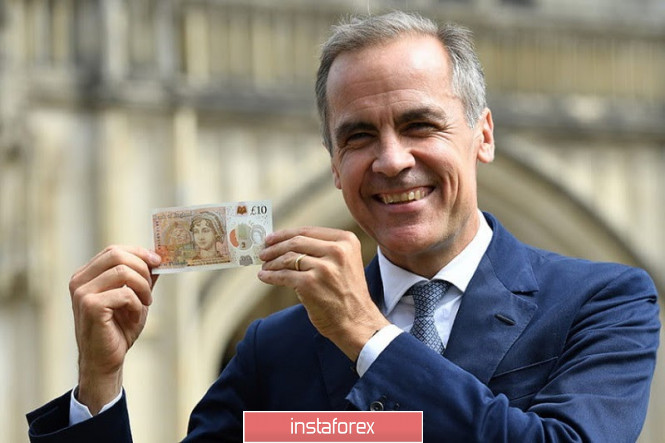
| GBP/USD: Bank of England patience, 0-2-7 alignment and Bernie Sanders' shadow Posted: 30 Jan 2020 02:38 PM PST The fundamental picture for dollar pairs is changing with kaleidoscopic speed - the US currency was on the horse yesterday, being in demand amid rising anti-risk sentiment and the phlegmatic position of the Federal Reserve. But the situation has changed dramatically today. The EUR/USD pair returned to the 10th figure, and the GBP/USD pair again tests the boundaries of the 31st price level. Other dollar pairs also changed their configuration to one degree or another, due to the general weakening of the greenback. In general, the dynamics of the majors is now determined by the behavior of the dollar - the GBP/USD pair's growth from today is absolutely justified, thanks to the restrained position of the English regulator. Let me remind you that the Bank of England today held its first meeting this year, which was the last for Mark Carney - the March meeting will already be chaired by Andrew Bailey. On the eve of the January meeting, experts and traders disagreed on what position the English regulator would take. The vast majority of market participants were followers of the dovish scenario. Some of them warned of a rate cut, while others were confident that the central bank would not make hasty decisions, maintaining the status quo until spring. Each had its own arguments - proponents of monetary easing pointed to a significant slowdown in GDP growth, inflation and retail sales, while proponents of a wait-and-see attitude countered by the fact that the latest data on labor market growth came out better than expected, and Brexit was realized on a "civilized" basis (while it's too early to talk about the outcome of the transition period). In other words, the intrigue of the January meeting remained until the last moment, heating up the already difficult situation in the foreign exchange market. Usually in such cases, the market shows increased volatility when the intrigue finds its solution. And today's case was no exception. The GBP/USD pair went up even before the press conference of Mark Carney. Firstly, traders saw that the regulator kept the interest rate at the current level (although the probability of a decrease was estimated at almost 60%). Secondly, the bulls of the pair were pleased with the alignment of forces 0-2-7 instead of the predicted 0-3-6. This means that the number of "dissidents" offering to mitigate monetary policy has not increased, although such concerns were, and quite justified. Over the past few weeks, BoE officials have hinted that they are prepared to cut interest rates as a preventative measure. For example, in mid-January, such a possibility was made by Gertjan Vlieghe, who stated that the British economy needed support. He was supported by Michael Saunders, who over the past few meetings has voted in favor of lower rates. Another member of the Committee, Jonathan Haskel, voiced a similar position. Sylvana Tenreyro unexpectedly joined the dovish wing, who announced that she was ready to support the easing of monetary policy. Summarizing the dovish moods, BoE Chairman Mark Carney in one of the latest interviews also did not exclude the implementation of this scenario. Therefore, most traders were certain that at least three out of 9 members of the Committee would vote for the rate cut at the January meeting. But in reality, the alignment of forces has not changed - only Saunders and Haskel voted for this decision. Thus, the BoE made it clear that it was ready to continue to maintain a wait-and-see attitude. Of course, the latest trends in the country's economy did not go unnoticed - the regulator lowered its forecast for economic growth, while recognizing that inflation would remain below target level until the end of next year. In addition, the central bank excluded the wording that it was ready for "moderate gradual tightening of monetary policy." However, the market does not expect a rate hike in the foreseeable future, so this fact did not put pressure on the British currency. But the US currency was under pressure today due to macroeconomic reports. The fact is that the data on US GDP growth were very contradictory. Most analysts surveyed expected the country's economy to grow to 2.1% in the fourth quarter of 2019. The release fully coincided with this forecast. At the same level, the indicator came out in the third quarter of 2019. The structure of today's release suggests that personal expenses decreased (1.8% against the forecast of growth to 2%) and the level of business investment. Imports also showed negative dynamics, while exports grew by only 1.4%. The market also drew attention to the price index of GDP - it is believed that this indicator is monitored by the Fed "with a particular bias", therefore its negative dynamics largely offset the positive from the release. The indicator came out at 1.4%, although experts expected growth to 1.8%. In addition, the dollar came under pressure from the political factor - it became known that Bernie Sanders strengthened his electoral position in the presidential race and now lags behind the favorite of the primaries - Joe Biden - by only three percent. In a rivalry with Trump, he wins with a score of 48% against 42%. Sanders has a reputation for being almost a "communist," as he offers to introduce the principles of free medicine to American society, along with free college education, a program of guaranteed jobs and write-offs of student debts. He also advocates for narrowing the wage gap between top managers and employees. According to some experts, if Sanders wins (and this option can no longer be ruled out), the budget deficit will increase in many ways, and "the printing press will work without stopping." Naturally, such prospects, albeit still hypothetical in nature, exert background pressure on the US currency. Thus, the pound received a reason for its correction today, after many days of pressure from numerous fundamental factors. However, long positions on the GBP/USD pair still look risky. The situation with the spread of coronavirus has not yet reached its climax, and this factor can unfold the pair at any time - for example, when the number of cases exceeds the 10,000th mark or the first death from "Wuhan pneumonia" outside of China is recorded. Another surge in anti-risk sentiment will temporarily restore confidence to the dollar. The material has been provided by InstaForex Company - www.instaforex.com |
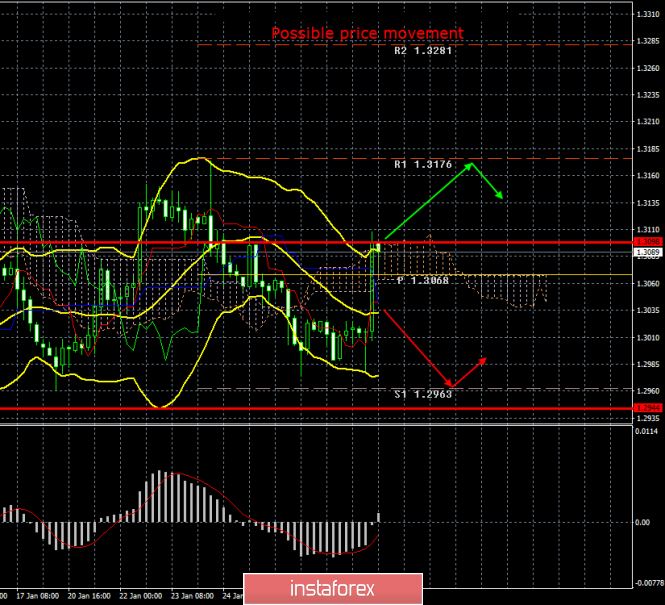
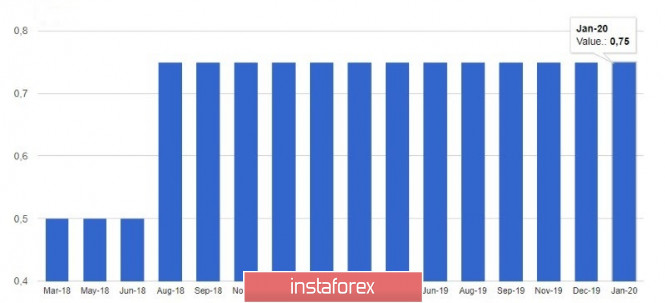
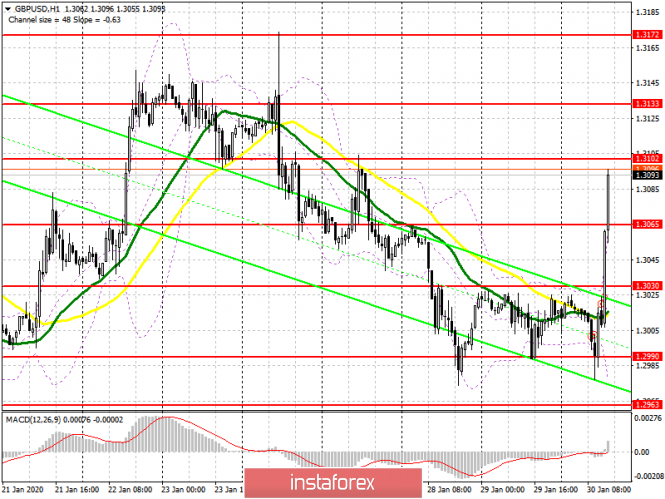
| Posted: 30 Jan 2020 02:38 PM PST 4-hour timeframe Amplitude of the last 5 days (high-low): 52p - 89p - 118p - 54p - 118p. Average volatility over the past 5 days: 87p (average). The British pound showed a fairly strong upward movement on Thursday, January 30, rising against the US dollar by almost 120 points, if you count from the lows of the day. This upward movement was provoked exclusively by the Bank of England's decision not to lower the key rate. However, even this factor was not the main one. Many experts, analysts and traders expected, if not monetary easing, then at least an increase in the number of members of the monetary committee who support the rate cut. However, a surprise awaited market participants here as well. The number of committee members who voted in favor of cutting the key rate remained the same - two. This is again Michael Saunders and Jonathan Haskel. The central bank also quite predictably did not change the parameters of the government bond repurchase program - 435 billion pounds per month, as well as corporate bonds - ten billion pounds a month. Moreover, the BoE in its communique even allowed the key rate to be raised in the near future, saying that "business begins to recover, according to polls, after the Conservative Party won the election in December, and in the future it may even require a moderate tightening of monetary policy." Of course, this "in the future" will most likely come soon. We do not believe that the UK economy has truly embarked on a recovery path. So far, we are talking only about a few good macroeconomic reports on Great Britain. Therefore, not a rate cut and the lack of hints of the regulator to lower it in the near future can already be considered positive news for the British currency. Moreover, for Mark Carney, the current meeting was his last at the head of the British central bank. On March 16, Carney will be replaced by the current head of the Financial Market Compliance Department, Andrew Bailey. Many believed that Carney would follow the example of her colleague Mario Draghi from the ECB and would also "slam the door" in the end, but this did not happen. The Bank of England also published forecasts for GDP for 2020 - moderate growth at 0.8%, and also for 2021 - growth at 1.5%. Inflation, according to the expectations of the British regulator, will remain at "below 2%" over the next three years at a key rate of 0.75%. If the rate is reduced to 0.5% (it turns out that BA still allows this possibility), then inflation is expected to be "slightly above 2%". Now tomorrow we are waiting for the most high-profile event of recent years - the UK's official exit from the EU, which cannot yet be called complete, as the country will simply go into a "transition period", which will last 11 months. Moreover, during this period the country will enjoy all the EU membership preferences. That is, nothing will change for the British economy. Changes should be expected only in 2021, when Brexit will be completed and everything will depend on whether Boris Johnson manages to sign a trade deal with Brussels or whether from January 1, 2021 all British exports to the European Union will be taxed. Naturally, such terms of trade with the EU will hit the UK economy even harder. Even without Brexit, the economy has been losing about 70 billion a year since the 2016 referendum. Earlier it was estimated that for several decades in the European Union, London paid about the same amount to the EU treasury as it lost in three years due to Brexit (which has not even been completed and, in fact, has not even begun). Thus, at the moment, quotes of the British pound soared, but very soon the euphoria may come to naught, as in fact nothing positive has happened. BA just didn't lower rates, that's all. Yes, traders were delighted with this information and the lack of hints of a lower rate in the near future. However, what does this change for the British economy compared to the central bank's previous meeting? Nothing. Therefore, it is possible for the pair to return to their original positions in the coming days, at which they were before the publication of the results of the BA meeting. Trading recommendations: GBP/USD is trying to start an upward trend. Thus, formally, the purchase of the British pound with a target resistance level of 1.3176 is now relevant. However, after such a strong movement as it is today, firstly, a downward correction may begin, and secondly, markets should calm down and enter into the usual trading mode. The pair's sales can again be considered if the price returns to the area below the Kijun-sen line with targets at 1.2963 and 1.2944. Explanation of the illustration: Ichimoku indicator: Tenkan-sen is the red line. Kijun-sen is the blue line. Senkou Span A - light brown dotted line. Senkou Span B - light purple dashed line. Chikou Span - green line. Bollinger Bands Indicator: 3 yellow lines. MACD indicator: Red line and bar graph with white bars in the indicators window. Support / Resistance Classic Levels: Red and gray dashed lines with price symbols. Pivot Level: Yellow solid line. Volatility Support / Resistance Levels: Gray dotted lines without price designations. Possible price movements: Red and green arrows. The material has been provided by InstaForex Company - www.instaforex.com |
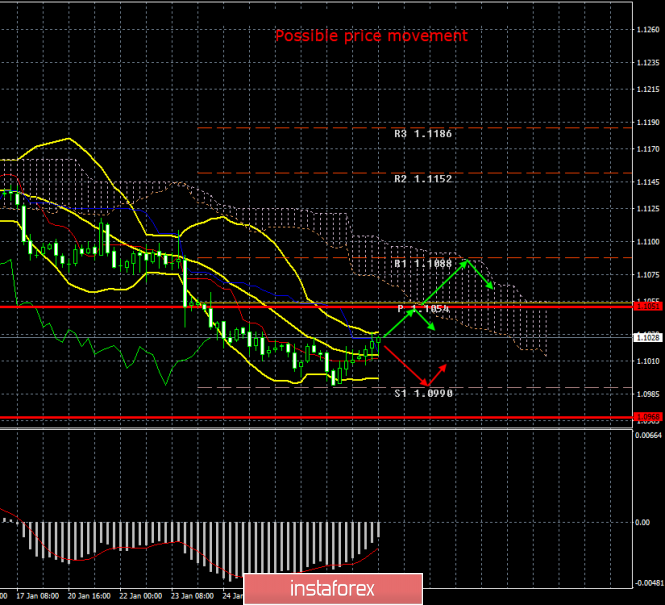
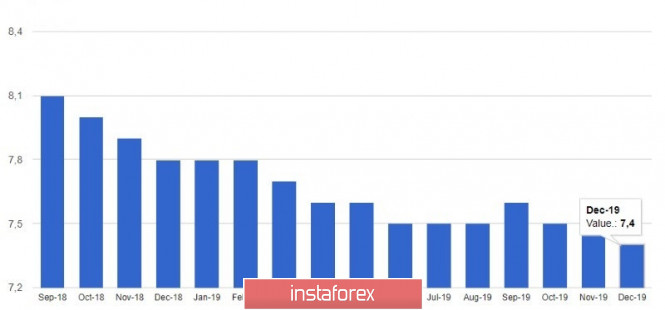
| Posted: 30 Jan 2020 02:38 PM PST 4-hour timeframe Amplitude of the last 5 days (high-low): 73p - 42p - 28p - 28p - 36p. Average volatility over the past 5 days: 42p (average). The fourth trading day of the week ends with a continuation of a weak upward correction, which began even a few days earlier. There was a rather large amount of important or relatively important macroeconomic information both in Europe and in the US today. Thus, traders again had every chance to behave more actively, however, the pair again beats all the anti-record volatility. The euro/dollar covered a distance of 28 points. Of course, by the end of the day this figure may grow a little and amount, for example, to points 40, which is just the average value for the pair over the past five days. At the same time, the pair worked out the critical line Kijun-sen as part of the correction and intends to overcome it. If this happens, then the downward trend will cancel for a while, and short positions will lose their relevance. Bulls will be able to form an upward trend, especially since for the first time in a long time the macroeconomic background can help them in this. We would also like to note the fact that the pair, once again approaching their two-year lows, could not overcome this area of support and now can again pull back upwards by 100-200 points. Now we will consider and analyze all the macroeconomic statistics of the day; there were plenty of them on January 30. The day began with the publication of the unemployment rate in Germany, which remained unchanged at 5%. The change in the number of applications for unemployment benefits amounted to -2,000, which is better than forecasts. Then, about an hour later, similar information was published on the European Union. The unemployment rate in December was 7.4%, which is lower than a month earlier. In addition, several secondary indicators were published immediately reflecting the state of the business climate in the EU, as well as the mood in the economy, business optimism and consumer confidence. In general, indicators signaled versatile changes. Some turned out to be slightly better than forecasts, some were slightly worse. In any case, no reaction of market participants to all these data was followed. Then, a few hours later, again in Germany were published more important data on the consumer price index in January (preliminary values). The main inflation rate accelerated to 1.7% y/y, and in monthly terms fell by 0.6%, which is fully consistent with the forecast values. The harmonized consumer price index was 1.6% y/y and did not reach the forecast value of 0.1%. However, in any case, acceleration of inflation in the locomotive country of the entire European Union is positive news for the euro. Now we can expect that pan-European inflation will accelerate slightly in January. Although, on the other hand, it is unlikely that it will still reach the ECB target levels of about 2.0% y/y. The most interesting information came from overseas, since we primarily connect the prospects for the euro/dollar currency pair with US macroeconomic statistics. We have already said that we are concerned about indicators of business activity in the manufacturing sector, a drop in industrial production and a decline in GDP. The Fed in the form of Jerome Powell tried to calm the markets, and he managed to do so. Although the US dollar is becoming cheaper at the moment, its fall is negligible. The fourth quarter annual GDP data (preliminary value) amounted to +2.1%. The same value of the main indicator was in the third quarter. Thus, it can hardly be called strong, and the general trend remains bearish. The GDP price index was also published, which characterizes the change in prices for goods and services in the country for the reporting period and is a harbinger for the main inflation indicator. This indicator was forecasted to increase by 1.8%, but in reality it fell to 1.5% in the fourth quarter. The price index for personal consumption expenditures reflects the average amount of consumer spending on durable goods, consumer goods, and services, but does not take into account energy and food expenses. It is also a good indicator for forecasting inflation and also did not reach the forecast value of 1.6%. The last to be published was the index of expenditures on personal consumption, which reflects the average consumer spending on durable goods, consumer goods and services. This indicator decreased compared to the previous period (2.1%) and did not reach the forecast value (1.7%) - 1.3%. Thus, in general, we can say that macroeconomic statistics from across the ocean turned out to be very weak, and most importantly, we can now expect a slowdown in inflation, which has accelerated in recent months to 2.3% y/y. This is bad news for the US dollar, and the euro can finally form a more or less strong upward trend, fundamentally justified. Trading recommendations: The EUR/USD pair began to adjust against the downward trend. Thus, it is recommended to sell the euro again with targets of 1.0990, 1.0968, if traders fail to gain a foothold above the Kijun-sen line, that is, a rebound will occur. It will be possible to consider buying the euro/dollar pair no earlier than traders of the Kijun-sen line with small lots with the goal of a volatility level of 1.1051 and the Senkou Span B. line Explanation of the illustration: Ichimoku indicator: Tenkan-sen is the red line. Kijun-sen is the blue line. Senkou Span A - light brown dotted line. Senkou Span B - light purple dashed line. Chikou Span - green line. Bollinger Bands Indicator: 3 yellow lines. MACD indicator: Red line and bar graph with white bars in the indicators window. Support / Resistance Classic Levels: Red and gray dashed lines with price symbols. Pivot Level: Yellow solid line. Volatility Support / Resistance Levels: Gray dotted lines without price designations. Possible price movements: Red and green arrows. The material has been provided by InstaForex Company - www.instaforex.com |
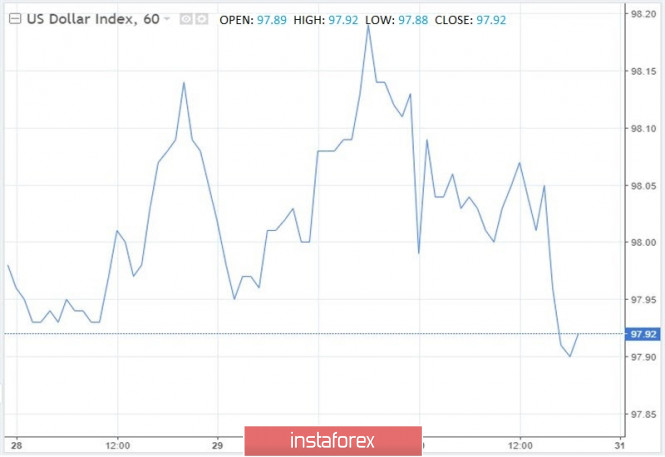
| Dollar keeps Fed rate cut in mind and prepares for the election Posted: 30 Jan 2020 02:38 PM PST Reaction to the results of the January FOMC meeting were a decrease in the yield of treasury bonds and US stock indices, mixed dynamics of greenbacks and an increased likelihood of a weakening of the Fed's monetary policy in the third quarter of 2020. Unlike in December, in the January FOMC final statement, US household spending growth was marked as "moderate" rather than "strong". Bloomberg experts predict a slowdown in the growth of personal consumption spending in the US (from 4.6% and from 3.2% in the second and third quarters to 2% in the fourth). Obviously, the US economy is losing momentum. If in October – December net exports and investments in the housing sector contributed to the increase in national GDP, then in January – March, including due to the problems of the Boeing airline giant, the indicator may seriously slow down. According to Fed Chairman Jerome Powell, the regulator is not satisfied with how inflation works. Amid record long-term economic expansion in the United States and the lowest unemployment rate in the country for half a century, consumer prices should confidently go up. However, over the 12 months, including November, the United States personal spending index rose by only 1.5%. The US central bank sees how in other countries weakening inflation expectations slows inflation, and intends to do everything possible so that nothing like this happens in the United States. In particular, the Fed is willing to tolerate PCE above a 2% target. This means that the barriers to raising the federal funds rate are quite high, while the chances of its reduction remain. This is not good news for the greenback. Although Powell argues that it is too early to talk about the consequences of the coronavirus epidemic on the global economy, the fact that the Fed is monitoring events in China means that the central bank is closely monitoring the situation. Against this background, rumors appeared that the new virus would become the main reason for the further reduction in the federal funds rate. If during the outbreak of SARS in 2003, China's share in the world GDP accounted for only 4%, but now it is 17%. The number of people infected with coronavirus is about the same as 17 years ago, and the peak of the epidemic has not yet passed. Thus, an outbreak of coronavirus increases the chances of easing the monetary rate of the Fed. However, it is not a fact that this will necessarily lead to a weakening of the US dollar, since other central banks will also be forced to react if the global economy really has problems. In the foreseeable future, the US presidential race may also affect the dynamics of the dollar. According to Wells Fargo experts, strengthening the position of Donald Trump during the election campaign will have a neutral or positive effect on the USD rate. "Investors seem to like the fiscal stimulus, low tax, and unobtrusive policies of the 45th US president. If Joe Biden begins to gain points, then it will become a neutral factor for the US currency, as the former vice president is unlikely to change anything radically. Strengthening the position of senators (Elizabeth Warren or Bernie Sanders) is likely to be a moderately negative event for the dollar, as both representatives of the Democratic Party are in favor of raising taxes and increasing government spending. The victory of any of them in the elections will mean a radical change in politics," they said. According to experts, any changes in the preferences of the US electorate will have only a temporary effect on the dollar. "Historically, the dollar has tended to rise in the year of the presidential election, at least against major currencies. From the beginning of the year until the election (if this is the first term of the incumbent president), the dollar rose by an average of 2.3%. Therefore, in the coming months, the US currency may be stronger than we expect," Wells Fargo representatives said. "Expectations that Democrats will retain a majority in the lower house of Congress and Republicans in the upper house will reduce the amplitude and duration of fluctuations in the dollar if a clear leader is identified in the presidential race," they added. The material has been provided by InstaForex Company - www.instaforex.com |
| Posted: 30 Jan 2020 02:38 PM PST The key decision of the Bank of England today was to maintain interest rates at the same level, which instantly supported pound buyers who were somewhat afraid of a real easing of monetary policy at the beginning of this year. However, the technical breakthrough of resistance of 1.3030, which I mentioned in detail in the morning review, led to the demolition of a number of stop orders and a larger growth wave. As I noted above, the BoE left the key interest rate at 0.75%. This decision was made with a vote ratio of 7-2. The number of votes cast to keep the key rate unchanged was 7, and the number of votes cast to increase the key rate was 0. As for those who voted for a lower rate, and these are two members of the board - Jonathan Haskel and Michael Saunders, their motives were clear at the end of last year. Those who disagree with the majority decision cited weak growth amid Brexit, inflation and global uncertainty, which has now intensified due to the spread of coronavirus. However, the majority noted positive trading news, a reduction in uncertainty around Brexit, and last but not least, the upcoming fiscal stimulus, which I also mentioned in detail in my morning review. The BoE noted that lowering the rate may be required only if signs of a global economic recovery turn out to be unstable, and talking about raising the rate is possible only if the UK economy grows in accordance with expectations. It is also worth paying attention to the revision of the forecast for UK GDP growth from 1.25% to 0.75% for 2020. It is expected that GDP in the fourth quarter of 2019 will remain unchanged at 1.25% based on last year's results. Inflation will continue to be below the target level of 2% in 2020 and 2021, which makes it easier to maneuver with interest rates if necessary. The central bank noted that they are awaiting the conclusion of a deep free trade deal with the EU since 2021, but they also do not build hopes that the negotiations will go very smoothly, since a number of requirements need special coordination. The BoE is also ready for a sharp drop in UK exports in 2021 after the entry into force of a new trade deal with the EU, but it is still too early to talk about it. As for the technical picture of the GBPUSD pair, a breakthrough of the technical support level of 1.3030 led to a sharp increase in the pound. However, if you look at the daily chart, you will see how the British pound walked "along the edge of the knife," since it was near the level of 1.2290 that the lower boundary of the triangle formed on December 23, 2019 passed, the break of which caused the pound to sharply fall in the beginning of this year. Now the task of the bulls is to break through the upper boundary of this triangle, which is visible in the area of 1.3133. Consolidation on this range will quickly return the pound to the highs of 1.3265 and 1.3316. We can expect a return to 1.3400 and 1.3520 in the longer term. EURUSD The euro continued to trade in a narrow side channel against the US dollar after the release of reports on the eurozone labor market. Weak activity was directly related to low demand for risky assets. According to the data, the number of applications for unemployment benefits in Germany fell in January, which was good news for an economy that is going through hard times. Labor market growth will support the gradual recovery of the country's GDP. According to the report, the number of applications fell by 2,000 in January after an increase of 8,000 in December, while economists had expected that the number of applications would increase by 5,000 in January. The unemployment rate was 5.0% in January and the number of vacancies was 668,000. As for Italy, the number of unemployed slightly grew in December. According to statistics agency Istat, the number of applications for unemployment benefits rose by 2000, and the unemployment rate was 9.8%. More than 30% of the unemployed are young people aged 15 to 24 years. Employment increased by 0.6% compared to December 2018. In general, in the eurozone, the unemployment rate decreased to 7.4% in December 2019 compared to 7.5% in November, but this did not impress traders. Unemployment in the eurozone in December was projected at 7.5%. Consumer confidence also did not improve earlier this year, and there are a number of reasons for this. The report said that the consumer confidence index in the eurozone remained unchanged in January compared to December and amounted to -8.1 points, which fully coincided with the forecasts of economists. The growth of the confidence index in the eurozone industry to -7.3 points in January, against -9.3 points in December, was partially offset by a decrease in the confidence index in the sphere for services of the eurozone to 11.0 points against 11.3 points. The material has been provided by InstaForex Company - www.instaforex.com |
| January 30, 2020 : EUR/USD Intraday technical analysis and trade recommendations. Posted: 30 Jan 2020 07:43 AM PST
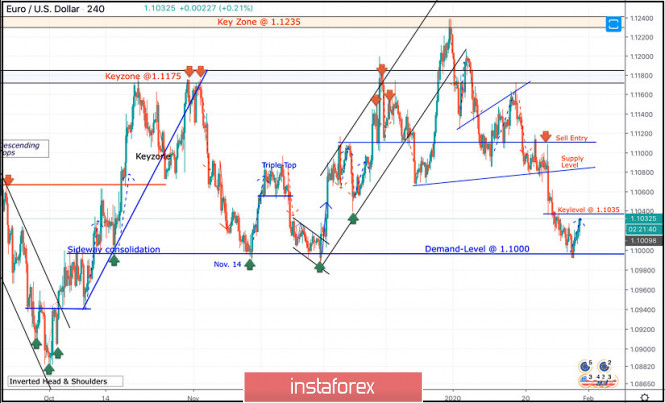
In December, the depicted bullish channel was initiated around 1.1000 allowing another bullish breakout above 1.1110 to pursue towards 1.1175. Initial Intraday bearish rejection was expected around the price levels of (1.1175). On December 20, bearish invalidation of the depicted short-term channel was demonstrated. Thus, further bearish decline was expressed towards 1.1065 where significant bullish recovery has originated. Shortly-after, a quick bullish spike towards 1.1235 (Previous Key-zone) was suggested to be watched for bearish rejection and another valid SELL entry. Suggested bearish position has achieved its targets while approaching the price levels around 1.1110. However, the Key-Level around 1.1110 has provided some bullish demand. This was followed by a bullish pullback towards 1.1140 and 1.1175 where the depicted key-zone as well as the recently-broken uptrend were located. Recently, evident signs of bearish rejection were demonstrated around 1.1175. That's why, quick bearish decline was executed towards 1.1110. As expected in a previous article, bearish persistence below 1.1110 enabled further bearish decline towards 1.1060 then 1.1035 which failed to provide any bullish SUPPORT for the EURUSD pair. Instead, further bearish decline is currently being demonstrated towards 1.1000 where the pair looks quite oversold while approaching the depicted demand level (1.1000). On the other hand, the EURUSD pair has a recently-established Key Level around 1.1035 to be watched for price action if any bullish pullback is expressed. Short-term technical outlook remains bearish as long as the EURUSD maintains its movement below 1.1035. Otherwise, bullish breakout above 1.1035 is needed to bring further bullish advancement towards 1.1085 where a more consistent supply level is located. The material has been provided by InstaForex Company - www.instaforex.com |
| January 30, 2020 : GBP/USD Intraday technical analysis and trade recommendations. Posted: 30 Jan 2020 07:16 AM PST
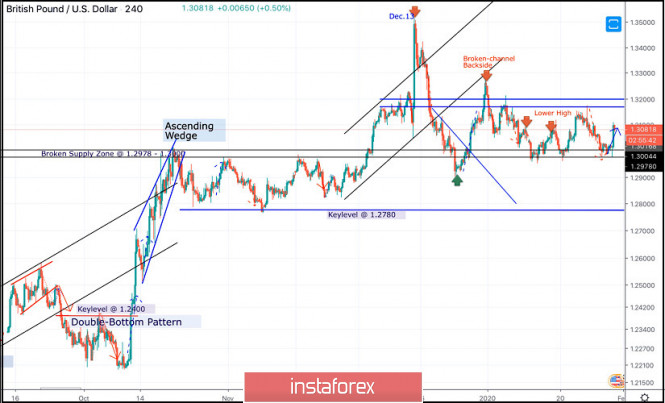
On December 13, the GBPUSD pair looked overpriced around the price levels of 1.3500 while exceeding the upper limit of the newly-established bullish channel. On the period between December 18 - 23, bearish breakout below the depicted channel followed by initial bearish closure below 1.3000 were demonstrated on the H4 chart. However, earlier signs of bullish recovery were manifested around 1.2900 denoting high probability of bullish pullback to be expected. Thus, Intraday technical outlook turned into bullish after the GBP/USD has failed to maintain bearish persistence below the newly-established downtrend line. That's why, bullish breakout above 1.3000 allowed the recent Intraday bullish pullback to pursue towards 1.3250 (the backside of the broken channel) where bearish rejection and another bearish swing were suggested for conservative traders in previous articles. Moreover, new descending highs were recently demonstrated around 1.3120 and 1.3085. That's why, Intraday technical outlook is supposed to remain bearish as long as the pair maintains its movement below 1.3120 (recently established descending high). Conservative traders can wait for bearish breakdown below 1.2980. This would be needed first to enhance further bearish decline towards 1.2900, 1.2800 and 1.2780 where the backside of the previously-broken downtrend is located. Today, early signs of bullish recovery have been manifested around 1.2980-1.3000 (Bullish hammer followed by a Bullish Engulfing H4 candlestick). In the Meanwhile, Intraday traders can watch the current bullish rejection as a bullish signal for another bullish pullback towards the depicted price zone (1.3170 - 1.3200) where another episode of bearish rejection can be watched. The material has been provided by InstaForex Company - www.instaforex.com |
| Posted: 30 Jan 2020 05:49 AM PST
The pound rose sharply on the Bank of England's decision not to change the rate. The market probably thought that the rate would be reduced. The report on US GDP for the 4th quarter was released. GDP growth of +2.1% was higher than the forecast. Thus, the news is in favor of the pound and the dollar while the euro is still fluctuating in place. It is probably time for EURUSD to choose a direction: a new decline and a break below 1.0985 will start the fall to 1.0880. However, growth to 1.1100 will indicate a reversal. We are observing. P.S. In contrast, US GDP (deflator) inflation fell to +1.4%. The material has been provided by InstaForex Company - www.instaforex.com |
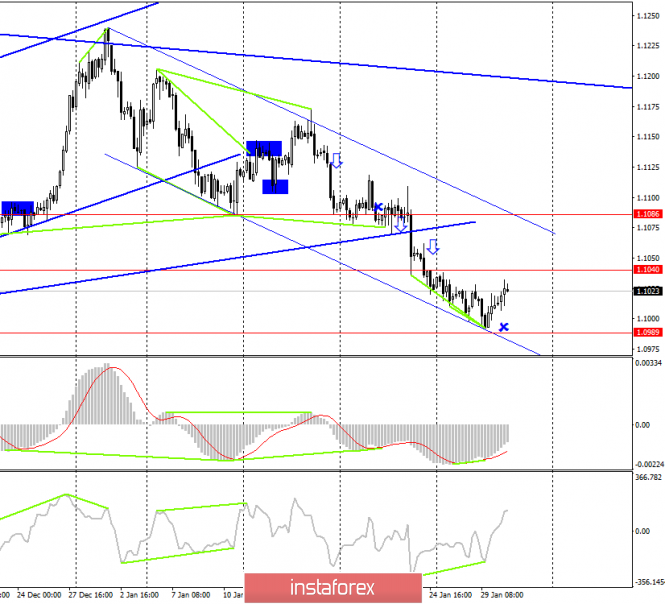
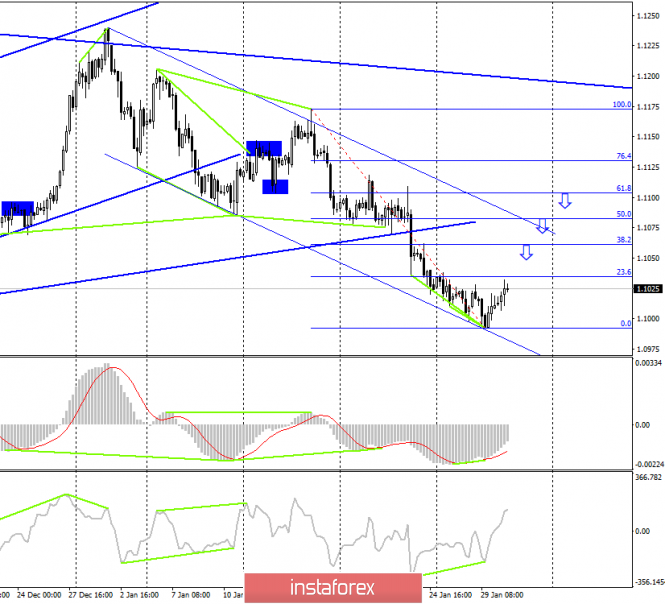
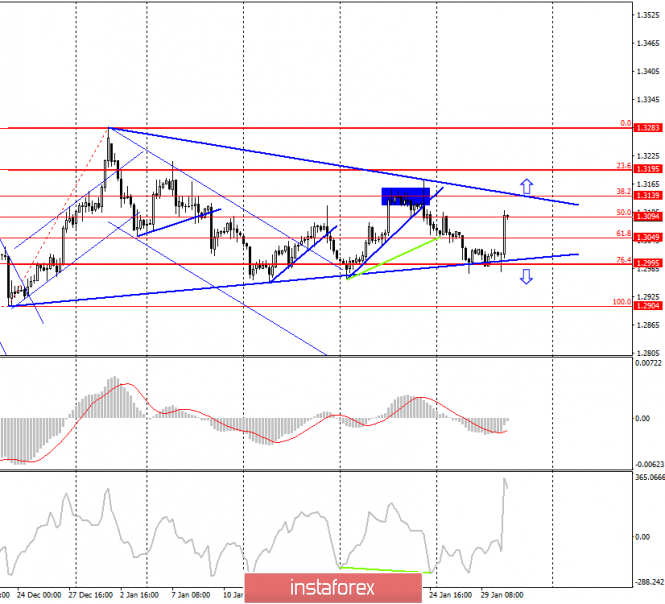
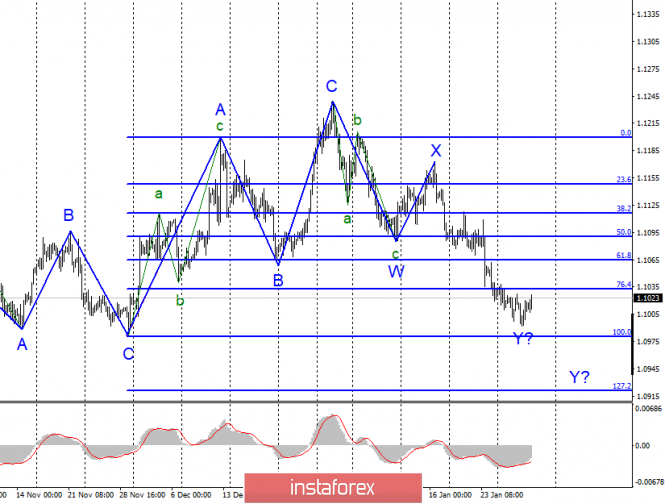
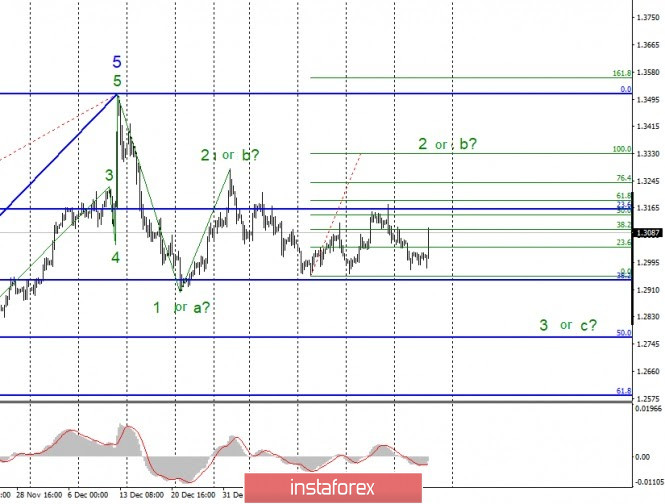
| Posted: 30 Jan 2020 05:49 AM PST EUR/USD On January 29, the EUR/USD pair lost about 12 basis points and started moving away from the previously reached lows. Thus, there are reasons to assume the completion of the wave y construction. If this is true, then the tool will start building an upward set of waves from the current positions, consisting of at least three waves. If the wave y becomes more complicated, it will be possible to determine the market's readiness to continue selling the euro currency by a successful attempt to close under the 100.0% Fibonacci level. Fundamental component: The news background on Wednesday was very much expected by the markets, but it turned out to be empty. Hopes were pinned on the evening's summing up of the Fed meeting. Hopes that the Fed will orient the markets in its plans for the near future. However, Jerome Powell and the organization that serves as the Central Bank in the United States were surprisingly banal and predictable. Nothing of interest to the markets was announced. The Fed limited itself to leaving rates unchanged and made several statements regarding the current economic state of the country and individual indicators. Nothing has changed since the December meeting. Jerome Powell again noted moderate but steady economic growth, a strong labor market, high employment, low unemployment, and inflation that has reached target levels in recent months. At the same time, Powell noted the risks associated with the new "coronavirus", which has already spread from China to Europe, America, and Australia. In this regard, communication between some countries may be disrupted, which, of course, will lead to a drop in business activity, which in the manufacturing sector of the EU and the US remains low. Thus, the "coronavirus" can slow down the world economy if it does not find a cure soon or if it does not manage to spread its distribution. Powell also noted that the current monetary policy does not need to be revised and is sufficient to ensure stable economic growth in the United States. General conclusions and recommendations: The euro-dollar pair presumably completed the construction of a descending set of waves before reaching the mark of 1.0982, which corresponds to 100.0% of Fibonacci, some 10 points. The construction of the wave y may resume, but based on the size of the W and X waves, the conclusion is still about the completion of this wave. Thus, I recommend selling the instrument only if you successfully try to break the mark of 1.0982 with the target of 1.0922. GBP/USD The GBP/USD pair lost several base points on January 29 and continued to decline within the expected wave 3 or C or complicated wave 2 or b. Already today, after the first results of the Bank of England meeting became known, the Briton began to increase, quite rapidly, thus, hopes for a continued decline in the instrument's quotes within the wave 3 or C collapsed. For some time now, the pound-dollar instrument can continue to trade between 23.6% and 38.2% Fibonacci levels (blue grid). Fundamental component: The news background for the GBP/USD instrument on Wednesday was the same as for the EUR/USD instrument. There was no market reaction to Jerome Powell's statements and the Fed's decision to leave the rate unchanged. But today, similar decisions of the Bank of England were followed by rapid purchases of the British, as the markets expected more "dovish" results. The Bank of England could have lowered the key rate, the number of members of the monetary policy committee who voted for its reduction could have increased, but none of this happened. Thus, expectations were high, but they were not met at all. Within the next half hour, a report on GDP for the fourth quarter will be released in America, which may once again cause a storm of emotions in the market and a change of direction. I recommend that you be careful with this report. There is also a speech by Bank of England Governor Mark Carney, which may also feature interesting theses. General conclusions and recommendations: The pound-dollar tool continues to build a new downward trend. Just a few points short of the mark of 1.2940 (38.2% Fibonacci), the instrument started to rise sharply, making the current wave markup even more complicated. Thus, I now recommend selling the pound only after a successful attempt to break the mark of 1.2940 with a target located around 1.2764, which is equal to 50.0% for Fibonacci. The material has been provided by InstaForex Company - www.instaforex.com |
| Posted: 30 Jan 2020 05:24 AM PST To open long positions on GBPUSD, you need: Another false breakout in the support area of 1.2990 in the first half of the day and a technical breakout of the key resistance of 1.3030, all this led to a sharp increase in the pound, which was supported by the decision of the Bank of England to leave interest rates unchanged, and even the 7 to 2 vote ratio did not change. At the moment, the bulls are confidently storming the level of 1.3102 and there are no hints of the end of the trend yet. The situation may be affected by the US GDP data, but it is unlikely that this will lead to drastic changes. Fixing above the resistance of 1.3102 will open a direct road to the highs of 1.3133 and 1.3172, where I recommend taking the profits. In the case of a downward correction, long positions can be watched if a false breakout is formed in the support area of 1.3065 or buy GBP/USD immediately for a rebound from a minimum of 1.3030. To open short positions on GBPUSD, you need: I do not recommend rushing to sell the pound today. There may be some technical correction down after a good report on the growth of the US economy from the level of 1.3102, but it is unlikely that the pressure on the pair will remain below the support of 1.3065, around which I recommend fixing the profits. In the scenario of further growth above the maximum of 1.3102, it is best to return to short positions on the rebound from 1.3133 and from the January level of 1.3172, from which the pound has been declining for the last 6 trading days. However, now we can safely say that the bearish trend is broken and major players are gradually returning to the market in the hope of maintaining the medium-term bullish trend. Indicator signals: Moving Averages Trading is conducted above the 30 and 50 daily averages, which indicates the continuation of the upward trend. Bollinger Bands In the case of a downward correction scenario, the average border of the indicator around 1.3020 will provide support.
Description of indicators
|
| BTC analysis for 01.30.2020 - Median Pitchfork line at the prrice of $9.350 is main pivot to watch Posted: 30 Jan 2020 05:09 AM PST Industry news: The emergence of cryptocurrency as an investable asset has brought up an ongoing theme in the financial space. Traditional investors are only getting older, and the gap left behind them is not being filled by millennials and younger generations who are instead turning to Bitcoin and other modern alternatives. This is a concern for the major financial houses, like Fidelity and Charles Schwab, who are now allowing their clients to trade fractions of stocks and exchange-traded funds. The hope is, by allowing investors to invest small amounts of money into big brands, like Apple, younger investors will be drawn in. Of course, this fractional trading model is already something that is built into Bitcoin, helping the digital currency to be more inclusive and open, and indeed, one of the reasons why the younger generations find the digital currency so attractive. Technical analysis:
As I alerted you yesterday, BTC did rotate around Pitchfork median line at $9.300. I do expect few pivot swings to form around median line. My analysis from yesterday Is still valid. Stochastic oscillator is showing overbought condition and bearish divergence, which is sign that buying looks risky and those sellers may use that fast to establish sell positions. MACD oscillator is showing decrease on the upside momentum, which is sign of the weak buying. Resistance levels are set at the price of $9.430 and $9.550 Support levels and downward targets are set at the price of $9.111, $8.970 and $9.790.The material has been provided by InstaForex Company - www.instaforex.com |
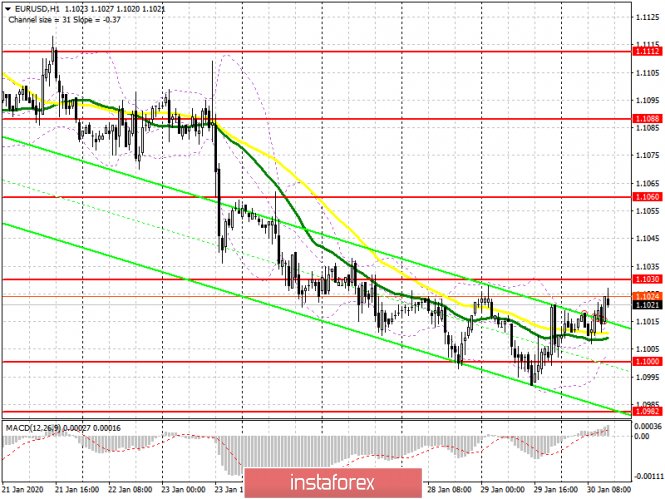
| Posted: 30 Jan 2020 05:05 AM PST To open long positions on EURUSD, you need: The euro ignored a good report on the decline in the unemployment rate in the Eurozone and remained trading in a narrow side channel in pair with the US dollar before the key data on US GDP. From a technical point of view, nothing has changed compared to the morning review. At the moment, the bulls still have a task to overcome the resistance of 1.1030, and only this level depends on whether the pair will continue to grow further and whether the downward trend will be broken. A consolidation above 1.1030 will lead to an update of highs around 1.1060, but a larger bullish impulse is formed only if the data points to the weak growth of the US economy at the end of last year. If the pair declines again in the second half of the day, you can still return to long positions after forming a false breakout in the support area of 1.1000, but I recommend buying euros immediately for a rebound only after updating the lows of 1.0982 and 1.0964. To open short positions on EURUSD, you need: Euro sellers may have serious problems and their task for the second half of the day is to form a false breakout in the resistance area of 1.1030, which will be the first signal to open short positions. Good data on the growth of the US economy can also provide only temporary support to the US dollar, after which the major players will begin to take profits at the end of the month. Only a real breakout and consolidation below the range of 1.1000 will push the pair to the lows of 1.0982 and 1.0964, where I recommend fixing the profits. In the scenario of EUR/USD growth above the resistance of 1.1030, it is best to postpone short positions until the highs of 1.1060 are updated or sell immediately for a rebound in the resistance area of 1.1088. Indicator signals: Moving Averages Trading is conducted with just 30 and 50 moving averages, which keeps the chance of a euro recovery. Bollinger Bands Breaking the lower border of the indicator around 1.1005 will lead to a decrease in the euro. Growth will only occur after the upper level of the indicator breaks in the area of 1.1030.
Description of indicators
|
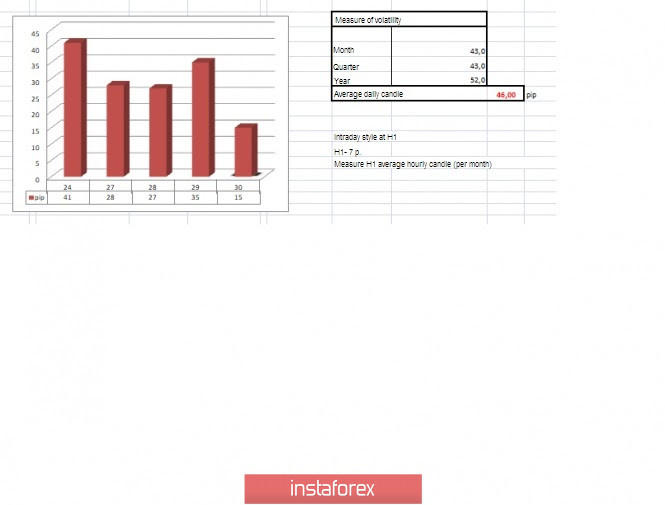
| Trading recommendations for EURUSD on January 30 Posted: 30 Jan 2020 05:05 AM PST From a complex analysis, we see a second attempt to break the psychological level of 1.1000, which was unsuccessful. The level stands firmly in place, and without unnecessary actions, accumulation is formed with extremely low activity. We are faced with a turning point, where there are more than enough people willing to accelerate, but there is no push for drastic actions yet. So it turns out that market participants are at a low start, where at the slightest inertia and fixation outside the set coordinates, sharp injections into the market will occur. Regarding the recovery theory, it all comes down to the second stage (1.1000), where there is extensive discussion. So, the opinions of traders are divided, some refer to a strong inertial move from the beginning of the new year, based on which sellers will be able to hold on and as a fact overcome the stage with the transition to the final stage of recovery relative to the oblong correction. Other traders point to repeated attempts to break the level on the history, which were not successful, the current fluctuation is not much different from the past and the probability of a rebound remains. Both judgments are correct but do not forget that levels are not eternal, and if you refer to the inertial move from the beginning of January, then we now have a conditional overheating of short positions, then why, with such a successful combination of circumstances, the price did not rebound from such a strong cardinal. Perhaps the four-month oblong correction has outlived its time and the moment has come for the restoration of the global downward trend. From volatility, we see that since the beginning of the trading week, activity has decreased significantly, which reflects the slowdown and as a fact accumulation, which is likely to lead to acceleration, if we refer to the patterns of market dynamics in general. (Daily variation: 28 points - Monday; 27 points - Tuesday; 35 points - Wednesday) Analyzing the past day by the minute, we see another V-shaped formation, where the first bar was in the interval of 02:30-16:00, and the second fell on the period of 16:30-21:30. As discussed in the previous review, traders are in standby mode, analyzing the behavior and price-fixing points relative to the coordinates of 1.0980 and 1.1040. Looking at the trading chart in general terms (the daily period), we see a downward trend set by the market in early 2018, in the structure of which an oblong correction from October 1, 2019, is developing. The global trend, which is more than 10 years old, is also a downward trend. The information and news background of the past day included the most important event of the week - the meeting of the Federal Reserve System, where the regulator predictably left the rate at the same level of 1.5-1.75%. The Committee believes that the current monetary policy is considered rational to support stable growth in the country's economy, a strong labor market, and to achieve the inflation target. "When determining the timing and size of future adjustments to the target range of interest rates on federal credit funds, the Committee will assess both the already implemented and expected economic conditions in comparison with the target indicators: maximum employment and inflation at the level of 2%. This assessment will take into account a wide range of information, including indicators of labor market conditions, indicators of inflationary pressure and inflation expectations, as well as data on financial and international events," the FOMC document notes. It is worth noting that the Committee and its head so masterly scrolled comments and wording of monetary policy that they did not answer any question of concern to investors, and what's next? Given such a strong silence in terms of further actions and the preservation of all that was known at the previous meeting, the market did not react in any way, or rather, hid in ambiguity. Today, in terms of the economic calendar, we have already received data on the unemployment rate in Europe, where we recorded a decline from 7.5% to 7.4%, which did not affect the single currency. In the second half of the day, we are waiting for data on applications for unemployment benefits in the United States, where no changes are expected, primary +6 thousand, repeated -6 thousand. Further development Analyzing the current trading chart, we see a persistent stagnation within the psychological level of 1.1000, where the accumulation limits are still unchanged at 1.0990/1.1027. This stability is a bit frightening, because at the slightest preponderance of trading forces, there may be a surge in the market, which may be local, but a lot of trading volumes will drown in it. It doesn't make much sense to say that the level of 1.1000 will be broken or will not be broken since you can earn first of all on the breakdown of accumulation, regardless of the main course. After the flight, we will talk with you about the great and strategic moves, but in the meantime, we earn profits. In terms of the emotional component of the market, we see the high speculative interest that is on the verge of being published. In turn, traders are waiting for the go-ahead as soon as the price breaks through the accumulation boundaries and reaches the specified coordinates of the start of trading positions. It is likely to assume that there is not much time left to wait, and if we analyze the correlated GBPUSD pair, we will see that everyone is waiting, and not only for the euro. Thus, as soon as there is an increase, it will be reflected everywhere, and one will pull the other. The trading strategy remains the same, we sit outside the market and wait for solid exits from the accumulation, where the key coordinates are the values of 1.0980 – sell and 1.1040 – buy. In this context, we are talking about fixing the price, not a shadow puncture. Based on the above information, we will output trading recommendations: - Buy positions will be considered in the event of a breakdown of the accumulation and fixing the price higher than 1.1040. - Sell positions are considered if the downward interest is held and the price is fixed below 1.0980, without the shadow piercing the candle. The perspective of the move is located in the following stages: #3/1-1.0950 and #3/2-1.0879. Indicator analysis Analyzing different sectors of timeframes (TF), we see that due to persistent accumulation, the indicator analysis produces a multidirectional signal relative to the minute and hour periods. In turn, the daily sections still retain downward interest. Volatility for the week / Volatility Measurement: Month; Quarter; Year. The volatility measurement reflects the average daily fluctuation, based on the calculation for the Month / Quarter / Year. (January 30 was based on the time of publication of the article) The volatility of the current time is 15 points, which is extremely low for this period. It is likely to assume that due to the breakdown of accumulation, we will see a sharp acceleration in volatility. Key levels Resistance zones: 1.1000***; 1.1080**; 1.1180; 1.1300**; 1.1450; 1.1550; 1.1650*; 1.1720**; 1.1850**; 1.2100. Support zones: 1.1000***; 1.0900/1.0950**;1.0850**; 1.0500***; 1.0350**; 1.0000***. * Periodic level ** Range level *** Psychological level ***** The article is based on the principle of conducting a transaction, with daily adjustments. The material has been provided by InstaForex Company - www.instaforex.com |
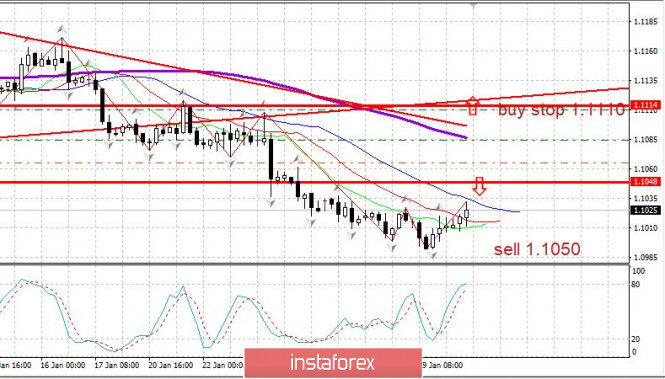
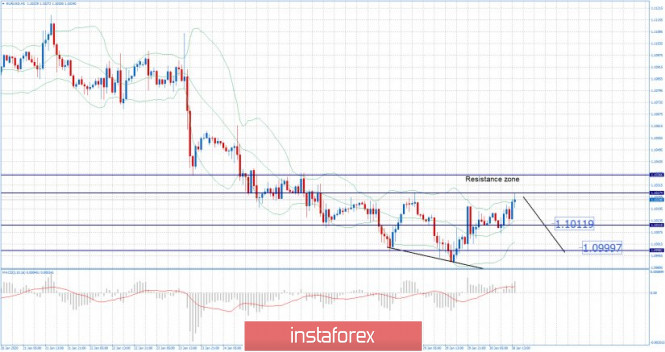
| Posted: 30 Jan 2020 04:38 AM PST EUR has been trading upwards after the BOE Statement. The EURR found sellers at the main pivot resistance at 1.1027, which is sign that buying at this stage look risky. My advice is to watch for topping formation on intraday frames to confirm downside rotation and possible test of 1.1012 and 1.1000.
MACD oscillator is showing positive reading Resistance levels are set at the price of 1.1027 and 1.1036 Support levels and downward targets are set at the price of 1.1011 and 1.1000. The material has been provided by InstaForex Company - www.instaforex.com |
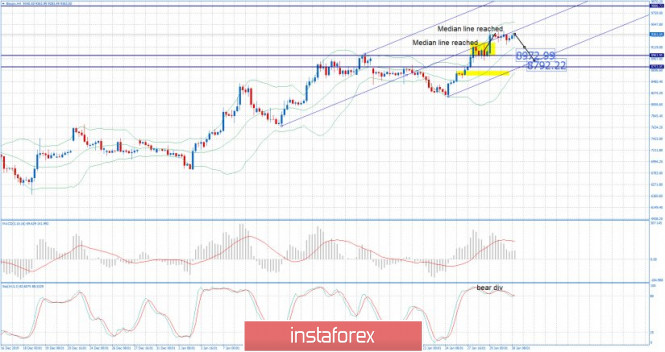
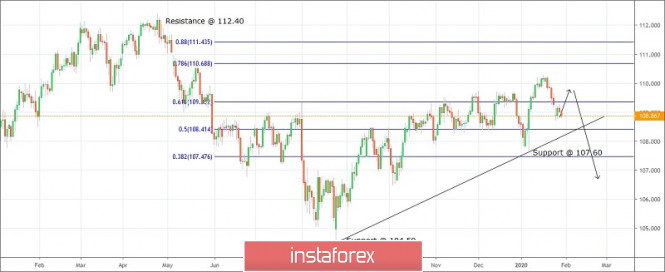
| Trading plan for USDJPY for January 30, 2020 Posted: 30 Jan 2020 04:28 AM PST
Technical outlook: USDJPY has reversed lower from 110.30 levels just above the Fibonacci 0.618 retracement of the previous drop between 112.40 and 104.50 levels respectively. A drop below the counter trend line and 107.60 would certainly confirm that USDJPY has reversed for good. Please note that the overall bearish structure would remain intact until major resistance at 112.40 holds. The counter trend rally is likely to complete at 110.30 and the bearish trend is expected to resume, pushing prices below 104.50 levels. Aggressive traders may initiate shorts around current levels with risk above 110.30, while conservative traders should remain flat and allow USDJPY price to break below 107.60. Thus, sell on rallies towards 109.50/60 levels. Trading plan: Aggressive: Short @ 108.80/85 and 109.60, stop @ 110.70 target is open Good luck! The material has been provided by InstaForex Company - www.instaforex.com |
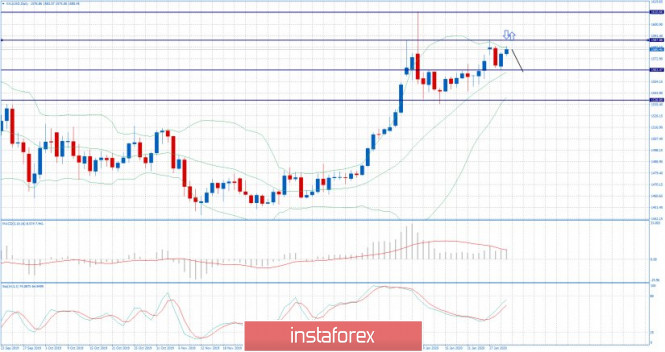
| Posted: 30 Jan 2020 04:25 AM PST Gold has been trading upwards. The price tested the level of $1.580 (Top of the daily Bollinger band), which is indication that buying looks risky. My advice is to watch for selling opportunities due to major pivot resistance at $1.587.
The rejection of the top of the Bollinger band is the key today's price action. My advice is to watch for selling opportunities on the rallies using intraday-frames 5/15 minutes. MACD oscillator is showing positive reading but the slow line is still on the downside. Resistance levels are set at the price of $1.581 and $1.588 Support levels and downward targets are set at the price of $1.563 and $1.538. The material has been provided by InstaForex Company - www.instaforex.com |
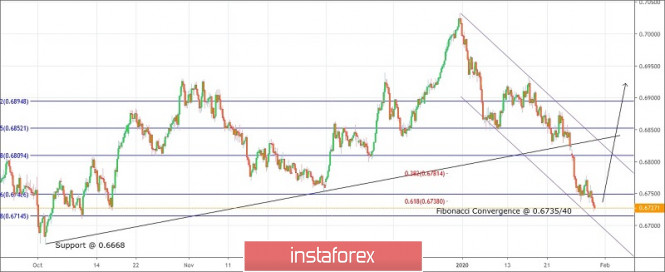
| Trading plan for AUD/USD for January 30, 2020 Posted: 30 Jan 2020 04:05 AM PST
Technical outlook: AUD/USD has printed yet another intraday low at 0.6722. The pair is seen to be trading at 0.6727 at this point in writing. The fibonacci convergence at 0.6635 is still trapped within the trading range for a bullish reversal here. It is not shown on the chart here but the RSI is showing extreme bullish divergence as well. Furthermore, the drop from 0.7031 levels is looking to have hit fibonacci support at 0.6740 earlier. All the above facts signal a potential bullish reversal from the current price action. A break above 0.6765 would confirm that a meaningful low is in place at 0.6762. The overall structure should continue to remain bullish as long as the price stays above 0.6668 lows pf October 2019. Only a consistent break below that support would threaten the proposed bullish targets at 0.7200. Trading plan: Remain long, stop @ 0.6668 and target is 0.7200. Good luck! The material has been provided by InstaForex Company - www.instaforex.com |
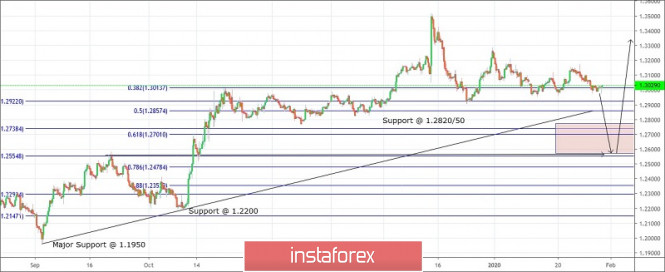
| Trading plan for GBP/USD for January 30, 2020 Posted: 30 Jan 2020 03:47 AM PST
Technical outlook: GBP/USD is trading in a narrow range, waiting to a break lower towards the 1.2550/1.2750 support zone marked here. Please note that the entire rally between 1.1950 and 1.3515 could be retraced up to 61.8% before resuming its rally. The counter-trend has completed 2 corrective waves within the ideal 3-wave drop. Ideally, another drop below 1.2900 would be required to complete the correction here. As discussed earlier, please note that the previous resistance which turned into support and 61.8% fibonacci retracement is seen towards 1.2550 levels. A bullish bounce remains a high probability if prices manage to reach there. Another probable bounce is seen towards the 1.2850 levels with its immediate support as well. Please wait for a drop below 1.2900 levels within the above zone to open long positions, targeting 1.4200 and higher. Trading plan: Remain flat for now. Buy between 1.2550/1.2750, stop @ 1.1950 and target is open. Good luck! The material has been provided by InstaForex Company - www.instaforex.com |


| You are subscribed to email updates from Forex analysis review. To stop receiving these emails, you may unsubscribe now. | Email delivery powered by Google |
| Google, 1600 Amphitheatre Parkway, Mountain View, CA 94043, United States | |
No comments:
Post a Comment