Forex analysis review |
- Weekly USDJPY analysis
- Weekly EURUSD analysis
- Ichimoku cloud indicator short-term analysis of Bitcoin for January 4, 2020
- Gold price creates condition for a move to $1,600
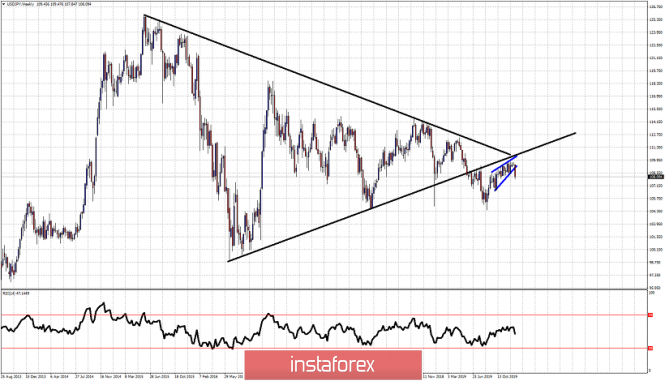
| Posted: 04 Jan 2020 01:05 AM PST USDJPY has broken down below the upward sloping wedge pattern we have noted in our previous posts. The bearish warning signs we mentioned have been confirmed and price has pulled back from 109.70 to 108.
Blue lines -wedge pattern broken If we zoom out and see where price reversed relative to the bigger picture something worrying for bulls arises. On a weekly basis we see price having broken the long-term triangle pattern. This was a major bearish signal. Price did not break below the 104.80 horizontal support and bounced. Price reached the broken triangle pattern from below but got rejected. Price formed a wedge pattern as we saw in previous posts and has now broken this pattern as well to the downside. This bounce towards the lower triangle boundary and rejection is a bearish sign. This increases the chances of a move back towards 104-105 specially as long as price is below 109.70. Key resistance remains at 109.70. I remain bearish as long as price is below that level. The material has been provided by InstaForex Company - www.instaforex.com |
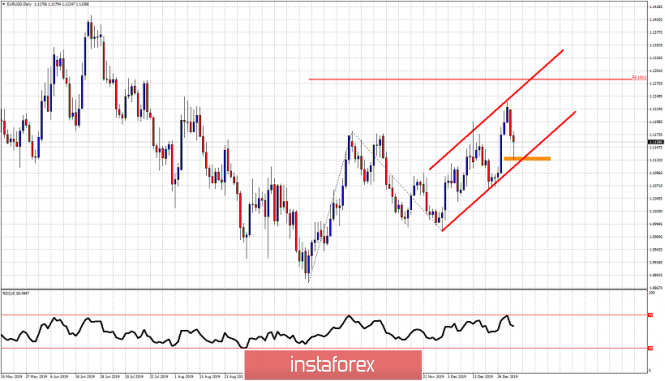
| Posted: 04 Jan 2020 01:00 AM PST EURUSD is in a bullish trend. Last week's low is very important for the continuation of the bullish trend. EURUSD has so far been making higher highs and higher lows. In order to reach our 1.1280 target we need to see price stay inside the bullish channel.
Orange rectangle -major support EURUSD is in a bullish trend. The orange rectangle area where the low of last week is found should hold if bulls want to continue to be in control of the trend. Staying inside the bullish channel is crucial. So bulls do not want to see price break below 1.1120-1.11. Resistance is at 1.12-1.1235 and breaking above it will open the way for a move towards 1.13. However it is possible that we have a sideways move this coming week before moving higher. The RSI has still not reached overbought levels and I believe there is still room to the upside for EURUSD. The material has been provided by InstaForex Company - www.instaforex.com |
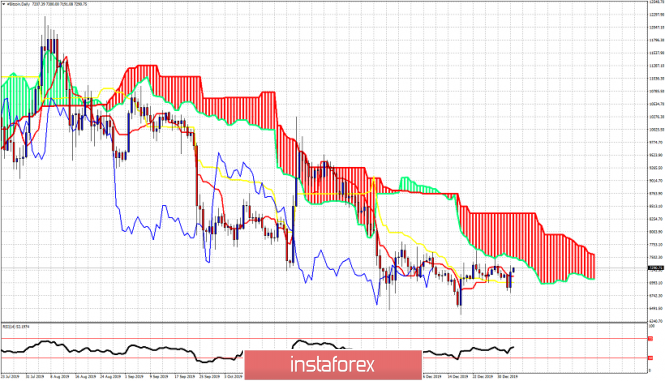
| Ichimoku cloud indicator short-term analysis of Bitcoin for January 4, 2020 Posted: 04 Jan 2020 12:56 AM PST BTCUSD remains in a bearish trend. Price is below the Ichimoku cloud however we can observe bullish reversal signals in the RSI. If these signals are combined with a break above cloud resistance we could have the start of a trend reversal in BTCUSD.
|
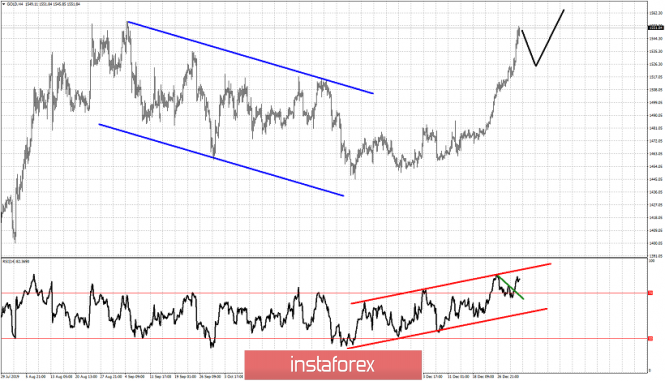
| Gold price creates condition for a move to $1,600 Posted: 04 Jan 2020 12:49 AM PST Gold price gave us some warning reversal signs last week when it was trading around $1,530. However these warning signs never gave reversal sign as the bearish divergence was canceled by the strength of the move in price this last Friday. The strength of the move has indicated that more upside should be expected.
Red channel - new bullish move Black line - expected path Green line - RSI divergence (canceled) As we explained in previous posts, the pull back in Gold price from August to September was just a pause to the bigger upward trend. This was a corrective phase. Now price is in a new bullish phase as the RSI suggests inside the red channel. This past week we warned bulls to be cautious in case the RSI got rejected once again at the green resistance line. However this was not the case as bulls were too strong and the RSI price broke above the green line giving new higher highs. This was a sign of strength. This does not mean that Gold can continue this parabolic run forever. Traders need to be cautious still. A pull back towards $1,515 is justified and could provide another opportunity to go long before reaching $1,600. Trend remains bullish as we have noted after recapturing $1,490-$1,500. This is not the time to bet against the trend but wait patiently for any pull back as a buying opportunity. The material has been provided by InstaForex Company - www.instaforex.com |
| You are subscribed to email updates from Forex analysis review. To stop receiving these emails, you may unsubscribe now. | Email delivery powered by Google |
| Google, 1600 Amphitheatre Parkway, Mountain View, CA 94043, United States | |


No comments:
Post a Comment