Forex analysis review |
- Forecast for EUR/USD on January 10, 2020
- Forecast for GBP/USD on January 10, 2020
- Forecast for USD/JPY on January 10, 2020
- Fractal analysis for major currency pairs on January 10
- Comprehensive analysis of movement options for #USDX vs EUR/USD vs GBP/USD vs USD/JPY (DAILY) in January 2020
- Fractal analysis for major currency pairs on January 9
- GBP/USD. January 9. Results of the day. Mark Carney allowed a reduction in the key rate, which everyone has been waiting
- EUR/USD. January 9. Results of the day. Trump's surprising response to Iran. China and the US to sign a trade agreement on
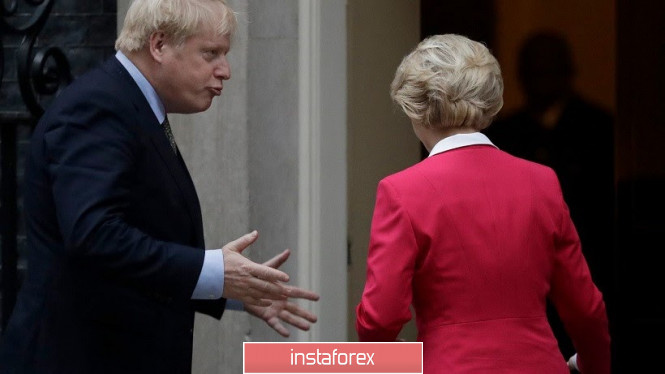
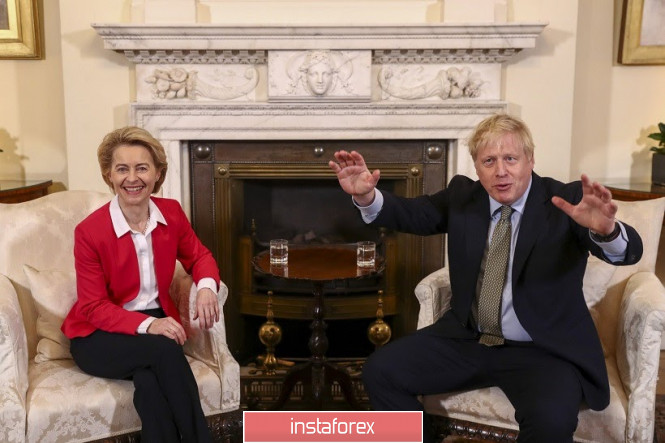
- GBP/USD. Johnson's first meeting with Ursula von der Leyen was disappointing, but short positions look risky
- GBP/USD: pound continues to follow policy
- GBPUSD and EURUSD: Carney said the BoE is ready to lower interest rates in 2020. German industrial production growth did
- Short-term Elliott wave analysis on GBPUSD
- Bitcoin gets rejected at resistance
- Weekly Gold analysis
- January 9, 2020 : GBP/USD Intraday technical analysis and trade recommendations.
- January 9, 2020 : EUR/USD Intraday technical analysis and trade recommendations.
- Evening review EURUSD 01/09/2020
- BTC analysis for 01.09.2020 - Potential big sell off is coming, fist target at $6.500
- GBP/USD 01.09.2020 - First downside target reached at 1.3050 but potential for further upside continuation
- Gold 01.09.2020 - Strong upward trend in the background and potential for re-test of $1.600
- Technical analysis of EUR/USD for January 09, 2020
- Technical analysis and forecast for AUD/USD for January 9, 2020
- EUR/USD. January 9. Two new medium-term trading ideas
- GBP/USD. January 9. The third sales signal has been received. Prospect – 1.2900
- Trading recommendations for GBPUSD for January 9, 2020
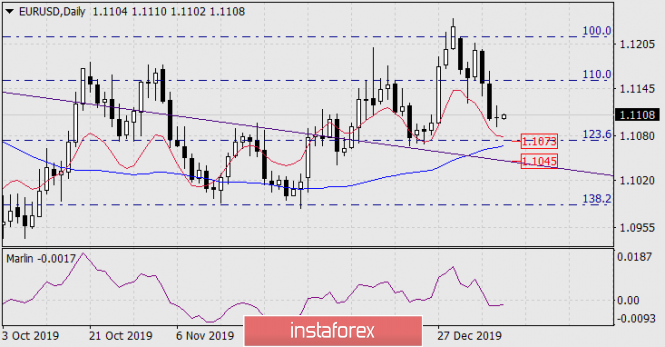
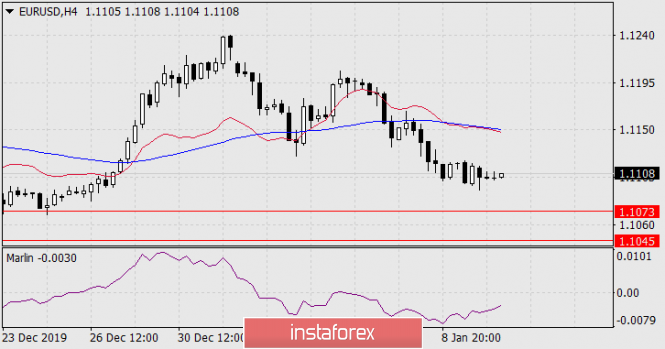
| Forecast for EUR/USD on January 10, 2020 Posted: 09 Jan 2020 07:09 PM PST EUR/USD Yesterday, the euro closed the day at the level of its opening, which, on the one hand, can be taken for consolidation before a further decline, and on the other hand, a stop before a reversal, since important data on US employment will be published today. A statement by President Trump about the refusal to forcefully resolve the conflict with Iran briefly increased risk appetite in the stock market. The S&P 500 grew by 0.44% on Wednesday while it climbed by 0.67% yesterday as a new record was established (3275). Yields on US government bonds after a sharp increase on Wednesday remain at the same level. This is still a sign of the extinction of unexpected political optimism and, as a consequence, the further strengthening of the dollar. But if the stock market continues to ramp up, the dollar will weaken. We do not expect the euro to turn into medium-term growth, but risk appetites will affect the depth of the upward correction. From this perspective, today's US employment data is particularly important. The forecast for Non-Farm Employment Change for December is 162 thousand after the November figure of 266 thousand. Our calculation on the basis of weekly unemployment applications gives a comparable figure of 155-170 thousand. If the November indicator is revised downward, which is very likely from similar calculations (approximately up to 210 thousand), then the obtained values will be optimal for continued growth in the stock market, but insufficient for the risky growth of the euro. In this scenario, which we take as the main one, we expect the euro to fall further to the nearest target of 1.1073 - to the point of coincidence of the Fibonacci level of 123.6% with the MACD line on the daily chart. Considering yesterday's market indecision, we question if the targeted support of 1.1073 and the price completion of the blue line of the price channel at the level of 1.1045 can be overcome, as previously thought. Such indecision of the market is also indicated by the Marlin oscillator, which lies in a horizontal trend. On the four-hour chart, the Marlin oscillator indicates a slight desire to correct the market up. In general, the mood on this chart remains down. Next week we can see the correctional growth of the euro, the height of which will depend on the new incoming data, primarily political. Forecasts on macroeconomic data for the next week in favor of the dollar (increase in inflation indices in the US and worsening trade balance in the eurozone). The material has been provided by InstaForex Company - www.instaforex.com |
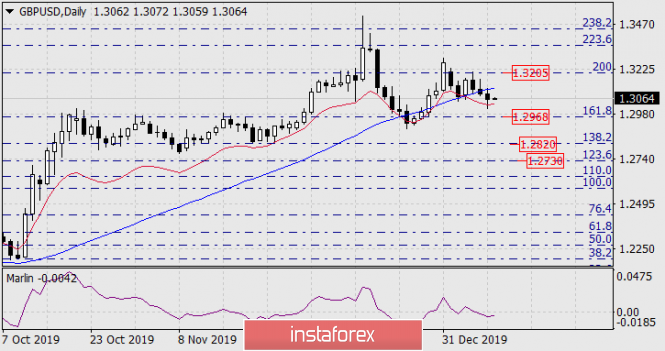
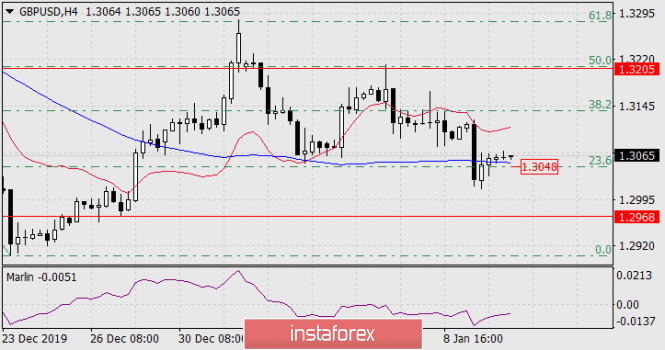
| Forecast for GBP/USD on January 10, 2020 Posted: 09 Jan 2020 07:05 PM PST GBP/USD The British pound lost 30 points on Thursday. The price consolidated below the MACD line on the daily chart. The signal line of the Marlin oscillator is falling in the negative trend zone, but not due to the strong dynamics of the pound's decline, the balance indicator line (red) continues to hold the price, further slowing its decline. The continuation of such a tendency - a decrease in the British pound will lead to an increase in bullish sentiment, the market can take advantage of such confusion. Data on US employment will be published today, the forecast for new jobs in the non-agricultural sector for December is 162 thousand, this may be an incentive to further pull down the pound to the Fibonacci level of 161.8% at the price of 1.2968. But even in this case, the pound's decline rate may not be enough to overcome the balance indicator line. If it also remains below the price by the opening of Monday, then the correction of the British pound is possible next week. The 1.2968 level is technically strong. On the four-hour chart, the price consolidated below the MACD line yesterday - one candle with the whole body was under this line, but at the moment the price is already above the MACD line. Such a false signal is also a sign of a short downward movement, if any (to our target 1.2968). The Marlin oscillator is moving after the price, it is not providing signals. Another price consolidation below the MACD line, as well as under the correction level of 23.6%, will open the nearest target at 1.2968. To move the price to lower targets (1.2820, 1.2730), which are marked on the daily scale, you need a rapid movement of the price down today. The material has been provided by InstaForex Company - www.instaforex.com |
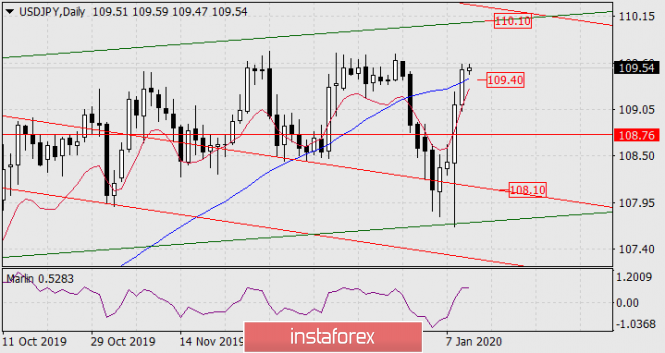
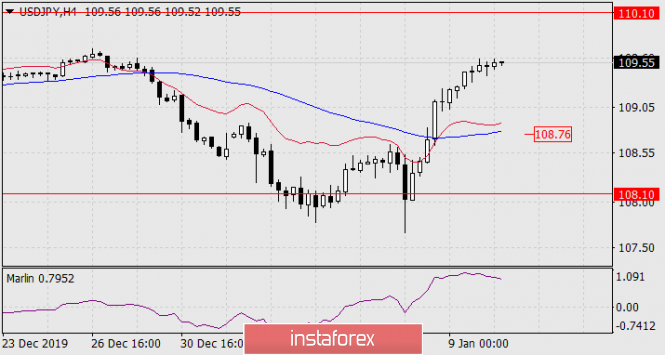
| Forecast for USD/JPY on January 10, 2020 Posted: 09 Jan 2020 07:02 PM PST USD/JPY The USD/JPY pair has risen by 190 points over the past two days and this raises the question: what was stronger - the fear of a stock market decline with the threat of a US war with Iran or the belief in the stock market growth on Trump's desire to win the presidential election for the second time. We believe that investor pragmatism will prevail and they will be more cautious in conclusions, because in the end the stock market grew not so much from Trump's energy, but from the desire of investors themselves to invest company profits in the purchase of their own shares. Now they don't have such a desire, since the middle of 2019 there has been a large players exit the market and the "housewives" are connecting to the game, which always happens before major market falls. Large investors doubt Trump's victory for the second time, and during the year we can receive more clear signals about his weak political positions. Such signals came, in fact, all the time he was in office. From technical positions, the price is above the MACD line on the daily chart, but to consolidate the price, you need to close the current candle above this support. The Marlin oscillator is in a growing position, target at 110.10 - the line of the ascending green channel is open. The return of the price under the MACD line (below 109.40) may subsequently turn the price down to support the red price channel in the region of 108.10. The situation is completely upward on the H4 chart. Pressure from the higher timeframe (price drift below 109.40) will direct the quote to the MACD line at 108.76. This will be the first goal on the way to 108.10. So, USD/JPY continues to grow, but it must be taken carefully. The material has been provided by InstaForex Company - www.instaforex.com |
| Fractal analysis for major currency pairs on January 10 Posted: 09 Jan 2020 06:05 PM PST Forecast for January 10: Analytical review of currency pairs on the scale of H1:
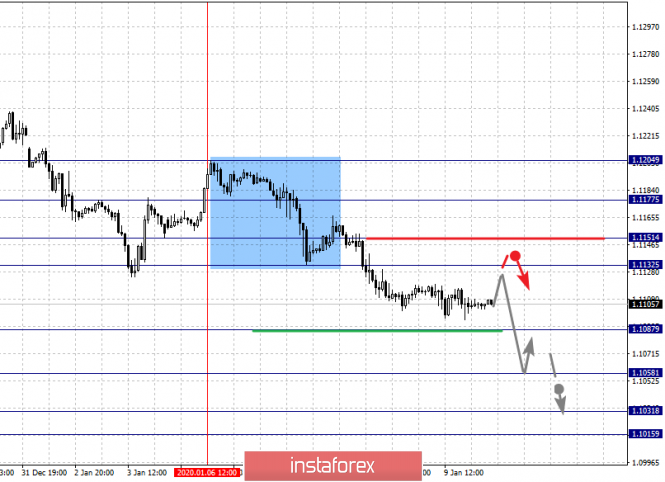
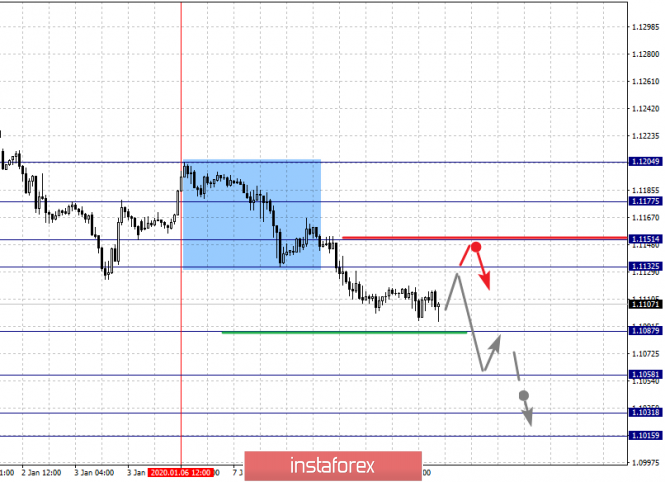
For the euro / dollar pair, the key levels on the H1 scale are: 1.1177, 1.1151, 1.1132, 1.1087, 1.1058, 1.1031 and 1.1015. Here, we continue to monitor the local descending structure of January 6. The continuation of the downward movement is expected after the breakdown of the level of 1.1087. In this case, the target is 1.1058. Price consolidation is near this level. The breakdown of the level of 1.1056 will lead to movement to a potential target - 1.1015. In turn, price consolidation is in the range of 1.1015 - 1.1031 and from here, we expect a rollback to the top. Short-term upward movement is possible in the range of 1.1132 - 1.1151. The breakdown of the latter value will lead to an in-depth correction. Here, the goal is 1.1177. This level is a key support for the downward structure. The main trend is the local descending structure of January 6 Trading recommendations: Buy: 1.1132 Take profit: 1.1150 Buy: 1.1153 Take profit: 1.1175 Sell: 1.1085 Take profit: 1.1060 Sell: 1.1056 Take profit: 1.1034
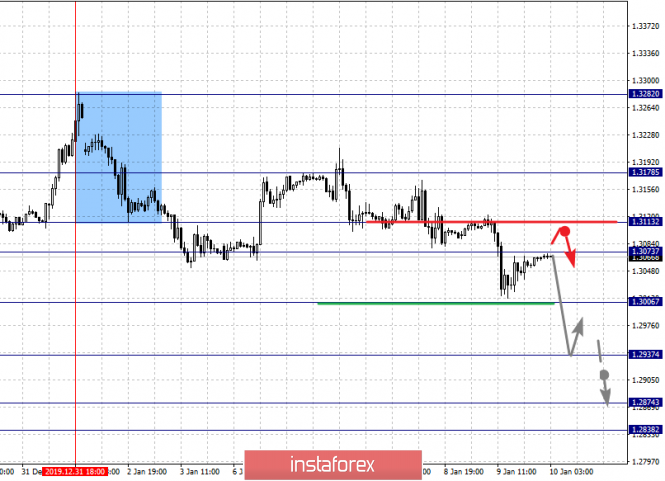
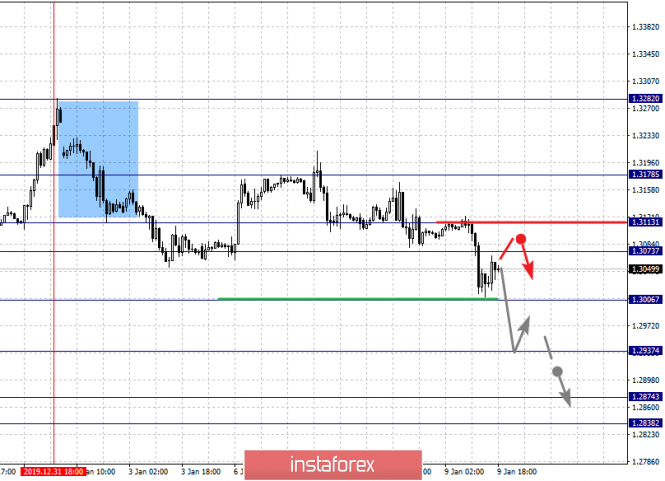
For the pound / dollar pair, the key levels on the H1 scale are: 1.3178, 1.3113, 1.3073, 1.3006, 1.2937, 1.2874 and 1.2838. Here, we consider the descending cycle of December 31 as the main structure. We expect further downward movement after a breakdown of the level of 1.3006. In this case, the target is 1.2937. Price consolidation is near this level. Its breakdown will lead to a movement to a potential target - 1.2838. Price consolidation is in the range of 1.2838 - 1.2874 and from here, we expect a correction. Short-term upward movement is possible in the range of 1.3073 - 1.3113. The breakdown of the latter value will lead to an in-depth correction. Here, the target is 1.3178. This level is a key support for the descending structure of December 31. The main trend is the descending structure of December 31 Trading recommendations: Buy: 1.3073 Take profit: 1.3111 Buy: 1.3120 Take profit: 1.3175 Sell: 1.3005 Take profit: 1.2940 Sell: 1.2935 Take profit: 1.2875
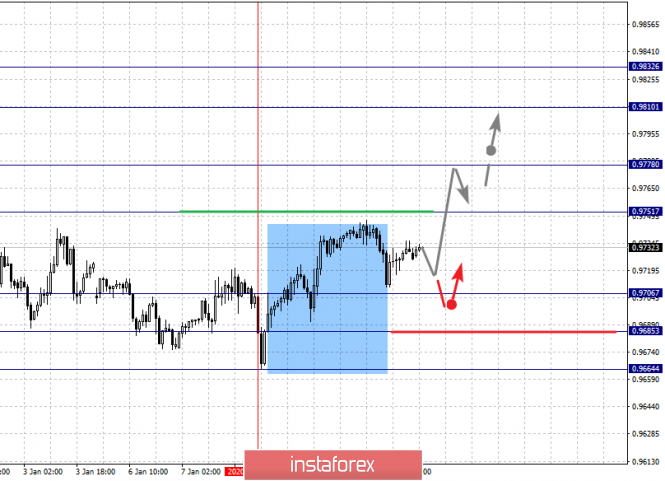
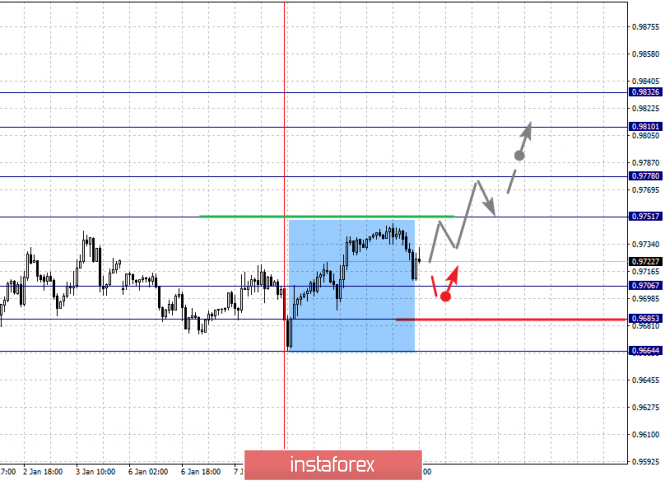
For the dollar / franc pair, the key levels on the H1 scale are: 0.9832, 0.9810, 0.9778, 0.9751, 0.9706, 0.9685 and 0.9664. Here, we determine the next goals from the local ascending structure on January 8. The continuation of the movement to the top is expected after the breakdown of the level of 0.9751. In this case, the target is 0.9778. Price consolidation is near this level. The breakdown of the level of 0.9780 will lead to a pronounced movement. Here, the target is 0.9810. For the potential value for the top, we consider the level of 0.9832, upon reaching which, we expect consolidation, as well as a pullback to the bottom. Short-term downward movement is possibly in the range of 0.9706 - 0.9685. There is a high probability of a reversal to the top from this range. The breakdown of the level of 0.9685 will lead to the development of a downward structure. Here, the first potential target is 0.9664. The main trend is the local ascending structure of January 8 Trading recommendations: Buy : 0.9751 Take profit: 0.9775 Buy : 0.9780 Take profit: 0.9810 Sell: 0.9705 Take profit: 0.9688 Sell: 0.9683 Take profit: 0.9664
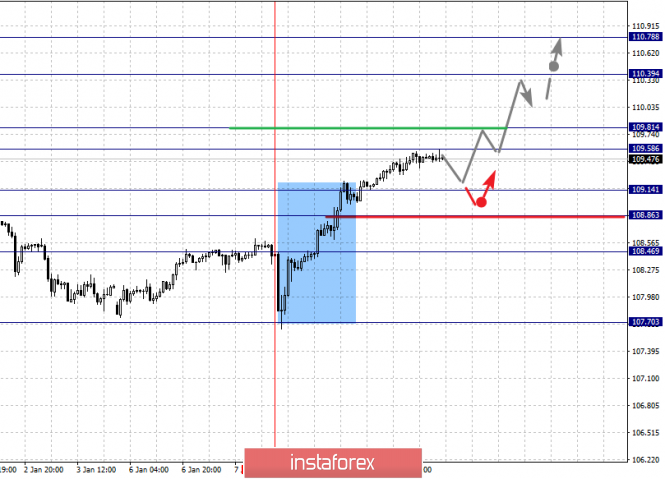
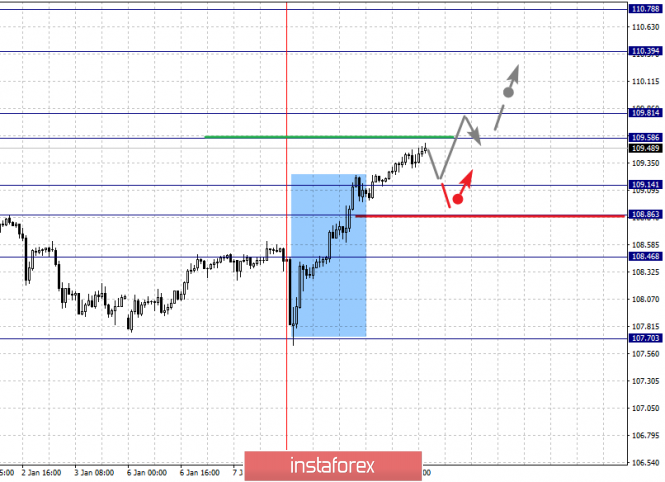
For the dollar / yen pair, the key levels on the scale are : 110.78, 110.39, 109.81, 109.58, 109.14, 108.86 and 108.46. Here, we are following the formation of a pronounced ascending structure of January 8. Short-term upward movement is expected in the range of 109.58 - 109.81. The breakdown of the last value should be accompanied by an impulsive movement to the level of 110.39. Price consolidation is near this level. For the potential value for the top, we consider the level of 110.78, from which we expect a pullback to the bottom. Short-term downward movement is possible in the range 109.14 - 108.86. The breakdown of the last value will lead to an in-depth correction. Here, the target is 108.46. This level is a key support for the top. The main trend: building potential for the top of January 8. Trading recommendations: Buy: 109.58 Take profit: 109.80 Buy : 109.83 Take profit: 110.30 Sell: 109.14 Take profit: 108.88 Sell: 108.82 Take profit: 108.50
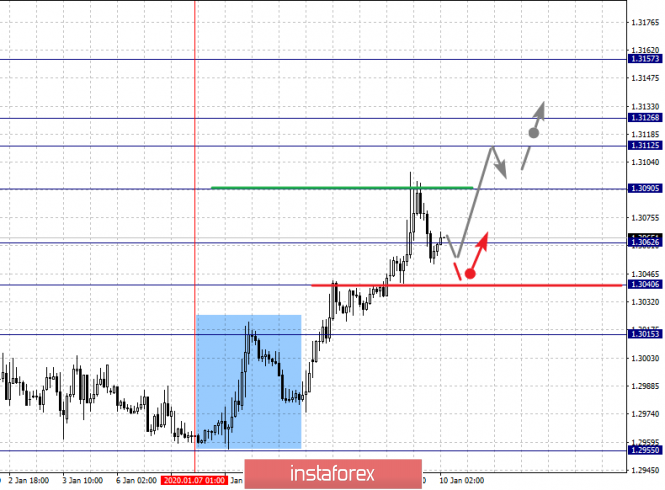
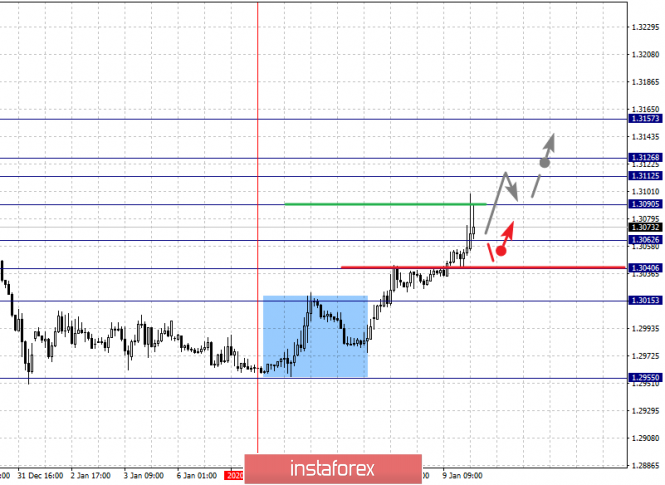
For the Canadian dollar / US dollar pair, the key levels on the H1 scale are: 1.3157, 1.3126, 1.3112, 1.3090, 1.3062, 1.3040 and 1.3015. Here, we are following the development of the upward cycle of January 7. We expect further upward movement after the breakdown of the level of 1.3090. In this case, the target is 1.3112. Price consolidation is in the range of 1.3112 - 1.3126. We consider the level of 1.3157 to be a potential value for the top; upon reaching this level, we expect a pullback to the bottom. Short-term downward movement is possible in the range of 1.3062 - 1.3040. The breakdown of the last value will lead to an in-depth correction. Here, the target is 1.3015. This level is a key support for the top. The main trend is the upward cycle of January 7 Trading recommendations: Buy: 1.3090 Take profit: 1.3112 Buy : 1.3126 Take profit: 1.3155 Sell: 1.3062 Take profit: 1.3042 Sell: 1.3038 Take profit: 1.3015
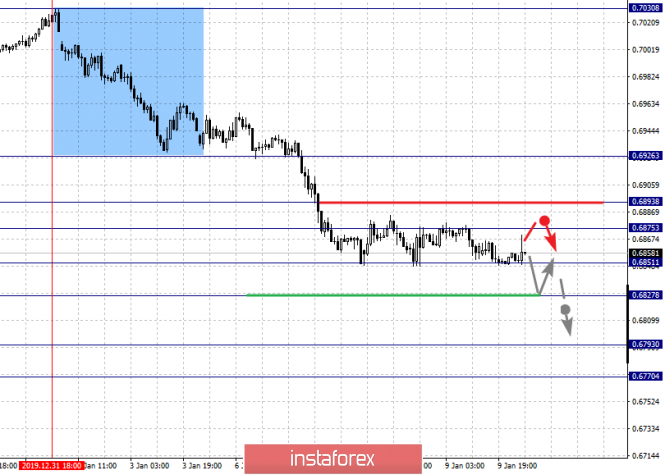
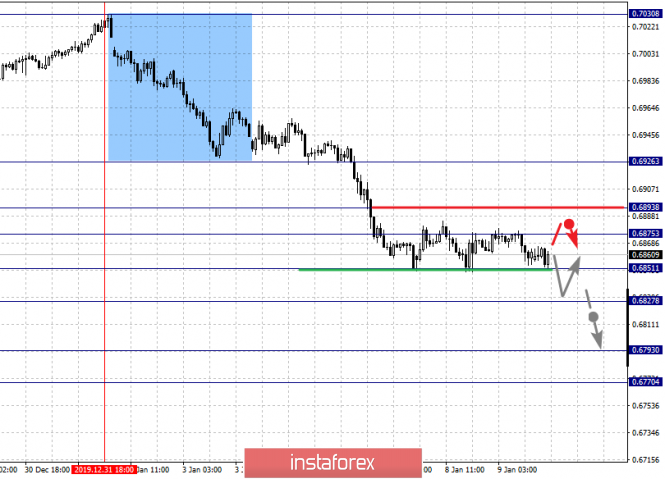
For the Australian dollar / US dollar pair, the key levels on the H1 scale are : 0.6926, 0.6893, 0.6875, 0.6851, 0.6827, 0.6793 and 0.6770. Here, we continue to monitor the development of the downward cycle of December 31. We expect a short-term downward movement in the range 0.6851 - 0.6827. The breakdown of the last value should be accompanied by a pronounced downward movement. In this case, the target is 0.6793. For the potential value for the bottom, we consider the level of 0.6770. Upon reaching this level, we expect consolidation, as well as a rollback to the top. Short-term upward movement is expected in the range 0.6875 - 0.6893. The breakdown of the latter value will lead to an in-depth correction. Here, the target is 0.6926. This level is a key support for the descending structure of December 31. The main trend is the descending structure of December 31 Trading recommendations: Buy: 0.6875 Take profit: 0.6890 Buy: 0.6895 Take profit: 0.6922 Sell : 0.6850 Take profit : 0.6830 Sell: 0.6825 Take profit: 0.6795
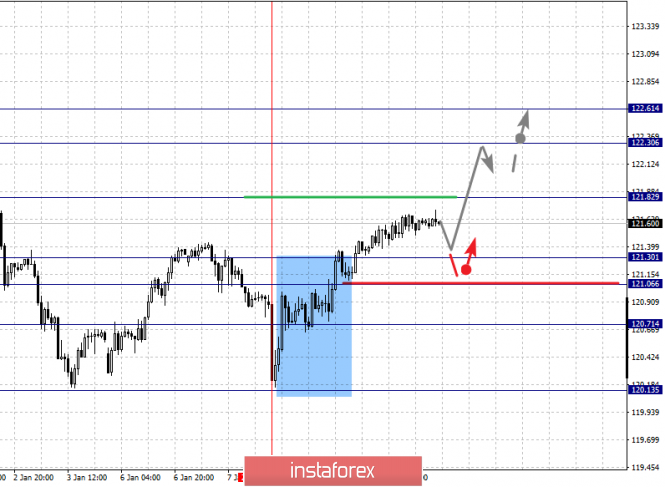
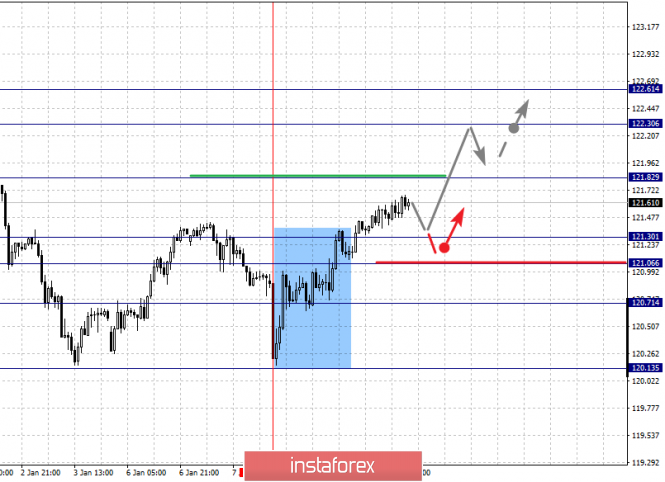
For the euro / yen pair, the key levels on the H1 scale are: 122.61, 122.30, 121.82, 121.30, 121.06 and 120.71. Here, we are following the formation of the initial conditions for the upward cycle of January 8. We expect the continuation of the upward movement after the breakdown of the level of 121.82. In this case, the target is 122.30. For now, we consider the level of 122.61 to be a potential value for the upward trend; upon reaching this level, we expect consolidation. Short-term downward movement is possible in the range of 121.30 - 121.06. The breakdown of the last value will lead to an in-depth correction. Here, the goal is 120.71. This level is a key support for the upward structure. The main trend is the formation of initial conditions for the top of January 8 Trading recommendations: Buy: 121.82 Take profit: 122.26 Buy: 121.32 Take profit: 122.60 Sell: 121.30 Take profit: 121.08 Sell: 121.04 Take profit: 120.76
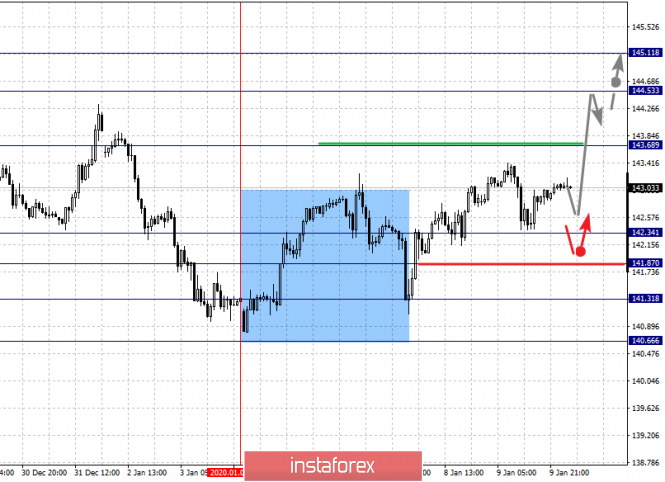
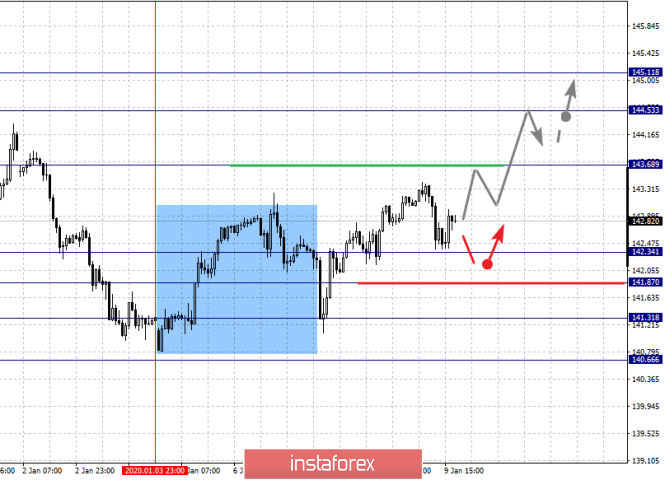
For the pound / yen pair, the key levels on the H1 scale are : 145.11, 144.53, 143.68, 142.34, 141.87, 141.31 and 140.66. Here, we are following the development of the upward structure of January 3, after the abolition of the downward trend. We expect further upward movement after the passage at the price level of 143.70. In this case, the target is 144.53. Price consolidation is near this value. For the potential level for the top, we consider level 145.11, from which we expect a pullback to the bottom. Short-term downward movement is possible in the range of 142.34 - 141.87. The breakdown of the latter value will lead to an in-depth correction. Here, the goal is 141.31. This level is a key support for the upward structure. The main trend is the upward structure of January 3 Trading recommendations: Buy: 143.70 Take profit: 144.50 Buy: 144.55 Take profit: 145.10 Sell: 142.34 Take profit: 141.90 Sell: 141.85 Take profit: 141.35 The material has been provided by InstaForex Company - www.instaforex.com |
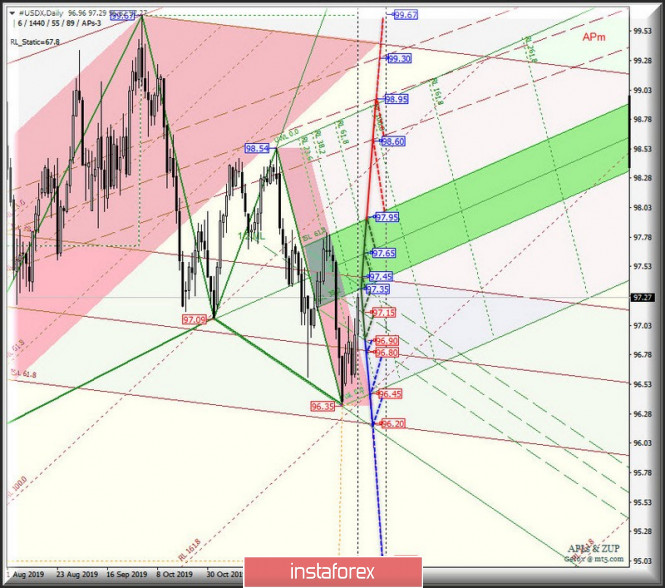
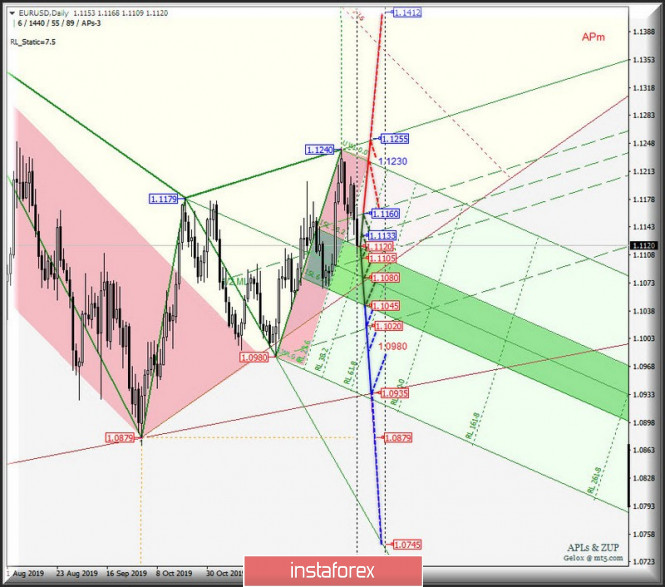
| Posted: 09 Jan 2020 04:12 PM PST 2020 has started - what surprises could be in January? Here's a comprehensive analysis of movement options for #USDX vs EUR/USD vs GBP/USD vs USD/JPY (DAILY) for January 2020 Minor operational scale (daily time frame) ____________________ US dollar Index The movement of the #USDX dollar index for January 2020 will be determined by developing the boundaries of the 1/2 Median Line channel (97.35 - 97.15 - 96.90) and the equilibrium zone (97.35 - 97.65 - 97.95) of the Minuette operational scale. The markup is presented on the animated chart. The breakdown of the upper boundary ISL61.8 (resistance level of 97.95) of the equilibrium zone of the Minuette operational scale forks will confirm the continuation of the upward movement of the dollar index to the boundaries of the 1/2 Median Line channel (98.60 - 98.95 - 99.30) of the Minor operational scale forks. The breakdown of the support level of 96.90 on the lower boundary of the 1/2 Median Line Minuette channel together with the breakdown of the 1/2 Median Line Minor (96.80) is a variant of the development of the downward movement #USDX to the targets: - initial SSL line (96.45) of the Minuette operational scale forks; - lower boundary of ISL61.8 (96.20) of the equilibrium zone of the Minor operational scale forks. The markup of #USDX movement options in January 2020 is shown on the animated chart. ____________________ Euro vs US dollar For January 2020, the development of the movement of the single European currency EUR / USD will also be due to the development and direction of the breakdown of the boundaries of the 1/2 Median Line channel (1.1160 - 1.1133 - 1.1105) and the equilibrium zone (1.1120 - 1.1080 - 1.1045) of the Minuette operational scale forks. The markup is presented on the animated chart. The breakdown of the support level 1.1045 on the lower boundary of the ISL61.8 equilibrium zone of the Minuette operational scale forks will make it possible to continue the downward movement of the single European currency to the goals: - the final Schiff Line Minuette (1.1020); - local minimum (1.0980); - LTL control line (1.0935) of the Minor operational scale forks. The breakdown of the resistance level of 1.1160 (the upper boundary of the 1/2 Median Line Minuette channel) is an option to continue the development of the upward movement of EUR / USD to the initial SSL (1.1230) and the control UTL (1.1255) lines of the Minuette operational scale forks. The details of the EUR / USD movement options in January 2020 are shown in the animated chart. ____________________ Great Britain pound vs US dollar Range development and breakdown direction :
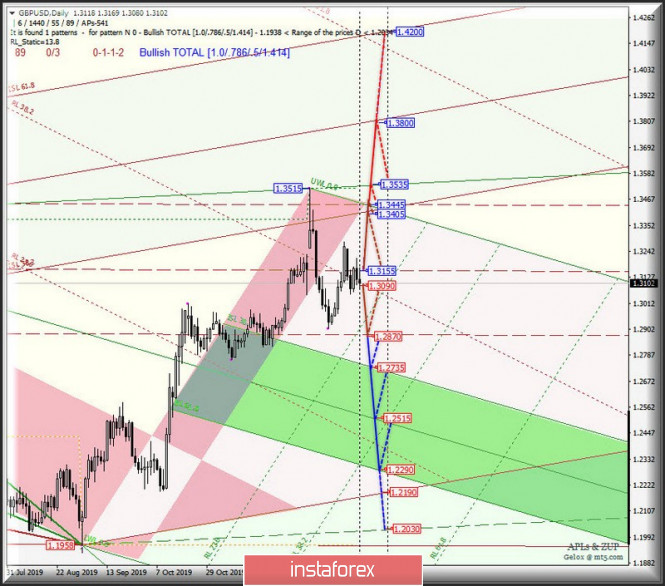
For January 2020, the development trend of Her Majesty's currency movement GBP / USD will begin to be determined. In case of breakdown of the support level of 1.3090 on the reaction line RL38.2 Minor, the downward movement of the currency of Her Majesty can be continued to the boundaries of the equilibrium zone (1.2735 - 1.2515 - 1.2290) of the Minuette operational scale forks. The breakdown of 1/2 Median Line Minor (resistance level of 1.3155) will make it relevant to continue the upward movement of GBP / USD to the boundaries of the equilibrium zone (1.3405 - 1.3800 - 1.4200) of the Minor operational scale forks. The details of the GBP / USD movement in January 2020 can be seen on the animated chart. ____________________ US dollar vs Japanese yen The development of the movement of the currency of the "country of the rising sun" USD / JPY for January 2020 will also depend on the direction of the breakdown of the range :
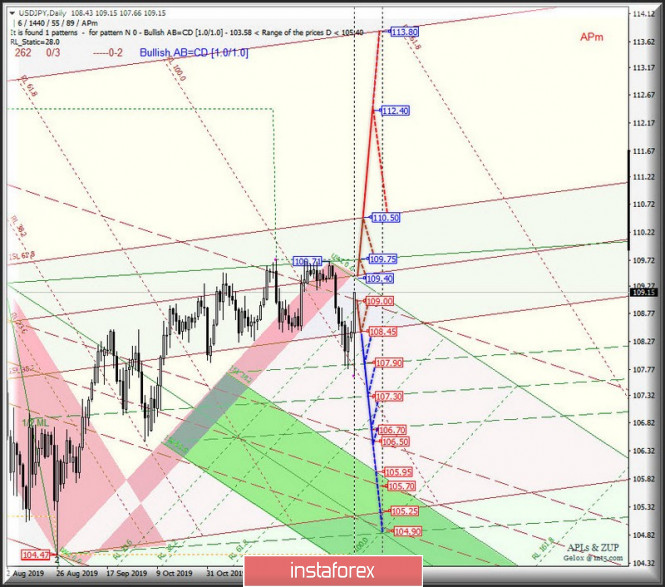
A consecutive breakdown of the 1/2 Median Line Minor (resistance level of 109.40) and the UTL control line (109.75) of the Minuette operational scale forks will direct the movement of the rising sun currency to the upper boundary of the ISL61.8 (110.50) equilibrium zoneof the Minor operational scale forks with the prospect of reaching maximum 112.40. The breakdown of the final Schiff Line Minor - support level of 109.00 - the option of developing a downward movement of USD / JPY to the lower boundary of the ISL38.2 (108.45) equilibrium zone of the Minor operational scale forks with the prospect of reaching the boundaries of 1/2 Median Line channel (107.90 - 107.30 - 106.70) of the Minuette operational scale forks. We look at the details of the USD / JPY movement in January 2020 on the animated chart. ____________________ The review is made without taking into account the news background. Thus, the opening of trading sessions of the main financial centers does not serve as a guide to action (placing orders "sell" or "buy"). The formula for calculating the dollar index : USDX = 50.14348112 * USDEUR0.576 * USDJPY0.136 * USDGBP0.119 * USDCAD0.091 * USDSEK0.042 * USDCHF0.036. where power factors correspond to the weights of the currencies in the basket: Euro - 57.6% ; Yen - 13.6% ; Pound Sterling - 11.9% ; Canadian dollar - 9.1%; Swedish Krona - 4.2%; Swiss franc - 3.6%. The first coefficient in the formula leads the index to 100 at the start date of the countdown - March 1973, when the main currencies began to be freely quoted relative to each other. The material has been provided by InstaForex Company - www.instaforex.com |
| Fractal analysis for major currency pairs on January 9 Posted: 09 Jan 2020 04:12 PM PST Dear colleagues, For the euro / dollar pair, we are following the development of the downward structure of January 6. The level of 1.1087 is the key resistance. For the pound / dollar pair, subsequent targets on the H1 scale are determined from the descending structure on December 31. For the dollar / franc pair, the price forms a local upward structure from January 8. The level of 0.9751 is the key resistance. For the dollar / yen pair, the price forms expressed initial conditions for the top of January 8. The development of this structure is expected after the breakdown of the level of 109.81. For the euro / yen pair, the price canceled the development of the downward structure and currently forms the potential for the top of January 8. For the pound / yen pair, we consider the upward structure on January 3 as the main one. The level of 143.68 is the key resistance. Forecast for January 9: Analytical review of currency pairs on the scale of H1: For the euro / dollar pair, the key levels on the H1 scale are: 1.1177, 1.1151, 1.1132, 1.1087, 1.1058, 1.1031 and 1.1015. Here, we continue to monitor the local descending structure of January 6. The continuation of the downward movement is expected after the breakdown of the level of 1.1087. In this case, the target is 1.1058. Price consolidation is near this level. The breakdown of the level of 1.1056 will lead to movement to a potential target - 1.1015. In turn, price consolidation is in the range of 1.1015 - 1.1031 and from here, we expect a upward rollback. Short-term upward movement is possible in the range of 1.1132 - 1.1151. The breakdown of the latter value will lead to an in-depth correction. Here, the goal is 1.1177. This level is a key support for the downward structure. The main trend is the local descending structure of January 6 Trading recommendations: Buy: 1.1132 Take profit: 1.1150 Buy: 1.1153 Take profit: 1.1175 Sell: 1.1085 Take profit: 1.1060 Sell: 1.1056 Take profit: 1.1034 For the pound / dollar pair, the key levels on the H1 scale are: 1.3178, 1.3113, 1.3073, 1.3006, 1.2937, 1.2874 and 1.2838. Here, we consider the descending cycle of December 31 as the main structure. We expect further downward movement after a breakdown of the level of 1.3006. In this case, the target is 1.2937. Price consolidation is near this level. Its breakdown will lead to a movement to a potential target - 1.2838. Price consolidation is in the range of 1.2838 - 1.2874 and from here, we expect a correction. Short-term upward movement is possible in the range of 1.3073 - 1.3113. The breakdown of the latter value will lead to an in-depth correction. Here, the target is 1.3178. This level is a key support for the descending structure of December 31. The main trend is the descending structure of December 31 Trading recommendations: Buy: 1.3073 Take profit: 1.3111 Buy: 1.3120 Take profit: 1.3175 Sell: 1.3005 Take profit: 1.2940 Sell: 1.2935 Take profit: 1.2875 For the dollar / franc pair, the key levels on the H1 scale are: 0.9832, 0.9810, 0.9778, 0.9751, 0.9706, 0.9685 and 0.9664. Here, we determine the next goals from the local ascending structure on January 8. We expect further upward movement after the breakdown of the level of 0.9751. In this case, the target is 0.9778. Price consolidation is near this level. The breakdown of the level of 0.9780 will lead to a pronounced movement. Here, the target is 0.9810. The potential value for the top is the level of 0.9832. Upon reaching which, we expect consolidation, as well as a downward rollback. Short-term downward movement is possible in the range of 0.9706 - 0.9685. There is a high probability of a turn up from this range. The breakdown of the level of 0.9685 will lead to the development of a downward structure. Here, the first potential target is 0.9664. The main trend is the local ascending structure of January 8 Trading recommendations: Buy : 0.9751 Take profit: 0.9775 Buy : 0.9780 Take profit: 0.9810 Sell: 0.9705 Take profit: 0.9688 Sell: 0.9683 Take profit: 0.9664 For the dollar / yen pair, the key levels on the scale are : 110.78, 110.39, 109.81, 109.58, 109.14, 108.86 and 108.46. Here, we are following the formation of a pronounced ascending structure of January 8. We expect short-term upward movement in the range of 109.58 - 109.81. The breakdown of the last value should be accompanied by an impulsive movement to the level of 110.39. Price consolidation is near this level. We consider the level 110.78 to be a potential value for the top, from which we expect a downward rollback. A short-term downward movement is possible in the range 109.14 - 108.86. The breakdown of the last value will lead to an in-depth correction. Here, the target is 108.46. This level is a key support for the top. The main trend: building potential for the top of January 8. Trading recommendations: Buy: 109.58 Take profit: 109.80 Buy : 109.83 Take profit: 110.30 Sell: 109.14 Take profit: 108.88 Sell: 108.82 Take profit: 108.50 For the Canadian dollar / US dollar pair, the key levels on the H1 scale are: 1.3157, 1.3126, 1.3112, 1.3090, 1.3062, 1.3040 and 1.3015. Here, we are following the development of the upward cycle of January 7. We expect further upward movement after the breakdown of the level of 1.3090. In this case, the target is 1.3112. Price consolidation is in the range of 1.3112 - 1.3126. We consider the level of 1.3157 to be a potential value for the top; upon reaching this level, we expect a downward rollback. A short-term downward movement is possible in the range of 1.3062 - 1.3040. The breakdown of the last value will lead to an in-depth correction. Here, the target is 1.3015. This level is a key support for the top. The main trend is the upward cycle of January 7 Trading recommendations: Buy: 1.3090 Take profit: 1.3112 Buy : 1.3126 Take profit: 1.3155 Sell: 1.3062 Take profit: 1.3042 Sell: 1.3038 Take profit: 1.3015 For the Australian dollar / US dollar pair, the key levels on the H1 scale are : 0.6926, 0.6893, 0.6875, 0.6851, 0.6827, 0.6793 and 0.6770. Here, we continue to monitor the development of the downward cycle of December 31. We expect a short-term downward movement in the range 0.6851 - 0.6827. The breakdown of the last value should be accompanied by a pronounced downward movement. In this case, the target is 0.6793. We consider the level of 0.6770 to be a potential value for the bottom; upon reaching this level, we expect consolidation, as well as an upward rollback. We expect short-term upward movement in the range 0.6875 - 0.6893. The breakdown of the latter value will lead to an in-depth correction. Here, the target is 0.6926. This level is a key support for the downward structure from December 31. The main trend is the descending structure of December 31 Trading recommendations: Buy: 0.6875 Take profit: 0.6890 Buy: 0.6895 Take profit: 0.6922 Sell : 0.6850 Take profit : 0.6830 Sell: 0.6825 Take profit: 0.6795 For the euro / yen pair, the key levels on the H1 scale are: 122.61, 122.30, 121.82, 121.30, 121.06 and 120.71. Here, we are following the formation of the initial conditions for the upward cycle of January 8. We expect the continuation of the upward movement after the breakdown of the level of 121.82. In this case, the target is 122.30. For now, we consider the level of 122.61 to be a potential value for the upward trend; upon reaching this level, we expect consolidation. Short-term downward movement is possible in the range of 121.30 - 121.06. The breakdown of the last value will lead to an in-depth correction. Here, the goal is 120.71. This level is a key support for the upward structure. The main trend is the formation of initial conditions for the top of January 8 Trading recommendations: Buy: 121.82 Take profit: 122.26 Buy: 121.32 Take profit: 122.60 Sell: 121.30 Take profit: 121.08 Sell: 121.04 Take profit: 120.76 For the pound / yen pair, the key levels on the H1 scale are : 145.11, 144.53, 143.68, 142.34, 141.87, 141.31 and 140.66. Here, we are following the development of the upward structure of January 3, after the abolition of the downward trend. We expect further upward movement after the passage at the price level of 143.70. In this case, the target is 144.53. Price consolidation is near this value. The potential level for the top is considered to be the level of 145.11, from which we expect a downward rollback. Short-term downward movement is possible in the range of 142.34 - 141.87. The breakdown of the latter value will lead to an in-depth correction. Here, the goal is 141.31. This level is a key support for the upward structure. The main trend is the upward structure of January 3 Trading recommendations: Buy: 143.70 Take profit: 144.50 Buy: 144.55 Take profit: 145.10 Sell: 142.34 Take profit: 141.90 Sell: 141.85 Take profit: 141.35 The material has been provided by InstaForex Company - www.instaforex.com |
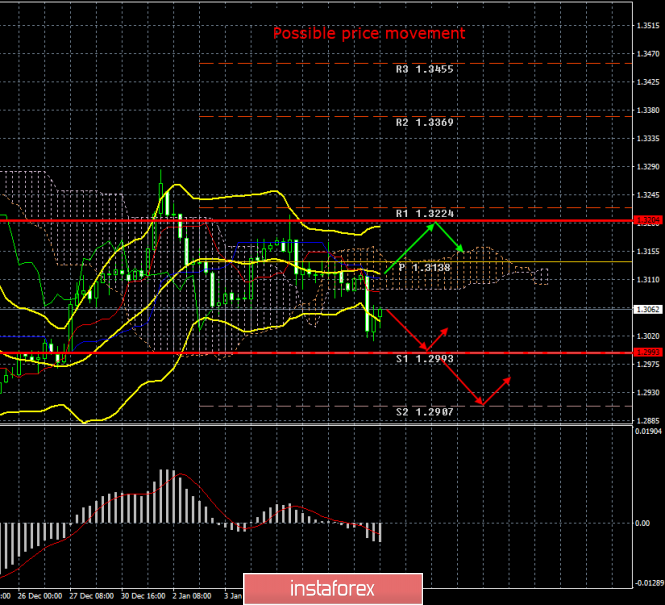
| Posted: 09 Jan 2020 02:51 PM PST 4-hour timeframe Amplitude of the last 5 days (high-low): 135p - 106p - 111p - 118p - 89p. The average volatility over the past 5 days: 112p (high). The British pound on Thursday, January 9, plunged during the European trading session, after which it quickly came to its senses. Thus, at the moment, we can say that the flat is canceled, since the price has already overcome the lower Bollinger band, and the indicator itself can now begin to expand down. We believe that the general fundamental background remains in favor of the US dollar, despite the US military conflict with Iran, which, according to the latest information, is actually gradually disappearing. We still believe that the pound should "repay all debts" to the US currency for unreasonable growth to the level of $1.35. Moreover, macroeconomic statistics from the UK continues to leave much to be desired, the future of the country is still shrouded in fog, and European Commission President Ursula von der Leyen, after the first conversation with Boris Johnson, said that it would take much more than a year to sign a comprehensive agreement. In principle, these words can be regarded as a hint to Johnson that he should not count on the accelerated work regime of the European Union in order to catch up by December 31, 2020. Thus, the issue of signing a trade deal between London and Brussels is a very subtle one. Meanwhile, the head of the Bank of England, Mark Carney, made a speech today. In the morning we talked about how long it was time for the British regulator to intervene in the country's economy, as macroeconomic indicators continued to fall. We also expected that Carney would open the veil over the plans of the Bank of England regarding monetary policy. Fortunately for traders, the central bank chief did not once again evade answers to direct questions with general phrases. He clearly stated that if the economy continues to slow down, the central bank will reduce the key rate. It is not clear how long and how much the British economy must slow down before the BoE intervenes. However, Carney indirectly answered this question, noting that the central bank does not have much space for influencing the economy through monetary policy and rates. The current rate is 0.75%, so the central bank can lower the rate 2-3 times, but clearly does not want to bring it to zero or a negative value. Carney also noted that the BoE could also expand its asset repurchase program. At the same time, market participants still do not expect monetary policy easing at a meeting on January 30. Carney is set to leave his post in March 2020 and seems to do the same as Mario Draghi - lower his key rate at his last or penultimate meeting. In our opinion, this will be a wise decision, since you must first wait for the beginning of the transition period of Brexit. This is precisely what the British regulator has regularly hinted at in recent months - the uncertainty of the consequences for the economy at a time when Brexit will begin. Thus, the GBP/USD currency pair may resume a downward trend, as most technical and fundamental factors speak in favor of this. Trading recommendations: GBP/USD overcame the Ichimoku cloud and resumed its downward movement. Thus, it is recommended that traders continue to trade lower with the target of the support level of 1.2993 (which coincides with the lower boundary of the volatility channel on January 9). It is recommended that purchases of British currency be returned no earlier than when the price is consolidated above the Kijun-sen line with the first target level of 1.3204. Explanation of the illustration: Ichimoku indicator: Tenkan-sen is the red line. Kijun-sen is the blue line. Senkou Span A - light brown dotted line. Senkou Span B - light purple dashed line. Chikou Span - green line. Bollinger Bands Indicator: 3 yellow lines. MACD indicator: Red line and bar graph with white bars in the indicators window. Support / Resistance Classic Levels: Red and gray dotted lines with price symbols. Pivot Level: Yellow solid line. Volatility Support / Resistance Levels: Gray dotted lines without price designations. Possible price movement options: Red and green arrows. The material has been provided by InstaForex Company - www.instaforex.com |
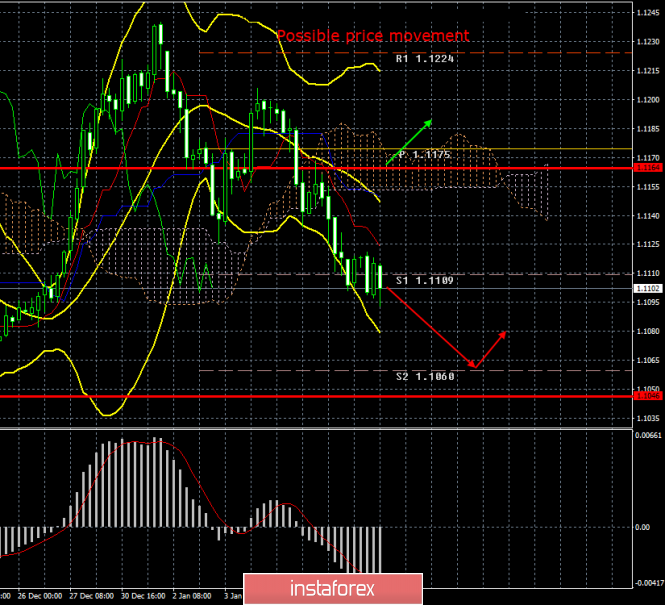
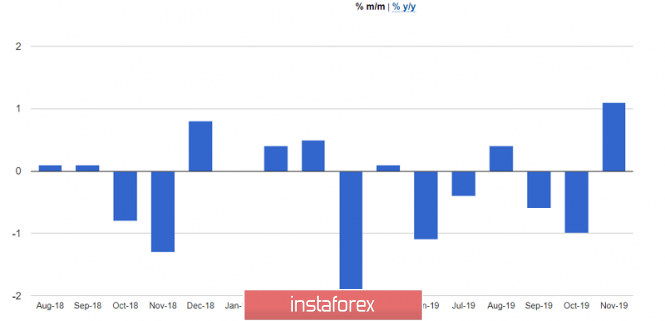
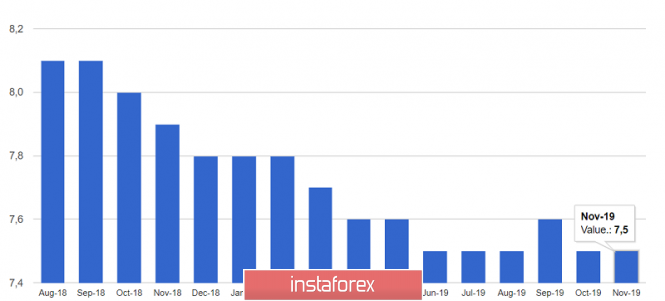
| Posted: 09 Jan 2020 02:51 PM PST 4-hour timeframe Amplitude of the last 5 days (high-low): 59p - 55p - 49p - 64p - 67p. Average volatility over the past 5 days: 59p (average). The EUR/USD pair ends the penultimate trading day of the week not only with a downward trend, but also with a weakening downward movement. In general, we can say that an upward correction, which, in principle, would have been logical today, did not happen, but traders did not find sufficient reasons for new sales of the European currency. Thus, the euro fell by several points during the day, having spent the entire trading day near the support level of 1.1109. Slowly, the euro/dollar is approaching its local lows near the level of 1.1069, with which certain problems may arise. Nevertheless, as we have repeatedly noted, the general fundamental background remains on the side of the US currency, so we believe that the downward trend will continue to form, but, as before, we recommend that technical indicators be taken into account as well. The entire macroeconomic background of the day consisted of data on changes in industrial production in Germany, as well as the level of unemployment in the European Union. Both reports cannot be called excessively important, therefore, it is not surprising that none of them caused strong movements in the forex market. Although statistics from Germany today was unexpected, pleased traders, but at the same time again did not change the overall picture of things in Germany and the European Union. The report on industrial production was stronger than expected by traders and experts. In monthly terms, the growth amounted to 1.1% with the forecast of + 0.7%, and in annual terms - losses of 2.6% instead of the projected 3.8%. What do these numbers mean? That the situation in the industrial sector may begin to improve in the near future. However, we believe that it is too early to draw such conclusions. First, the German industry is still experiencing a decline in annual terms. Secondly, business activity indices in the manufacturing sector of Germany and the EU remain "below the plinth". Thus, we believe that the current high value of industrial production in Germany is somewhat an accident. Perhaps that is why this report did not provide any support for the euro. Furthermore, the unemployment rate in the European Union remained the same at 7.5%, so there is simply nothing to talk about here. There has not been a single important macroeconomic publication in the United States today. Meanwhile, official information arrived that the Chinese delegation, headed by Vice Premier of the State Council of the PRC Liu He, will visit the White House on January 13-15 in order to sign a "first phase" trade deal with Donald Trump. The parties agreed on the conditions of the first stage of the general agreement on December 13, now it is time to sign. However, the topic of the trade conflict between China and the United States has now clearly receded into the background. Moreover, we believe that President Trump is doing his best at this time to smooth out any conflicts in which the United States are involved. As we said last year, Trump needs stability before the election. Trump needs victory before the election. He needs economic growth before the election. If there seems to be no problems with the last paragraph, then for the first two there are obviously questions. The conflict with Iran, which began neatly on New Year's Eve, ended as if the parties simply spoke impartially to each other and calmed down. The millionth funeral of General Soleimani, the fierce promises of the Iranian government to avenge, the attacks on military bases in Iraq - and not a single dead American "contractor" ... Iranian military units fired idle? President Trump made a statement, allegedly early warning systems warned in advance American soldiers who managed to take cover. However, the whole conflict looks from the outside as if Iran did not want to answer the United States, realizing that if there are real losses among American soldiers, then the blow Trump spoke about (on 52 objects of Iranian culture) can really be dealt. On the one hand, it's good that we can declare de-escalation of the conflict, on the other hand, it all looks very strange. World analysts have also noted a certain oddity of Trump's retaliatory move, which only announced the introduction of new sanctions against Iran. The kind of sanctions is unknown. It seems that Trump does not need this war before the presidential election, and Iran does not need this war, since the enemy is very strong. Trump is not on the principle now in trade negotiations with China, although we still do not know all aspects of the trade deal that will be signed on January 13-15. The criticism of Jerome Powell, who previously fell under the "shelling" of the White House every week, ended. The topic stalled with the impeachment of Trump, who, most likely, will not be able to overcome the Senate. In general, we believe that in the last year of his presidency, Trump will seek to show the result and will no longer tense the situation on all fronts, as he did in recent years. Trading recommendations: EUR/USD generally continues to move down. Thus, now it is recommended for traders to trade lower with the target at the support level of 1.1060 and reduce shorts if the MACD indicator turns up. It will be possible to consider purchases of the euro/dollar pair no earlier than the reverse consolidation of the price above the critical Kijun-sen line with the first target of 1.1224. Explanation of the illustration: Ichimoku indicator: Tenkan-sen is the red line. Kijun-sen is the blue line. Senkou Span A - light brown dotted line. Senkou Span B - light purple dashed line. Chikou Span - green line. Bollinger Bands Indicator: 3 yellow lines. MACD indicator: Red line and bar graph with white bars in the indicators window. Support / Resistance Classic Levels: Red and gray dotted lines with price symbols. Pivot Level: Yellow solid line. Volatility Support / Resistance Levels: Gray dotted lines without price designations. Possible price movement options: Red and green arrows. The material has been provided by InstaForex Company - www.instaforex.com |
| Posted: 09 Jan 2020 02:50 PM PST The first "trial" round of negotiations between the head of the British government and the chairman of the European Commission ended to no avail. The parties reiterated their positions, however, none of them expressed their readiness to make any compromises, primarily regarding the timing of the transition period. By and large, at the initial stage of the negotiation process, none of the market participants expected other options. The negotiations themselves will officially begin only on February 1. The Brexit bill is still pending in the House of Commons. It is expected that the MPs will accept him in the third reading today and it will be sent to the House of Lords. After the approval of the bill by the Lords, this document should formally be approved by the European Union - a corresponding vote will be held in the European Parliament. That is why no one expected any breakthrough from the first meeting of Boris Johnson and Ursula von der Leyen - it was more like "reconnaissance in battle", during which the parties only outlined their priorities, and in a rather mild and friendly manner. But the essence of the rhetoric did not appeal to GBP/USD traders - the pound returned to the area of the 30th figure again, after a short growth. Market participants are once again preparing for a protracted confrontation between London and Brussels, which may last more than one year. However, the time frame of the transition period is also the subject of controversy. To be more precise, now the main political discussion has unfolded around this issue. According to the head of the European Commission, the negotiators will not be able to meet the 11-month period (that is, until the end of this year), while in the opinion of the head of the British government, the negotiation group is obliged to do this. Despite the fundamentally opposing positions on this issue, Johnson and Layen did not voice any ultimatums to each other. The head of the European Commission only lamented that if Britain is so categorical about observing the established time frames, then the negotiating groups will have to work "day and night" in order to manage to coordinate all the nuances of future relations. She also warned that in this case, the parties would be forced to prioritize, which would negatively affect the overall result. However, Johnson tactfully expressed confidence that the negotiators will cope with this difficult task, adding that London is striving for a "positive new partnership" with the European side. And although the British currency showed negative dynamics as a result of these negotiations, the GBP/USD pair was able to stay in the region of the 30th figure. Although the bears clearly hoped for more: the first support level is at 1.2950 (the upper boundary of the Kumo cloud on the daily chart), and sellers could well test it, given how fast the pair fell in the first half of today. Compared to other dollar pairs of the major group, the pound stubbornly resists the hegemony of the US currency. After several days of the siege, the euro surrendered and returned to the 10th figure, the yen fell in price to the middle of the 109th level, and the Canadian dollar weakened to 1.31 against the greenback (although it was trading at around 1, 29 at the beginning of the week). In each case, the US dollar is aggressively advancing, gaining lost ground. The pound, in turn, occupies a separate position - it is under the obvious pressure of the dollar, but is in a hurry to drop impulse to multi-week lows. What is the reason for such a stress resistant pound? There are no reasons as such - the economic calendar for GBP/USD is not eventful - the main report of the week (Nonfarm) will be published only tomorrow. Political factors also (so far) have little effect on the dynamics of the British currency - the rhetoric of Johnson and Layen is predictable, while deputies of the House of Commons make predictable decisions. Therefore, the pound is forced to follow the dollar, which in turn follows the dynamics of the yield of 10-year Treasuries. The theme of the US-Iran conflict after yesterday's speech by Trump has exhausted itself - this is eloquently evidenced by oil quotes and defensive tools. In turn, the theme of US-Chinese relations is still in the shadows - the signing ceremony of the first phase of the trade transaction is scheduled for January 15. Dollar bulls took advantage of the emerging information to their advantage, as general optimism in the market returned traders' interest in risky assets. But such an unreasonable growth of the US currency carries risks, especially on the eve of tomorrow's Nonfarm. To summarize the above, it is necessary to warn market participants from opening short positions in the GBP/USD pair - firstly, the downward movement in the pair is rather uncertain; secondly, Friday's data on the growth of the US labor market can dramatically redraw the fundamental picture for the dollar. If December Nonfarm disappoints, the GBP/USD pair may jump to the first resistance level (Kijun-sen line on D1), that is, to around 1.3200. The material has been provided by InstaForex Company - www.instaforex.com |
| GBP/USD: pound continues to follow policy Posted: 09 Jan 2020 02:50 PM PST The British currency marked the New Year with a sharp increase against the US dollar. However, the pound had a hangover in early January: the GBP/USD pair plunged below the bottom of the 31st figure. Data on business activity in the UK services sector for December became a kind of pickle for the pound. The Purchasing Managers Index managed to cling to the psychologically important mark of 50, and new orders grew at the fastest pace in five months. I am glad that the British currency is beginning to show sensitivity to macro statistics. However, the main driver for changing quotes is still politics. Investors continue to monitor the situation around Brexit. Relations between London and Brussels remain tense. The new European Commission President, Ursula von der Leyen, expressed serious concern about Boris Johnson's intentions at the legislative level to limit the transition period to December 31, 2020. The British prime minister believes that it will take less than 12 months to sign a trade agreement. It seems that he decided to bargain with the EU, because the draft "divorce" agreement is already on the table. It should be understood: even the UK's divorce from the EU does not isolate the country from the influence of external demand. Great Britain is characterized by the same trends as the United States or the eurozone, namely, the weakness of industry and the stability of the service sector, a strong labor market and sluggish inflation. If the global economy begins to recover against the backdrop of the end of the US and China trade conflict, this will have a positive effect on the UK export and manufacturing sector and, accordingly, on the pound. However, this will be later, but for now the GBP/USD pair is still consolidating, remaining below the resistance level of 1.3285. The decline is expected to be held back by the 55-day moving average of 1.2993. On December 23, the pair noted a low of 1.2908, and while trading takes place above it, the "bullish" mood should remain in order to retest the December high of 1.3515. A breakout of the support of 1.2908 will bring into the game a 200-day moving average of 1.2690. The material has been provided by InstaForex Company - www.instaforex.com |
| Posted: 09 Jan 2020 02:50 PM PST The euro ignored news from the Ministry of Commerce of China, in which it was reported that Deputy Prime Minister Liu He will sign a first-phase trade agreement during his visit. As noted in the statement, China's chief trade negotiator Liu He, headed by a delegation of ten people, will arrive in Washington soon. The Chinese delegation will include the Minister of Commerce, the central bank governor, deputy ministers of finance, agriculture and information technology. Most likely, during the signing of the first phase of the trade agreement, which will be held on January 15 in the White House, questions will also be raised regarding the second, more important phase, which includes a number of conditions for information technology, as well as Huawei. Also, buyers of risky assets ignored today's report on the volume of industrial production in Germany. According to data, industrial production in Germany grew more than expected in November last year, compared with October. Production was reduced in the previous two months, which is likely to lead to its decline for the fourth quarter of 2019. The report indicates that industrial production, which includes production in the manufacturing and construction sectors, grew by 1.1% in November compared to October, while economists expected growth by 0.7%. In the construction sector, the increase in production was 2.6%, while the increase was less significant in the manufacturing industry, only 1.0%. Industrial production declined by 2.6% compared to November 2018. Apparently, traders ignored a good report, since the November growth alone is clearly not enough to offset the decline recorded in September and October 2019. Most likely, German industrial production will continue to decline in the fourth quarter, which will affect the overall economy. Experts note that to avoid a decline in industrial production for the sixth consecutive quarter, growth should be more than 3.0% in December, which is hardly possible after a recent report on the volume of orders in German industry. Also there is a higher report from the World Bank today, which once again revised and lowered forecasts of global economic growth. This was done due to continuing problems in trade and investment. However, from positive expectations, acceleration of growth in 2020 should be noted. According to the report, global GDP growth in 2019, 2020 and 2021 will amount to 2.4%, 2.5% and 2.6%, respectively. The resolution of the trade conflict between the United States and China had a positive effect on the forecast for 2020, as a gradual revival of trade and investment is expected. The World Bank also expects that US GDP in 2020 will grow by 1.8%, while the growth of the Chinese economy will slow down from 5.9% in 2020. Today's report on unemployment in the eurozone, which could grow to 7.6%, turned out to be better than forecasts of economists. According to data, unemployment in November 2019 remained unchanged at 7.5%. The number of unemployed in the eurozone in November fell by 10,000. The technical picture of the EURUSD pair remained unchanged, even though the bears pushed the euro to support at 1.1100. A breakthrough of this level will provide the market with new sellers capable of pushing risky assets to the lows of 1.1040 and 1.0980. If buyers of the euro manage to regain the intermediate resistance of 1.1130, a rebound to the highs of 1.1170 and 1.1210 is not excluded. GBPUSD The pound reacted with a decline to today's statement by the head of the Bank of England Mark Carney. In a nutshell, the central bank chief did not go around the clock and said that he had already discussed with colleagues the reasons for lowering interest rates. Judging by the statement, if the UK economy does not accelerate in the near future, the likelihood of lowering rates will increase. Let me remind you that in December the Bank of England again gave a twofold assessment of the situation related to the economy and monetary policy, but many traders examined the central bank's hints for a tendency towards a softer approach. Today's statements have only confirmed this fact. I recall that during the last meeting in 2019, two out of nine members of the Monetary Policy Committee voted to lower the key rate by a quarter percentage point. Equally important will be today's vote in the British Parliament on the Brexit deal. If the House of Commons approves the agreement proposed by Prime Minister Boris Johnson, then the bill will move on to the House of Lords. Only after its adoption, the UK government will begin to discuss a trade agreement between the UK and the EU, which I spoke about in more detail in my morning review. The material has been provided by InstaForex Company - www.instaforex.com |
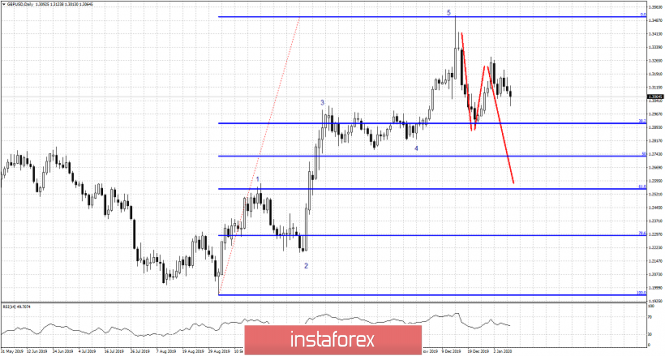
| Short-term Elliott wave analysis on GBPUSD Posted: 09 Jan 2020 01:38 PM PST GBPUSD continues to follow our plan and is now in the final corrective pull back. Short-term trend remains bearish and we continue to expect price to move below 1.29. Wave C down is underway.
GBPUSD so far is following my expectations. Both 1.29 downside target has been reached and the upside bounce was foretold. Now it is time for a new lower low and price to fall below the 38% Fibonacci retracement. Next downside target is at 1.2750. As long as price is below 1.3285 bears will remain in control. The material has been provided by InstaForex Company - www.instaforex.com |
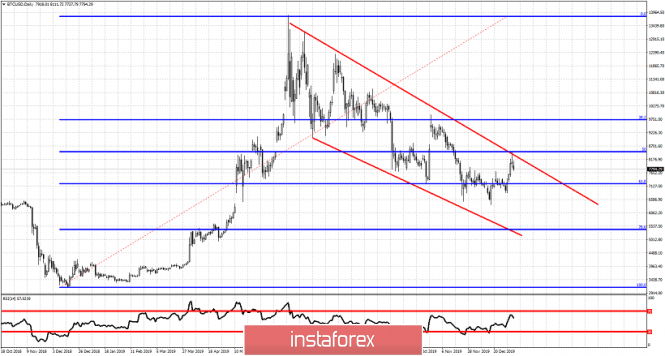
| Bitcoin gets rejected at resistance Posted: 09 Jan 2020 01:33 PM PST In our previous BTCUSD analysis we noted that price still is trading inside the downward sloping wedge pattern and that price was soon to test a very important technical resistance. Price has been rejected at the resistance of the upper wedge boundary and is pulling back down again.
|
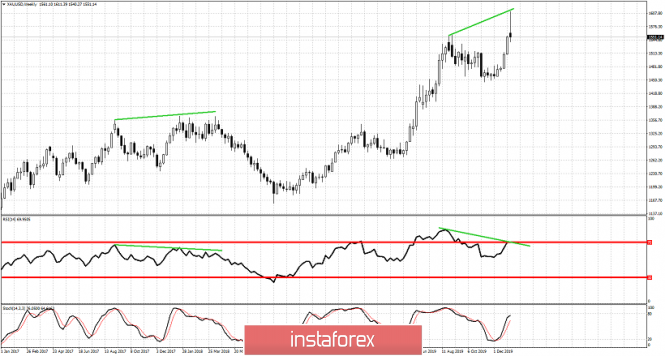
| Posted: 09 Jan 2020 01:27 PM PST Gold price has most probably made an important short-term top. Price has reached very close to our $1,600 target and has given many warning signals before reversing after making a new higher high.
The RSI has given bearish divergence signals. The price of RSI has not followed price of Gold and has not confirmed the strength in the bullish camp. The weekly candle with a long upper tail is a bearish one. Gold price could already have started a corrective move lower. As we explained in previous posts, this is not the time to chase the long side. This is the time to raise stops and be careful. The material has been provided by InstaForex Company - www.instaforex.com |
| January 9, 2020 : GBP/USD Intraday technical analysis and trade recommendations. Posted: 09 Jan 2020 08:43 AM PST
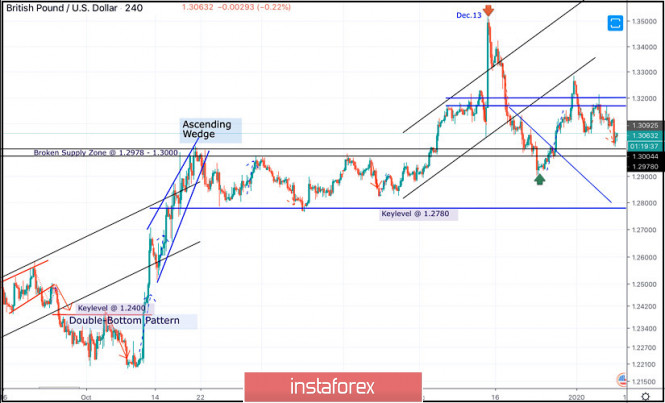
On December 13, the GBPUSD pair looked overpriced around the price levels of 1.3500 while exceeding the upper limit of the newly-established bullish channel. On December 23, temporary bearish breakout below 1.3000 was demonstrated on the H4 chart. However, earlier signs of bullish recovery manifested around 1.2900 denoted high probability of bullish breakout to be expected. Thus, Intraday technical outlook turned into bullish after the GBP/USD has failed to maintain bearish persistence below the newly-established downtrend line. That's why, bullish breakout above 1.3000 was anticipated. Thus, allowing the recent Intraday bullish pullback to pursue towards 1.3250 (the backside of the broken channel) where bearish rejection and another bearish swing were suggested for conservative traders in Last Week's previous articles. Intraday bearish target remains projected towards 1.3000 and 1.2980 provided that the current bearish breakout below 1.3170 is maintained on the H4 chart. On the other hand, bearish breakdown below 1.2980 is mandatory to enhance further bearish decline towards 1.2900 where the backside of the previously-broken downtrend is located. Moreover, Intraday traders can watch any bullish pullback towards the depicted price zone (1.3170 - 1.3200) for bearish rejection and another valid SELL entry with intraday bearish targets projected towards 1.3000 and 1.2980. The material has been provided by InstaForex Company - www.instaforex.com |
| January 9, 2020 : EUR/USD Intraday technical analysis and trade recommendations. Posted: 09 Jan 2020 08:22 AM PST
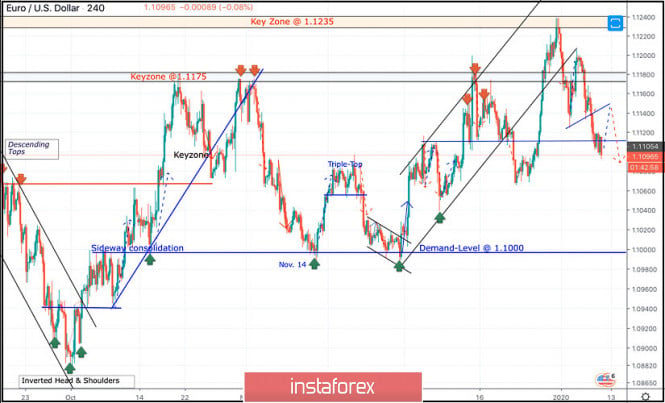
Since November 14, the price levels around 1.1000 has stood as a significant DEMAND-Level offering adequate bullish SUPPORT for the pair on two successive occasions. During this Period, the EUR/USD pair has been trapped within a narrow consolidation range between the price levels of 1.1000 and 1.1085-1.1100 (where a cluster of supply levels and a Triple-Top pattern were located) until December 11. On December 11, another bullish swing was initiated around 1.1040 allowing recent bullish breakout above 1.1110 to pursue towards 1.1175 within the depicted short-term bullish channel. Initial Intraday bearish rejection was expected around the price levels of (1.1175). Moreover, On December 20, bearish breakout of the depicted short-term channel was executed. Thus, further bearish decline was demonstrated towards 1.1065 where significant bullish recovery has originated. The recent bullish pullback towards 1.1235 (Previous Key-zone) was suggested to be watched for bearish rejection and another valid SELL entry. Suggested bearish position is currently running in profits while approaching the price levels around 1.1110. The current Key-Level around 1.1110 may provide some bullish rejection. If so, another bullish pullback would be expected towards 1.1140 and probably 1.1175. On the other hand, for those who caught the initial bearish trade around 1.1235, bearish persistence below 1.1110 enables further bearish decline towards 1.1060 and probably 1.1040. Trade recommendations : Conservative traders should wait for bullish pullback towards the price levels of (1.1140-1.1175) as another valid SELL signal. Bearish projection target to be located around 1.1120 and probably 1.1060. Any bullish breakout above 1.1175 invalidates the mentioned bearish trading scenario. The material has been provided by InstaForex Company - www.instaforex.com |
| Evening review EURUSD 01/09/2020 Posted: 09 Jan 2020 05:53 AM PST
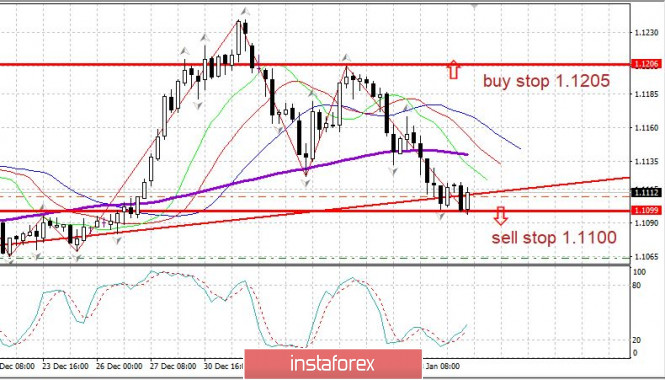
The EURUSD rate is under pressure from sellers for 6 sessions in a row, with one break. Nevertheless, the euro has not yet moved into a downward trend. Sellers met the resistance of buyers at the level of 1.1100. We are ready to buy the euro at a break of 1.1205 up. We are ready to sell euros from 1.1065. The material has been provided by InstaForex Company - www.instaforex.com |
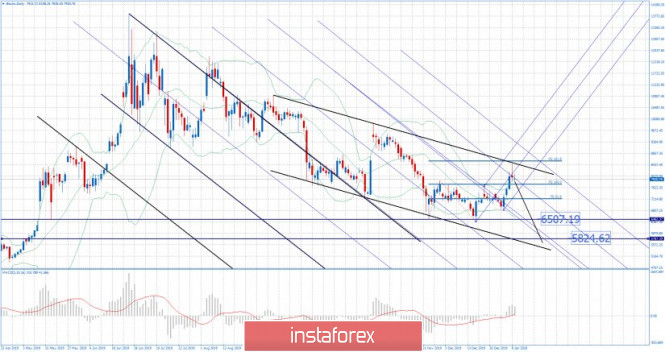
| BTC analysis for 01.09.2020 - Potential big sell off is coming, fist target at $6.500 Posted: 09 Jan 2020 05:43 AM PST Industry news: In a submission (pdf) to the Select Committee on Financial Technology and Regulatory Technology just before Christmas, RBA officials were skeptical that cryptocurrencies, in their current and future forms, would ever replace government-issued money. Although newer initiatives like Libra and CBDCs could promote financial inclusion, the bank's current assessment is that innovation in the broader fintech space will make these solutions redundant. "In Australia, it is unclear that there will be strong demand for global stablecoins even if they do meet all regulatory requirements, particularly for domestic payments," reads the submission. "Australia is already well served by a range of low-cost and efficient real-time payment methods, such as the NPP [New Payments Platform] that utilise funds held in accounts at prudentially supervised financial institutions." Technical analysis:
BTC reached major resistance at the price of $8.500 and I do see further downside movement. The price is still trading inside of the downside channel, which is another confirmation for our bearish view... Downward targets are set at the price of $6.500 and $5.825 MACD oscillator is showing neutral stance and slow line is near the zero level. Major resistance level is set at $8.500 Support levels are set at the price of $6.500 and $5.825 The material has been provided by InstaForex Company - www.instaforex.comThis posting includes an audio/video/photo media file: Download Now |
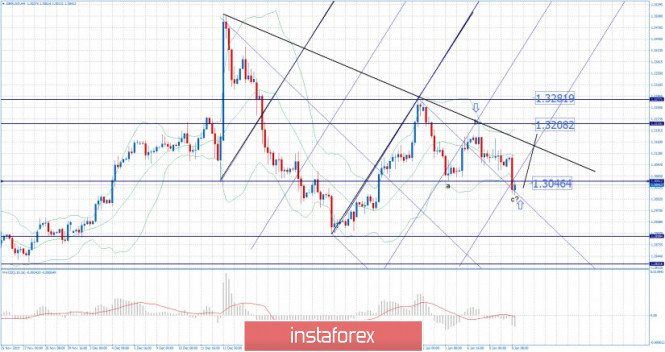
| Posted: 09 Jan 2020 05:30 AM PST GBP has been trading downwards as I expected. The price reached my downward target at 1.3050. Anyway, I see potential for the end of the downward correction (ABC) and new upside wave. I expect potential test of 1.3200 and 1.3280
The eventual breakout of resistance at 1.3050 may lead us to higher price. My advice is to watch for buying opportunities on the dips using intraday-frames 5/15 minutes. MACD oscillator is showing neutral stance and slow line is near the zero level. Resistance levels are seen at the price of 1.3050, 1.3200 and 1.3280 Key support level is set at the price of 1.3000 The material has been provided by InstaForex Company - www.instaforex.com |
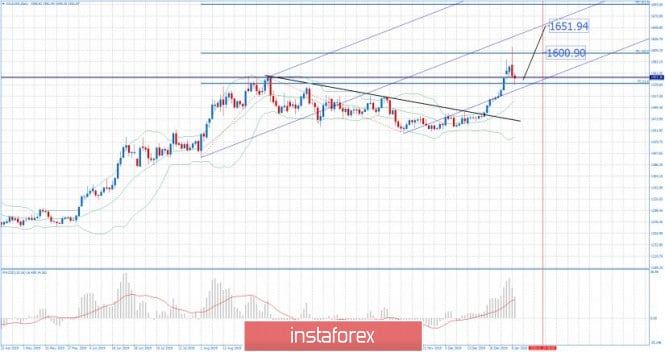
| Gold 01.09.2020 - Strong upward trend in the background and potential for re-test of $1.600 Posted: 09 Jan 2020 05:21 AM PST Gold has been trading downwards. The price tested and rejected of the level of $1.550. I still see more upside on the Gold and potential re-test of $1.600 and $1.650.
The breakout of the major swing high this week was the key for strong demand on the Gold. My advice is to watch for buying opportunities on the dips using intraday-frames 5/15 minutes. MACD oscillator is showing increase on the upside momentum and new high, which is good confirmation for the further upside... Resistance levels and upward targets are seen at the price of $1.601 and $1.650. Key support level is set at the price of $1.550/ The material has been provided by InstaForex Company - www.instaforex.com |
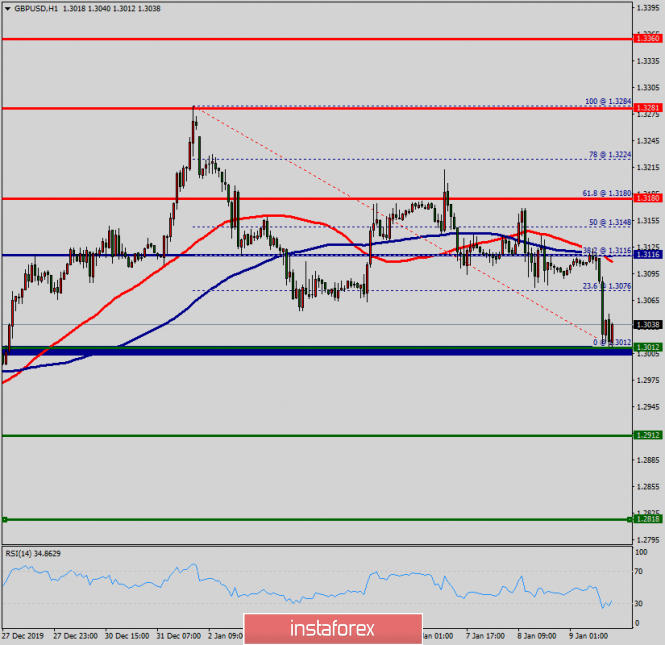
| Technical analysis of EUR/USD for January 09, 2020 Posted: 09 Jan 2020 05:10 AM PST Overview: As expected, the GBP/USD pair continues to move downwards from the zone of 1.3116. Yesterday, the pair dropped from the level of 1.3116 to 1.3012. The price of 1.3116 coincides with a ratio of 38.2% Fibonacci on the daily chart. Today, resistance is seen at the levels of 1.3116 and 1.3180. So, we expect the price to set below the strong resistance at the levels of 1.3116 and 1.3180; because the price is in a bearish channel now. The RSI starts signaling a downward trend. Consequently, the market is likely to show signs of a bearish trend. So, it will be good to sell below the level of 1.3116 with the first target at 1.3000 and further to 1.2912 in order to test the daily support. If the GBP/USD pair is able to break out the daily support at 1.2912, the market will decline further to 1.2818 to approach support 3 today. However, the price spot of 1.3116 and 1.3180 remains a significant resistance zone. Thus, the trend is still bearish as long as the level of 1.3180 is not breached. The material has been provided by InstaForex Company - www.instaforex.com |
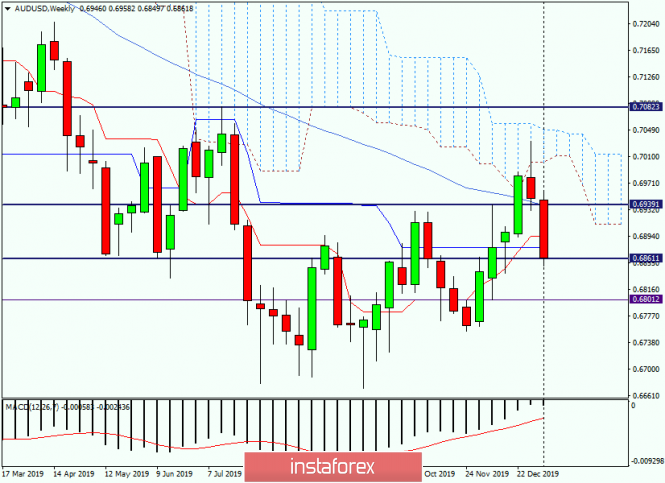
| Technical analysis and forecast for AUD/USD for January 9, 2020 Posted: 09 Jan 2020 04:32 AM PST Hello! So it's time to consider the extremely interesting and curious AUD/USD pair. This currency pair is loved by many traders. The AUD/USD quote can both grow rapidly and fall no less significantly, giving a good opportunity for market participants to earn on the exchange rate change. However, the second side of the coin implies quite significant losses, if the analysis and forecast were incorrect. Well, let's start debriefing on "Aussie" and for a start let's turn to the weekly timeframe. Weekly
After the last weekly candle, there was a minimum of doubt in the further downward scenario, which, is confirmed by the course of the current weekly trading. However, there are two significant and extremely important technical nuances. These are the Kijun (0.6877) and Tenkan (0.6894) lines of the Ichimoku indicator. It seems that the further price dynamics of the Australian dollar will largely depend on the true breakdown of these lines (levels). Judging by the weekly timeframe, it is not yet possible to draw unambiguous conclusions. Now, let's move to smaller timeframes. Daily
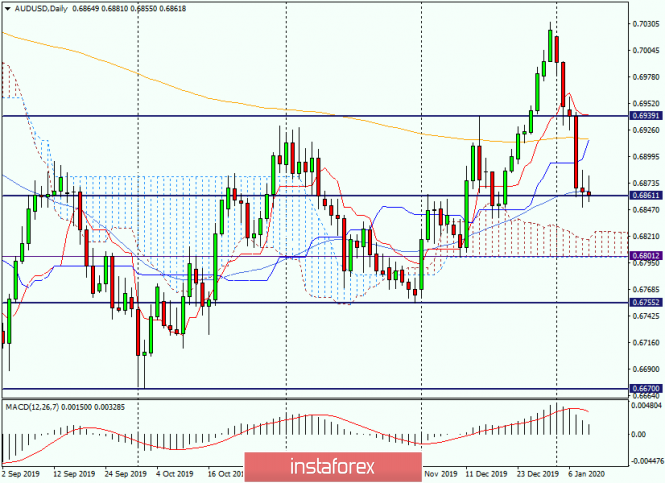
Here we see that after a strong decline on January 7, the pair gained support around 0.6850. Let me remind you that this is a very strong technical level, as we can see again. In my opinion, a slight correction is now possible, after which the pair will turn in the south direction. I will indicate the purpose of the proposed rollback, after which it is time to consider opening short positions on AUD/USD. So, the nearest option for opening short positions will be the price zone of 0.6900-0.6920. If the rate rises above 0.6820, I am not sure if the downward scenario will remain relevant. If the downward trend continues, we are waiting for the pair in the area of 0.6830, where the upper border of the daily cloud of the Ichimoku indicator passes. H4
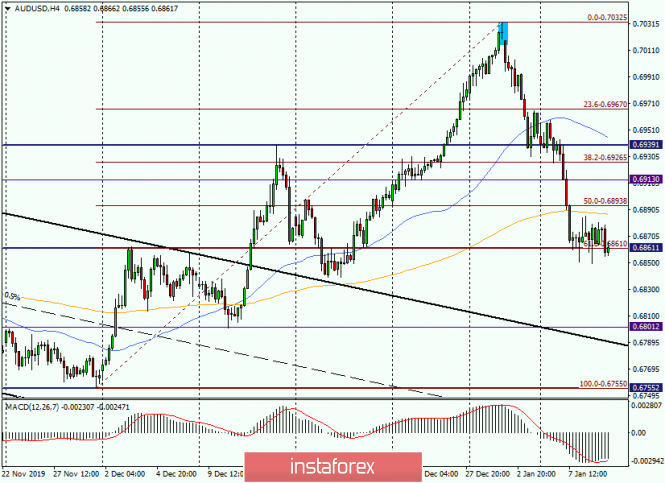
So, to sum up, and decide on trading ideas, let's look at the H4 chart, where it is clear that the corrective levels of 0.6788. and 0.6800 should be considered for opening short positions on AUD/USD. So far, this is all for the moment. Good luck and all the best! The material has been provided by InstaForex Company - www.instaforex.com |
| EUR/USD. January 9. Two new medium-term trading ideas Posted: 09 Jan 2020 04:32 AM PST EUR/USD - Daily.
As seen on the 24-hour chart, the EUR/USD pair performed a consolidation under the upward small corridor, which increases the probability of the pair continuing to fall in the direction of the lower border of the downward trend corridor or approximately the level of 1.0851. This goal will be achieved not in one or two days, but the medium term, that is, within one or two weeks. The pair's quotes continue to trade according to the trend of the main corridor, and only a close above it will cancel the current trading idea and all sell signals. EUR/USD - 4H.
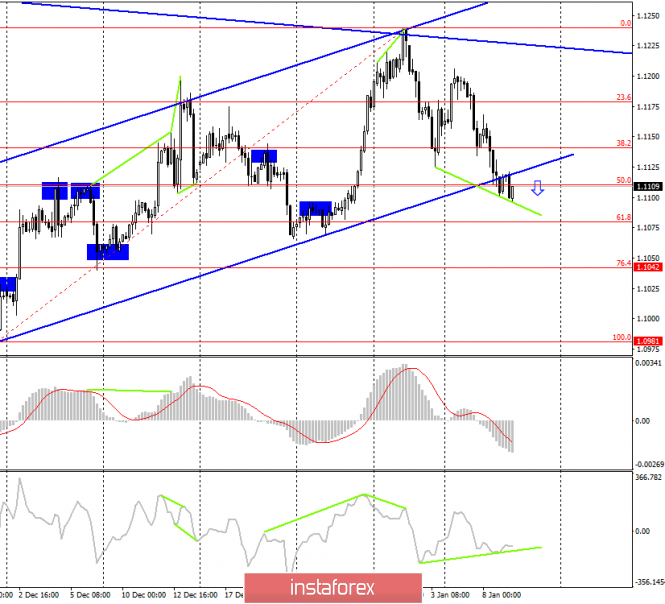
As seen on the 4-hour chart, the EUR/USD pair worked out the goal that I gave in the previous reviews - 1.1125. Also, the pair's quotes closed under the Fibo level of 50.0% (1.1111) and the upward trend corridor. Thus, the probability of a fall in the pair's rate is also increased on the 4-hour chart. On January 9, a bullish divergence is brewing for the CCI indicator, which may allow the pair to perform a reversal in favor of the European currency and start the process of growth towards the levels of 38.2% and 23.6%. However, after the rollback is completed, I expect the fall to resume in the direction of the corrective levels of 76.4% (1.1042) and 100.0% (1.0981). Forecast and trading recommendations for EUR/USD: The long-term trading idea remains in force, as the pair's quotes performed a consolidation under the upward small corridor. Traders get a target for a drop of about 250 points - around the level of 1.0850. On the second trading idea, I expect a fall during the week to the corrective levels of 1.1042 and 1.0981. I also expect a bullish divergence, a pullback of the pair up, after which it will be possible to look for an opportunity to sell with the above-defined goals. The material has been provided by InstaForex Company - www.instaforex.com |
| GBP/USD. January 9. The third sales signal has been received. Prospect – 1.2900 Posted: 09 Jan 2020 04:32 AM PST GBP/USD - 4H.
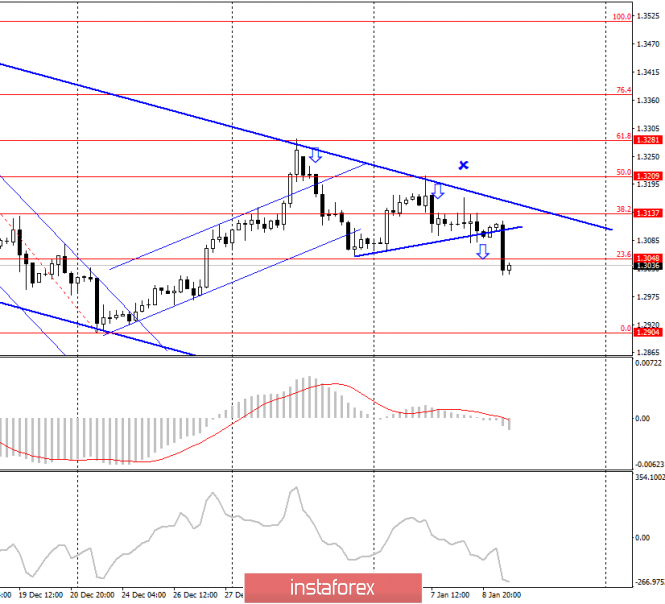
The GBP/USD pair first completed a rebound from the Fibo level of 61.8% (1.3281), then from the corrective level of 50.0% (1.3209) and the upper line of the downward trend corridor, and yesterday, January 8, performed a close under the correction line. Thus, these rebounds and closures allowed us to perform a new reversal in favor of the US currency and resume the process of falling towards the corrective level of 0.0% (1.2904). Closing the quotes above the upper line of the downward corridor will cancel all sell signals. Today, the divergence is not observed in any indicator. Fixing the rate of the pound-dollar pair under the Fibo level of 23.6% (1.3048) further increases the chances of a further fall in the direction of the last corrective level on the current Fibo grid of 0.0% (1.2904). Forecast and trading recommendations for GBP/USD: The current trading idea is to sell the pound with a target of 1.2900, as many as three sales signals have been received. I recommend moving the Stop Loss levels outside the trend range or placing them behind the nearest corrective levels. The material has been provided by InstaForex Company - www.instaforex.com |
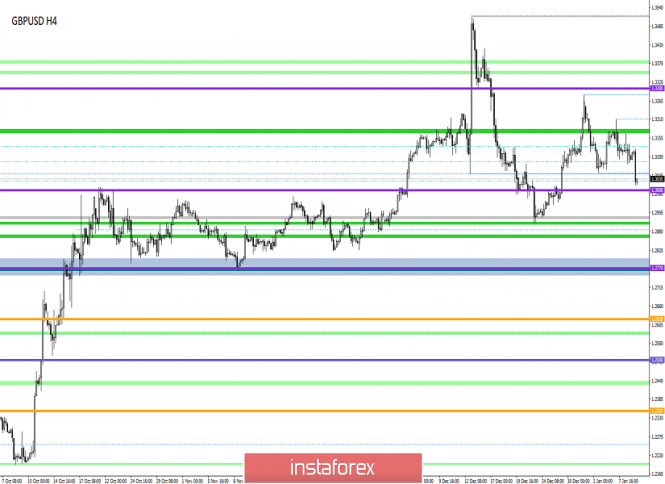
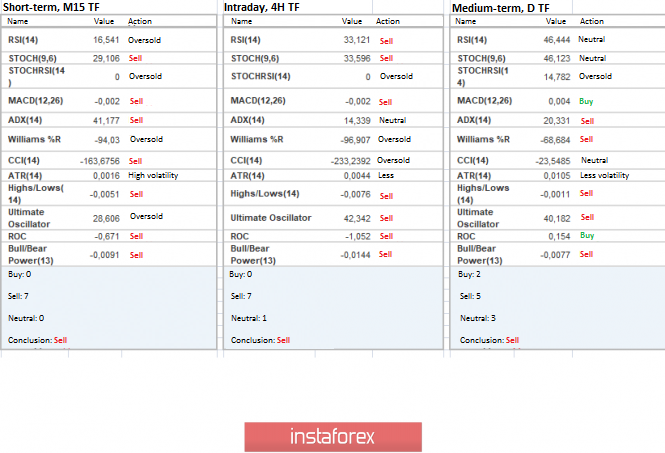
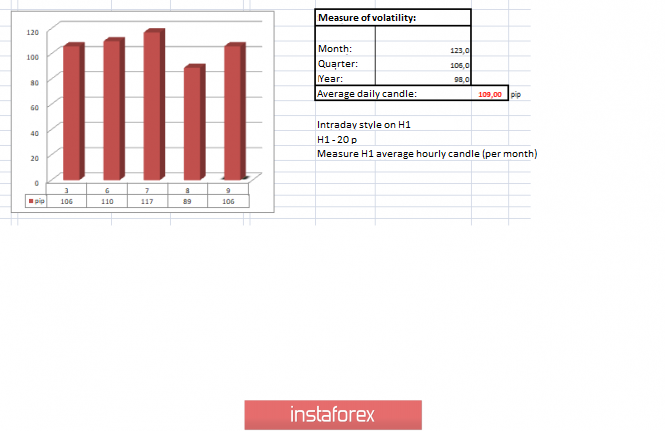
| Trading recommendations for GBPUSD for January 9, 2020 Posted: 09 Jan 2020 03:36 AM PST From the point of view of a comprehensive technical analysis, we see that the beginning of the new year welcomed us with really strong fluctuations, where, as expected, the impulsive upward interest came to naught and we saw an equally rapid, but already downward movement . The theory of accelerating volatility as discussed in my previous articles, coincided well and we saw high fluctuations and the average daily amplitude reached 180 points, which is a rejoice on the speculators who probably earned on this show. As a result, the quote indicated coordinates for itself, where the ceiling was the value of 1.3513, and the bottom was 1.2904. In fact, we got the same closed chain 1,3000 / 1,3300, where the quotes are developing to this day, and its volatility is amazing. From the current theories, we all have the same assumption that the quotes, although has high volatility, are still reserved for the main movements and can still remain on the market as well as the lateral movement with high amplitude. In terms of the emotional component of the market, we see a reflection of ambiguity, which is confirmed by the structure of the last candles. It is worth considering that although we have an ambiguous mood, this does not prevent us from creating high volatility. Analyzing the past minute by minute, we see that characteristic impulses were present both in the morning and in the afternoon, the most noticeable fluctuation was from 08:00 - 12:00 UTC [time on the trading terminal]. It is also worth taking a closer look at the H4 chart, where six Doge candles were formed extremely notable. In terms of trading, we see that the speculative mood prevailed in comparison with other operations, and the minute chart confirms this. Considering the trading chart in general terms [the daily period], we see that for 127 days the upward trend in the structure of the global downtrend has been preserved. Is it possible to say that we have a turning point in the trend, in some sense, yes, but only one-year-old and by no means global. The news background of the past day had an ADP report, which reflected the growth of employment by 202 thousand in comparison with 124 thousand in the previous month. It is worth considering that the previous data was revised in favor of growth of 67 thousand going to 124 thousand. The market reaction to the ADP report was in the complex of the general strengthening of the American dollar, which began even before the publication of the data, which is in fact, at the time the report was released, there was not such a noticeable reaction . In terms of information background, we have a geopolitical noise associated with Iran, which directly affects the dollar. In turn, no one forgets about the long-running Brexit. So, Yellowhammer's emergency plan of action in the event of a hard exit is removed to the far box, and Boris Johnson is actively negotiating. Yesterday, the Prime Minister of Great Britain met with the President of the European Commission, Ursula von der Leyen, where he outlined his plans to put into effect the agreement on leaving the EU by January 31. At the same time, the prime minister made it clear that he did not intend to extend the transition period after December 31, 2020, arguing that the set period was enough. "Boris Johnson had a positive meeting on Downing Street with European Commission President Ursula von der Leyen. Regarding Brexit, the Prime Minister emphasized that his primary task is to implement the agreement on leaving the European Union by January 31, 2020. They discussed progress in ratification by the British parliaments and the European Parliament. Johnson said he wants a new positive partnership between Britain and the European Union, based on friendly cooperation, our shared history, interests, and values, "the statement said. In turn, the head of the European Commission, Ursula von der Leyen, is skeptical of Johnson's idea not to prolong the transition period because there is very little time left to solve all problems. "The transition period is very, very tough ... therefore, in principle, it is impossible to agree on everything that I mentioned, so we will have to set priorities," the head of the European Commission said. Today, in terms of the economic calendar, we have data on applications for unemployment benefits in the United States, where a reduction of 34 thousand is expected [Primary: - 3 thousand; Repeat: -31 thousand.] Further development Analyzing the current trading chart, we see that after a slight rebound, the descent resumed again, drawing an impulse candle to the side of the psychological level of 1.3000. In fact, the periodic support in the face of the value 1.3079-1.3053 lasted an extremely short time and subsequently served as a strengthening point. At the same time, almost simultaneously with the impulse candle, news came out on Bloomberg, in which information about a very sad situation regarding holiday sales in Britain was revealed, where Marks & Spencer Group Plc, Tesco Plc, and John Lewis Partnership Plc presented their reports. As you understand, everything is very sad, and in time with the publication and the leap of the pound we see synchronism. Now we will raise the reason, and any horror stories escalate speculators and, as a matter of fact, market volatility. By detailing the time segment that we have per minute, we see that the main jump occurred at 08:30 UTC [time on the trading terminal]. In turn, speculators have already entered short positions, as soon as the price has overcome the first minimum of stagnation of 1.3079, and the first partial fixation has already occurred at 1.3053, with further retention towards 1.3000. Having a general picture of actions, it is possible to say that the price has moved to a control rapprochement with the psychological level of 1.3000, having a considerable inertial course. Will sellers be able to overcome the value of 1.3000, while it is not worth making hasty conclusions since local overselling is already on the nose. For starters, we can assume the occurrence of deceleration within the control value. Based on the above information, we derive trading recommendations: - Buy positions are considered in case of slowdown and development of the psychological level of 1.3000. - Sales positions are already being held by many traders and are moving into the stage of full fixation. Further transactions will be considered after the breakdown of the level of 1.3000. Indicator analysis Analyzing a different sector of timeframes (TF), we see that the indicators are unanimously tuned for a downward movement relative to all-time intervals. In fact, we see confirmation of the general mood of the trading chart. Volatility per week / Measurement of volatility: Month; Quarter Year Measurement of volatility reflects the average daily fluctuation, calculated for the Month / Quarter / Year. (January 9 was built taking into account the time of publication of the article) The current time volatility is 106 points, which is already a high indicator for this time section. It is likely to assume that if the fulcrum is within the psychological level, volatility may slow down, keeping us at current values. Key levels Resistance zones: 1.3180 **; 1.3300 **; 1.3600; 1.3850; 1.4000 ***; 1.4350 **. Support Areas: 1,3000; 1.2885 *; 1.2770 **; 1.2700 *; 1.2620; 1.2580 *; 1.2500 **; 1.2350 **; 1.2205 (+/- 10p.) *; 1.2150 **; 1,2000 ***; 1.1700; 1.1475 **. * Periodic level ** Range Level *** Psychological level **** The article is built on the principle of conducting a transaction, with daily adjustment The material has been provided by InstaForex Company - www.instaforex.com |
| You are subscribed to email updates from Forex analysis review. To stop receiving these emails, you may unsubscribe now. | Email delivery powered by Google |
| Google, 1600 Amphitheatre Parkway, Mountain View, CA 94043, United States | |

No comments:
Post a Comment