Forex analysis review |
- Forecast for EUR/USD on February 3, 2020
- Forecast for GBP/USD on February 3, 2020
- Forecast for USD/JPY on February 3, 2020
- Overview of the GBP/USD pair. February 3. Transition period for Great Britain has begun; Boris Johnson in no hurry with negotiations
- Overview of the EUR/USD pair. February 3. Donald Trump's impeachment vote to be held in the Senate this week
- Fractal analysis for major currency pairs on February 3
- GBP/USD. Results of the month. Market euphoria in January is groundless. Great Britain finally starts to exit the EU
- EUR/USD. Results of the month. Euro grew by end of the month, but hardly for a long time. Balance of power between US and
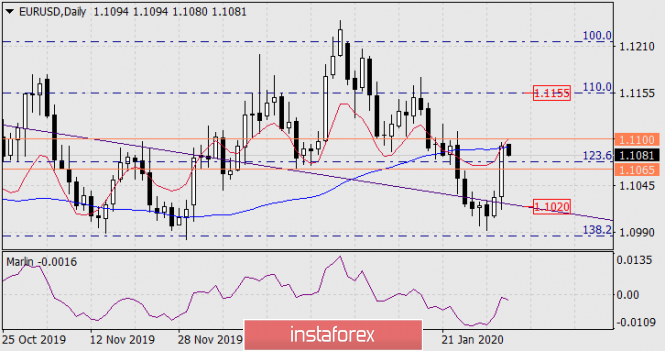
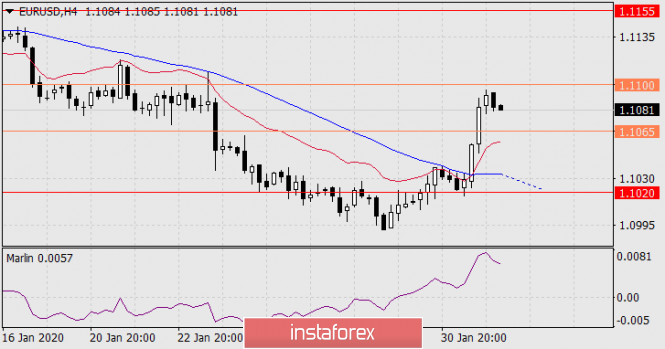
| Forecast for EUR/USD on February 3, 2020 Posted: 02 Feb 2020 08:07 PM PST EUR/USD The euro rose 60 points last Friday, against economic releases in Europe and the United States. The fall in the yields of US government bonds was probably the main pressure on the dollar; the yield on 10-year securities decreased from 1.584% to 1.505%, on 2-year securities from 1.411% to 1.319%. Eurozone GDP showed an increase of 0.1% for the fourth quarter, against expectations of 0.2% (decrease from 1.2% y/y to 1.0% y/y). US personal incomes of consumers increased by 0.2% in December, while personal expenses were up 0.3%. The University of Michigan consumer confidence index for the final assessment in January was raised to 99.8 points from 99.1 points. And only the index of business activity in the manufacturing sector of the Chicago region fell from 48.9 to 42.9. However, this is the smallest value since October 2009, and it could very well have an effect on the weakening of the US currency. The market expectation of a rate cut at the next Fed meeting increased from 16% to 26%. However, investors do not expect a real increase (that is, with a probability above 50%) until the end of the year. US data after the Chicago indicator can be rehabilitated today by the ISM National PMI - January forecast 48.5 versus 47.2 in December. Tomorrow's volume of factory orders for December is expected in the range of 0.7-1.2% against -0.7% a month earlier. If economists were mistaken in their estimates of economic prospects, then the euro will continue to grow to a Fibonacci level of 110.0% at the price of 1.1155 (daily chart). The signal line of the Marlin oscillator is turning from the boundary with the growth zone. From the opening of the session, the price immediately returned below the MACD line. The range of 1.1065-1.1100 is still an uncertain zone. Consolidation below its lower boundary can fuel a downward trend. The immediate goal of 1.1020 is to support the embedded line of the price channel. The trend is completely upward on the four-hour chart - the price is above the indicator lines, the Marlin oscillator is reversing, but without clear reversal patterns. To continue the growth, the price must be consolidated above the upper limit of the 1.1100 range. Consolidation below 1.1065 may return the price to the MACD line, to the area 1.1020, to which the line seeks. The statistical probability of a reversal is 60%. The material has been provided by InstaForex Company - www.instaforex.com |
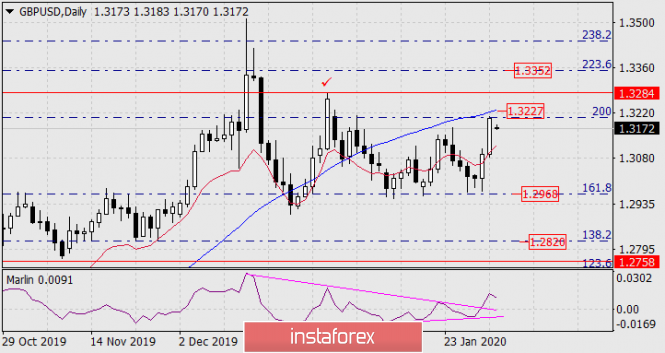
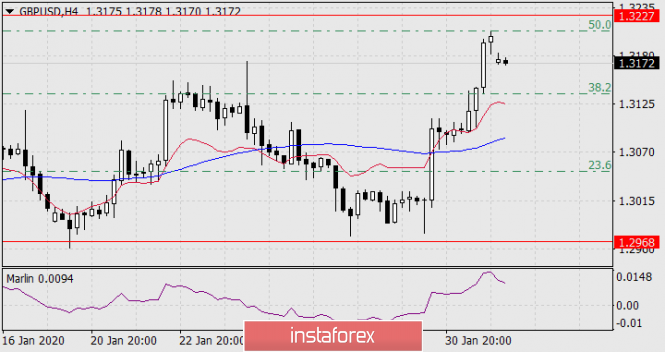
| Forecast for GBP/USD on February 3, 2020 Posted: 02 Feb 2020 08:06 PM PST GBP/USD The pound rose 110 points on Friday amid the general weakening of the dollar. Growth stopped exactly at the Fibonacci level of 200.0%. Today the market opened with a window (gap) down, which becomes a sign of another upward price surge for its closure and likely testing the MACD line (1.3227). But growth may not end there. Overcoming the MACD line opens the target at the top of December 31, 1.3284, then growth to the Fibonacci level of 223.6% at the price of 1.3352 may follow. A sign of such strong potential growth is the upward movement of the Marlin oscillator signal line from its own wedge-shaped structure. A gap in the quote at the opening on the technical side can be a sign of a reversal, since the four-hour chart may form an oscillator divergence when the window is closed. In this case, leaving the triangle on daily may be a false signal. So, for the British pound, it remains to wait for either a reversal pattern to form or price consolidation above 1.3227. The material has been provided by InstaForex Company - www.instaforex.com |
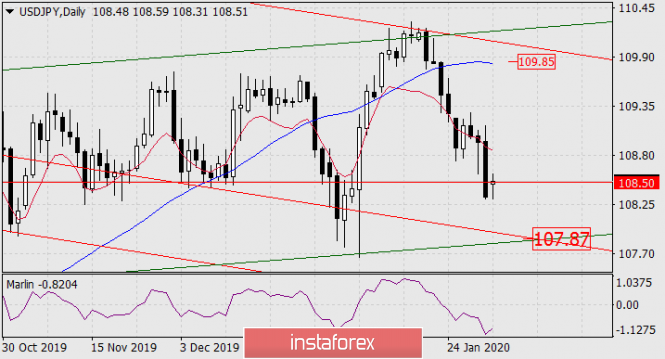
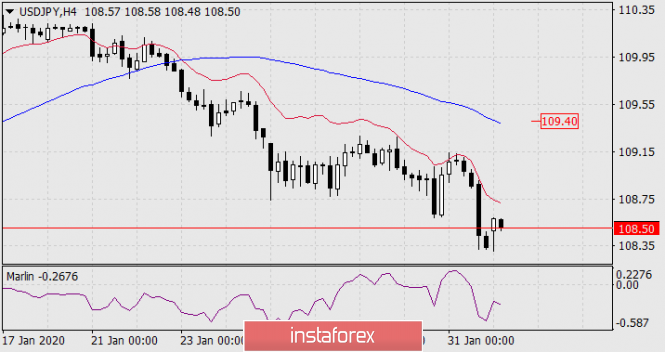
| Forecast for USD/JPY on February 3, 2020 Posted: 02 Feb 2020 08:04 PM PST USD/JPY The situation in the stock market is deteriorating every day. Concerns are circulating that market peaks on January 22 (3337 by S&P 500) and January 17 (29373 by Dow Jones) will not be overcome this year. The Dow Jones collapsed by 2.09% on Friday, while the Nikkei 225 lost 1.12% today in the Asian session. On the daily chart, the price is falling under the lines of balance (indicator red) and MACD (indicator blue), the Marlin oscillator is falling in the zone of negative values. The price surpassed the target level of 108.50 (the September 18, 2019 high), thereby opening the new target of 107.87 - the area of intersection of two lines of price channels - a red one going down and a green one growing. The price is below the indicator lines on a four-hour chart, Marlin is developing in the territory of the bears. We are waiting for the price to fall further. The material has been provided by InstaForex Company - www.instaforex.com |
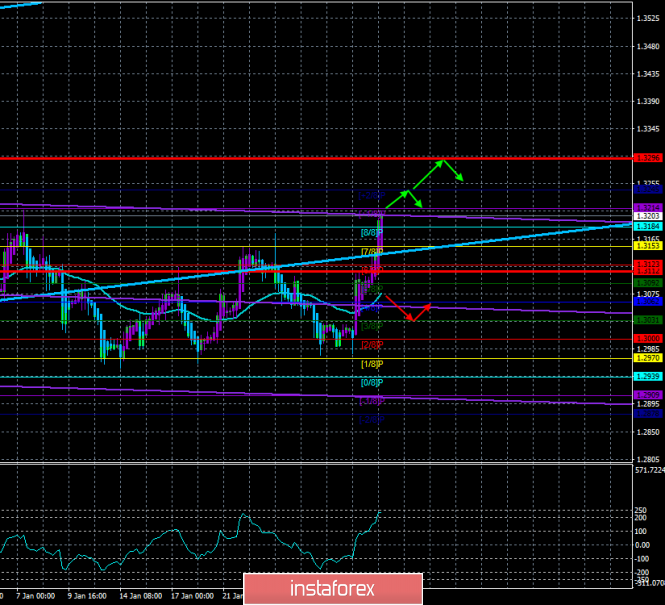
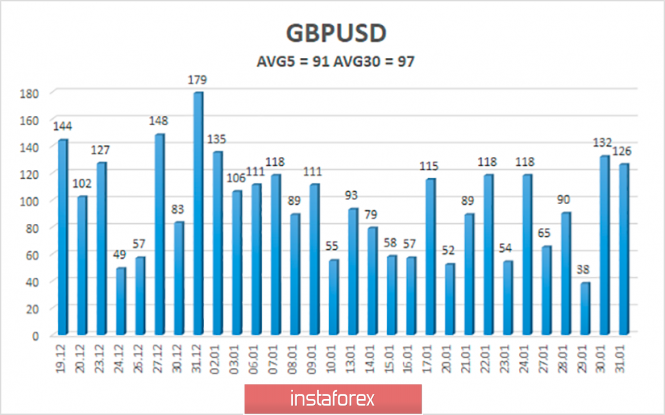
| Posted: 02 Feb 2020 07:00 PM PST 4-hour timeframe Technical details: Higher linear regression channel: direction - up. Lower linear regression channel: direction - sideways. Moving average (20; smoothed) - up. CCI: 234.0011 The GBP/USD currency pair begins February 3 with the continuation of the upward movement, which began on Friday. However, as we said in recent reviews, the flat continues in the long term (24-hour timeframe), which lasted all January. The pair tried to stop moving in the side channel on Friday, but there were no good reasons for the pound to strengthen. The growth of the British currency in the last two days of January is usually identified with the Bank of England's meeting and its results. More precisely, with the absence of these, which was a surprise for most traders. But if we examine the situation more closely: why is the pound growing if the BoE has not changed anything in its monetary policy and even the mood of the monetary committee has not changed? Is the pound appreciation caused by Brexit? Then this reason is even more doubtful, since Brexit itself did not change anything on January 31 in relations between the UK and the European Union. The "transition period" officially began, which should end on December 31, 2020, and just then it can be considered that Brexit has taken place and is fully completed. We have already discussed the fact that nothing is changing for Great Britain. Today I propose to recall all the reasons why Britain wanted to leave the EU. These reasons will help to determine if any other countries will follow the path of Great Britain. Firstly, a migration policy that did not suit the British. Since the EU has no borders within itself, labor migrants penetrating into its territory had the opportunity to travel as they please. Of course, from the point of view of the level of earnings, migrants chose the countries with the strongest economies, which means that such a flood of people wishing to earn a flood in the UK that the social infrastructure could hardly cope with it. The second reason is that it is difficult for the British government to make a decision and the long process of agreeing any decision with Brussels, that is, with all EU member states. Thirdly, contributions to the treasury of the EU are not equal for all its members. The UK, as a country with one of the strongest economies, is larger than many other participating countries, while not receiving higher dividends from participation in the EU. At least, ordinary Britons thought so, and in fact the fate of Brexit in 2016 depended on their opinions. Although in fact, the UK did not pay the most, Italy, France and Germany ranked first in terms of contributions. Fourth, London's fierce desire to independently decide with whom to trade and on what terms. A few decades ago, the EU was really attractive in terms of ease of trade and access to markets. Now these problems are not so acute, especially since the UK will be able to trade again with the EU, the main thing is to agree on a deal, but in addition to the EU, London will be able to trade with other partners on terms that will be beneficial to it, and not to Brussels. There were other, less significant reasons, such as British traditions or the work of the UK judiciary, which also depended on EU law. From our point of view, we will now become witnesses of the next part of the "Marleson ballet". Now Boris Johnson and Michel Barnier will conduct complex negotiations on trade relations, which will operate after 2020. The UK is set to publish an index of business activity in the manufacturing sector on Monday, February 3, which may finally come out of the recession zone. Experts' forecasts indicate a value of 49.8, however, such a value was recorded last month, so theoretically it can be exceeded. If this is so, then perhaps the BoE's mood, which expects to see the economic recovery without its intervention, will gain some fundamental confirmation. As for the prospects for the pound in the coming days, it is most logical to see a correction, as well as in the case of the euro. We are waiting for the Heiken Ashi indicator to turn down today. The average volatility of the pound/dollar pair has grown to 91 points over the past five days. According to the current level of volatility, the working channel on February 3 will be limited to 1.3112 and 1.3396. Corrective movement will be very logical for Monday, as the pound has strengthened quite a bit in the last two trading days. Nearest support levels: S1 - 1.3184 S2 - 1.3153 S3 - 1,3123 The nearest resistance levels: R1 - 1.3214 R2 - 1,3245 Trading recommendations: The GBP/USD pair continues the upward movement, which can be very short. Thus, traders are now advised to remain in pound sterling purchases with targets 1.3214 and 1.3245 until the Heiken Ashi indicator turns down. It is recommended to return to selling the British currency after the pair is re-attached below the moving average line with the first targets of 1.3031 and 1.3000. In addition to the technical picture, fundamental data and the time of their release should also be taken into account. Explanation of illustrations: The highest linear regression channel is the blue unidirectional lines. The smallest linear channel is the purple unidirectional lines. CCI - blue line in the indicator regression window. Moving average (20; smoothed) - a blue line on the price chart. Murray levels - multi-colored horizontal stripes. Heiken Ashi is an indicator that colors bars in blue or purple. Possible price movements: Red and green arrows. The material has been provided by InstaForex Company - www.instaforex.com |
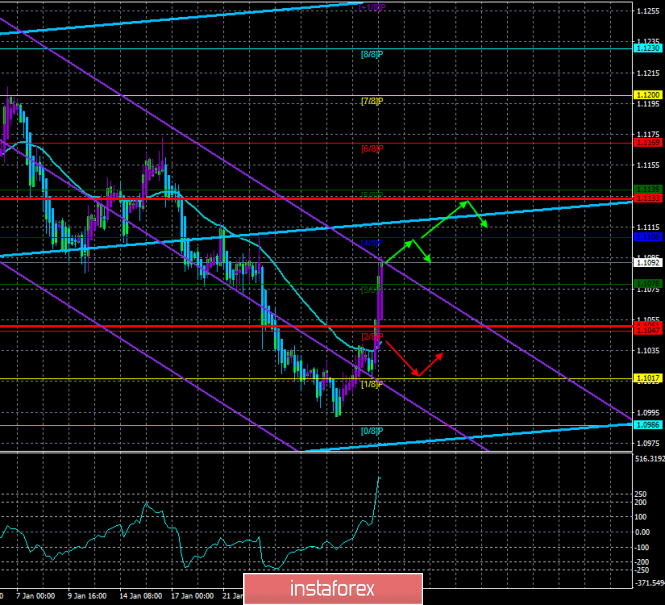
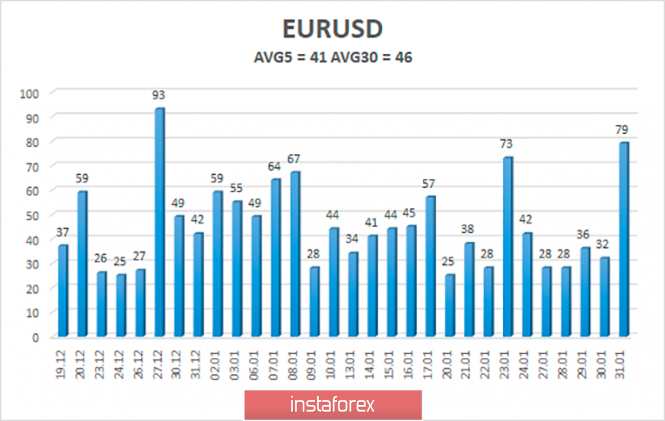
| Posted: 02 Feb 2020 06:58 PM PST 4-hour timeframe Technical details: Higher linear regression channel: direction - up. Lower linear regression channel: downward direction. Moving average (20; smoothed) - up. CCI: 356.0385 A new trading week and a new month begin. Last week ended with a rather strong strengthening of the European currency, which could hardly be predicted. As we already said in previous articles, the euro's current growth can hardly be called justified from the point of view of fundamental analysis. However, technical factors and the stubborn reluctance of the bears to sell the euro/dollar currency pair near the levels of 1.1000 and 1.0900 provokes another upward correction. A new week and Monday may begin with a downward correction, since we have observed a recoilless (and unfounded) upward movement during the last two trading days. In addition, the pair often shows low volatility and movement against the trend on Mondays. The trend has changed to an upward one, as the pair quotes crossed the moving average line. The macroeconomic calendar is usually empty on Monday. But not on February 3. Indices of business activity in the manufacturing sector of the European Union will be published today, which has recently attracted almost the greatest attention. According to experts, the pan-European rate will remain at 47.8. It is also recommended to pay close attention to the German index, which has a forecast of 45.2 (the same as a month earlier). Thus, if these indices show an increase compared with the forecast values, this may cause additional support for the euro. However, we believe that after the euro's two-day growth, we will see a correction in almost any case on Monday, even if business activity in the eurozone industry increases. It is also worth noting that the growth of business activity is a positive factor, but most of the eurozone countries' indices will still remain below the key level of 50.0. Thus, after tomorrow's publications, most likely, we will again be forced to note the ongoing decline in the EU industry. Similar indices for the United States will be published in two versions at the US trading session, Markit and ISM. As we have repeatedly said, the ISM index is the most significant. And it is this index that has gone "below the waterline" in recent months and is now at 47.2. According to forecasts, business activity in the US manufacturing sector will grow up to 48.5 according to ISM, and 51.7 according to Markit. Again, it will be necessary to look at what the real value of the ISM indicator will be. In principle, this data is also likely to have a very indirect effect on trading on Monday only if the values of the reports are not a big surprise for traders. Meanwhile, the US Senate hearing of the impeachment case of Donald Trump is drawing to a close. Most senators came to the conclusion that the investigation listened to a sufficient number of witnesses and examined a sufficient number of documents (about 28,000 pages), so there will be no call for new witnesses, and the final vote for impeachment will be held on Wednesday, February 5. This was stated by the leader of the Republican majority in the Senate, Mitch McConnell. The leader of the Democratic minority, Chuck Schumer, condemned McConell's refusal to call additional witnesses to court and consider new documents. Thus, the whole process ends more than prosaically. In principle, from the very beginning, few believed that Trump would be impeached by the Senate. Now the chances of this are even less than at the beginning. We have repeatedly said that the main point of the whole trial is to pull down Trump's political rating as low as possible. This is precisely the goal that the Democrats pursued after the US president himself unsuccessfully "framed himself" with a conversation with Ukrainian President Vladimir Zelensky, for which he could be charged. It was beneficial for Democrats to drag out the process for as long as possible. This explains their desire to call new witnesses, consider new documents, since on the eve of the November elections, Trump's name should be associated with negative emotions. Far worse than an abuse of office investigation and obstruction to Congress. However, the Senate, in which the majority are Republicans, decided it was time to complete this case and the vote would take place on Wednesday. Basically, on Wednesday we just find out that Trump will remain at his post and that's all. From a technical point of view, the Heiken Ashi indicator continues to paint the bars purple, so there is currently no correction. However, a reversal may occur during the Asian trading session, and a correction will begin on the European. In any case, it is better to consider long positions, if the upward trend continues, after the pair is adjusted. The average volatility of the EUR/USD currency pair increased due to trading on Friday to 41 points per day. However, this is still an extremely low value. Thus, on the first trading day of the week, we expect volatility not to exceed 40 points, and the boundaries of the volatility band will lie at approximately 1.1051 and 1.1133. Nearest support levels: S1 - 1.1078 S2 - 1,1051 S3 - 1,1017 The nearest resistance levels: R1 - 1,1108 R2 - 1.1139 R3 - 1,1169 Trading recommendations: The euro/dollar may begin to adjust on Monday. Thus, purchases of the European currency with the goals of 1.1108 and 1.1133 are relevant now, but we recommend waiting for the correction, its completion and only then should you start buying. It is recommended to return to selling the EUR/USD pair with the target of 1.1017 no earlier than consolidating the price below the moving average line, which will change the current trend to the downward trend, with targets at 1.1017 and 1.0986. In addition to the technical picture, fundamental data and the time of their release should also be taken into account. Explanation of illustrations: The lowest linear regression channel is the blue unidirectional lines. The smallest linear regression channel is the purple unidirectional lines. CCI - blue line in the indicator window. Moving average (20; smoothed) - a blue line on the price chart. Murray levels - multi-colored horizontal stripes. Heiken Ashi is an indicator that colors bars in blue or purple. Possible price movements: Red and green arrows. The material has been provided by InstaForex Company - www.instaforex.com |
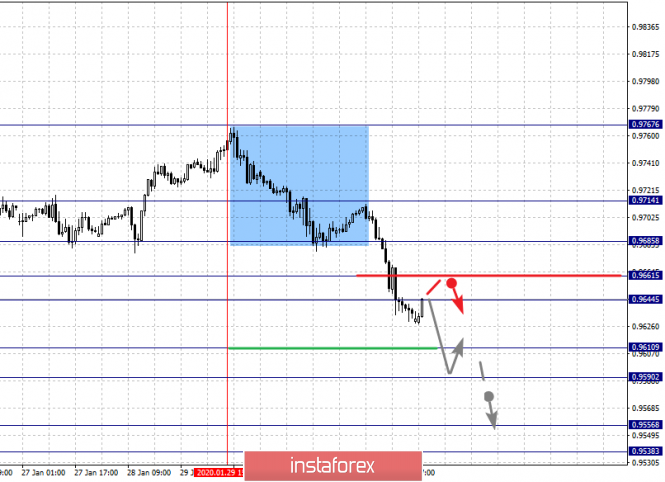
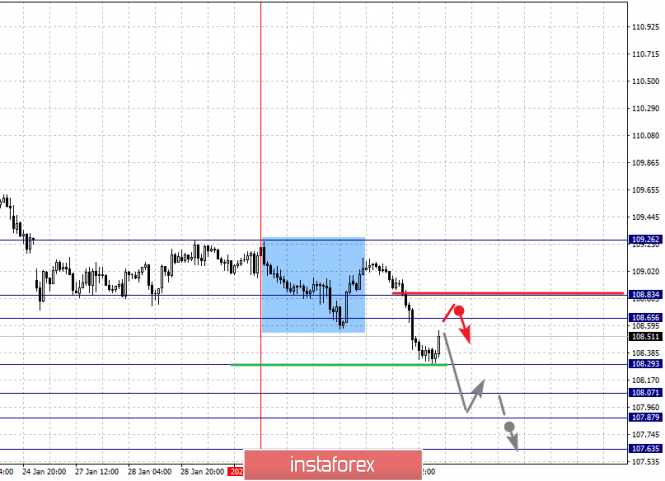
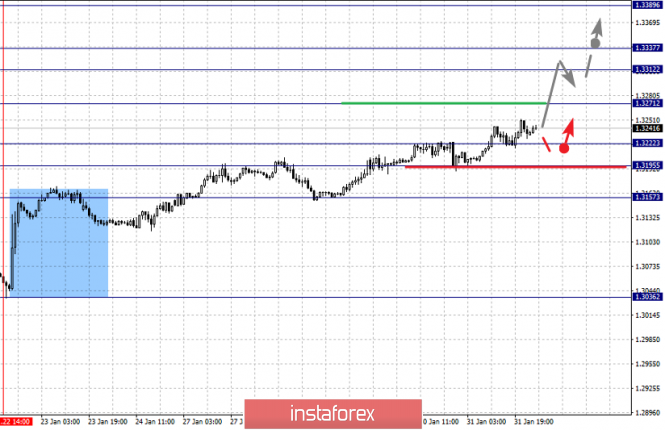
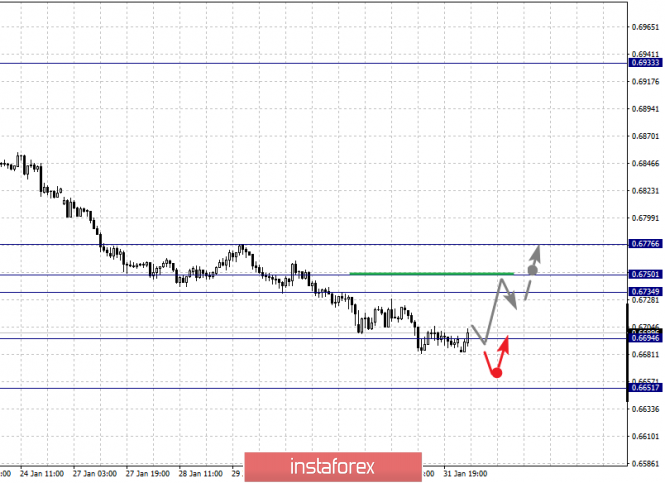
| Fractal analysis for major currency pairs on February 3 Posted: 02 Feb 2020 06:07 PM PST Forecast for February 3: Analytical review of currency pairs on the scale of H1:
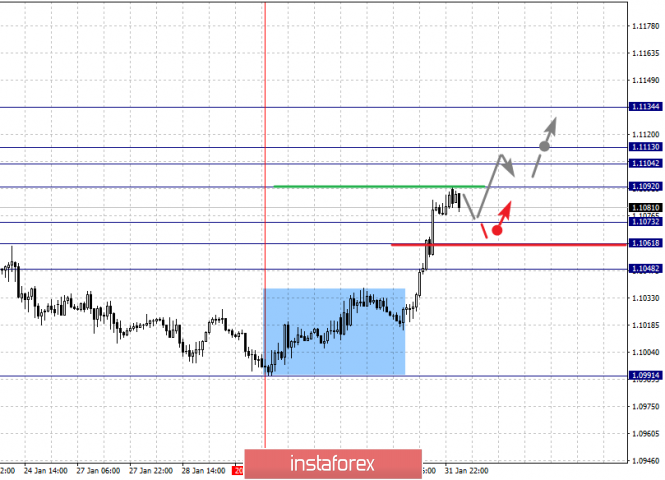
For the euro / dollar pair, the key levels on the H1 scale are: 1.1134, 1.1113, 1.1104, 1.1092, 1.1073, 1.1061 and 1.1048. Here, we monitor the development of the upward cycle of January 29. The continuation of the movement to the top is expected after the breakdown of the level of 1.1092. In this case, the target is 1.1104. Price consolidation is in the range of 1.1104 - 1.1113. For the potential value for the top, we consider the level of 1.1134, upon reaching which, we expect a rollback to the correction. Short-term downward movement is possibly in the range of 1.1073 - 1.1061. The breakdown of the last value will lead to an in-depth correction. Here, the goal is 1.1048. This level is a key support for the upward structure. The main trend is the upward cycle of January 29 Trading recommendations: Buy: 1.1092 Take profit: 1.1104 Buy: 1.1113 Take profit: 1.1134 Sell: 1.1073 Take profit: 1.1062 Sell: 1.1058 Take profit: 1.1048
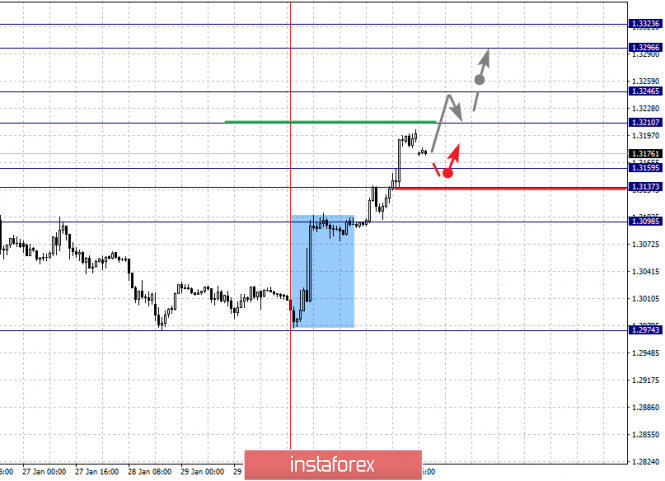
For the pound / dollar pair, the key levels on the H1 scale are: 1.3323, 1.3296, 1.3246, 1.3210, 1.3159, 1.3137 and 1.3098. Here, we are following the development of the ascending structure of January 30. The continuation of the movement to the top is expected after the breakdown of the level of 1.3210. In this case, the target is 1.3246. Price consolidation is near this level. The breakdown of the level of 1.3246 will lead to a pronounced movement. Here, the target is 1.3296. For the potential value for the top, we consider the level of 1.3323. Upon reaching which, we expect consolidation, as well as a pullback to the bottom. Short-term downward movement is possibly in the range of 1.3159 - 1.3137. The breakdown of the last value will lead to an in-depth correction. Here, the target is 1.3098. This level is a key support for the top. The main trend is the upward cycle of January 30 Trading recommendations: Buy: 1.3210 Take profit: 1.3246 Buy: 1.3248 Take profit: 1.3296 Sell: 1.3159 Take profit: 1.3138 Sell: 1.3135 Take profit: 1.3100
For the dollar / franc pair, the key levels on the H1 scale are: 0.9714, 0.9685, 0.9661, 0.9644, 0.9610, 0.9590, 0.9556 and 0.9538. Here, we are following the downward cycle of January 29. Short-term downward movement is expected in the range 0.9610 - 0.9590. The breakdown of the last value should be accompanied by a pronounced downward movement. Here, the target is 0.9556. For the potential value for the bottom, we consider the level of 0.9538. Upon reaching which, we expect consolidation, as well as a rollback to the top. Short-term upward movement is possibly in the range of 0.9644 - 0.9661. The breakdown of the latter value will lead to an in-depth correction. Here, the target is 0.9685. This level is a key support for the downward structure, its passage in price will lead to the formation of an upward structure. Here, the potential target is 0.9714. The main trend is the downward cycle of January 29 Trading recommendations: Buy : 0.9644 Take profit: 0.9660 Buy : 0.9664 Take profit: 0.9682 Sell: 0.9610 Take profit: 0.9593 Sell: 0.9588 Take profit: 0.9557
For the dollar / yen pair, the key levels on the scale are : 109.26, 108.83, 108.65, 108.29, 108.07, 107.87 and 107.63. Here, we determined the subsequent goals for the downward movement from the local structure on January 29. The continuation of the movement to the bottom, we expect after the breakdown of the level of 108.29. In this case, the target is 108.07. Price consolidation is in the range of 108.07 - 107.87. For the potential value for the bottom, we consider the level of 107.63. Upon reaching which, we expect a pullback to the top. Short-term upward movement is possibly in the range of 108.65 - 108.83. The breakdown of the latter value will favor the formation of an ascending structure. Here, the potential target is 109.26. Main trend: local descending structure of January 29 Trading recommendations: Buy: 108.65 Take profit: 108.80 Buy : 108.85 Take profit: 109.20 Sell: 108.27 Take profit: 108.08 Sell: 108.05 Take profit: 107.88
For the Canadian dollar / US dollar pair, the key levels on the H1 scale are: 1.3389, 1.3337, 1.3312, 1.3271, 1.3222, 1.3195 and 1.3157. Here, we are following the development of the upward cycle of January 22. The continuation of the movement to the top is expected after the breakdown of the level of 1.3271. In this case, the target is 1.3312. Price consolidation is in the range of 1.3312 - 1.3337. For the potential value for the top, we consider the level 1.3389. The expressed movement to which is expected after the breakdown of the level of 1.3338. Short-term downward movement is possibly in the range of 1.3222 - 1.3195. The breakdown of the last value will lead to an in-depth correction. Here, the target is 1.3157. This level is a key support for the top. The main trend is the local ascending structure of January 22 Trading recommendations: Buy: 1.3271 Take profit: 1.3312 Buy : 1.3313 Take profit: 1.3335 Sell: 1.3222 Take profit: 1.3197 Sell: 1.3193 Take profit: 1.3160
For the Australian dollar / US dollar pair, the key levels on the H1 scale are : 0.6776, 0.6750, 0.6734, 0.6694 and 0.6651. Here, the price is near the limit value for the descending cycle of January 16. We expect a rollback to correction from the level of 0.6694. Its passage by the price will be accompanied by an unstable movement to the bottom. Here, the potential target is 0.6651, but it is not recommended to work towards this value. Short-term upward movement is expected in the range of 0.6734 - 0.6750. The breakdown of the latter value will lead to an in-depth correction. Here, the target is 0.6776. This level is a key support for the bottom, and before it, we expect the initial conditions for the upward cycle to be formed. The main trend - we expect a correction Trading recommendations: Buy: 0.6734 Take profit: 0.6750 Buy: 0.6752 Take profit: 0.6774 Sell : Take profit : Sell: 0.6680 Take profit: 0.6655
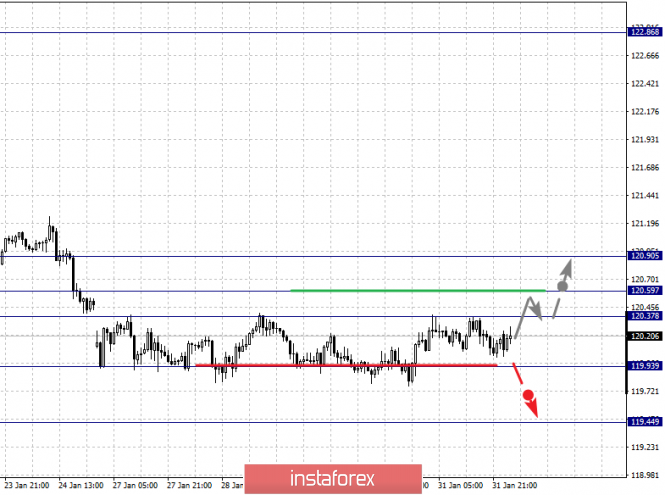
For the euro / yen pair, the key levels on the H1 scale are: 120.90, 120.59, 120.37, 119.93 and 119.44. Here, we mainly expect a correction given the situation for the pound / yen. Short-term upward movement is possibly in the range of 120.37 - 120.59. The breakdown of the last value will lead to an in-depth correction. Here, the goal is 120.90. This level is a key support for the downward structure. The continuation of movement to the bottom is expected after the breakdown of the level of 119.90. In this case, the potential target is 119.44. We expect a pullback in correction upon reaching this level. The main trend is a downward structure from January 16, we expect a correction Trading recommendations: Buy: 120.37 Take profit: 120.57 Buy: 120.61 Take profit: 120.90 Sell: 119.90 Take profit: 119.48 Sell: Take profit:
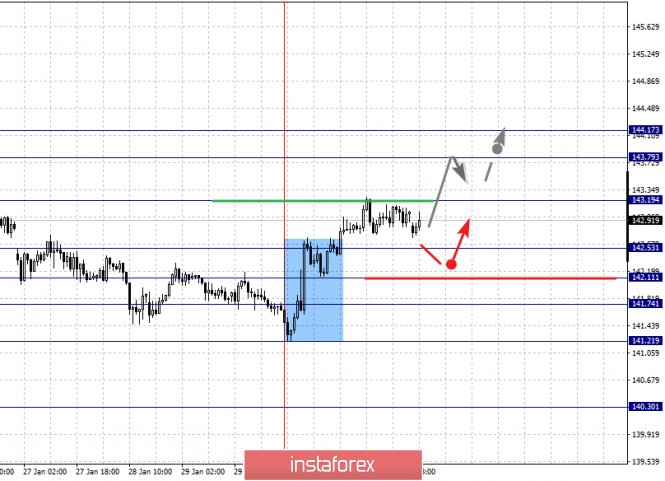
For the pound / yen pair, the key levels on the H1 scale are : 144.17, 143.79, 143.19, 142.53, 142.11, 141.74, 141.21 and 140.30. Here, the price forms a pronounced upside potential for January 30. The continuation of the movement to the top is expected after the breakdown of the level of 143.19. In this case, the goal is 143.79. For the potential value for the top, we consider the level of 144.17. Upon reaching which, we expect consolidation, as well as a pullback to the bottom. Short-term downward movement is expected in the range of 142.53 - 142.11. The breakdown of the last value will lead to an in-depth correction. Here, the goal is 141.74. This level is the key support for the ascending structure and its breakdown will allow us to count on movement to the level of 141.21, which, in turn, is the key resistance to continue the development of a downward trend. The main trend is the descending structure of January 22, the correction stage Trading recommendations: Buy: 143.20 Take profit: 143.79 Buy: 143.80 Take profit: 144.17 Sell: 142.53 Take profit: 142.13 Sell: 142.10 Take profit: 141.76 The material has been provided by InstaForex Company - www.instaforex.com |
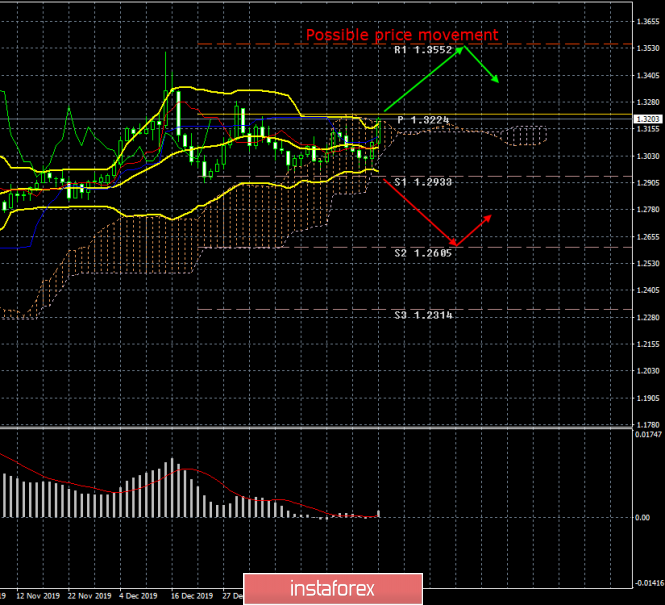
| Posted: 02 Feb 2020 02:47 PM PST 24-hour timeframe The British pound was able to significantly improve its position and as a result lost no more than 40 points for the entire month of January. Thus, January can even be called a successful month for the British currency, although the 24-hour timeframe makes it clear that an open flat was observed throughout the month for the pair. Bollinger bands, directed sideways for a long time, and in recent weeks have also narrowed to a low, also signal about the flat. The pair managed to overcome the upper Bollinger line on the last day of January, but this does not mean that the upward movement will now resume. The whole problem of the pound lies in the conflict between macroeconomic indicators, expectations and euphoria with market optimism. It is unlikely that anyone will deny the existence of serious problems in the British economy. Every trader knows that macroeconomic statistics remain one of the worst among the G7 countries. Every year the economy loses about $ 70 billion due to Brexit, which has just begun, the prospects for the British economy are very vague. Even the conclusions of the Bank of England and the retiring Mark Carney that the UK economy began to recover since Boris Johnson's party won the elections, we consider it premature and a little naive. In fact, the pound now remains in the positions that it won before the December 13 elections. If we carefully look at the chart, then the highest price point was reached on December 13th. Now let's think again, and what were the reasons to buy the pound until December 13? Does the fact that the Conservative Party wins the election alone give any preferences and dividends to the British economy? A faster Brexit than it could be, somehow positively affects the welfare of British citizens? No, even if Brexit were once again postponed, and the Conservatives were not able to form a "majority government", the UK would also continue to suffer financial losses. Someone will say that this period (financial loss) would be longer. Yes, it is possible, however, there would be more time to conclude a trade deal with the European Union. Or maybe Great Britain would not leave the EU at all. One way or another, now this is all unimportant. We will briefly go over all the UK macroeconomic statistics for January to try to form an integral picture of the state of things. The index of business activity in the construction sector - a decrease from 45.3 to 44.4. The index of business activity in the service sector - an increase from 49.3 to 50.0. Industrial production - a decrease from -0.6% y/y to -1.6% y/y. Inflation - decreased from 1.5% y/y to 1.3%. Retail sales - turned out to be slightly higher than expected, but still showed a decrease of -0.6% in monthly terms and lowest growth at 0.9% in annual terms. Average salaries did not change, +3.4%, +3.2% (with bonuses and without bonuses). The index of business activity in the manufacturing sector - an increase from 47.5 to 49.8. The index of business activity in the service sector - an increase from 50.0 to 52.9. What is the result? As a result, only two indicators showed positive dynamics in January: business activity indices in the spheres of production and services, with the first remaining in the "recession zone" (below 50.0). All other macroeconomic statistics either failed or remained unchanged from the previous period. The BoE meeting, which was the last key event of January, raised many questions. On the one hand, traders and analysts somewhere saw an improvement in the state of the British economy, on the other hand, almost everyone believed that the BoE's dovish attitude would increase in January and the number of members of the monetary committee supporting the reduction in the key rate would increase from previous ones two to three or four. However, the British regulator also discerned "improvement of the situation" somewhere, or tried to convince the markets of this and left the key rate unchanged, while the number of those supporting the rate reduction did not change. It was this and only this factor that helped the British currency to rise by almost two cents against the US dollar at the end of the month and even give hope for the formation of a new upward trend. However, we still do not see any good reason for a new rise in the price of the British pound and expect a resumption of the fall. Thus, in general, we can summarize the following: 1) Improvements in the British economy, if they have a place, are minimal. 2) The British economy still needs to be stimulated. 3) Mark Carney and company decided to play it safe in January, pretending that everything is fine, and leave such an effective tool as lowering the rate, as a last resort. 4) The economy of Great Britain may again begin to slow down in the coming months, since, essentially, nothing has changed in January. Trading recommendations: The pound/dollar continues to trade in absolute flat on the 24-hour timeframe. Thus, at the moment, neither short nor long positions are relevant. For a 24-hour timeframe, it is recommended to wait until the lateral movement is complete. Trends are observed at 4-hour, but they are very quickly completed. Explanation of the illustration: Ichimoku indicator: Tenkan-sen is the red line. Kijun-sen is the blue line. Senkou Span A - light brown dotted line. Senkou Span B - light purple dashed line. Chikou Span - green line. Bollinger Bands Indicator: 3 yellow lines. MACD indicator: Red line and bar graph with white bars in the indicators window. The material has been provided by InstaForex Company - www.instaforex.com |
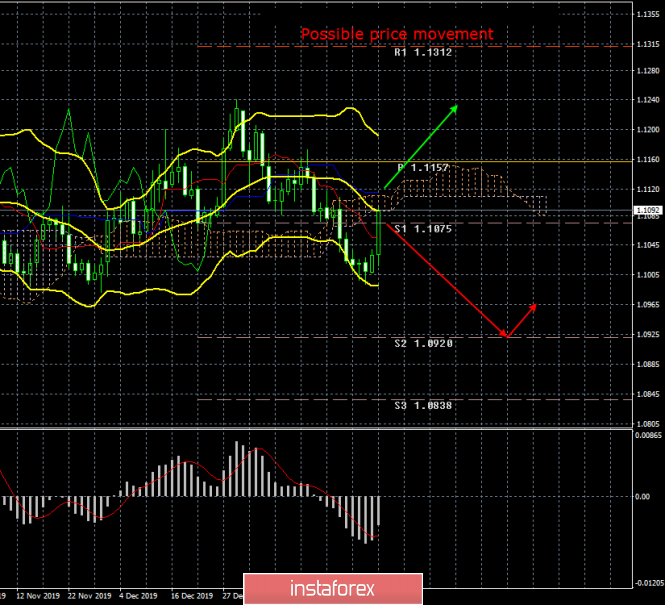
| Posted: 02 Feb 2020 02:47 PM PST 24-hour timeframe The last two trading days of January 2020 offset half of all the euro currency's losses this month. And although volatility remains extremely low (the euro/dollar pair fell "as much" as 240 points for a month), a certain trend movement is still present. One fact we must note at the very beginning. The pair approached the lows of November 13 and 29 at the end of January and was not able to overcome this area for the third time (around the level of $1.10). This suggests that sellers become sharply less on the way to this level, and buyers place pending buy orders near this level, not believing that the euro can resume a long-term downward trend. In general, it can be almost unambiguously stated that the bears have huge problems with overcoming the area of $1.09 - $1.10. And if not for this area, we would have long been observing the euro currency near the price parity with the dollar. How can one not recall the "paradoxical situation", which we have already described several times. The problem is that the bears are afraid to sell the pair near the level of $1.10, and the bulls have no special fundamental and macroeconomic reasons for buying the euro. Therefore, we generally observe the same picture over the past 9-10 months: the pair leisurely approaches 2-year lows, after which the bears stop selling the pair and the correction begins at 200-300 points up; Furthermore, bulls are not fundamentally supported by anything and they also begin to reduce purchases; the pair again falls to the area of 1.0900 - 1.1100 and the demand for the dollar falls, which causes quotes to leave up. We had high hopes for the actions and policies of the central banks of the United States and the European Union. It is they, from our point of view, who could and can influence the currency pair in order to get it out of the "almost flat" state. The Federal Reserve and European Central bank meetings took place in January. However, unfortunately, both central banks did not take any measures; they did not announce any changes in monetary policy. Therefore, in fact, the situation did not change after both meetings. The ECB continues to prepare for an even greater slowdown in the EU economy, reduces forecasts for GDP and does not believe that it will be possible to reach a 2% inflation rate in the near future. Indeed, 2% in the long run has not been achieved over the past 8 years, why would inflation suddenly begin to accelerate now, in a period of ultra-low interest rates and global trade uncertainty? Christine Lagarde once again announced the "global structural changes", the formation of which will require at least a year. Indices of business activity in the EU began to recover slightly (we are talking about the industrial production sector), and industrial production itself continues to decline. The situation is approximately the same in the United States. The Fed left the interest rate unchanged, Jerome Powell noted the "good condition" of the economy, confident, albeit moderate, growth rates. Business activity in industry, however, continues to be at a low level, industrial production - to decline, GDP growth - to fall. Inflation in recent months seems to have grown to 2.3% y/y, but there is every reason to believe that it was a "seasonal surge" and inflation in the United States will begin to slow down again in January and February. Thus, the difference between the slowing economies of the EU and the US is only that overall macroeconomic performance in the United States remains higher. Both GDPs are slowing, but eurozone GDP has slowed to 1.0%, and the United States to 2.1%. Inflation remains low, but it is 1.4% y/y in the EU, and 2.3% in the United States. And so it is with almost all indicators. Thus, until the statistics in the EU begin to grow, counting on a serious strengthening of the European currency makes no sense. As for the prospects and global factors that may affect the EU and US economies in the near future, everything is extremely simple here. Firstly, these are all the same trade wars. Despite world optimism about the conclusion of the "first phase" deal between Beijing and Washington, the trade war continues, and most of the duties imposed by Trump and due to which the global economy was slowed down remained in force. In addition, during the international economic forum in Davos, Trump has already announced a trade war with the EU if "Europeans do not sign a trade deal that would be beneficial to America." Thus, according to unconfirmed information, negotiations between the EU and the US are already underway, but nothing is reported on their progress. We have no idea at what stage the negotiations are and whether it is likely that a trade deal will be concluded without starting a trade war. However, we can say for sure that if Trump introduces duties on EU engineering products, this will be a severe blow to the bloc economy. Europeans are well aware of this, and will make every effort to avoid conflict with the odious American leader. From a technical point of view, on a 24-hour chart, the euro/dollar pair returned to the Ichimoku cloud. Since we still believe that there are no special fundamental reasons for the euro to go up, the downward movement may resume in the near future. However, as before, we recommend trading on the downside with the "approval" of technical factors and indicators. Trading recommendations: The trend for the euro/dollar pair has changed in a downward direction. Thus, on a 4-hour time frame, it is recommended to consider short positions after an appropriate sell signal from Ichimoku has formed. Most likely, on a 24-hour timeframe, the pair will hang up from the Senkou Span B or Kijun-sen line and resume downward movement. Explanation of the illustration: Ichimoku indicator: Tenkan-sen is the red line. Kijun-sen is the blue line. Senkou Span A - light brown dotted line. Senkou Span B - light purple dashed line. Chikou Span - green line. Bollinger Bands Indicator: 3 yellow lines. MACD indicator: Red line and bar graph with white bars in the indicators window. The material has been provided by InstaForex Company - www.instaforex.com |
| You are subscribed to email updates from Forex analysis review. To stop receiving these emails, you may unsubscribe now. | Email delivery powered by Google |
| Google, 1600 Amphitheatre Parkway, Mountain View, CA 94043, United States | |

No comments:
Post a Comment