
Forex analysis review |
- Fractal analysis of the main currency pairs for February 17
- GBP/USD. Preview of the new week. Pound to closely monitor inflation and business activity in the industry
- EUR/USD. Preview of the new week. Dull week - euro's chance to move away from three-year lows?
| Fractal analysis of the main currency pairs for February 17 Posted: 16 Feb 2020 05:58 PM PST Forecast for February 17: Analytical review of currency pairs on the scale of H1:
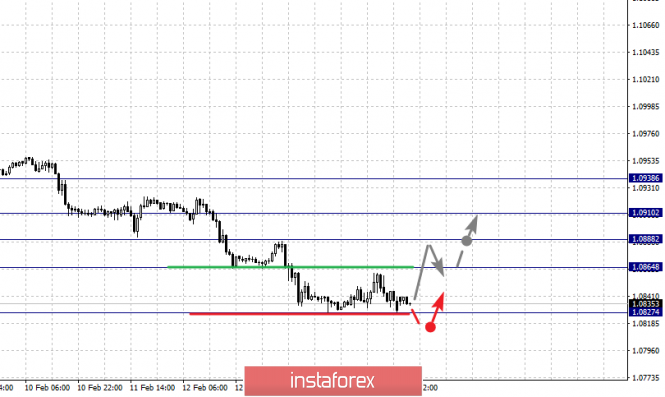
For the euro / dollar pair, the key levels on the H1 scale are: 1.0938, 1.0910, 1.0888, 1.0864 and 1.0827. Here, the price is near the limit values for the downward cycle, and therefore, we expect a correction. Short-term upward movement is expected in the range of 1.0864 - 1.0888. The breakdown of the last value will lead to the development of correction. Here, the goal is 1.0910. This level is a key support for the downward structure and its passage at the price will lead to the formation of expressed initial conditions for the upward cycle. In this case, the potential target is 1.0938. The main trend is a downward structure from January 31, we expect a correction Trading recommendations: Buy: 1.0864 Take profit: 1.0887 Buy: 1.0888 Take profit: 1.0910 Sell: Take profit: Sell: Take profit:
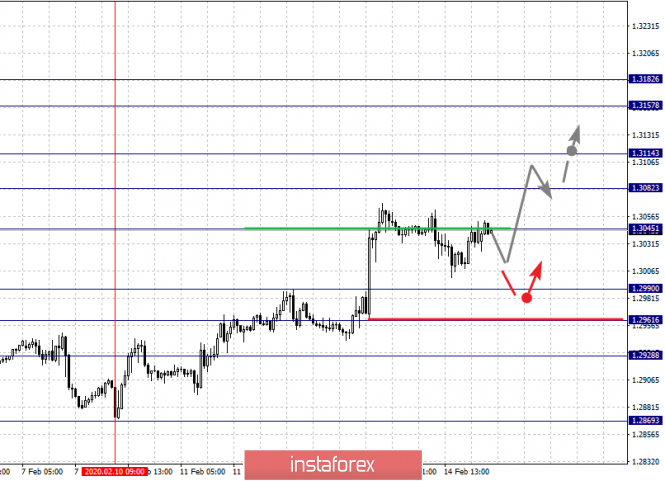
For the pound / dollar pair, the key levels on the H1 scale are: 1.3182, 1.3157, 1.3114, 1.3082, 1.3045, 1.2990, 1.2961 and 1.2928. Here, we are following the development of the ascending structure of February 10. The continuation of the movement to the top is expected after the breakdown of the level of 1.3045. In this case, the target is 1.3082. Short-term upward movement, as well as consolidation is in the range of 1.3082 - 1.3114. The breakdown of the level of 1.3114 will lead to a pronounced movement. In this case, the potential target is 1.3157. Upon reaching which, we expect a consolidated movement in the range 1.3157 - 1.3182, as well as a correction. Short-term downward movement is possibly in the range of 1.2990 - 1.2961. The breakdown of the latter value will lead to an in-depth correction. Here, the target is 1.2928. This level is a key support for the upward structure. The main trend is the ascending structure of February 10. Trading recommendations: Buy: 1.3045 Take profit: 1.3080 Buy: 1.3083 Take profit: 1.3112 Sell: 1.2990 Take profit: 1.2962 Sell: 1.2959 Take profit: 1.2930
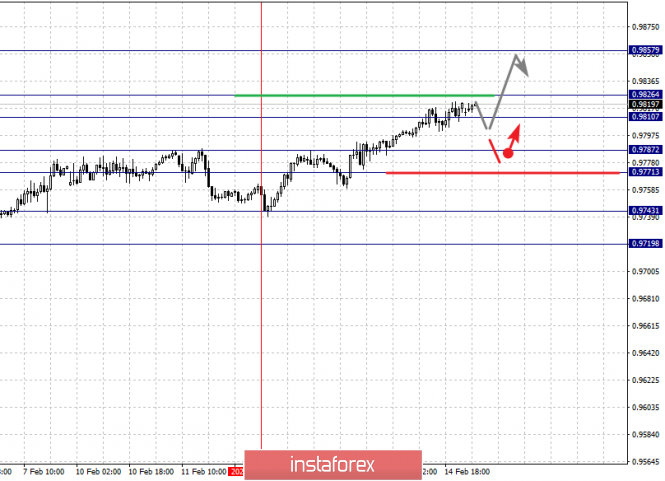
For the dollar / franc pair, the key levels on the H1 scale are: 0.9858, 0.9826, 0.9810, 0.9787, 0.9771, 0.9743 and 0.9719. Here, we are following the local ascendant structure of February 12. Short-term upward movement is expected in the range of 0.9810 - 0.9826. The breakdown of the latter value will lead to movement to a potential target - 0.9857. We expect a pullback to the bottom from this level. Short-term downward movement is possibly in the range of 0.9787 - 0.9771. The breakdown of the latter value will lead to the development of a downward structure. In this case, the first potential target is 0.9743. We expect expressed initial conditions for a downward cycle to the level of 0.9719. The main trend is the local potential for the top of February 12 Trading recommendations: Buy : 0.9810 Take profit: 0.9824 Buy : 0.9827 Take profit: 0.9856 Sell: 0.9787 Take profit: 0.9773 Sell: 0.9769 Take profit: 0.9745
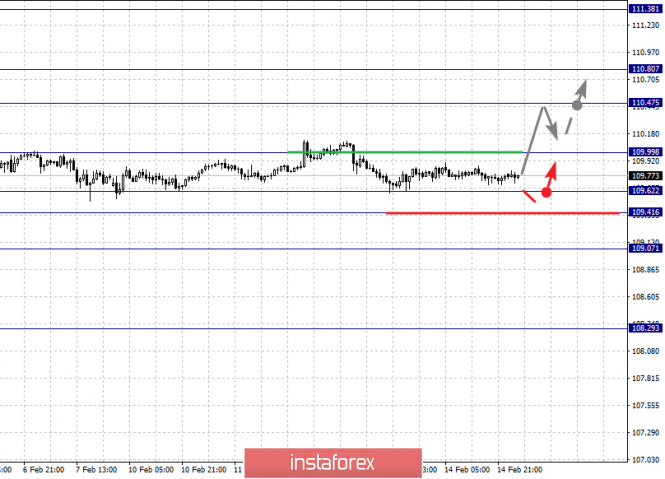
For the dollar / yen pair, the key levels on the scale are : 110.80, 110.47, 109.99, 109.62, 109.41 and 109.07. Here, we are following the development of the ascending structure of January 31. The continuation of the movement to the top is expected after the breakdown of the level of 110.00. In this case, the target is 110.47. Price consolidation is near this level. For the potential value for the top, we consider the level 110.80. Upon reaching which, we expect a pullback to the bottom. Short-term downward movement is possibly in the range of 109.62 - 109.41. The breakdown of the latter value will lead to an in-depth correction. Here, the goal is 109.07. This level is a key support for the top. Main trend: upward structure of January 31 Trading recommendations: Buy: 110.00 Take profit: 110.45 Buy : 110.49 Take profit: 110.80 Sell: 109.60 Take profit: 109.42 Sell: 109.38 Take profit: 109.10
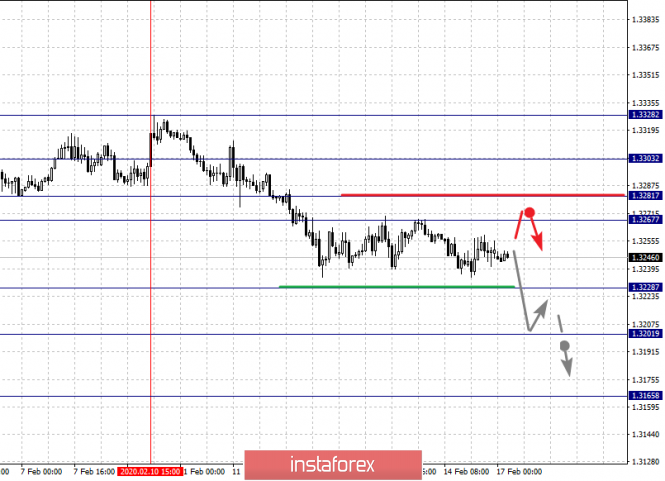
For the Canadian dollar / US dollar pair, the key levels on the H1 scale are: 1.3303, 1.3281, 1.3267, 1.3228, 1.3201 and 1.3165. Here, the descending structure of February 10 is considered medium-term. The continuation of movement to the bottom is expected after the breakdown of the level of 1.3228. In this case, the target is 1.3201. Price consolidation is near this level. The breakdown of the level of 1.3200 will lead to the development of pronounced movement to the bottom. Here, the potential target is 1.3165. We expect a pullback to the top from this level. Short-term upward movement is possibly in the range of 1.3267 - 1.3281. The breakdown of the latter value will lead to an in-depth correction. Here, the target is 1.3303. This level is a key support for the downward structure. The main trend is the formation of medium-term initial conditions for the downward movement of February 10 Trading recommendations: Buy: 1.3267 Take profit: 1.3281 Buy : 1.3283 Take profit: 1.3303 Sell: 1.3226 Take profit: 1.3203 Sell: 1.3199 Take profit: 1.3167
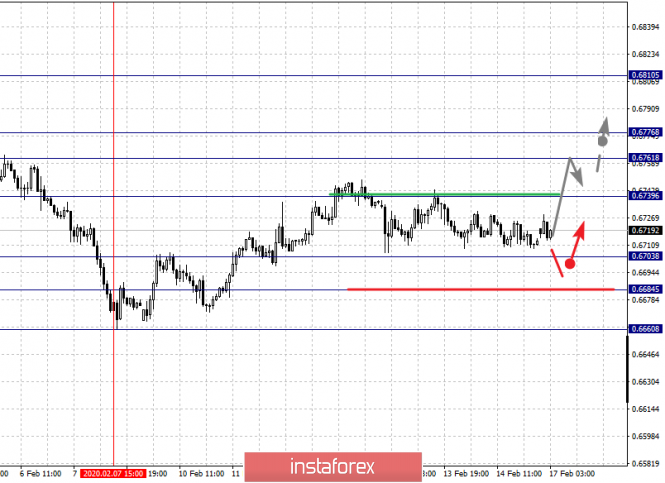
For the Australian dollar / US dollar pair, the key levels on the H1 scale are : 0.6810, 0.6776, 0.6761, 0.6739, 0.6703, 0.6684 and 0.6660. Here, we are following the development of the ascending structure of February 7. The continuation of the movement to the top is expected after the breakdown of the level of 0.6740. In this case, the target is 0.6761. Short-term upward movement, as well as consolidation is in the range of 0.6761 - 0.6776. For the potential value for the top, we consider the level of 0.6810. Upon reaching which, we expect a pullback to the bottom. Short-term downward movement is possibly in the range of 0.6703 - 0.6684. Hence, a high probability of a reversal to the top. On the other hand, the breakdown of the level of 0.6684 will lead to the formation of a downward structure. Here, the potential target is 0.6660. The main trend is the upward structure of February 7 Trading recommendations: Buy: 0.6740 Take profit: 0.6761 Buy: 0.6762 Take profit: 0.6775 Sell : 0.6703 Take profit : 0.6687 Sell: 0.6682 Take profit: 0.6660
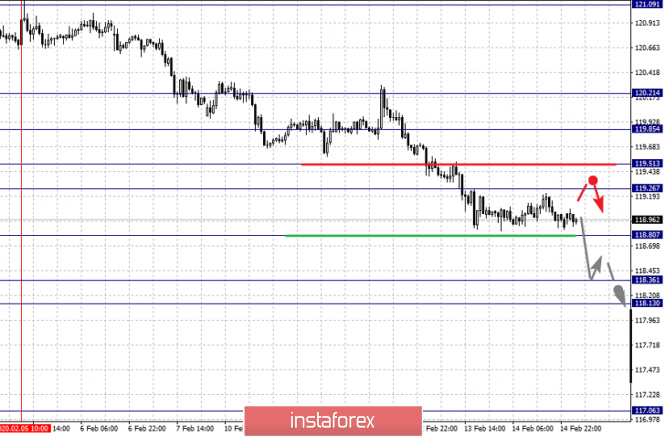
For the euro / yen pair, the key levels on the H1 scale are: 119.85, 119.51, 119.26, 118.80, 118.36 and 118.13. Here, we are following the descending structure of February 5. The continuation of movement to the bottom is expected after the breakdown of the level of 118.80. In this case, the goal is 118.36. For the potential value for the bottom, we consider the level of 118.13. Upon reaching which, we expect consolidation, as well as a pullback to the top. Short-term upward movement is possibly in the range of 119.26 - 119.51. The breakdown of the last value will lead to an in-depth correction. Here, the goal is 119.85. This level is a key support for the downward structure. The main trend is the descending structure of February 5 Trading recommendations: Buy: 119.26 Take profit: 119.50 Buy: 119.55 Take profit: 119.85 Sell: 118.80 Take profit: 118.38 Sell: 118.34 Take profit: 118.14
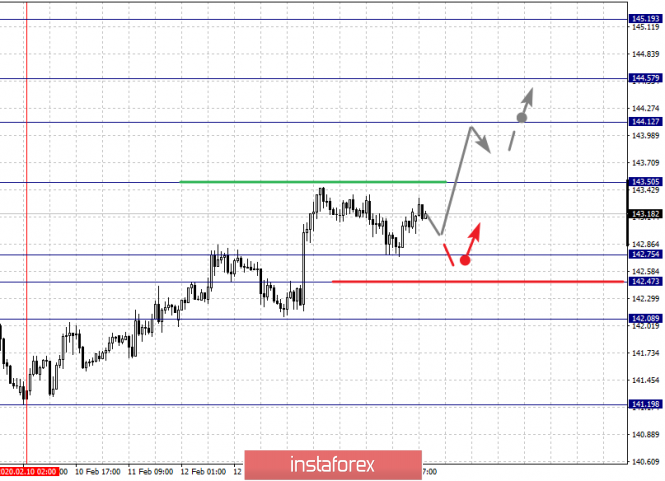
For the pound / yen pair, the key levels on the H1 scale are : 145.19, 144.57, 144.12, 143.50, 142.75, 142.47 and 142.08. Here, we revised the key objectives for the upward structure of February 10. The continuation of movement to the top is expected after the breakdown of the level of 143.50. In this case, the target is 144.12. The breakdown of this value will lead to short-term upward movement in the range 144.12 - 144.57. Hence, there is also a high probability of a reversal to correction. For the potential value for the top, we consider the level of 145.19. Upon reaching this level, we expect a pullback to the bottom. Short-term downward movement is possibly in the range of 142.75 - 142.47. Hence, the high probability of a reversal to the top. The breakdown of the level of 142.47 will lead to an in-depth correction. Here, the goal is 142.08. This level is a key support for the top. The main trend is the rising structure of February 10 Trading recommendations: Buy: 143.50 Take profit: 144.12 Buy: 144.15 Take profit: 144.50 Sell: 142.75 Take profit: 142.50 Sell: 142.44 Take profit: 142.10 The material has been provided by InstaForex Company - www.instaforex.com |
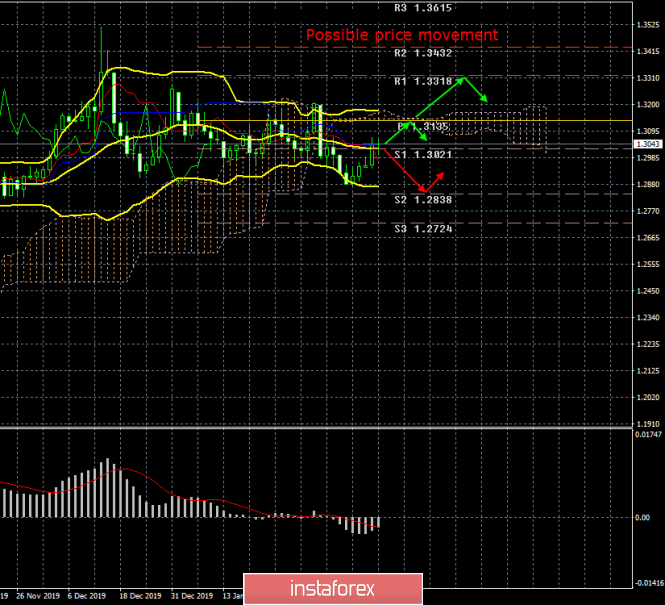
| Posted: 16 Feb 2020 03:06 PM PST 24-hour timeframe The British pound began to form a new downward trend, but a turn up and a round of upward correction began this trading week against the current weakest downward trend. Bollinger Bands are directed down, which so far retains the likelihood of a resumption of a downward trend. Also, the pound/dollar pair has not yet been able to cross the Kijun-sen line on the 24-hour chart, although it is very close to it. As we have already said, this week traders reacted not to macroeconomic statistics, but to political news from the British Parliament. And we believe that the pound once again shows growth when there is no reason at all for this. Over the past two years, this situation has been repeated regularly, the pound regularly rises in price on rumors that are not confirmed, on expectations, on various kinds of political messages. But macroeconomic statistics are just regularly ignored, as it was this week. The upcoming week will be much more interesting for the GBP/USD currency pair than for the EUR / USD pair, since there will be a sufficient amount of important data from Great Britain. Monday will be completely empty in terms of macroeconomic statistics. There is absolutely nothing to pay attention to. President's Day will be celebrated in the United States on Monday. Therefore, you can proceed to Tuesday. On this day, the UK will publish average wage for December with and without bonuses, the unemployment rate for December, as well as the number of applications for unemployment benefits. No major changes in these indicators are expected. The unemployment rate is likely to remain at a fairly low level of 3.8%, the number of new applications for unemployment benefits will amount to 22,600, and the growth rate of wages can only slightly slow down. Thus, everything will depend on how much the real values of the indicators differ from the predicted ones. A much more important consumer price index in the UK will be published on Wednesday, which, according to experts, could accelerate from 1.3% y/y to values ranging from 1.4% - 1.6% y/y. However, in monthly terms, inflation is likely to slow down by 0.5% - 0.6%, which, in fact, eliminates almost any positive effect from the annual value. Recall that the annual value is calculated relative to the same month last year. Thus, it turns out that the annual value can be at least +5%, but if negative inflation is recorded in monthly terms, this will mean that it will continue to slow down, and in the case of Great Britain, deflation can already be observed in monthly terms. Great Britain will release retail sales reports for January, as well as a CBI report on changes in industrial orders. It is expected that the first indicator will show an increase of 0.4% in annual terms and in monthly terms. This is a good increase for the monthly, while it is very weak for the annual. The second industrial order indicator, presented by the Confederation of British Industrialists, is expected to remain in the negative zone, since the British industry continues to experience serious problems. Britain is set to publish indices of business activity in the fields of services and production in the last trading week of the next week. In recent months, the index in the manufacturing sector has risen and returned to the area of 50.0 and higher, however it may again fall to the area below the key level of 50 by the end of February. According to forecasts, this indicator will decrease to the value 49.6 in February. As for the service sector, everything is more stable and positive here - forecasts for February are 53.2 - 53.4 with the previous value of 53.9. As you can see, a decline is expected everywhere. In general, we believe that the British currency will have no supporting macroeconomic factors next week. Having studied all the macroeconomic reports, we came to the conclusion that most of them could fail again. Of course, special attention should be paid to inflation, if it accelerates, this can cause a wave of purchases of the British currency, but in general we do not see the prerequisites for the UK economy to accelerate and macroeconomic indicators to recover. From time to time, individual indicators grow (for example, the index of business activity in industry), but this looks like a correction, after which a new decline will inevitably follow. Thus, the Bank of England has many questions about the current state of the British economy, as well as to monetary policy, which, in our opinion, should have already been softened. Trading recommendations: The pound/dollar pair started an upward correction on the 24-hour timeframe. Thus, at the moment, for the 24-hour timeframe, it is recommended that you aim for 1.2838 and 1.2724 for the pound, if the bulls fail to overcome the Kijun-sen critical line. Shorts are still more relevant on the 4-hour timeframe, but there you should now wait until a dead cross forms before resuming to trade down. Explanation of the illustration: Ichimoku indicator: Tenkan-sen is the red line. Kijun-sen is the blue line. Senkou Span A - light brown dotted line. Senkou Span B - light purple dashed line. Chikou Span - green line. Bollinger Bands Indicator: 3 yellow lines. MACD indicator: Red line and bar graph with white bars in the indicators window. The material has been provided by InstaForex Company - www.instaforex.com |
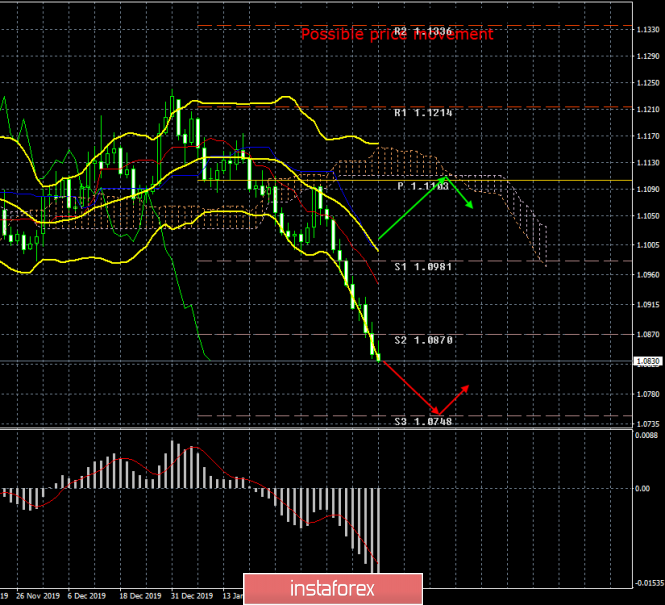
| EUR/USD. Preview of the new week. Dull week - euro's chance to move away from three-year lows? Posted: 16 Feb 2020 03:05 PM PST 24-hour timeframe The euro has been falling non-stop in the past two weeks. Last week, the pair overcame the second support level of February at 1.0870 on the 24-hour timeframe and indicated a desire to continue the downward trend. We have already said that the euro's depreciation is absolutely logical from a fundamental point of view. We have been talking about this non-stop in the last few months, since the euro has no fundamental and macroeconomic growth factors. From time to time, purely technical corrections (different in strength) occur, after which the downward movement resumes. Actually, this situation has not changed at all last week. Only one important assumption can be made: the paradoxical situation has finally ceased to keep the euro from falling further. The pair immediately updated its two-year lows and reached the values on April 17, 2017, that is, in fact, it will now move to the lows for the last 17 (!!!) years, which are around 1.0339. About 500 points remain until this level is reached - the task is absolutely feasible for bears for 2020, especially if macroeconomic statistics from the European Union continue to deteriorate further. The new trading week may finally become a correction for the European currency. However, I immediately want to warn traders that until you receive specific signals about the beginning of the correction, you should not rush to close short positions. Such a not too strong movement can last a very long time. In terms of macroeconomic data, the coming week will be extremely scarce. It is precisely in this, we believe, that the chance of the euro currency lies. In the last two weeks, weak reports were regularly received from the EU, and strong reports from the US, which supported the desire of traders to continue selling the euro. There will be practically no important planned publications or events next week in the first four trading days. The EU calendar is simply empty on Monday and Tuesday, except for a secondary indicator - the ZEW Institute economic sentiment index. President's Day will be celebrated in the United States on Monday. Secondary data will also be published on Tuesday, such as the index of the market value of housing and the index of business activity in the manufacturing sector of the Federal Reserve Bank of New York. Traders are also unlikely to turn their attention to this data. The EU news calendar will remain equally empty on Wednesday, and secondary data will again come from across the ocean, such as a producer price index and data from the construction market on changes in the dynamics of construction projects and building permits. A more or less significant event will take place in the evening. The event with a loud sign is the publication of the minutes of the meeting of the Fed Open Market Committee. However, we consider this event to be equally secondary. Firstly, in 95% of cases, all the necessary information becomes available to the market on the day the results of the Fed meeting are announced, of which there are eight in a year. Therefore, the minutes become a simple formality that lists the main points of the regulator regarding the economy and monetary policy. Secondly, at this time, even surprises from the Fed or Jerome Powell should not be expected. Judging by the recent speeches of Fed chief in the US Congress, Powell is more concerned about the "coronavirus" than any internal problems, such as GDP or industrial production. Thus, the release of the minutes may remain, if not without attention, then almost certainly without reaction from traders. On Thursday, the macroeconomic background for the EUR/USD pair will not change, more or less, there will not be any significant report in the EU and the US there will again be secondary publications of applications for unemployment benefits and the production index of the Federal Reserve Bank of Philadelphia. Finally, Germany, the EU and the US will publish business activity indices for February (preliminary values) on Friday, February 21, as well as the consumer price index in the euro bloc for January. As we have already said many times, business activity in the manufacturing sector is of most interest now, moreover, in Germany, the EU, and the US. According to forecasts, no special changes in the business activity of the EU are planned. Both indicators will remain below the key level of 50.0, which will continue to indicate a decline in production. Moreover, in Germany and the EU, business activity indices are again expected to decline to 44.8 and 47.5, respectively. As for inflation, according to experts' expectations, this indicator can grow to 1.4% in annual terms, but in monthly terms it can drop immediately by 1.0%. Thus, as we see, even based on forecasts, next week we should not expect strong macroeconomic support for the euro. The situation in the US is much better, as usual. Business activity in production may slightly fall, but it will remain above 50.0. We are talking only about the Markit index, and we remember that there is also the ISM index, which is more important. As for business activity in the service sectors, a slight fall is expected in Germany and the EU, but both indicators will remain above 50, and no changes are expected in the US, the forecast is 53.4. As a result, we can say that next week there will be extremely few significant events, so it is likely that the start of an upward correction is still the same, this is one, a decrease in volatility, these are two. As for the support of the euro, it is likely to continue to be absent. Trading recommendations: The trend for the euro/dollar pair remains downward. Thus, on the 4-hour timeframe, it is recommended to continue to consider short positions until signals appear regarding the beginning of an upward correction, which is very likely in the new week. On a 24-hour timeframe, the pair may also begin to adjust, but here it will be much more difficult to catch the correction. Explanation of the illustration: Ichimoku indicator: Tenkan-sen is the red line. Kijun-sen is the blue line. Senkou Span A - light brown dotted line. Senkou Span B - light purple dashed line. Chikou Span - green line. Bollinger Bands Indicator: 3 yellow lines. MACD indicator: Red line and bar graph with white bars in the indicators window. The material has been provided by InstaForex Company - www.instaforex.com |
| You are subscribed to email updates from Forex analysis review. To stop receiving these emails, you may unsubscribe now. | Email delivery powered by Google |
| Google, 1600 Amphitheatre Parkway, Mountain View, CA 94043, United States | |
No comments:
Post a Comment