
Forex analysis review |
- Fractal analysis of the main currency pairs for February 18
- GBP/USD. Unemployment, inflation, retail: pound awaits key reports
- EUR/USD and GBP/USD. February 17. Results of the day. French Foreign Ministry warns of difficult negotiations and war over
- EUR/USD: dollar continues to show strength, but its position does not look so unwaverable
- Evening review EURUSD 02/17/2020. Euro ready for a new fall
- USDCHF continues closer towards our target
- EURUSD remains in bearish trend
- Ichimoku cloud indicator short-term analysis of Gold for February 17, 2019
- Short-term bullish divergence warning by RSI in USDCAD
- February 17, 2020 : EUR/USD Intraday technical analysis and trade recommendations.
- February 17, 2020 : GBP/USD Intraday technical analysis and trade recommendations.
- USD/CAD analysis for February 17, 2020 - Watch for bigger drop on the USD/CAD and potential test of 1.3125
- Gold 02.17.2020 - Median Pitchfork line acting like resistance, watch for potential downside rotation towards the level of
- BTC analysis for 02.17.2020 - Crash on the BTC as we expected. Our first downwarrd target at the priceof $9.660 is reached,
- GBP/USD: plan for the US session on February 17. Buyers failed to regain the resistance of 1.3052
- EUR/USD: plan for the US session on February 17. The euro retreated from the lows of the year
- Pound gives a fight
- Analysis and forecast for EUR/USD on February 17, 2020
- Technical analysis of GBP/USD for February 17, 2020
- Trading recommendations for GBPUSD for February 17, 2020
- Pound: not everything is complete, not everything is established
- GBP seller trap
- GBP/JPY approaching resistance, potential drop!
- Technical analysis of GBP/USD currency pair for the week of February 17-22
- Technical analysis of EUR/USD currency pair for the week of February 17-22
| Fractal analysis of the main currency pairs for February 18 Posted: 17 Feb 2020 06:42 PM PST Forecast for February 18 : Analytical review of currency pairs on the scale of H1:
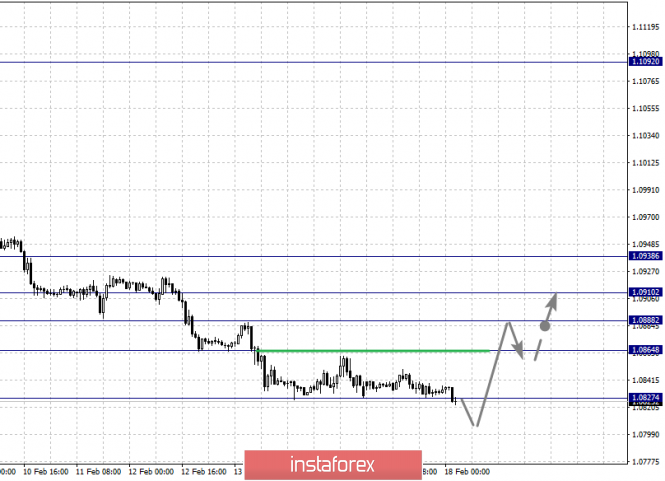
For the euro / dollar pair, the key levels on the H1 scale are: 1.0938, 1.0910, 1.0888, 1.0864 and 1.0827. Here, the price is near the limit values for the downward cycle, and therefore, we expect a correction. Short-term upward movement is expected in the range of 1.0864 - 1.0888. The breakdown of the last value will lead to the development of correction. Here, the goal is 1.0910. This level is a key support for the downward structure and its passage at the price will lead to the formation of expressed initial conditions for the upward cycle. In this case, the potential target is 1.0938. The main trend is a downward structure from January 31, we expect a correction Trading recommendations: Buy: 1.0864 Take profit: 1.0887 Buy: 1.0888 Take profit: 1.0910 Sell: Take profit: Sell: Take profit:
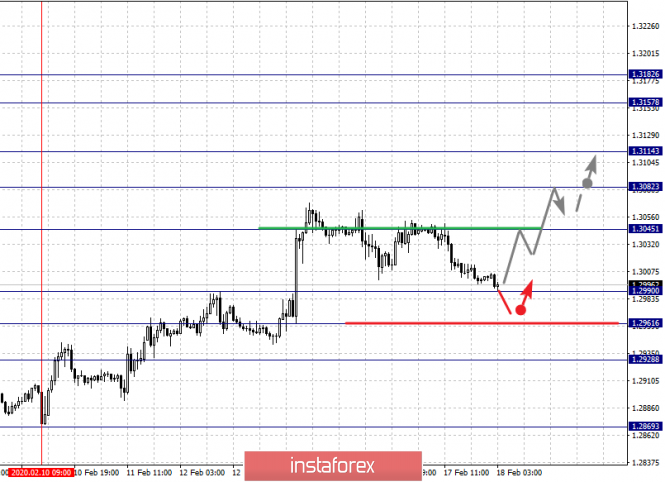
For the pound / dollar pair, the key levels on the H1 scale are: 1.3182, 1.3157, 1.3114, 1.3082, 1.3045, 1.2990, 1.2961 and 1.2928. Here, we are following the development of the ascending structure of February 10. The continuation of the movement to the top is expected after the breakdown of the level of 1.3045. In this case, the target is 1.3082. Short-term upward movement, as well as consolidation is in the range of 1.3082 - 1.3114. The breakdown of the level of 1.3114 will lead to a pronounced movement. In this case, the potential target is 1.3157. Upon reaching which, we expect a consolidated movement in the range 1.3157 - 1.3182, as well as a correction. Short-term downward movement is possibly in the range of 1.2990 - 1.2961. The breakdown of the latter value will lead to an in-depth correction. Here, the target is 1.2928. This level is a key support for the upward structure. The main trend is the ascending structure of February 10. The main trend is the rising structure of February 10th. Trading recommendations: Buy: 1.3045 Take profit: 1.3080 Buy: 1.3083 Take profit: 1.3112 Sell: 1.2990 Take profit: 1.2962 Sell: 1.2959 Take profit: 1.2930
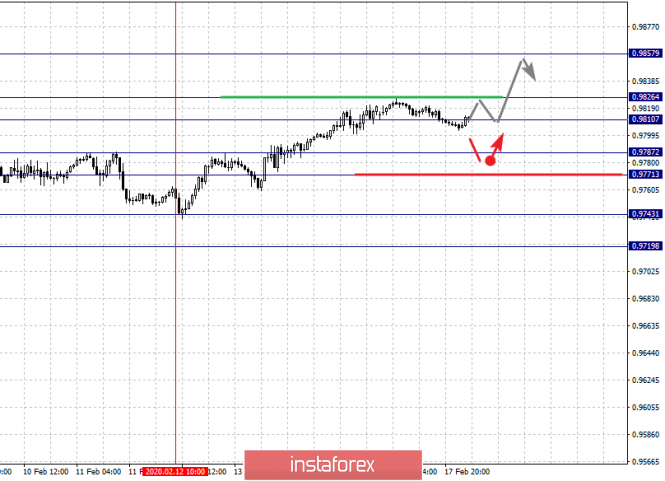
For the dollar / franc pair, the key levels on the H1 scale are: 0.9858, 0.9826, 0.9810, 0.9787, 0.9771, 0.9743 and 0.9719. Here, we are following the local ascendant structure of February 12. Short-term upward movement is expected in the range of 0.9810 - 0.9826. The breakdown of the latter value will lead to movement to a potential target - 0.9857. We expect a pullback to the bottom from this level. Short-term downward movement is possibly in the range of 0.9787 - 0.9771. The breakdown of the latter value will lead to the development of a downward structure. In this case, the first potential target is 0.9743. We expect expressed initial conditions for a downward cycle to the level of 0.9719. The main trend is the local potential for the top of February 12 Trading recommendations: Buy : 0.9810 Take profit: 0.9824 Buy : 0.9827 Take profit: 0.9856 Sell: 0.9787 Take profit: 0.9773 Sell: 0.9769 Take profit: 0.9745
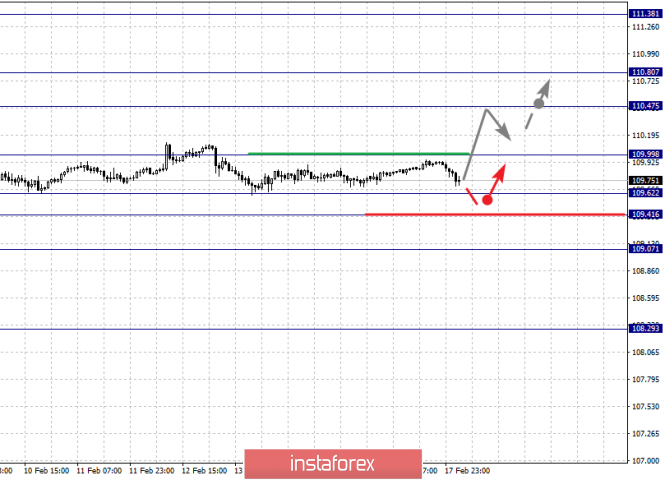
For the dollar / yen pair, the key levels on the scale are : 110.80, 110.47, 109.99, 109.62, 109.41 and 109.07. Here, we are following the development of the ascending structure of January 31. The continuation of the movement to the top is expected after the breakdown of the level of 110.00. In this case, the target is 110.47. Price consolidation is near this level. For the potential value for the top, we consider the level 110.80. Upon reaching which, we expect a pullback to the bottom. Short-term downward movement is possibly in the range of 109.62 - 109.41. The breakdown of the latter value will lead to an in-depth correction. Here, the goal is 109.07. This level is a key support for the top. Main trend: upward structure of January 31 Trading recommendations: Buy: 110.00 Take profit: 110.45 Buy : 110.49 Take profit: 110.80 Sell: 109.60 Take profit: 109.42 Sell: 109.38 Take profit: 109.10
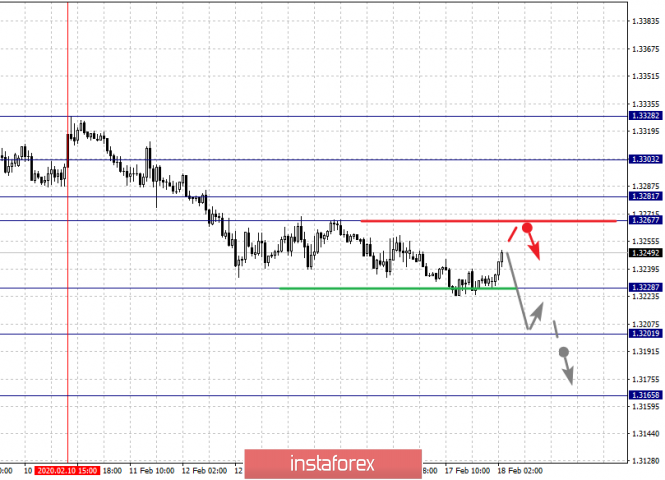
For the Canadian dollar / US dollar pair, the key levels on the H1 scale are: 1.3303, 1.3281, 1.3267, 1.3228, 1.3201 and 1.3165. Here, the descending structure of February 10 is considered medium-term. The continuation of movement to the bottom is expected after the breakdown of the level of 1.3228. In this case, the target is 1.3201. Price consolidation is near this level. The breakdown of the level of 1.3200 will lead to the development of pronounced movement to the bottom. Here, the potential target is 1.3165. We expect a pullback to the top from this level. Short-term upward movement is possibly in the range of 1.3267 - 1.3281. The breakdown of the latter value will lead to an in-depth correction. Here, the target is 1.3303. This level is a key support for the downward structure. The main trend is the formation of medium-term initial conditions for the downward movement of February 10 Trading recommendations: Buy: 1.3267 Take profit: 1.3281 Buy : 1.3283 Take profit: 1.3303 Sell: 1.3226 Take profit: 1.3203 Sell: 1.3199 Take profit: 1.3167
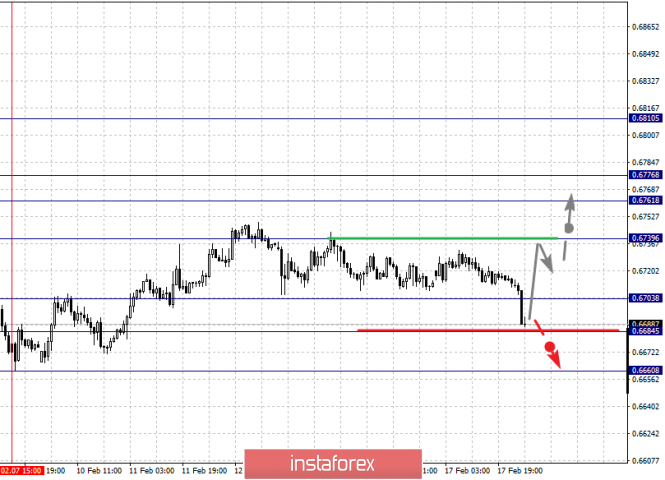
For the Australian dollar / US dollar pair, the key levels on the H1 scale are : 0.6810, 0.6776, 0.6761, 0.6739, 0.6703, 0.6684 and 0.6660. Here, we are following the development of the ascending structure of February 7. The continuation of the movement to the top is expected after the breakdown of the level of 0.6740. In this case, the target is 0.6761. Short-term upward movement, as well as consolidation is in the range of 0.6761 - 0.6776. For the potential value for the top, we consider the level of 0.6810. Upon reaching which, we expect a pullback to the bottom. Consolidated movement is possibly in the range of 0.6703 - 0.6684. Hence, the high probability of a reversal to the top. The breakdown of the level of 0.6684 will lead to the formation of a downward structure. Here, the potential target is 0.6660. The main trend is the upward structure of February 7 Trading recommendations: Buy: 0.6740 Take profit: 0.6761 Buy: 0.6762 Take profit: 0.6775 Sell : Take profit : Sell: 0.6682 Take profit: 0.6660
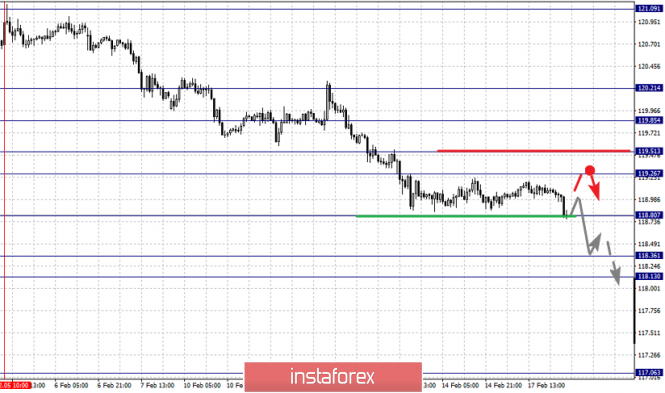
For the euro / yen pair, the key levels on the H1 scale are: 119.85, 119.51, 119.26, 118.80, 118.36 and 118.13. Here, we are following the descending structure of February 5. The continuation of movement to the bottom is expected after the breakdown of the level of 118.80. In this case, the goal is 118.36. For the potential value for the bottom, we consider the level of 118.13. Upon reaching which, we expect consolidation, as well as a pullback to the top. Short-term upward movement is possibly in the range of 119.26 - 119.51. The breakdown of the last value will lead to an in-depth correction. Here, the goal is 119.85. This level is a key support for the downward structure. The main trend is the descending structure of February 5 Trading recommendations: Buy: 119.26 Take profit: 119.50 Buy: 119.55 Take profit: 119.85 Sell: 118.80 Take profit: 118.38 Sell: 118.34 Take profit: 118.14
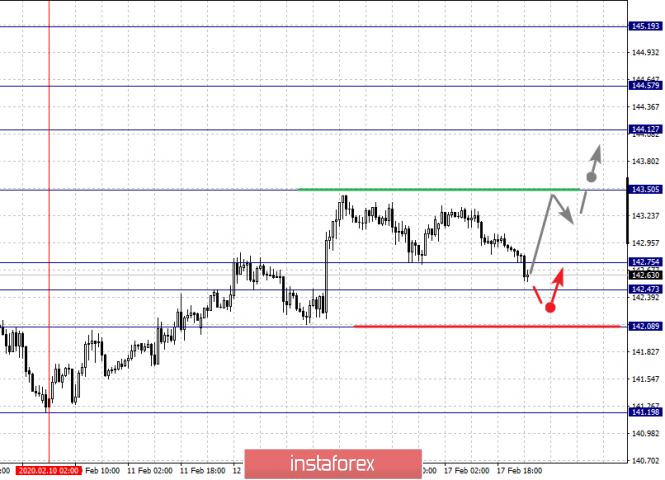
For the pound / yen pair, the key levels on the H1 scale are : 145.19, 144.57, 144.12, 143.50, 142.75, 142.47 and 142.08. Here, we revised the key targets for the upward structure of February 10. The continuation of movement to the top is expected after the breakdown of the level of 143.50. In this case, the target is 144.12. The breakdown of this value will lead to short-term upward movement in the range 144.12 - 144.57. Hence, there is also a high probability of a reversal to correction. For the potential value for the top, we consider the level of 145.19. Upon reaching this level, we expect a pullback to the bottom. Short-term downward movement, as well as consolidation, are possible in the range of 142.75 - 142.47; hence, the likelihood of a reversal to the top. The breakdown of the level of 142.47 will lead to an in-depth correction. Here, the goal is 142.08. This level is a key support for the top. The main trend is the rising structure of February 10 Trading recommendations: Buy: 143.50 Take profit: 144.12 Buy: 144.15 Take profit: 144.50 Sell: 142.75 Take profit: 142.50 Sell: 142.44 Take profit: 142.10 The material has been provided by InstaForex Company - www.instaforex.com |
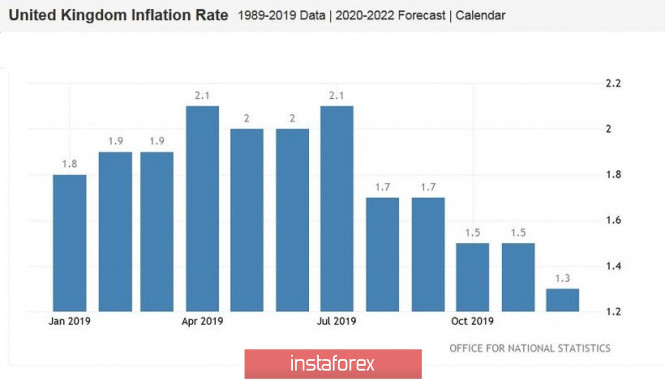
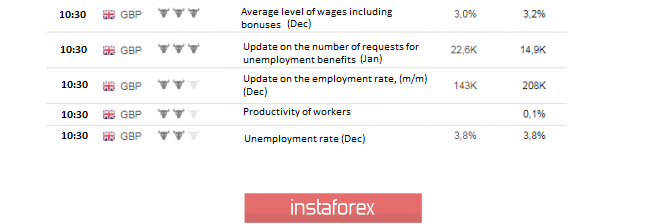
| GBP/USD. Unemployment, inflation, retail: pound awaits key reports Posted: 17 Feb 2020 02:41 PM PST The fundamental background for the British currency remains very controversial: the pound is gradually losing ground today following a surge of optimism last week. Given the rather harsh rhetoric of the representatives of London and Brussels, it can be assumed that the downward trend will continue. In addition, tomorrow's data on the growth of the UK labor market may also put pressure on the GBP/USD pair, especially if the average earnings level disappoints. Key indicators of UK inflation and retail sales data will also be published this week. All these reports will complement the overall fundamental picture for the GBP/USD pair. But let's start with politics. As you know, over the past few years (to be more precise, since 2016), the pound has been trading in its "coordinate system", sharply reacting to the news flow regarding Brexit's prospects. Now Brexit is behind us, but the degree of intensity is still high: negotiations during the transition period began with harsh statements, both from the Europeans and the British. Boris Johnson recently threatened to leave the negotiation process, while Brussels promised Spain support in the matter of territorial claims regarding Gibraltar. Today, a kind of "exchange of pleasantries" continued: French Foreign Minister Jean-Yves Le Drian said that both sides are far apart on a number of issues. However, he warned the UK that she should expect a "bloody battle" in the upcoming talks. The Foreign Minister of France also repeated the words of the head of the European Commission that it would be difficult for Britain to achieve the goal of concluding a free trade deal before the end of the year. It is worth noting that the French have always expressed a tougher stance towards the British compared to other Europeans. For example, at the time, Paris was always hostile to the idea of postponing Brexit and extending the negotiation process. Only at the last moment did the French support the common decision of the leaders of the EU countries. Judging by the first comments by French officials, the upcoming talks will indeed become a real diplomatic test. Meanwhile, the British retail consortium, in a published statement, warned that consumers could face higher costs and reduced availability of goods if a free trade deal was not reached by the end of the year. Representatives of the consortium recalled that 80% of all food products imported by British retailers came from the EU, and this fact makes these negotiations "especially important for these essential goods". Such a remark against the backdrop of harsh statements by Paris put background pressure on the pound. In the coming days, the attention of GBP/USD traders will switch to macroeconomic reports - unless, of course, British and European politicians increase the verbal pressure on the currency. If you exclude this scenario, the upcoming releases may have a significant impact on the pair. Let me remind you that the Bank of England unexpectedly maintained an "optimistic and expectant" position at its last meeting, contrary to the pessimistic forecasts of most experts. Nevertheless, the English regulator did not rule out a reduction in the interest rate in the foreseeable future, and two members of the Committee have already voted for this decision for several meetings. And if key indicators this week come out in the red zone, then the likelihood of monetary policy easing this spring will increase again. Key data on the growth of the labor market in Britain will be released tomorrow, February 18. According to general forecasts, the unemployment rate will remain at a record low of 3.8%. However, the number of applications for unemployment benefits may significantly increase - up to 22 thousand. Salaries can demonstrate a downward movement: the increase in the average earnings should slow down to 3.1% with premiums and up to 3.3% without them. If the inflationary component of tomorrow's release comes out in the red zone, the pound will come under significant pressure, especially in anticipation of the publication of basic inflation data. We will find out the growth dynamics of the British consumer price index on Wednesday, February 19. Preliminary forecasts are contradictory: the overall index on a monthly basis should slow down to -0.4%, and in annual terms, grow to 1.7% (after a decline to 1.3%). Core inflation can also grow up to 1.5%. For bulls of the pair, it is important that inflation data come out at least at the forecast level, otherwise the bears will get a weighty argument for selling the pair. Data on retail sales in the UK will be published on Thursday. This release will be the last puzzle that will form the overall fundamental picture for the pound. According to general forecasts, retail sales will please GBP/USD bulls: on a monthly basis, the indicator will leave the negative area where it has been for the past three months (both taking into account fuel costs and excluding this component). A slight slowdown is expected in annual terms. Thus, according to preliminary forecasts, key macroeconomic reports will show mixed dynamics. If the releases turn out to be one-way, then the volatility for the GBP/USD pair will be much higher: by the end of the week, the probability of a rate cut at the March meeting will either increase or decrease even more. From a technical point of view, the pair is also at a crossroads - on the daily chart, the price is located on the middle line of the Bollinger Bands indicator, and the trend indicators have not formed any clear and unambiguous signals. From a fundamental point of view, a similar picture has developed: traders are waiting for information drivers that will push the pair either into the region of 28-29 figures, or towards the 31st price level. The material has been provided by InstaForex Company - www.instaforex.com |
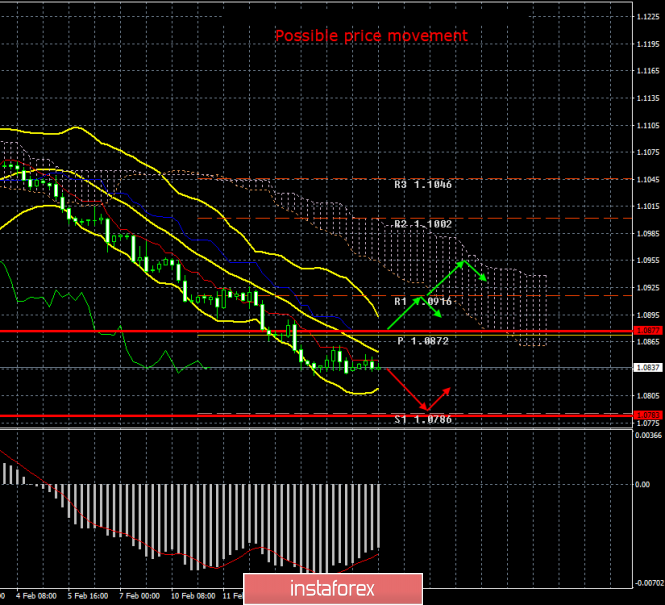
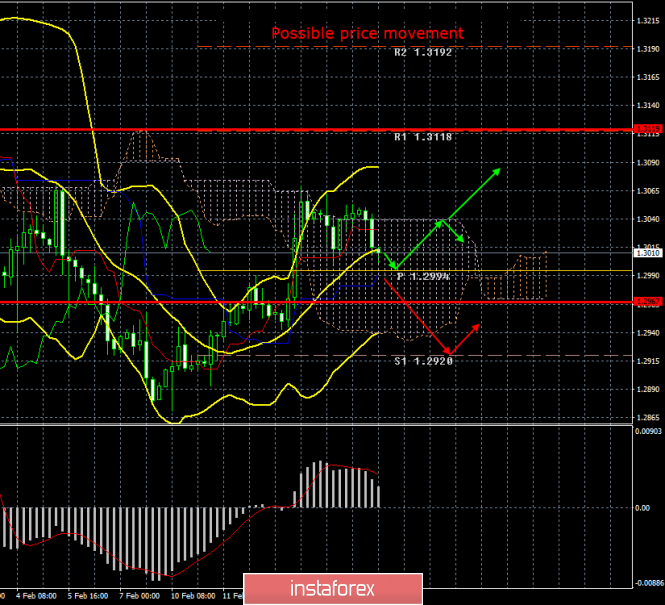
| Posted: 17 Feb 2020 02:41 PM PST 4-hour timeframe Amplitude of the last 5 days (high-low): 49p - 34p - 60p - 55p - 33p. Average volatility over the past 5 days: 47p (average). The EUR / USD currency pair was not able to start an upward correction on Monday, February 17, although no important macroeconomic events were planned for the day. Thus, bulls continue to be absent from the market for the third week in a row. The euro/dollar pair does not have enough strength to move away from three-year (!!!) lows by at least 50 points, and the euro's total fall in recent weeks is already 260 points. Traders were simply resting throughout the day, not selling or buying the pair. Low volatility (29 points at the moment) absolutely clearly characterizes the fundamental background of Monday. However, we are most interested in answering the question of when the corrective movement will begin and under what conditions. One gets the impression that it will begin abruptly, upon reaching any level at which large purchase orders are located. Thus, one thing can now be ascertained with certainty. Bears continue to dominate the market, the pair is likely to continue to fall, despite the fundamental background. We have already said that today there were no macroeconomic publications in the EU or the US, even secondary ones. President's Day is being celebrated in the States today, and all banks were closed. Thus, we now consider it appropriate to continue to trade lower, or rather, to maintain short positions already opened earlier, since there are still no signs of the beginning of a correction. It is unlikely that they will appear tomorrow, since the calendar of macroeconomic events does not contain anything interesting on February 18. Thus, we believe that as long as the price is trading below the Kijun-sen critical line, we can continue to hold open sell positions. Moreover, the downward trend movement is rather weak, so the Kijun-sen line is constantly kept close to the price. 4-hour timeframe Amplitude of the last 5 days (high-low): 74p - 74p - 43p - 126p - 62p. Average volatility over the past 5 days: 76p (average). At the same time, the British pound began to adjust against the upward trend that has developed in recent days. The pound/dollar pair, in fact, could not overcome the Senkou Span B line of the Ichimoku indicator and will now try to resume the downward trend. We said in recent reviews that the British currency still has no good reason to go up against the dollar. But there are plenty of reasons for it to become cheaper against the US currency. For example, today it became known that negotiations between London and Brussels are becoming more complicated, before they even begin. As we mentioned in previous reviews, the positions of London and Brussels are obvious. London wants a trade deal and does not submit to the European Union in any area, that is, to distance itself from the bloc as much as possible, and the EU wants to continue to influence as many spheres of life in Great Britain as possible and in return offers a profitable trade deal. It is precisely taking into account the fact that the parties are still at different poles, we still believe that there will be no trade deal. And it seems that we are not the only ones who think so, but also most of the world's experts. Sources close to Boris Johnson's office said today that London considers Brussels' desire to force Britain to continue to comply with European standards after Brexit as "ridiculous". This applies to all norms, but, in particular, we are talking about the norms of state subsidies and tax standards. It is easy to guess that Brussels wants London to continue to comply with European rules in these areas, as it wants to highly protect European companies from unfair competition from the British. The British government also noted that neither Canada nor Japan were subject to such requirements by the European Union, however, it concluded trade agreements with them. The source reiterated that Britain will not take on the responsibility of strictly adhering to European norms and standards. Well, Johnson's position personally confirms this information: if the EU'S proposal does not suit London, then Johnson is ready to curtail any negotiations with the EU and leave the bloc without a deal. That is, in fact, there will be Brexit "without a deal." At the same time, French Foreign Minister Jean-Yves Le Drian said that he also considers future negotiations between the bloc and the UK extremely difficult. "I think that we will tear each other apart in the negotiations," said Jean-Yves Le Drian. "However, this is an absolutely normal phenomenon, each side will protect its interests," the foreign minister stressed. The head of the French Foreign Ministry also noted that the chances of concluding a trade deal before the end of 2020 are few. France is also firm in its position, which is expressed by the desire to continue to fish in British waters. Great Britain wants to limit or even completely exclude the access of other states to "its waters." In addition, it is also reported that almost 80% of imported food products from the UK come from the EU. The retailer community has already warned Johnson's government that a number of food products could skyrocket in the UK if a trade deal cannot be reached. A shortage may form for certain products. In general, as we said earlier, the UK, led by Johnson, is rushing at all times to the "hard" Brexit. Naturally, nothing changes for the GBP/USD pair in the fundamental plan, so the pound will still be prone to fall. Therefore, each sell signal from Ichimoku is a strong priori. From a technical point of view, the pound continues to adjust, but is located above the Kijun-sen line, so the upward trend continues. Trading recommendations: The EUR/USD pair keeps the downward movement. Thus, it is now recommended that you stay selling the euro with a target support level of 1.0786. The MACD indicator is discharging again. It will be possible to consider purchases of the euro/dollar pair in small lots with the goal of the Senkou Span B line, if traders manage to gain a foothold above the Kijun-sen line, which is not expected in the near future. GBP/USD began to adjust against the upward trend. Thus, it will be possible to sell the British pound with targets at levels of 1.2967 and 1.2920 only after the price has consolidated below the critical line. Buying the pair of small lots can be considered with a target of 1.3118 if traders overcome the Ichimoku cloud, but it should be understood that the fundamental factors do not remain on the side of the British currency. Explanation of the illustration: Ichimoku indicator: Tenkan-sen is the red line. Kijun-sen is the blue line. Senkou Span A - light brown dotted line. Senkou Span B - light purple dashed line. Chikou Span - green line. Bollinger Bands Indicator: 3 yellow lines. MACD indicator: Red line and bar graph with white bars in the indicators window. Support / Resistance Classic Levels: Red and gray dashed lines with price symbols. Pivot Level: Yellow solid line. Volatility Support / Resistance Levels: Gray dotted lines without price designations. Possible price movements: Red and green arrows. The material has been provided by InstaForex Company - www.instaforex.com |
| EUR/USD: dollar continues to show strength, but its position does not look so unwaverable Posted: 17 Feb 2020 02:41 PM PST Unlike its main competitor - the US dollar, which showed the best start since 2015, the euro seriously upset its fans. The greenback is favored by factors such as increased demand for defensive assets due to the coronavirus epidemic, strong statistics on the United States and more preferred (compared to peers) rates on the US debt market. The euro is being pulled to the bottom by unresolved issues on Brexit, the deterioration of the political landscape in the EU, disappointing macro statistics on the eurozone and the threat of a trade conflict between Washington and Brussels. European GDP expanded by a modest 0.1% in the fourth quarter, while the German figure did not show growth at all. Experts recently interviewed by Reuters believe that by 2022, eurozone GDP will increase on average quarterly by 0.2-0.3, and by the end of 2019 it will accelerate by 0.9%. Given that the largest countries in the eurozone - France and Germany - receive about 40% of their income from foreign trade, there is reason to believe that in the near future the economy of the currency bloc may face even greater difficulties amid a slowdown in the growth of Chinese GDP associated with the epidemic coronavirus. The successors to Angela Merkel as German Chancellor intend to fight for power in the country. The United Kingdom and the EU can not yet find common ground on a trade deal, which increases uncertainty and contributes to the outflow of capital from the EU. The ECB's ultra-soft monetary policy has made it unprofitable for both Europeans and banks to keep funds "at home" because of negative rates in the region. Last weekend, the US trade mission reported that in March, Washington will increase the duty on aircraft imported from the EU from 10% to 15%. Apparently, these are just flowers. Over the past ten to twelve years, America has had a huge deficit in foreign trade with the EU. According to the head of the White House, Donald Trump, European duties on American goods are too high. Therefore, it is not surprising that the data on European trade balance published last Friday aroused the anger of the owner of the Oval Office. The trade surplus of the eurozone with the United States increased by 11% in 2019, to €152.6 billion. Obviously, after reaching a trade deal with Beijing, the White House intends to use all leverage to conclude an agreement with the EU. The weakness of the eurozone economy, increased political risks in the region and concerns about a trade war between Washington and Brussels are forcing investors to get rid of the single European currency. The EUR/USD pair sank to its lowest level since April 2017. Investment banks have already begun to actively reduce forecasts for the main currency pair. In particular, Credit Agricole analysts believe that at the end of 2020 EUR/USD will be trading near 1.13, and not at 1.16, as previously assumed. Danske Bank specialists went even further: they expect to see the euro fall in December not to $1.15, but to $1.08. However, it should be recognized that the positions of the greenback do not look so unshakable. Data on US retail sales for November – December were revised downward, while industrial production in the country decreased for the fourth time in the last five months. This allowed Goldman Sachs and Barclays to lower forecasts for US GDP growth in the first quarter from 1.7% to 1.4% and from 1.5% to 1.1%, respectively. Therefore, one should not be surprised that the minutes of the January meetings of the Fed and the ECB will be used by speculators in order to take profit on shorts in EUR/USD. In this regard, the breakthrough of the bulls of resistance at 1.0870 will increase the likelihood of a pullback. The material has been provided by InstaForex Company - www.instaforex.com |
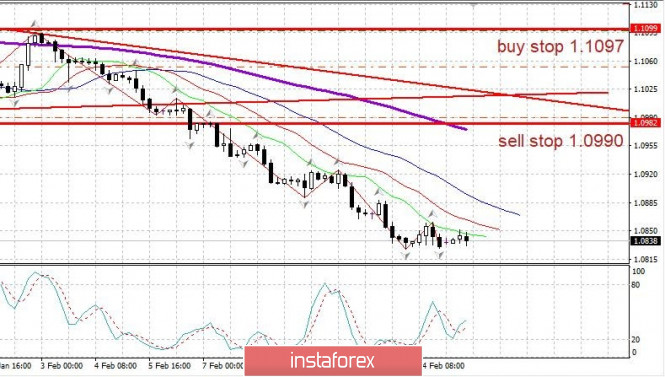
| Evening review EURUSD 02/17/2020. Euro ready for a new fall Posted: 17 Feb 2020 02:41 PM PST EURUSD: There is no big news. The euro is traded in close proximity to the lower boundary of the local range. Technically, the picture looks like a flat correction before a new fall. We keep sales from 1.0990. It is possible to sell from the rebound to the top - up to 1.0940. The material has been provided by InstaForex Company - www.instaforex.com |
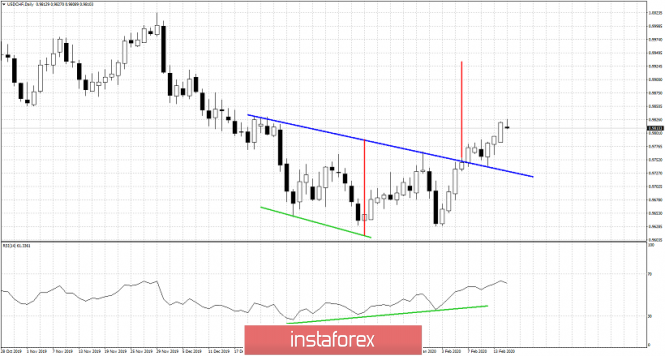
| USDCHF continues closer towards our target Posted: 17 Feb 2020 09:51 AM PST USDCHF has recaptured the 0.98 level and is moving closer to our 0.99 target after breaking above 0.9750 resistance. The formation remains valid and so is our target. Short-term trend remains bullish with important support still at 0.9750.
Blue line- resistance Green line - bullish divergence Red line- expected size of upward move USDCHF is moving higher as expected. The break out above the blue line was followed by a back test and a bounce. Bulls do not want to see price fall below the blue neckline. The RSI has still not reached overbought levels, so I expect this upward reversal from 0.9630 to unfold into a bigger bounce towards 0.99 and higher. The material has been provided by InstaForex Company - www.instaforex.com |
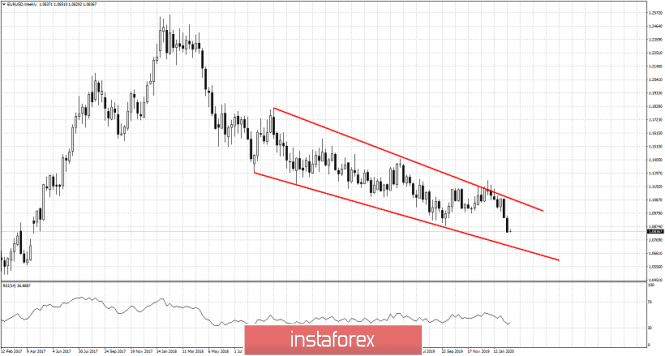
| EURUSD remains in bearish trend Posted: 17 Feb 2020 09:45 AM PST EURUSD has provided us with two bearish/sell signals using the Ichimoku cloud indicator. The last signal was pointed out by our analysis on January 29th. Since then price has bounced as expected and got rejected at cloud resistance. Breaking below support was only a matter of time after that.
Red lines - bearish wedge pattern EURUSD remains inside the wedge pattern making lower lows and lower highs. Major resistance is now at 1.1120 and support at the lower wedge boundary at 1.0720. The weekly RSI is not in oversold levels as the Daily one. A bounce towards 1.09 is justified but as long as price is below 1.1120 I do not see this trend ending soon.
The tenkan-sen is at the 1.0935 area and this is a potential bounce target. Bears remain in control of the trend. So far no reversal sign. There are high chances however to see a reversal soon. The material has been provided by InstaForex Company - www.instaforex.com |
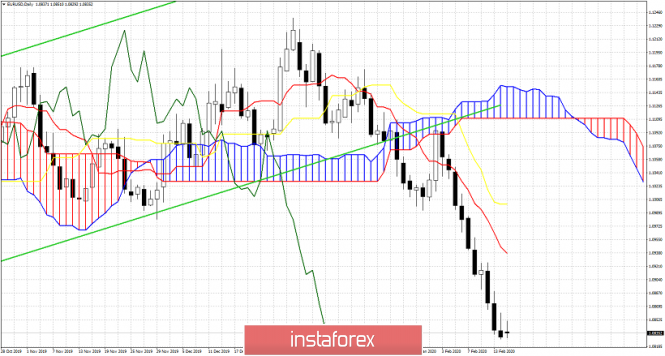
| Ichimoku cloud indicator short-term analysis of Gold for February 17, 2019 Posted: 17 Feb 2020 09:33 AM PST Gold price has recaptured the important resistance level of $1,575 and has so far canceled our view for a pull back towards $1,500. Short-term trend is bullish and the Ichimoku cloud indicator confirms that also.
Gold price is forming a short-term bullish channel. Price has broken above the 61.8% Fibonacci retracement level and is now challenging the 78.6% retracement. As long as price is above $1,563 short-term trend will remain bullish.
|
| Short-term bullish divergence warning by RSI in USDCAD Posted: 17 Feb 2020 09:27 AM PST USDCAD has fallen from 1.33 towards 1.32 as we initially expected in our analysis back in February 11th. Price has so far pulled back as low as 1.3225 back testing the resistance trend line that was broken. In the 4 hour chart we now observe a bullish divergence warning sign in the RSI.
Blue lines - bullish divergence USDCAD is showing bullish divergence signs. This is a warning for bears that the downward move from 1.3330 might soon end. Resistance is at 1.3268 and support at 1.3215. Short-term trend remains bearish and there is no sign of a reversal yet. The RSI has not entered oversold levels yet. We were bearish at 1.33 and I prefer to be neutral or bullish at current levels as there is potential of another leg higher from around 1.32. The material has been provided by InstaForex Company - www.instaforex.com |
| February 17, 2020 : EUR/USD Intraday technical analysis and trade recommendations. Posted: 17 Feb 2020 07:21 AM PST
On December 30, a bearish ABC reversal pattern was initiated around 1.1235 (Previous Key-zone) just before another bearish movement could take place towards 1.1100 (In the meanwhile, the EURUSD pair was losing much of its bearish momentum). One more bullish pullback was executed towards 1.1175 where the depicted key-zone as well as the recently-broken uptrend were located. That's why, quick bearish decline was executed towards 1.1100 then 1.1035 which failed to provide enough bullish SUPPORT for the EURUSD pair. Further bearish decline took place towards 1.1000 where the pair looked quite oversold around the lower limit of the depicted bearish channel where significant bullish rejection was able to push the pair back towards the nearest SUPPLY levels around 1.1080-1.1100 (confluence of supply levels (including the upper limit of the channel). Since then, the pair has been down-trending within the depicted bearish channel until this week when bearish decline went further below 1.0950 and 1.0910 (Fibonacci Expansion levels 78.6% and 100%) establishing a new low around 1.0835. Currently, the EUR/USD pair looks quite oversold after such a long bearish decline and if bullish recovery is expressed above 1.0870, further bullish advancement would be expected towards 1.0910 then 1.0950. Intraday traders are advised to look for signs of bullish recovery around the current price levels of (1.0830) as a valid intraday BUY signal aiming towards 1.0910 (the nearest broken demand-level). On the other hand, bearish persistence below 1.0830 may enable more bearish decline towards 1.0805 even down to 1.0755. The material has been provided by InstaForex Company - www.instaforex.com |
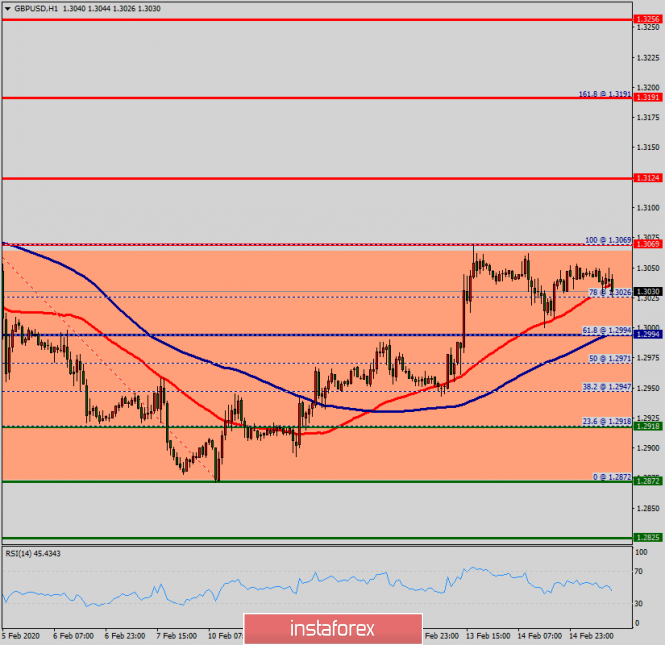
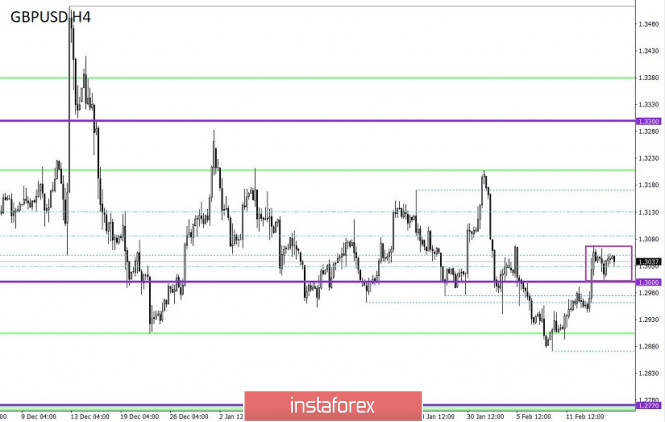
| February 17, 2020 : GBP/USD Intraday technical analysis and trade recommendations. Posted: 17 Feb 2020 07:14 AM PST
Recently, new descending highs were demonstrated around 1.3200 and 1.3070. On the other hand, temporary signs of bullish rejection were manifested around 1.2980-1.3000 before bearish breakdown could occur. Intraday technical outlook was supposed to remain bearish as long as the pair maintained its movement below 1.3070 (recently-established descending High). Recent Bearish breakdown below 1.2980 enhanced further bearish decline towards 1.2890 where Intraday traders were advised to watch price action carefully (the lower limit of the movement channel while the pair was being oversold). Since February 10, signs of bullish rejection have been manifested, allowing the current bullish pullback to pursue above 1.3000 which failed to offer any bearish resistance. The current bullish breakout above 1.3000 is enabling further bullish advancement towards 1.3070 and probably 1.3165-1.3200 is going to be reached where the upper limit of the current movement channel comes to meet the pair. This extensive bullish movement will probably occur provided that the price level around 1.3070 gets breached to the upside soon enough. Moreover, bullish persistence above 1.2980-1.3000 is needed to ensure further bullish advancement. Otherwise, any bearish decline below 1.2980 will probably lead the GBPUSD pair towards the next demand-level (the lower limit of the channel @ 1.2890) which is likely to fail to provide enough bullish support this time. The material has been provided by InstaForex Company - www.instaforex.com |
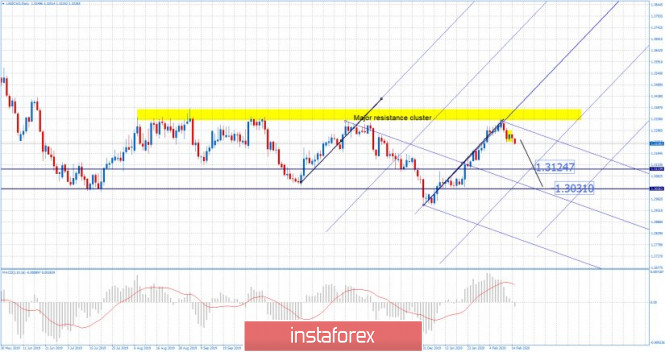
| Posted: 17 Feb 2020 05:29 AM PST Technical analysis:
USD/CAD has been trading sideways downwards. The price did break the 3-day balance support at 1.3233 and is heading towards the levels at 1.3125 and 1.3030. I see potential for the bigger drop on the USD/CAD. Watch for selling opportunities on the rallies with the main targets at 1.3125 and 1.3030. Stochastic oscillator is showing overbought condition and potential for downside rotation. The slow line on the MACD oscillator just turned to the downside. Support levels are set at the price of 1.3125 and 1.3030 Resistance level is set at the price of 1.3236 and 1.3270 The material has been provided by InstaForex Company - www.instaforex.com |
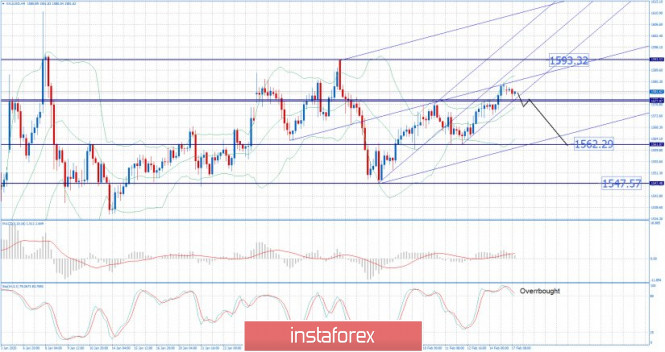
| Posted: 17 Feb 2020 05:16 AM PST Technical analysis:
Gold has been trading sideways at the price of $1.58. I found that Median Pitchfork line is reached and I do expect further rotation around it and potential downside movement towards $1.562 and $1.547. Anyway, to confirm potential downside movement, I would like to see the breakout of support at $1.577. Watch for selling opportunities and potential downside rotation towards $1.562 and $1.547. I would avoid upside breakout under this condition. Stochastic oscillator is showing overbought condition and potential for downside rotation. Short-term resistance is set at the price of $1.585 and $1.593 Support levels and eventual downward targets are set at the price of $1.562 and $1.547. The material has been provided by InstaForex Company - www.instaforex.com |
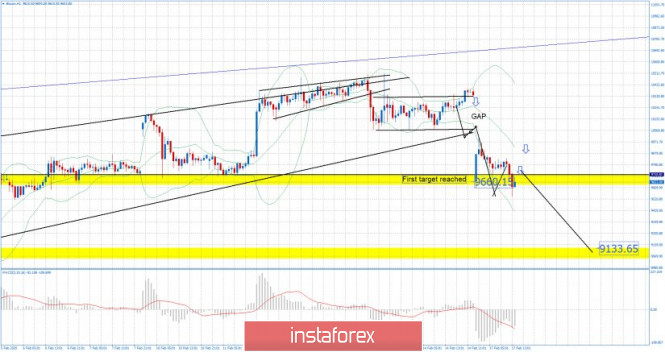
| Posted: 17 Feb 2020 05:05 AM PST Industry news:
Last month, BTC.TOP's Jiang Zhuoer had announced his plan to implement an 'Infrastructure Funding Plan' (IFP) for Bitcoin Cash, which aimed to direct 12.5% of BCH mining rewards to a fund that will support Bitcoin Cash infrastructure. This was mostly met with mixed reactions, eliciting concerns about the arbitrary nature of the percentage of rewards that would go into the fund, as well as misappropriation of funds. And some miners simply didn't want to contribute to the fund. Technical analysis: BTC has been trading downwards as I expected last Friday. Our first downward target from last week got reached at the price of $9.660.Strong rejection of the Pitchfork median line and the breakout of the rising wedge in the background were the keys for the crash on BTC. Watch for selling opportunities on the rallies and our second target at the price of $9.130. MACD oscillator is showing downside pressure and the slow line is turned to the downside, which is good confirmation for the further drop. Short-term resistances are set at the price of $9.720 and $10.000 Major support level is set at the price of $9.135. The material has been provided by InstaForex Company - www.instaforex.com |
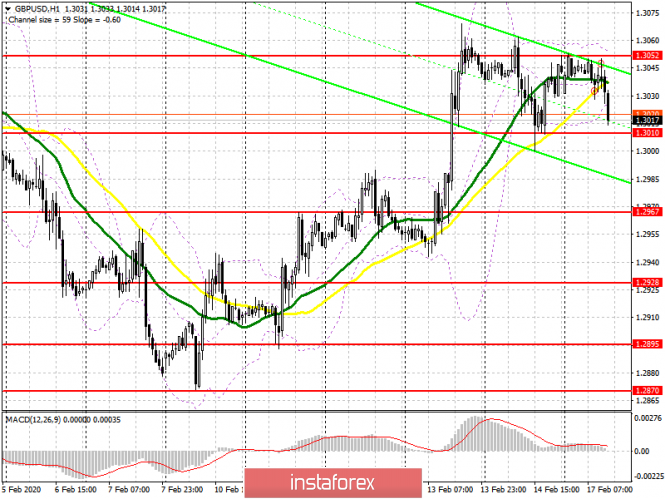
| GBP/USD: plan for the US session on February 17. Buyers failed to regain the resistance of 1.3052 Posted: 17 Feb 2020 03:51 AM PST To open long positions on GBPUSD, you need: In the morning forecast, I paid attention to the resistance of 1.3052, on which the further upward trend of the British pound depended. The main task of the bulls for the second half of the day remains to break through and consolidate above this level, which will open a direct road to the area of the highs of 1.3093 and 1.3133, where I recommend fixing the profits. Support for 1.3010 remains a more optimal scenario for opening long positions, however, as at the end of last week, an important condition will be the formation of a false breakdown. Rebound purchases can only be considered after the support test of 1.2967. The absence of important fundamental statistics can keep the pair on the current side channel. To open short positions on GBPUSD, you need: Sellers did not let the pair above the resistance of 1.3052, and its next test without a breakdown in the first half of the day led to a return of pressure on the British pound. The GBP/USD is approaching the support of 1.3010, but only a break will increase the pressure on the pair, which will lead to a decrease in the area of the minimum of 1.2967, where I recommend taking the profits. If sellers fail to implement this scenario, it is best to postpone short positions until the level of 1.3093 is updated or sell GBP/USD immediately to rebound from the resistance of 1.3133. Signals of indicators: Moving averages Trading is conducted around 30 and 50 daily averages, which indicates market uncertainty. Bollinger Bands A break in the lower border of the indicator around 1.3026 may return the pressure on the pair.
Description of indicators
|
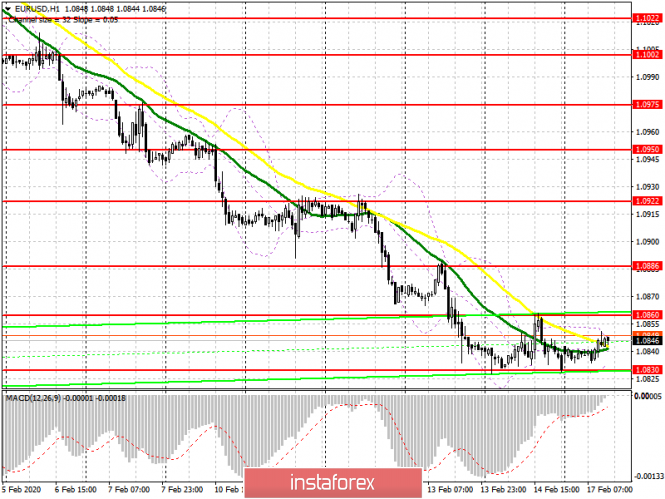
| EUR/USD: plan for the US session on February 17. The euro retreated from the lows of the year Posted: 17 Feb 2020 03:30 AM PST To open long positions on EURUSD, you need: From a technical point of view, nothing changed in the first half of the day. The euro recovered while volatility remained extremely low. Presidential Day in the United States and low trading volume awaits us in the future. With purchases, you need to proceed carefully. Only the formation of a false breakdown at the level of 1.0830 will confirm the actual presence of buyers in the market, which will allow you to reach the resistance of 1.0860, a break of which will lead the pair to a maximum of 1.0886, where I recommend fixing the profits. In the scenario of a further fall in the euro, you can look at long positions for a rebound from the minimum of 1.0804 or even lower in the support area of 1.0773. To open short positions on EURUSD, you need: Sellers of the euro need a breakthrough of 1.0830, which will lead to a further sale in the area of the lows of 1.0804 and 1.0773, where I recommend fixing the profits. However, given the absence of important fundamental statistics today, the Eurogroup meeting and US Presidential Day, we can expect a small upward correction in EUR/USD to continue to the resistance area of 1.0860, where an unsuccessful attempt to consolidate above this range will be the first signal to open short positions. You can sell the euro immediately on a rebound from the maximum of 1.0886. Signals of indicators: Moving averages Trading is conducted in the area of 30 and 50 moving averages, which indicates market uncertainty. Bollinger Bands Volatility remains extremely low, which does not give signals to enter the market.
Description of indicators
|
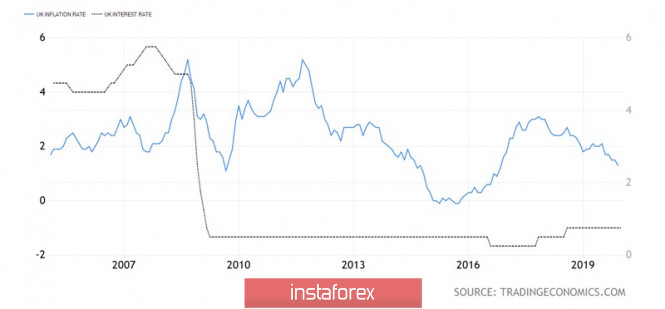
| Posted: 17 Feb 2020 03:30 AM PST Unlike most of the world's major currencies, the Japanese yen, Swiss franc and British pound continue to resist the "American". And if the stability of the first two of them is fully explained by the high demand for safe-haven assets, then the return of GBP/USD quotes to the range of medium-term consolidation of 1.3-1.335 looks strange. However, only at first glance. The pound did not start well, under pressure due to uncertainty in trade negotiations between London and Brussels and due to the growing likelihood of weakening the monetary policy of the Bank of England. On the eve of the January MPC meeting, the chances of reducing the repo rate reached 70%. However, the Committee voted by 7 votes to 2 in favor of keeping it at the level of 0.75%, which allowed the "bulls" for GBP/USD to recover. In the future, statistics on Albion were mixed, and investors' attention seemed to be completely switched to the trade negotiations between Britain and the EU, however, the resignation of Chancellor Sajid Javid swung the scales towards sterling. Boris Johnson received a more loyal minister in the person of Rishi Sanak, and investors began to weigh the possibility of increasing public spending to keep the Brexit's burdened economy of Albion afloat. The fiscal stimulus will allow dispersing GDP and consumer prices, which will reduce the chances of easing the BOE's monetary policy and extend a helping hand to the "bulls" on GBP/USD. Dynamics of the repo rate and British inflation
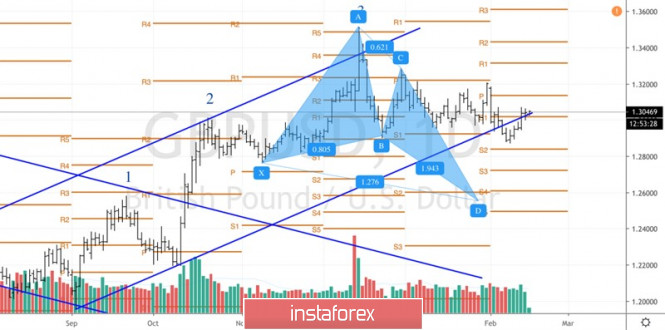
It is doubtful that the economy of the Foggy Albion could boast the same success as the American one, which was significantly helped by the tax reform of 2017, however, official London is quite capable of creating a certain security cushion. Britain needs it due to difficult negotiations with the EU. Brussels is ready to give the British zero tariffs but requires maintaining control over the judiciary. Albion wants the same conditions as other countries in the world, including Japan and Canada. Along with trade negotiations, investors will be closely watching the economic calendar. Releases of data on the British labor market, inflation and retail sales can lead the GBP/USD pair in motion. The actual data will affect the chances of monetary expansion, which has now shifted smoothly to 2021. Let's not forget that the pound remains stable even against the background of a strong US dollar using its status as a safe-haven currency, strong data on States and the Fed's reluctance to change the federal funds rate. If something in the "American" mechanism starts to fail, the "bulls" on GBP/USD will certainly take advantage of it. Technically, a combination of "Three Indians" and "Splash and Regiment" patterns was formed on the daily chart of the analyzed pair. If buyers manage to stay within the trading range of 1.3-1.335 ("shelves") and the ascending trading channel, the chances of restoring the "bullish" trend will increase. GBP/USD, the daily chart
|
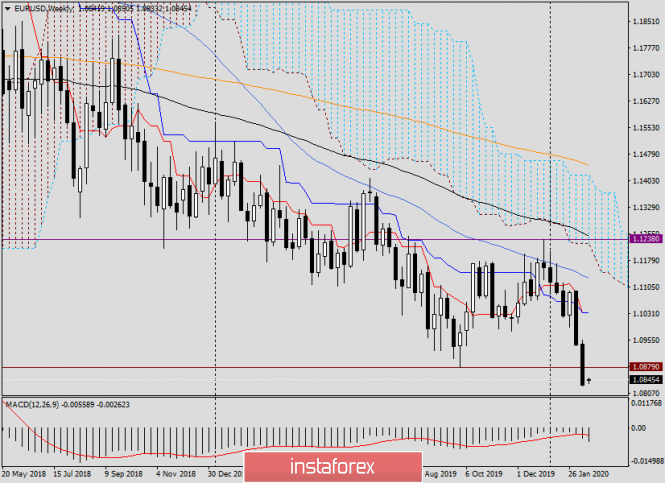
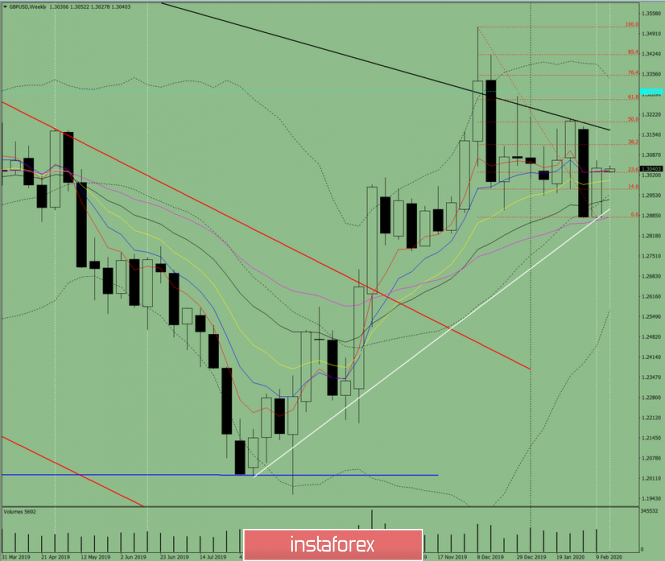
| Analysis and forecast for EUR/USD on February 17, 2020 Posted: 17 Feb 2020 03:30 AM PST Hello, dear colleagues! At the end of the past week, the price dynamics of the main currencies against the US dollar was diverse - some strengthened, others showed a decrease. In particular, the EUR/USD currency pair again showed a decline, which amounted to 0.98%. Pretty impressive, isn't it? Against the backdrop of the ongoing coronavirus epidemic, the US dollar is getting support, and the EUR/USD pair has not been at the current low levels for about four years. Some experts believe that the strengthening of the US currency will increase even more and we will see a strong upward trend for the US dollar. Others believe that the situation will soon change and the US currency will begin to weaken. I think you should not make far-reaching assumptions, a lot will depend on various important factors. For example, from the monetary policy of the Federal Reserve System (FRS). No less (and often more) information can be obtained when analyzing price charts, to which I suggest moving. Weekly
After the breakdown of the significant support level of 1.0879, the chances of a further and stronger continuation of the downward trend became even greater. But is it possible to judge the truth of the breakdown of this level by one closed weekly candle? If the euro/dollar manages to show an increase this week, and the auction ends above 1.0879, the breakdown of this mark will have to be considered false. In an alternative scenario, the pair will continue to fall, and in this case, the nearest target will be 1.0680, and then 1.0570. Thus, EUR/USD is facing another extremely important week. The euro bulls still have chances to correct the situation and make at least a rate adjustment. To do this, as already noted, trading on February 17-21 must be closed above 1.0879. Otherwise, the bears will continue their pressure on the quote in the area of the above targets. At the same time, it is necessary to take into account the correction option in the side range. Daily
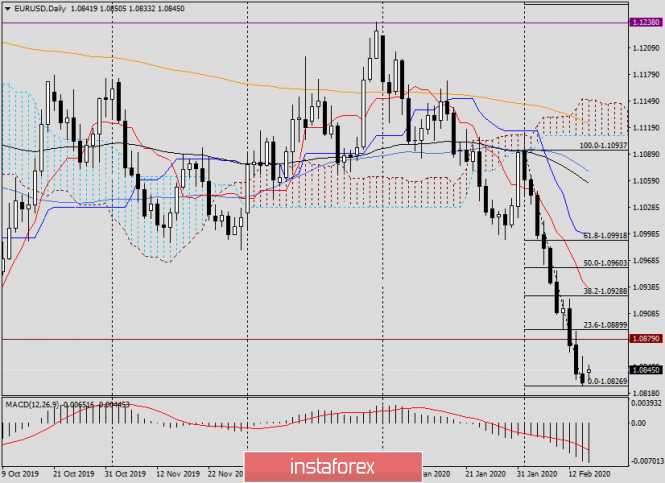
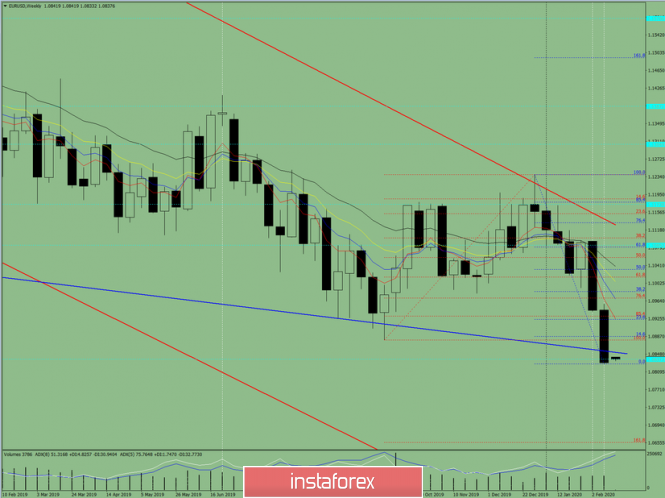
As seen on the daily chart, I stretched the Fibonacci grid for a drop from 1.1094 to 1.0827. The candle that appeared on February 14 signals the probability of an upward turn. As experience shows, this is often the case after such candles. At the moment of writing, the pair is showing moderate growth. If you take into account the Friday candle and count on a corrective rise, then its first goal will be the mark of 1.0890, where the level of 23.6 Fibo passes from the specified decline. If we take into account the strength of the downward trend and the proximity to the 23.6 Fibo of the broken support level of 1.0879, it is too early to talk about further goals for a possible correction. Usually, after such an intense and rapid price movement, the correction is limited to the first pullback level of 23.6 Fibo or even a side range at all. Thus, it can be assumed that the area of 1.0870-1.0900 looks technically justified for opening short positions on the euro/dollar. With a deeper correction, the pair will go to the next level of 38.2 Fibo, which is located at the price value of 1.0929, slightly higher at 1.0937, the Tenkan line of the Ichimoku indicator passes. The second price zone for selling the pair can be considered 1.0927-1.0937. In my opinion, the best scenario for sales is the first one. By the way, technically, the mark of 1.0900 is very strong, and you can see this by viewing the history. The fact is that even if the price falls above 1.0900, there are levels such as 1.0930, 1.0960 and 1.0980, which have repeatedly had a strong impact on the movement of the price rate. This week is expected to publish numerous macroeconomic data from Europe and the United States, which can be found in more detail by looking at the economic calendar. However, in my opinion, the main event of this week will be the publication of the minutes of the last FOMC meeting. The minutes will be published on Wednesday, at 20:00 (London time). If we return to the technical component, tomorrow we will look at smaller timeframes and try to find acceptable entry points to the market. And at the moment, we are waiting for a correction in the area of 1.0870-1.0900 for sales. And risky and aggressive traders can try buying right now on the market. At the end of the review, the euro/dollar is trading at 1.0846. Good luck! The material has been provided by InstaForex Company - www.instaforex.com |
| Technical analysis of GBP/USD for February 17, 2020 Posted: 17 Feb 2020 03:06 AM PST Overview: Ranging day between the levels of 1.2872 and 1.3069. The GBP/USD pair is consolidating the weekly gains above the 1.2918 support as bulls remain in control. A break above 1.2994 can expose the 1.3069 resistance, according to the technical RSI Indicator. Amid the previous events, the price is still moving between the levels of 1.2918 and 1.3069. In overall, we still prefer the bullish scenario as long as the price is above the level of 1.2918. The daily pivot point stands at the point of 1.2994 in the H1 time frame. The shared currency is trading in a bear trend below the 100 and 50-day exponential moving averages (EMAs). The Cable is breaking above a multi-week trendline and is challenging the 100 EMA. The news limited further gains in the New York session. Suggesting bullish momentum in the medium term. Furthermore, if the NZD/USD pair is able to break out the daily pivot point at 1.2994, the market will decline further to 1.3069 (daily resistance 1). Bearish outlook: On the other hand, if the price closes below the point of 1.2994, the best location for a stop loss order is seen above .3100. The price will fall into a bearish trend in order to go further towards the strong support at 1.2872 to test it again. The level of 1.2872 will form a double botto at the same time frame. The material has been provided by InstaForex Company - www.instaforex.com |
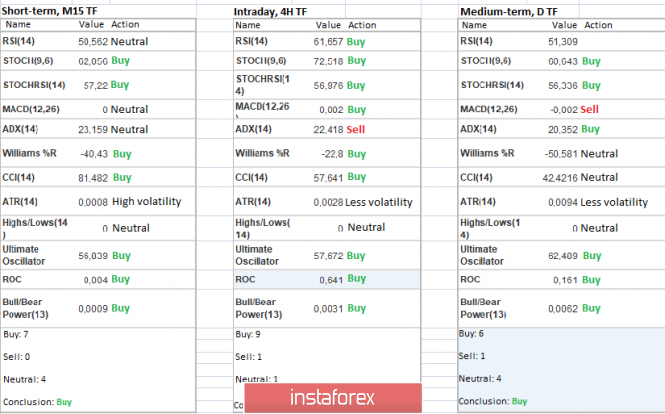
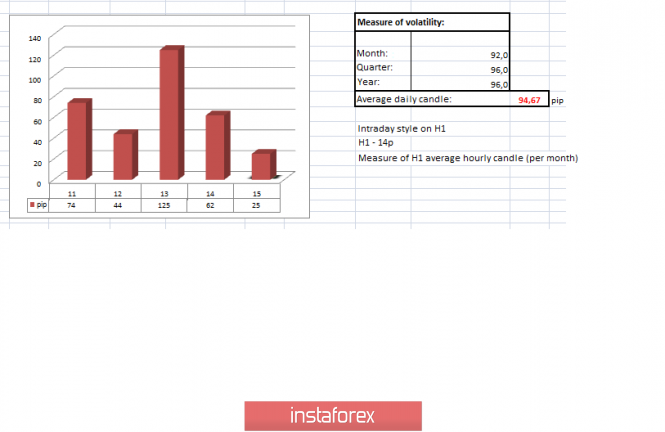
| Trading recommendations for GBPUSD for February 17, 2020 Posted: 17 Feb 2020 02:50 AM PST From a comprehensive analysis point of view, we see a prosaic curtain, where, after the quotes returned above the psychological mark, stagnation occurred that clearly reflected the desire of market participants and now about the details. After the quotes found a foothold in the area of the average level of 1.2885, the adjustment process began, which returned us above the level of 1.3000 and locally hit the value of 1.3068. Can this be considered a failure, in the downward building stage? Not at all, since any cycle should have adjustments that will give strength to the main course. This is the whole point of trends with a lot of measures in their structure that are both positive and negative. In our case, it is too early to talk about the trend, since it is still very far from being fully restored, but even with the current fluctuations, we see our own patterns that should have happened, as with the current fluctuation. Regarding our theory, the downward movement is still valid, it makes no sense to panic since the tipping points in terms of price-fixing in the values of 1.3000 / 1.2900 / 1.2885 have already taken place, which means we are off the ground hovering, which hypothetically can lead to the resumption of the main course. The best confirmation of our theory will be the return of the price to the area of 1.2885 / 1.3000, and in case of retention and fixation, we will be able to open the range to the main border of 1.2770, [1.2770 // 1.2885 // 1.3000]. In terms of volatility, we see a characteristic slowdown of 34% relative to the average daily value and by 50% in comparison with the day before. In fact, we returned to the same slowdown framework that attracted special attention for five days before the acceleration. Details of volatility: Thursday - 79 points; Friday - 79 points; Monday - 74 points; Tuesday - 74 points; Wednesday - 44 points; Thursday - 125 points; Friday - 62 points. The average daily indicator, relative to the dynamics of volatility is 94 points [see table of volatility at the end of the article]. Detailing the days that have passed by the minute, we see that from the moment of touching the 1.3068 mark, the process of another deceleration has begun within the range of 1.000 / 1.3068, which has already stretched for 40 hours. As discussed in a previous review, traders continue to follow the theory of downward development, where deals are already available, but with an optimal volume, which is designed for a fairly significant price adjustment. As you know, this strategic position is designed for at least the medium term. At the same time, speculators do not sit still and work on local races, which appear on the market almost on a daily basis. Considering the trading chart in general terms [the daily period], we see a fluctuation in the structure of the medium-term upward trend, where the quotes are still at a conditional peak, but the measures have already been changed. Friday's news background contained data on retail sales in the United States, where it recorded a slowdown from 5.5% to 4.4%, with a forecast of a slowdown in growth to 4.9%. The data is not the best, and if we make an adjustment to the fact that retail is considered one of the locomotives of the US economy, then we have sad statistical data. The same with the published data on US industrial production, which came out slightly better than expected. So they expected a decline from -0.9% to -1.4% but got a slowdown to -0.8%. Market reaction to statistics was in terms of local weakening of the US dollar, but not significantly. In anticipation of the publication, the possible non-coincidence of forecasts was the strengthening of the dollar towards the level of 1.3000. In terms of a general informational background, we again have an escalating round of emotions related to the upcoming talks between England and Brussels. So comments regarding this process were given by the French Ministry of the Interior, Jean-Yves Le Drian, who seems to see common ground, at the same time very skeptical of them and expects difficult negotiations. "I think that the negotiations that we are going to start on trade issues and on the mechanism of future relations, we tear us all apart," said the French Foreign Minister during the Munich security conference. Also, Le Drian added that in the negotiations everyone will defend their own interests, which in principle is not surprising, but reinforces the earlier statements of other leading figures from the EU. At the same time, the ex-head of the Bank of England, Mark Carney, who was against Brexit from the very beginning, changed his rhetoric and said that this process still has positive aspects that will help to rethink the internal process of the economy. "This is a large-scale re-registration of our relations not only with the European Union but also our trade relations with the rest of the world, it has prompted a reassessment of the economic policy, the structural economic policy of the country," said Mark Carney. Today, in terms of the economic calendar, we do not have statistics, in addition to everything, the United States is not working, due to the celebration of Presidents Day, which may affect trading volumes. Further development Analyzing the current trading chart, we see all the same fluctuation in the structure of the borders of 1.000 / 1.3068, where the quotes develop near the middle of this range. In fact, we are faced with a kind of accumulation, where market participants are trying to rethink everything that is happening and make a decision in favor of sellers. The theory of downward development is more relevant than ever, but we need time to fully develop. From the point of view of the emotional mood of market participants, we see extremely high caution in terms of actions, since the tact is already broken, and the quotes are still at high values. At the same time, speculative interest on a daily basis manifests itself in the market. By detailing the per minute portion of time, we see that the activity has decreased many times, and the quotes are strongly fixated on the existing accumulation. In turn, traders continue to work the same way, alone in the medium term, having short positions. Others are waiting for the price to return below the level of 1.3000 to take short positions, while others are also speculators who work at local jumps in the market. Having a general picture of actions, it is possible to assume that the current range of 1.3000 / 1.3068 will not last long, where the main scheme will be to work in a downward movement but at the same time, due to safety net, we consider a local upward surge in case of breakdown of border 1, 3068. Based on the above information, we derive trading recommendations as follows: - Local purchase positions were already considered in case of price-fixing higher than 1.3070. - Positions for sale are already being conducted by traders in the direction of the level of 1.2770, a conservative volume per transaction. Speculative positions are lower than 1.3025 with a prospect of 1.3000. At the same time, traders will consider selling deals in case prices are fixed lower than 1.3000, with a move to 1.2900 and 1.2885. Indicator analysis Analyzing a different sector of timeframes (TF), we see that due to the reverse move, the indicators' indicators took on a variable upward interest. It is worth considering that the indicators are not stable and there are suggestions of an early change in the signal. Volatility per week / Measurement of volatility: Month; Quarter; Year Measurement of volatility reflects the average daily fluctuation, calculated for the Month / Quarter / Year. (February 17 was built taking into account the time of publication of the article) The current time volatility is 25 points, which is a low value in terms of currency dynamics. It is likely to suggest that due to the absence of the United States market, the activity of participants may be. Key levels Resistance zones: 1.3170 **; 1.3300 **; 1.3600; 1.3850; 1.4000 ***; 1.4350 **. Support Areas: 1,3000; 1.2900 *; 1.2885 *; 1.2770 **; 1.2700 *; 1.2620; 1.2580 *; 1.2500 **; 1.2350 **; 1.2205 (+/- 10p.) *; 1.2150 **; 1,2000 ***; 1.1700; 1.1475 **. * Periodic level ** Range Level *** Psychological level **** The article is built on the principle of conducting a transaction, with daily adjustment The material has been provided by InstaForex Company - www.instaforex.com |
| Pound: not everything is complete, not everything is established Posted: 17 Feb 2020 02:27 AM PST
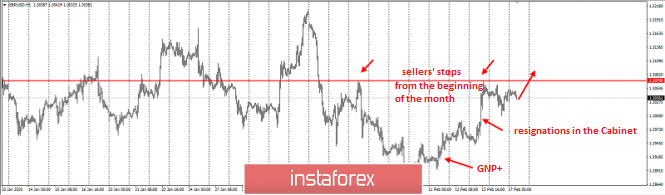
The pound seems to have set out to prove that the exit of UK from the European Union is absolutely the right choice. If the euro continued to decline over the past week, the pound, on the contrary, grew. Over the past five days, the GBP/USD pair has added almost 200 points, reaching a local high around the 1.3060 mark. Although the currency went down due to the unexpected resignation of British Finance Minister Sajid Javid, it quickly turned around after the new head of the department became the experienced financier, Rishi Sunak. Investors interpreted his appointment as an attempt of Prime Minister Boris Johnson to increase control of the Treasury, as well as a way for the government to increase public spending. Because of this, expectations that the Bank of England will cut the interest rates in the near future have almost disappeared. Now, the futures market will lay down rates by 25 basis points no earlier than December 2021. According to some experts, the pound has good prospects of growth this year, as it will play back unrealized fears about UK's disordered exit from EU. Moreover, it is assumed that tax cuts and increased budget spending, which Rishi Sunak is an apologist for, can seriously fuel interest in the British currency. Thus, the GBP/USD pair is expected to approach the highs of 2018 in the area of 1.43. In addition to the resignation of Finance Minister Sajid Javid, UK presented other surprises. Regarding the departure of UK from EU, according to the latest statements of the parties, there is a risk that they will constantly face disagreements during the transition period, and there is not much time left to resolve the disputes.
Sky News television channel reported that the British government considers EU's terms of a free trade to the country as excessive and ridiculous. The discussion of this will start in March. Brussels demands that London continue to comply with European subsidy and tax rules, and allow the Alliance to monitor their compliance. However, UK does not agree to the proposed terms, as Canada, South Korea and Japan, which have previously signed similar agreements, were not required to do so. Boris Johnson and other British politicians have repeatedly pointed out that the country will refuse to strictly comply with EU's regulations. If the free trade agreement between the parties is not concluded before the end of the year, and the transition period is not extended, they will start trading under WTO rules, which will return numerous customs tariffs. "Even if the British government provides increased fiscal stimulus, investors trading the pound will continue to be worried about the negotiations on the trade deal between UK and EU in the coming weeks," Rabobank believes. Moreover, the bank's experts said that "although the pound will receive support from the expectations of an increase in public spending in the budget that will be presented on March 11, market participants will closely monitor politics, as the upcoming trade negotiations between London and Brussels are likely to be tough. Given the threat of a bad deal, or even its absence at the end of the transition stage after Brexit, we believe that the GBP remains vulnerable. They expect the GBP / USD pair to trade below 1.30 in the next one to three months. The material has been provided by InstaForex Company - www.instaforex.com |
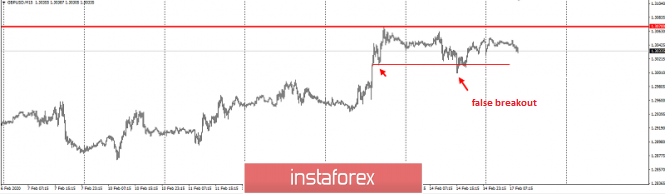
| Posted: 17 Feb 2020 01:25 AM PST Good day, dear traders! I present to your attention, a trading idea for GBP / USD. Last week's main event from Lonon was the statement of Finance Minister Sajid Javid, who did not share Boris's views on the trade agreement with the European Union. On this news, the GBP / USD pair rose by more than 1000p. On top of that, positive GDP news was released for the pound yesterday. Both these factors raised the currency by 1,700p, securing it at 1.3: Meanwhile, the sellers of the pair can obviously hide their risks (stops) behind the nearest and incredibly clear level of 1.30700, which you can see on the chart above. In addition, the false breakdown of the US correction has already passed last Friday: To those who have not bought yet, work from longs inside the day, with profit taking at the breakdown of 1.30700. If the breakdown doesn't happen today, it will be tomorrow, on the release of the British unemployment rate: Good luck in trading and control your risks! The material has been provided by InstaForex Company - www.instaforex.com |
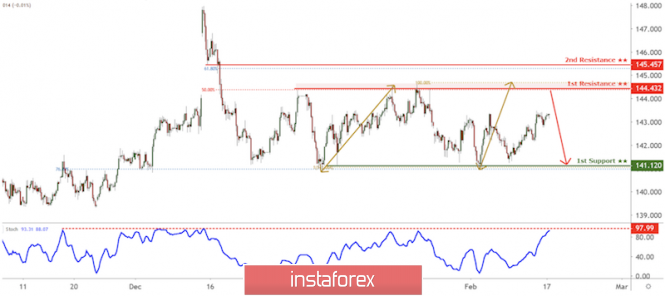
| GBP/JPY approaching resistance, potential drop! Posted: 17 Feb 2020 01:20 AM PST
Trading Recommendation Entry: 144.432 Reason for Entry: 100% Fibonacci extension, horizontal swing high resistance, 50% fibonacci retracement Take Profit : 141.120 Reason for Take Profit: Horizontal swing low support, 78.6%fibonacci retracement, 100% Fibonacci extension Stop Loss: 145.457 Reason for Stop loss: 61.8% Fibonacci retracement The material has been provided by InstaForex Company - www.instaforex.com |
| Technical analysis of GBP/USD currency pair for the week of February 17-22 Posted: 17 Feb 2020 12:49 AM PST Last week, the pair, having broken through the resistance line 1.2871 (white bold line), made an upward movement and then broke through the pullback level 23.6% - 1.3029 (red dashed line). Thus, the upward movement will most likely continue this week. Trend analysis: This week, the price is likely to continue to move upward, with the goal of reaching the resistance line - 1. 3170 (black bold line), and if this line is reached - pullback work down with the target 1.3003 - 13 average EMA (yellow thin line).
Fig. 1 (weekly schedule). Comprehensive analysis: - indicator analysis - up; - Fibonacci levels - up; - volumes - up; - candlestick analysis - neutral; - trend analysis - up; - Bollinger Lines - down; - monthly chart - down. The conclusion of a comprehensive analysis is an upward movement. The overall result of calculating the candle of the GBP / USD currency pair according to the weekly chart: the price of the week is likely to have an upward trend with the absence of the first lower shadow of the weekly white candlestick (Monday - up) and the presence of the second upper shadow (Friday - down). The first upper target of 1. 3170 is the resistance line (black bold line). An unlikely lower scenario: work down with the first target 1.2904 - support line (white bold line) from a pullback level of 23.6% - 1.3029 (red dashed line). The material has been provided by InstaForex Company - www.instaforex.com |
| Technical analysis of EUR/USD currency pair for the week of February 17-22 Posted: 17 Feb 2020 12:48 AM PST Trend analysis: This week, the price will move up with the target at 1.0887 - a pullback level of 14.6% (blue dashed line). Upon reaching this level it is possible to continue the upper development with the target of 1.0923 - a pullback level of 23.6% (blue dashed line).
Fig. 1 (weekly schedule). Comprehensive analysis: - indicator analysis - up; - Fibonacci levels - up; - volumes - up; - candlestick analysis - up; - trend analysis - up; - Bollinger Lines - down; - monthly chart - up. The conclusion of a comprehensive analysis is the upward movement. The overall result of calculating the candle of the EUR / USD currency pair according to the weekly chart: the price of the week is likely to have an upward trend, with the absence of the first lower shadow of the weekly white candlestick (Monday - up) and the presence of the second upper shadow (Friday - down). An unlikely lower scenario: a the movement downwards with the lower target of 1.0656 - the target level of 161.8% (red dashed line), from the historical support level of 1.0837 (blue dashed line). The material has been provided by InstaForex Company - www.instaforex.com |


| You are subscribed to email updates from Forex analysis review. To stop receiving these emails, you may unsubscribe now. | Email delivery powered by Google |
| Google, 1600 Amphitheatre Parkway, Mountain View, CA 94043, United States | |
No comments:
Post a Comment