
Forex analysis review |
- Forecast for EUR/USD on February 20, 2020
- Forecast for GBP/USD on February 20, 2020
- Forecast for AUD/USD on February 20, 2020
- Fractal analysis of the main currency pairs for February 20
- Pound: cancellation of the long scenario
- GBP/USD. Brexit vs inflation
- EUR/USD. February 19. Results of the day. Traders await Fed minutes, which will not bring new information
- EURUSD and GBPUSD: Pound not satisfied with UK inflation data. Euro ready to continue its decline
- Evening review 02/19/2020 EURUSD - Yen joins the euro in the dollar trend
- Gold is expected to pull back towards $1,600-$1,590 before continuing higher
- USDCAD and the three drive pattern
- USDJPY breaks above critical weekly resistance
- February 19, 2020 : GBP/USD Intraday technical analysis and trade recommendations.
- February 19, 2020 : EUR/USD Intraday technical analysis and trade recommendations.
- Analysis and forecast for USD/CAD on February 19, 2020
- BTC analysis for 02.19.2020 - Resistance on the test, potential for the downside rotation towards the level of $9.828
- USD/CAD analysis for February 19, 2020 - Watch for bigger drop on the USD/CAD and potential test of 1.3125
- GBP/USD: plan for the US session on February 19. The inflation data brought confusion to the market. The bulls don't have
- EUR/USD: plan for the US session on February 19. The euro continues to stagnate around annual lows. The sellers' target is
- Gold 02.19.2020 - Major resistance at the price of $1.611 on the test, watch for potential rotation down towards the $1.593
- Trading recommendations for EURUSD pair on February 19
- Technical analysis for USD/CHF on February 19, 2020
- Technical analysis of GBP/USD for February 19, 2020
- Gold is not confused by the weather
- Dollar is doing well, euro is leading the race to the bottom, while the pound is not in a hurry to join it
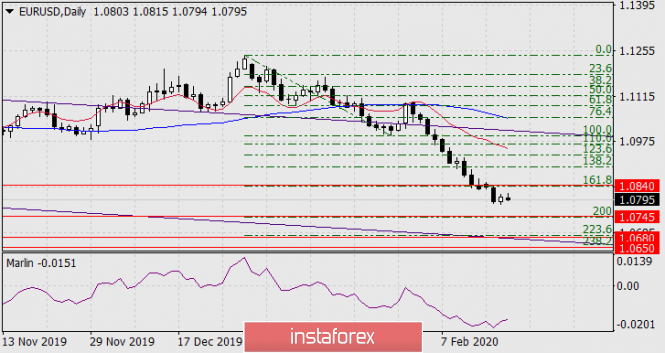
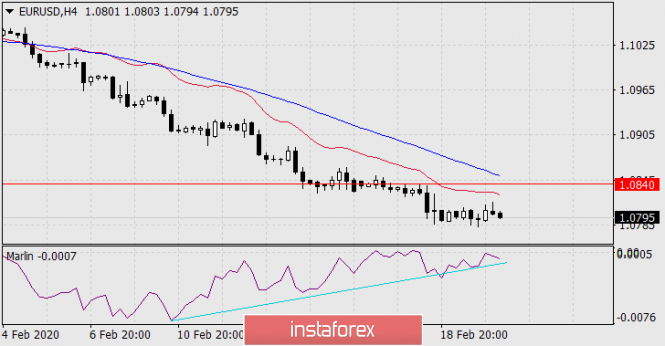
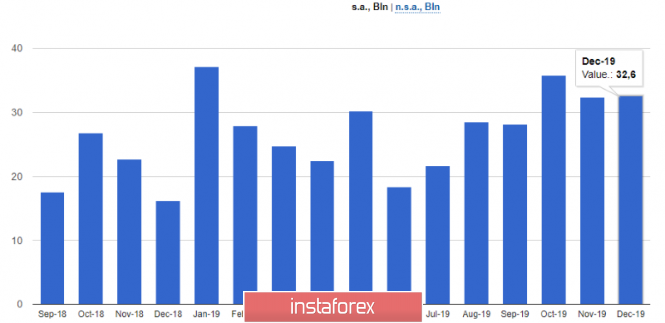
| Forecast for EUR/USD on February 20, 2020 Posted: 19 Feb 2020 07:59 PM PST EUR/USD The euro gained 13 points on Wednesday as part of a moderate expected correction after the previous three-figure fall. The growth could have been greater, but this was hindered by the fall of the British pound and the Japanese yen and the report on the eurozone balance of payments for December, which showed a balance of 32.6 billion euros against expectations of 34.5 billion. Data on the laying of new homes in the US for January showed a small decrease: 1.57 million against 1.63 million a month earlier, but the issued building permits increased from 1.42 million to 1.56 million, showing the highest figure since January 2007. Published minutes from the last FOMC Fed meeting showed nothing interesting. On the daily chart, the signal line of the Marlin Oscillator is pointing upward, it is possible to continue the correction to the Fibonacci level of 161.8% at the price of 1.0840. The main objectives of declining 1.0745 and 1.0650/80 are maintained. On the four-hour chart, the double convergence according to Marlin retains its potential effect, which may result in continued price growth, but the signal line of the oscillator stopped at the boundary with the territory of growth. Its withdrawal under its own support (the turquoise line) neutralizes the influence of convergence. This will happen if the price goes below yesterday's low. The material has been provided by InstaForex Company - www.instaforex.com |
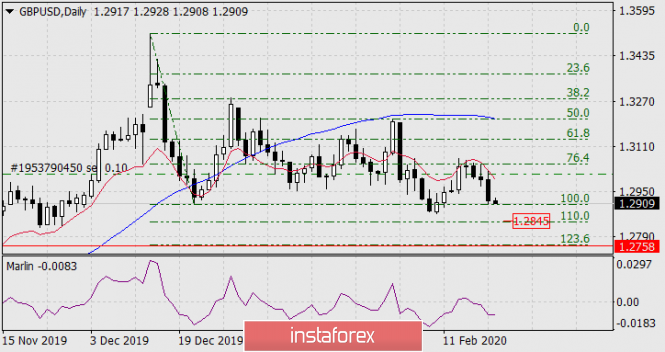
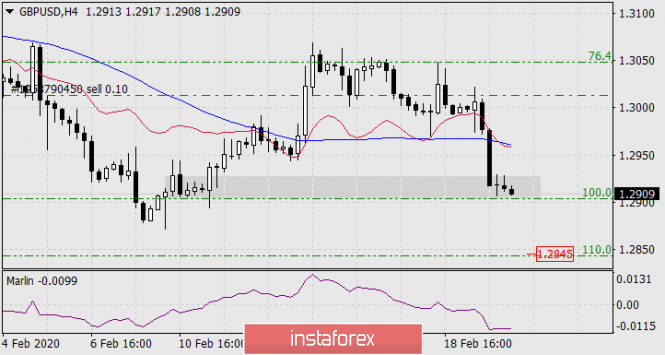
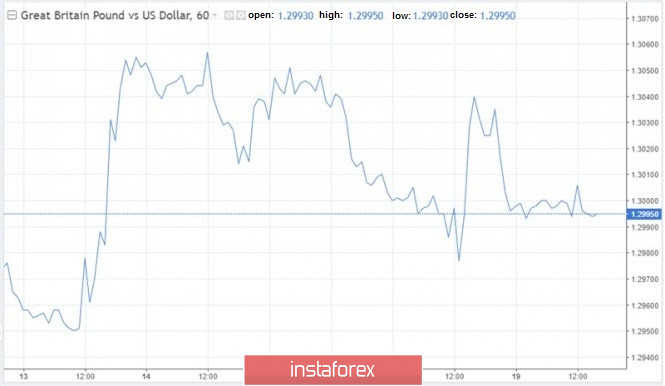
| Forecast for GBP/USD on February 20, 2020 Posted: 19 Feb 2020 07:57 PM PST GBP/USD The pound fell by 75 points yesterday, the price noted a low of December 23 and is now ready for further movement towards the previously identified goals at 1.2845 (110.0% Fibonacci level), 1.2758 (123.6%). The price on the daily chart is below the lines of balance and MACD, the Marlin oscillator is falling in the zone of negative values. On the four-hour chart, the price has consolidated under the MACD line, Marlin is also in a stable falling position. We look forward to the pound declining further. But today there may be a slight delay in the planned decline. In the afternoon, data on retail sales in the UK for January are released, the forecast for them is 0.7% versus -0.6% in December, the balance of production orders for the current month may also slightly improve - the forecast is -19 versus -22 in January. Technically, it will be consolidation in the range of February 10th. The material has been provided by InstaForex Company - www.instaforex.com |
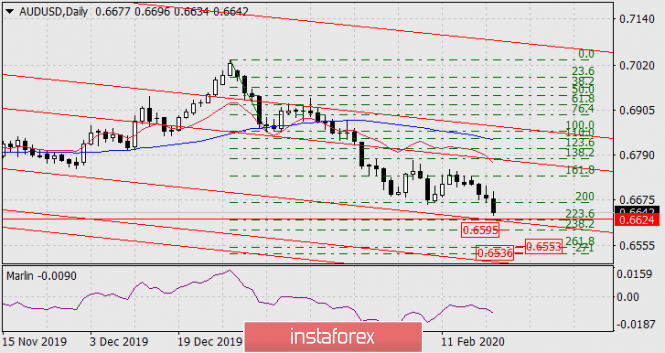
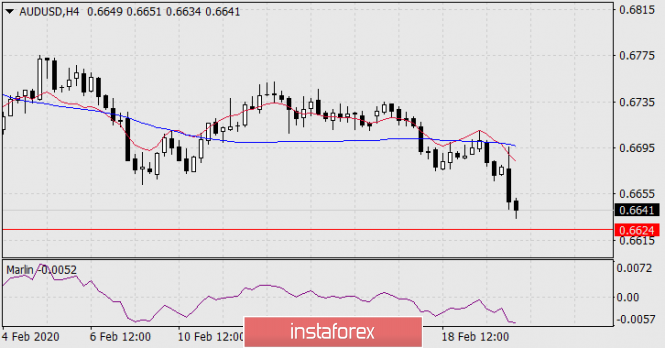
| Forecast for AUD/USD on February 20, 2020 Posted: 19 Feb 2020 07:55 PM PST AUD/USD The Australian dollar has already come close to the first target at 0.6624, formed by the Fibonacci level of 223.6% and the support of the embedded line of the price decreasing channel. When the level has been overcome, the goals are subsequently opened for the price: 0.6595 - Fibonacci level of 238.2%, range 0.6536/53, formed by the Fibonacci reaction levels of 271.0% and 261.8%. On the daily chart, the Marlin line has a sufficient power reserve before entering the oversold zone, which indicates a high probability of achieving these goals. On the four-hour chart, the downward trend is developing in its own way, there are no obstacles to lower prices. The material has been provided by InstaForex Company - www.instaforex.com |
| Fractal analysis of the main currency pairs for February 20 Posted: 19 Feb 2020 04:38 PM PST Forecast for February 20: Analytical review of currency pairs on the scale of H1:
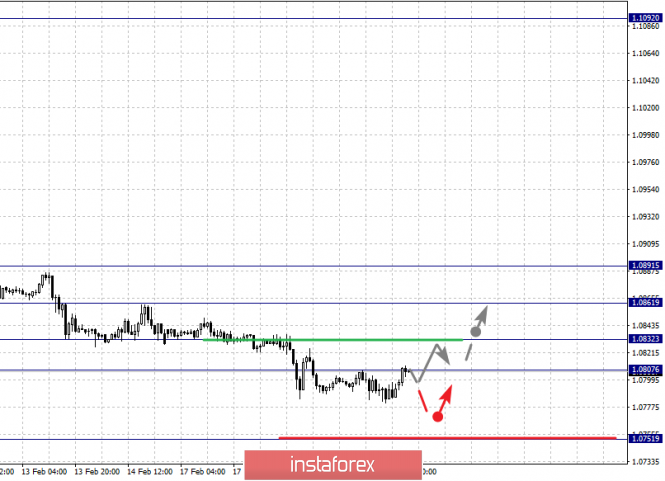
For the euro / dollar pair, the key levels on the H1 scale are: 1.0891, 1.0861, 1.0832, 1.0807, 1.0775 and 1.0751. Here, we expect a correction in a downward trend. Short-term upward movement is expected after the breakdown of the level of 1.0807. Here, the target is 1.0832. The breakdown of which will lead to in-depth movement. In this case, the target is 1.0861. This level is a key resistance for the subsequent development of the ascending structure. For the potential value for the top, we consider the level of 1.0891. We await the design of expressed initial conditions before this value. A potential value for the downward movement is the level of 1.0751, however, we consider the movement to this level as unstable. The main trend is a downward structure from January 31, we expect a correction Trading recommendations: Buy: 1.0807 Take profit: 1.0830 Buy: 1.0834 Take profit: 1.0860 Sell: 1.0775 Take profit: 1.0752 Sell: Take profit:
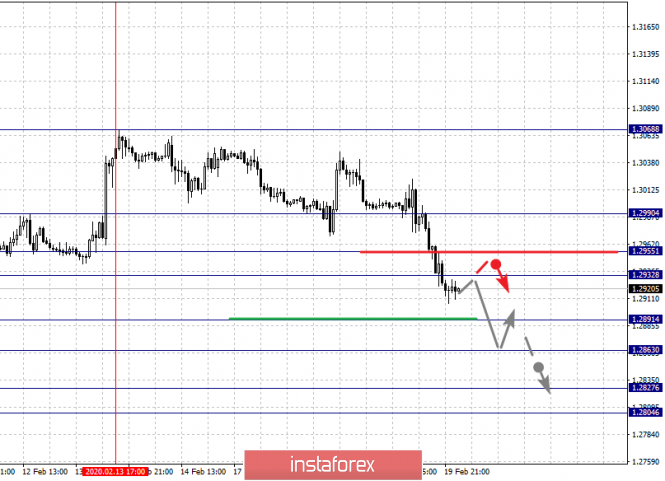
For the pound / dollar pair, the key levels on the H1 scale are: 1.2990, 1.2955, 1.2932, 1.2891, 1.2863, 1.2827 and 1.2804. Here, we are following the development of the downward cycle of February 13. Short-term downward movement is expected in the range 1.2891 - 1.2863. The breakdown of the latter value will lead to a pronounced movement. Here, the target is 1.2827. For the potential value for the bottom, we consider the level of 1.2804. Upon reaching which, we expect consolidation, as well as a rollback to the top. Short-term upward movement is possibly in the range of 1.2932 - 1.2955. The breakdown of the latter value will lead to an in-depth correction. Here, the target is 1.2990. This level is a key support for the downward structure. The main trend is the downward cycle of February 13. Trading recommendations: Buy: 1.2932 Take profit: 1.2954 Buy: 1.2957 Take profit: 1.2990 Sell: 1.2890 Take profit: 1.2865 Sell: 1.2861 Take profit: 1.2828
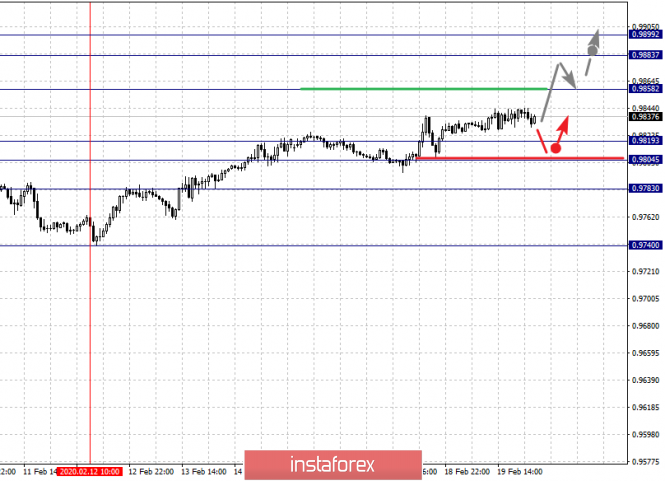
For the dollar / franc pair, the key levels on the H1 scale are: 0.9899, 0.9883, 0.9858, 0.9819, 0.9804 and 0.9783. Here, we are following the local ascendant structure of February 12. The continuation of movement to the top is expected after the breakdown of the level of 0.9858. In this case, the target is 0.9883. We consider the level of 0.9899 to be a potential value for the ascending structure. Upon reaching which, we expect consolidation, as well as a pullback to the bottom. Short-term downward movement is possibly in the range of 0.9819 - 0.9804. The breakdown of the latter value will lead to an in-depth correction. Here, the target is 0.9783. This level is a key support for the top. The main trend is the local potential for the top of February 12 Trading recommendations: Buy : 0.9858 Take profit: 0.9880 Buy : 0.9883 Take profit: 0.9899 Sell: 0.9819 Take profit: 0.9805 Sell: 0.9803 Take profit: 0.9784
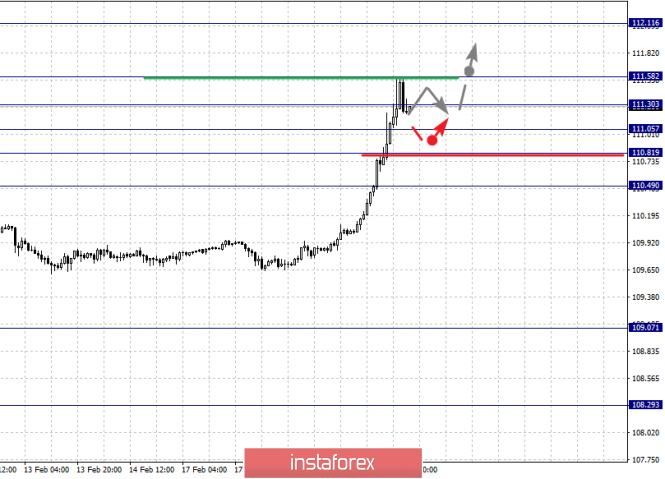
For the dollar / yen pair, the key levels on the scale are : 112.11, 111.58, 111.30, 111.05, 110.81 and 110.49. Here, we are following the development of the ascending structure of January 31. Short-term upward movement is expected in the range 111.30 - 111.58. The breakdown of the last value will lead to a pronounced movement to the potential target - 112.11. We expect a pullback to the bottom upon reaching this level. Short-term downward movement is possibly in the range of 111.05 - 111.05. The breakdown of the latter value will lead to an in-depth correction. Here, the target is 110.49. This level is a key support for the top. Main trend: upward structure of January 31 Trading recommendations: Buy: 111.30 Take profit: 111.55 Buy : 111.60 Take profit: 112.10 Sell: 111.05 Take profit: 110.83 Sell: 110.79 Take profit: 110.51
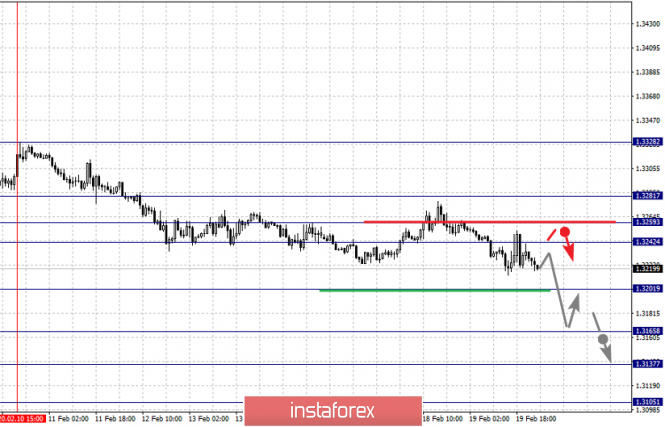
For the Canadian dollar / US dollar pair, the key levels on the H1 scale are: 1.3281, 1.3259, 1.3242, 1.3201, 1.3165, 1.3137 and 1.3105. Here, the descending structure of February 10 is considered medium-term. The continuation of the movement to the bottom is expected after the breakdown of the level of 1.3201. In this case, the target is 1.3165. Short-term downward movement, as well as consolidation is in the range of 1.3165 - 1.3137. For the potential value for the top, we consider the level of 1.3105. The movement to which is expected after the breakdown of the level of 1.3135. Short-term upward movement is possibly in the range of 1.3242 - 1.3259. The breakdown of the latter value will lead to an in-depth correction. Here, the target is 1.3281. This level is a key support for the downward structure. The main trend is the descending structure of February 10 Trading recommendations: Buy: 1.3242 Take profit: 1.3257 Buy : 1.3260 Take profit: 1.3280 Sell: 1.3200 Take profit: 1.3165 Sell: 1.3163 Take profit: 1.3140
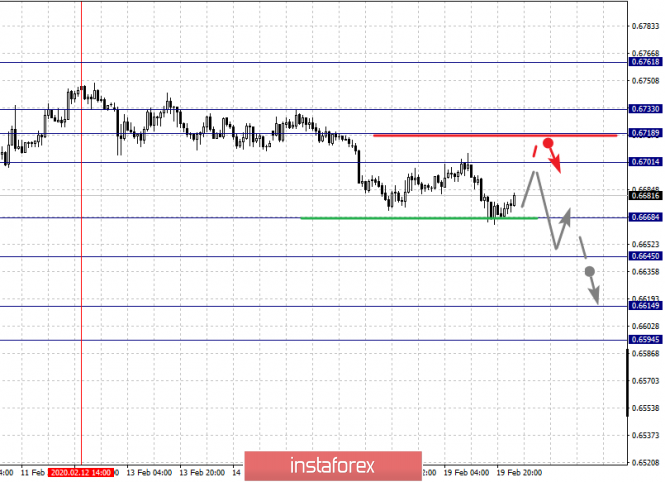
For the Australian dollar / US dollar pair, the key levels on the H1 scale are : 0.6733, 0.6718, 0.6701, 0.6668, 0.6645, 0.6614 and 0.6594. Here, we are following the descending structure of February 12. The continuation of the movement to the bottom is expected after the breakdown of the level of 0.6668. In this case, the target is 0.6645. Price consolidation is near this level. The breakdown of the level of 0.6645 should be accompanied by a pronounced movement to the level of 0.6614. For the potential value for the bottom, we consider the level of 0.6594. Upon reaching which, we expect consolidation, as well as a rollback to the top. A correction is expected after the breakdown of the level of 0.6701. In this case, the target is 0.6718. There is a short-term upward movement in the range of 0.6718-0.6733. The breakdown of the level of 0.6733 will lead to the formation of initial conditions for the top, here the target is 0.6761. The main trend is the descending structure of February 12 Trading recommendations: Buy: 0.6701 Take profit: 0.6716 Buy: 0.6718 Take profit: 0.6732 Sell : 0.6668 Take profit : 0.6647 Sell: 0.6643 Take profit: 0.6616
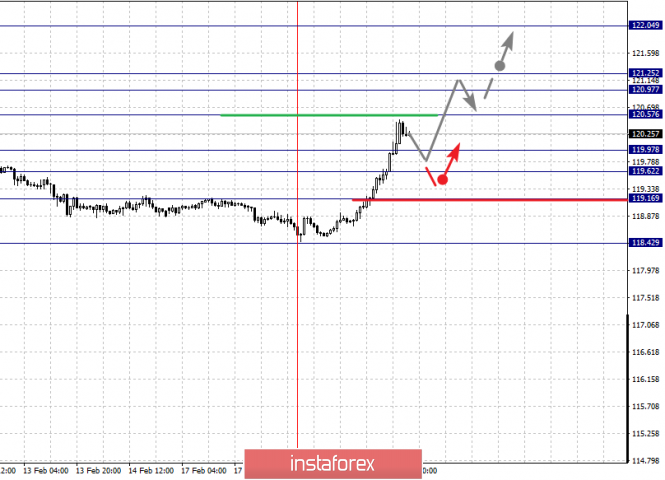
For the euro / yen pair, the key levels on the H1 scale are: 122.04, 121.25, 120.97, 120.57, 119.97, 119.62, 119.16 and 118.42. Here, the price forms expressed initial conditions for the top of February 18. The continuation of the movement to the top is expected after the breakdown of the level of 120.57. In this case, the target is 120.97. Price consolidation is near this level. The passing at the price of the noise range 120.97 - 121.25 will lead to a pronounced movement. Here, the potential target is 122.04. We expect a rollback to the bottom from this level. Short-term downward movement is possibly in the range of 119.97 - 119.62. The breakdown of the last value will lead to an in-depth correction. Here, the goal is 119.16. This level is a key support for the upward structure. The main trend is the formation of initial conditions for the top of February 18 Trading recommendations: Buy: 120.58 Take profit: 120.96 Buy: 121.25 Take profit: 122.04 Sell: 119.95 Take profit: 119.62 Sell: 119.60 Take profit: 119.17
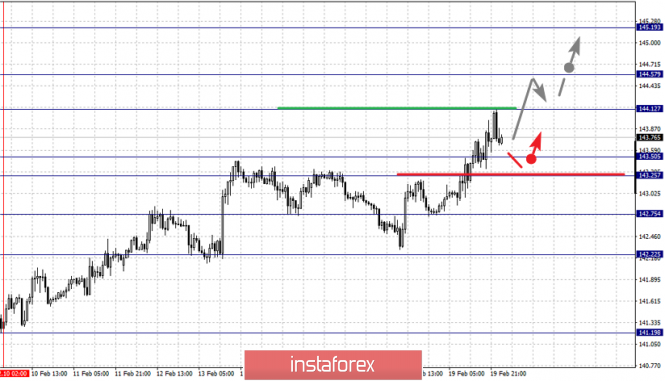
For the pound / yen pair, the key levels on the H1 scale are : 145.19, 144.57, 144.12, 143.50, 143.25, 142.75 and 142.22. Here, we are following the ascending structure of February 10. The continuation of the movement to the top is expected after the breakdown of the level of 144.12. In this case, the goal is 144.55. The breakdown of this value will lead to the movement to the potential target - 145.19. When this level is reached, we expect a pullback to the bottom. Short-term downward movement, as well as consolidation, are possible in the range of 143.50 - 143.25; hence, the likelihood of a reversal to the top. The breakdown of the level of 143.25 will lead to an in-depth correction. Here, the goal is 142.75. This level is a key support for the top. The main trend is the rising structure of February 10 Trading recommendations: Buy: 144.12 Take profit: 144.55 Buy: 144.60 Take profit: 145.16 Sell: 143.50 Take profit: 143.26 Sell: 143.23 Take profit: 142.80 The material has been provided by InstaForex Company - www.instaforex.com |
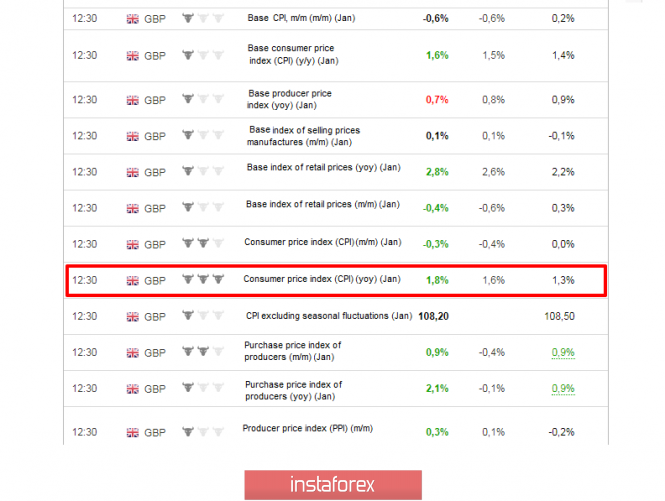
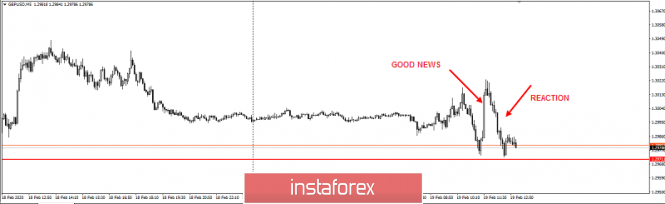
| Pound: cancellation of the long scenario Posted: 19 Feb 2020 03:28 PM PST Good evening, dear traders! I present to your attention an analysis of the GBP/USD pair. So, according to our morning recommendation, we advised taking long positions on the GBP/USD pair, in particular, on the good news on inflation today. In this regard, inflation data came out more than positive: After that, the GBP/USD pair started to increase rapidly; however, the growth slowed down after half an hour and the news positive was completely absorbed. For this reason, the log scenario is considered undeveloped. Apparently, there are reasons that force traders to sell the pound even on such strong and positive news. And this is unusual, given that this is not the first positive news about Britain in recent times. The target level for purchases of 1.3070 remains with us. Thus, we will recommend taking long positions for this target when there are buy signals (possibly lower than current prices). Have a successful trading and control the risks! The material has been provided by InstaForex Company - www.instaforex.com |
| Posted: 19 Feb 2020 02:55 PM PST The pound continues to be under pressure: despite good data on the growth of British inflation, the GBP/USD pair showed only a small price spurt, after which the pair plunged to the middle of the 29th figure. To the disappointment of the bulls of the pair, the news background regarding the prospects of the negotiation process between London and Brussels was not on the side of the British currency. And as you know, the Brexit issue is a priority for the pair - even American events are often ignored by the market when it comes to the "divorce proceedings". And although Brexit itself is already left behind, now the parties are trying to crystallize the rules for further relations. Harsh statements and comments (both from Brussels and London) offset any other fundamental factors. It is noteworthy that the main reports that were published this week did not significantly pull down the pound. On the contrary, the labor market showed good dynamics (though salaries did not reach the forecasted values), and today's inflation indicators - as a selection - they all came out in the green zone. If not for the Brexit factor, the pound paired with the dollar would probably have already tested 31 figures, opening up new price horizons for themselves. After all, current data suggest that the Bank of England will continue to maintain a wait-and-see attitude, despite calls by some members of the regulator to lower their interest rates. But the political events of recent days have mixed all the cards. GBP/USD traders again bogged down in a swamp of uncertainty amid the ultimatum statements of British and European politicians. In particular, Michel Barnier, the EU's chief negotiator, said today that Britain would not be able to get the same trade deal with the European Union as Canada. He said that Brussels is ready to voice a proposal to London, suggesting an "ambitious partnership", but the British proposed the Johnson team's scenario should be excluded from the list of probable ones. Barnet made this statement after his colleague, the British negotiator David Frost, called on Europeans to build relations that would "be built on a free trade scheme with Canada." Simply put, he proposed the so-called "Canadian option," according to which London enters into a deal with Brussels similar to the Comprehensive Free Trade Area Agreement (SETA) between the EU and Canada. This option allows for almost duty-free trading, with the exception of a number of goods and the service market. As an alternative, the British propose to go for the "Australian version". In this case, the parties can choose which sectors of the economy they can agree on, while all other areas will be regulated by the rules of the World Trade Organization. All the options voiced have their flaws - primarily from the point of view of the interests of the EU. According to Barnier, the trade deal between Britain and the EU will include, in particular, regulation of the fishing industry and other specific conditions for relations, given the territorial and economic proximity. Therefore, the future relations of Great Britain and the EU, according to Barnier, cannot be compared with the relations of the European Union with Canada or Australia. In addition, Brussels continues to insist that London accept the jurisdiction of the EU Court in possible trade disputes. Johnson predictably opposes this proposition. By the way, the agreement on trade and economic cooperation between the EU and Canada was concluded in 2016 after seven years of negotiations (!). Similar negotiations between Brussels and Australia on a free trade deal began in the year before last and still have not ended. But negotiations between the UK and the EU will officially begin only in March and should end in December. Given such a short time and all the previous statements by politicians, one can imagine how complex and nervous they will be. Actually, the pound is losing points against the background of such prospects. The good data on the growth of British inflation could not convince traders to strengthen the bullish positions in the pair. Although all inflation indicators today came out better than expected. For example, in annual terms, the general consumer price index jumped immediately to 1.8% - there has not been a similar result since last summer. Core inflation also exited in the green zone, recovering to 1.6%. In addition, the retail price index rose to six-month highs (on an annualized basis), and the producer purchase price index, instead of dropping to -0.1%, unexpectedly increased to 2.1%. Similarly, the producer price index rose. But all the successes "on the inflation front" today were ignored by traders of the GBP/USD pair - market participants focused on the Brexit topic, thereby increasing pressure on the pound. At the moment, the pair is heading to the bottom of the 29th figure, while the closest support level is located slightly lower - at around 1.2860 (the lower line of the Bollinger Bands indicator on the daily chart). It is worth noting that significant news of a positive nature regarding the prospects of the negotiation process can turn the pair 180 degrees in the blink of an eye. But, apparently, such a scenario seems unlikely so far - at least in the short term. Therefore, in the near future, the price may get stuck in the range of 28-29 figures in anticipation of the next information drivers. The material has been provided by InstaForex Company - www.instaforex.com |
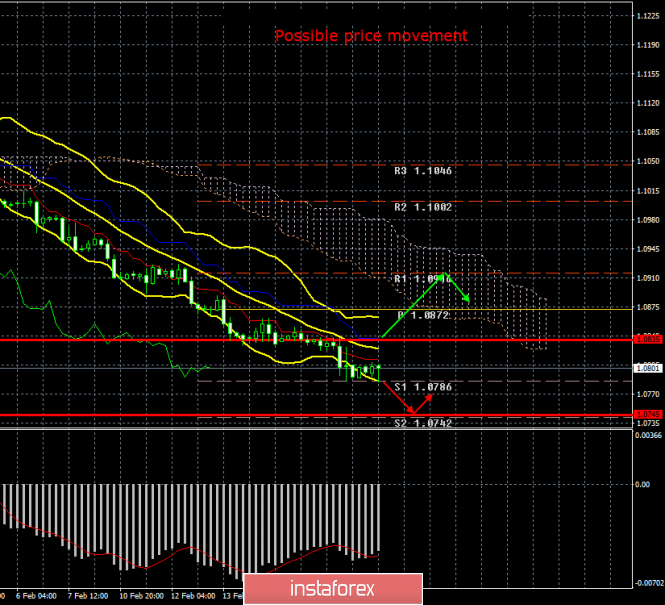
| Posted: 19 Feb 2020 02:55 PM PST 4-hour timeframe Amplitude of the last 5 days (high-low): 60p - 55p - 33p - 22p - 52p. Average volatility over the past 5 days: 45p (average). The EUR/USD currency pair, in a completely on-duty style, updated three-year lows, reaching 1.0785, and did not move from the current lows on Wednesday, February 19. The upward correction does not start and the single currency continues to fall. Despite the fact that today no important macroeconomic publication has been planned in the European Union and the United States that traders could use to take part of the profit on short positions, the correction stubbornly does not want to begin. However, we warned traders that such a weak, but confident, downward movement, which is observed now, can be very long. Thus, nothing changes for the euro/dollar pair. It should also be noted that the quotes of the pair have already worked out the support level of 1.0786 twice and failed to overcome it. Volatility has also decreased today and is currently 23 points. Thus, neither fundamental nor technical grounds for starting the correction are still observed. Even an unsuccessful attempt to overcome the level of 1.0786 cannot be considered a rebound, since the price has not rebounded anywhere, but is simply now trading along the indicated level. Thus, the only event today that could even theoretically affect the course of trading is the minutes of the Fed meeting. We believe that it will not have any particular effect on the movement of the euro/dollar pair. If only because it is difficult to even remember the last time that the publication of the minutes would provoke serious movements in the market. In this case, it should be clearly understood that traders do not react to the minutes itself with any information in it, but to very specific information. If this information is already known to traders, then no reaction will follow. Thus, in essence, one question remains: will the document contain anything that the market may not know? And again, the answer is no. There have been no changes in the US economy recently, there have been no global geopolitical events (such as a trade war or an outbreak of the virus). Thus, the Fed simply has nothing to tell traders. Based on this, most likely, the document will contain a standard set of theses characterizing the US economy, monetary policy, as well as global risks. We can only say good things about the US economy, as it again began to accelerate, in contrast to the European and British. Certain issues still cause industrial production and GDP, but the Fed still does not see a problem in the slowdowns of these indicators, which in time coincided with the period of the trade war with China. Monetary policy in a document can only be discussed in the context of its conformity to the current economic situation. And about global risks, most likely, it will be said that they continue to soften and fall. The only problem that can cause a certain excitement is the coronavirus, but this problem is not new and it is also well known in the trading community. Thus, for the rest of today, we do not expect any major price changes. Most likely, the downward trend will continue. We consider the issue of correction and inflation in the European Union to be more pressing issues, which will be published on Friday. Today in the UK, the consumer price index suddenly accelerated immediately by 0.5% in annual terms. Maybe something similar should be expected from European inflation? Although unlikely. German inflation showed minimal acceleration, so European inflation can accelerate to a high of 1.5% y/y. In addition, indices of business activity in the services and production sectors of the European Union, Germany and the United States will be released at the end of the week. The values are only preliminary, nevertheless they are very interesting. From a technical point of view, there is simply nothing to say now. The euro/dollar stood in one place all day, near the support level of 1.0786. There is not even a hint of working out one of the boundaries of the volatility channel. And since the fundamental background is extremely weak today, it is unlikely that anything will change. Thus, prior to the start of the correction, it is recommended not to try to guess its beginning, but simply continue to trade "in the trend". There are high chances for downward movement to continue below the Kijun-sen line Trading recommendations: The EUR/USD pair maintains a downward movement without starting to adjust. Thus, it is now recommended that you stay in euro-currency sales with targets at support levels of 1.0786 and 1.0745. The MACD indicator has again turned up and is discharging. It will be possible to consider purchases of the euro/dollar pair in small lots with the goal of a first resistance level of 1.0916, if traders manage to gain a foothold above the critical line. Explanation of the illustration: Ichimoku indicator: Tenkan-sen is the red line. Kijun-sen is the blue line. Senkou Span A - light brown dotted line. Senkou Span B - light purple dashed line. Chikou Span - green line. Bollinger Bands Indicator: 3 yellow lines. MACD indicator: Red line and bar graph with white bars in the indicators window. Support / Resistance Classic Levels: Red and gray dashed lines with price symbols. Pivot Level: Yellow solid line. Volatility Support / Resistance Levels: Gray dotted lines without price designations. Possible price movements: Red and green arrows. The material has been provided by InstaForex Company - www.instaforex.com |
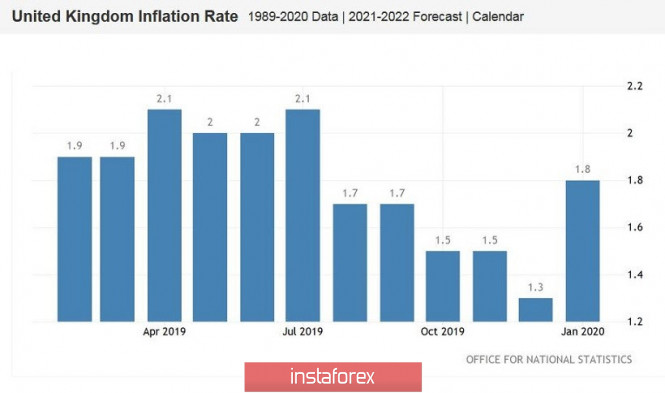
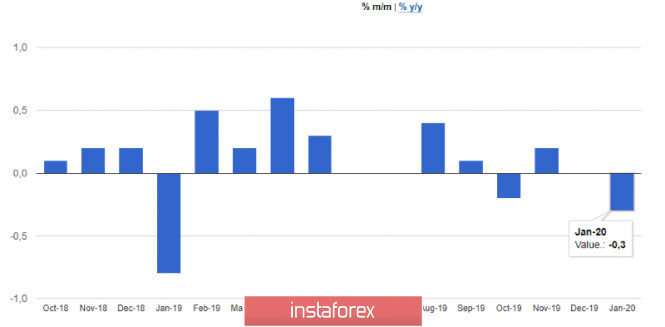
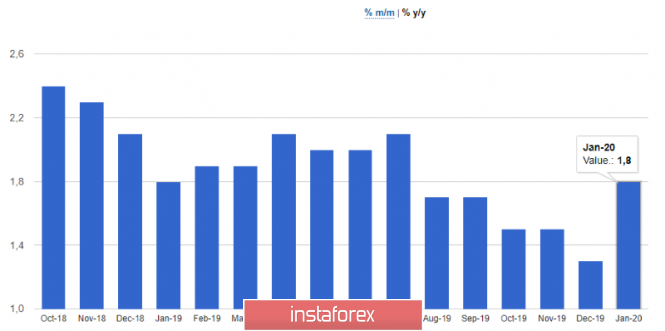
| EURUSD and GBPUSD: Pound not satisfied with UK inflation data. Euro ready to continue its decline Posted: 19 Feb 2020 02:55 PM PST A slight increase in the eurozone balance of payments current account surplus to 33 billion euros in December 2019 did not greatly help exhausted buyers of risky assets to regain at least part of their positions following the fall that has been observed since the beginning of this year. Let me remind you that the positive balance of the current account of the balance of payments of the eurozone amounted to 32 billion euros in November 2019. All attention will be shifted to the minutes of the January meeting of the US Federal Reserve today, which are unlikely to make any significant changes to the market, since traders will not find anything new in them. The Fed will publish the minutes, but the central bank's current approach to interest rates will remain unchanged. Let me remind you that in January, the Fed leaders voted to keep the key rate unchanged, in the range of 1.5% -1.75%. Before that, it was possible to observe three lows throughout 2019. It is possible that the emphasis in the minutes will be shifted to the likelihood of coronavirus affecting both the global economy and the trade conflict between the United States and China, a truce on which was reached at the end of last year. Last week, during his speech, Fed Chairman Jerome Powell touched on this problem, saying that the central bank is closely monitoring the situation and is ready to act as necessary, which is more likely to lead to lower interest rates than to raise them. However, this did not have any effect on the US dollar. The technical picture of the EURUSD pair remained unchanged. All that European bulls can count on is the pair's return to the resistance area of 1.0830, since it will only be possible to talk about a larger increase to the area of the highs of 1.0860 and 1.0890 above this range. If the pressure on the trading instrument continues further, update of the lows 1.0740 and 1.0680 is not ruled out. GBPUSD The British pound rose on the news that annual inflation was higher than expected, which reduces the likelihood of lowering the Bank of England key interest rate. However, buyers of the pound have not yet managed to break above the quite important level of resistance. According to the report, the UK consumer price index increased by 1.8% in January 2020 compared to the same period of the previous year after rising by 1.3% in December. Economists had expected inflation to rise by only 1.6%. Let me remind you that the BoE's target level is about 2.0%. But core inflation, which does not take into account volatile categories, jumped to 1.6% in January against 1.4% in December, which indicates a very likely upward trend in domestic inflation in the coming months. Given that the BoE's monetary policy committee is not so keen on lowering interest rates, such indicators will allow it to push the likelihood of a slightly softening policy change. As for monthly indicators, according to the UK National Bureau of Statistics, the consumer price index fell by 0.3% in January 2020 compared to December, when inflation remained unchanged. Economists had expected a decline of 0.4%. The retail price index fell 0.4% after rising 0.3% in December, and the purchasing price index rose 0.9% after a similar increase in December 2019. As for the technical picture of the GBPUSD pair, the struggle for the important level 1.3010 continues. Only a breakthrough of this range will allow buyers of the pound to expect a return to the upper boundary of the side channel 1.3060, and its breakdown will open a direct path to the highs of 1.3100 and 1.3140. If the bears prove to be stronger and break below the support of 1.2970, then, most likely, only the lows of 1.2925 and 1.2870 will have to catch the pound. The material has been provided by InstaForex Company - www.instaforex.com |
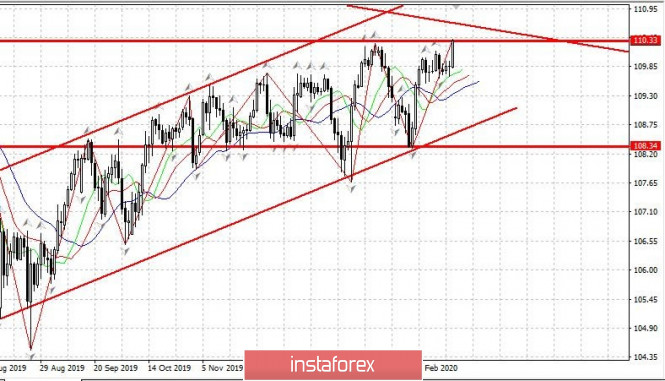
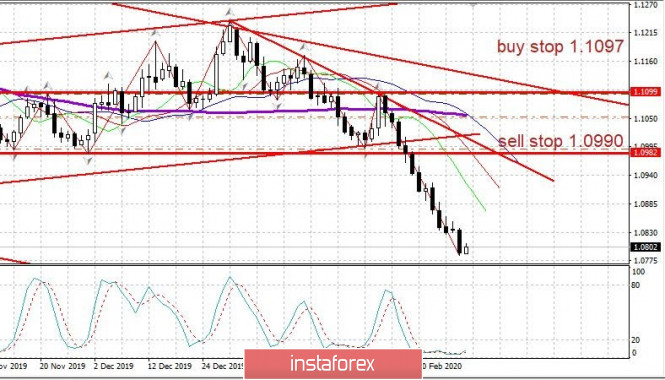
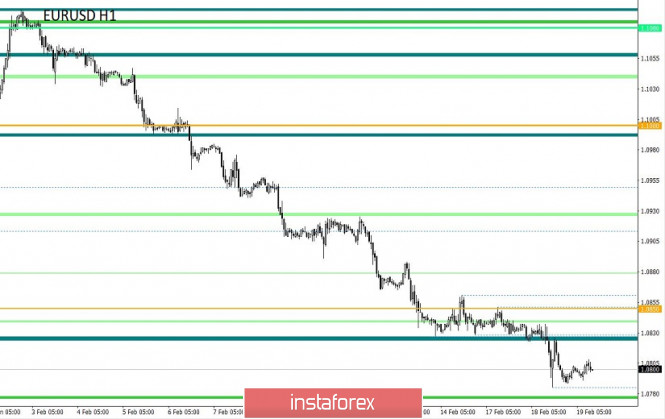
| Evening review 02/19/2020 EURUSD - Yen joins the euro in the dollar trend Posted: 19 Feb 2020 02:55 PM PST Above is the daily USDJPY chart - we see that the yen, after a long consolidation, breaks up to the important level of 110.30 - this is the level of the weekly order. If the day closes above this point, this is a strong signal for the yen trend in favor of the dollar. Thus, the yen (in case of a successful breakthrough) will become the second asset that enters the trend of strengthening the dollar, after the euro. This is EURUSD - the daily chart. The downward trend in the euro is clearly visible. Note that when a trend is clearly visible on the daily chart - a reversal requires a figure that is clearly visible at least on the H4 chart; and if the trend is clearly visible on the weekly chart, the reversal pattern should be visible on the daily chart. The chart clearly shows the goals for the daily pullback - note that there has not been a daily scale pullback since the beginning of the trend. The first pullback - to the green line - that is, to 1.0905. The second pullback - to red - that is, to 1.0940. The third pullback - to the blue - 1.0980 - and closing the day above the blue - cancel the trend. We keep sales from 1.0990 - we sell from the rebounds to the top - the possible levels of pullback are indicated above. The material has been provided by InstaForex Company - www.instaforex.com |
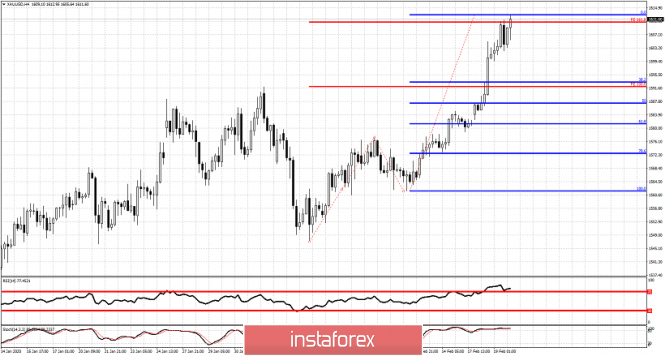
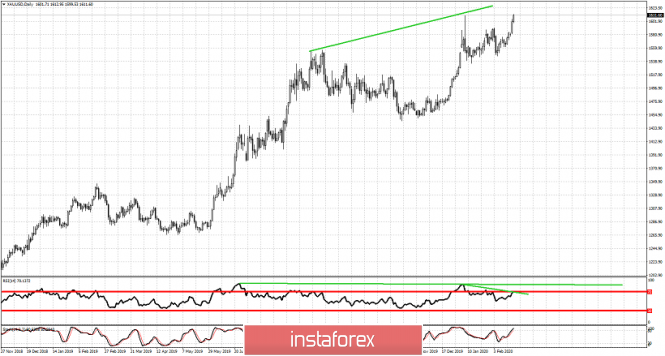
| Gold is expected to pull back towards $1,600-$1,590 before continuing higher Posted: 19 Feb 2020 02:35 PM PST Gold price had a good week so far making new higher highs. Trend remains bullish but traders should be very cautious. Today we take a look at the very short-term possibility of a pull back and the longer-term chances of a major top coming.
Blue lines - Fibonacci retracement The latest leg up in Gold that started at $1,561 is the 161.8% extension of the first upward move from $1,547 to $1.577. This extension is a very common target and prices usually make a short-term top at this level. With the RSI and stochastic diverging in overbought levels, I expect price to pull back towards the 38% Fibonacci retracement and the $1,600-$1,590 area.
In the Daily chart we so far have a second higher high and a second bearish divergence. This is a big warning for Gold bulls. Although I feel the current move is not finished, bulls should be very cautious as we could very well be close to the end of the entire upward move in Gold from the 2018 lows. Key long-term support is Gold is at $1,560. As long as we trade above this level, trend is bullish. The material has been provided by InstaForex Company - www.instaforex.com |
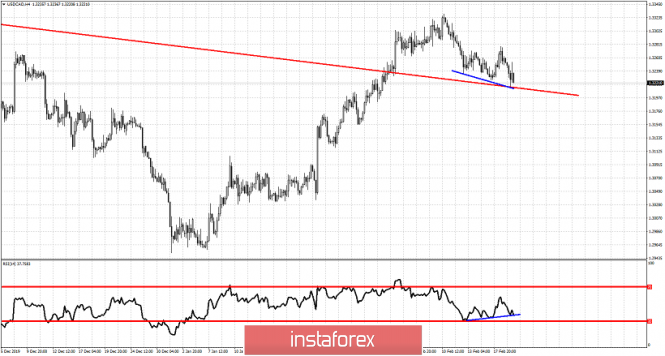
| USDCAD and the three drive pattern Posted: 19 Feb 2020 02:16 PM PST In our last analysis on USDCAD, price was at 1.3230 and we pointed out that a bounce was coming. Price bounced towards 1.3280 and then reversed back down to provide us with a new lower low. But the RSI did not follow.
Blue line- bullish divergence This is the second time we see a lower low and RSI not following to new lows. This is a three drive pattern and it implies that there are many chances of a bigger upward move-reversal even above 1.3280. The blue line in the RSI points out the divergence but also works as a support trend line connecting the higher lows. I believe there are high chances we see USDCAD reverse upwards from current levels towards 1.33-1.34. The material has been provided by InstaForex Company - www.instaforex.com |
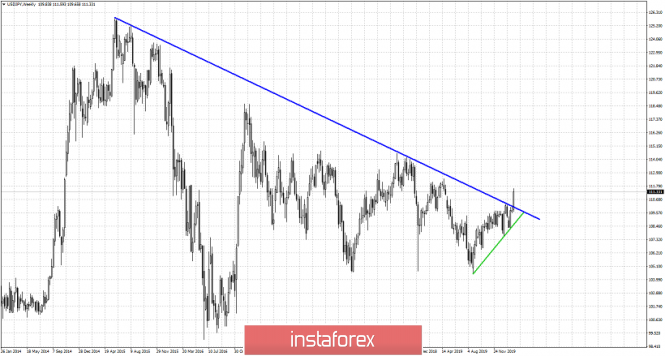
| USDJPY breaks above critical weekly resistance Posted: 19 Feb 2020 02:12 PM PST Earlier today we pointed out a bullish formation in USDJPY. We noted that a break above 110.30 would initially lead to 111.30 as it did within a few hours. With this move higher the weekly chart shows us an important bullish message, as price has broken above an important trend line resistance.
Green line - support trend line USDJPY has managed to move above 111 and above the downward sloping trend line coming from 2015. This trend line had lead to the price rejection of more than 4 times and in several cases had lead to a multi-month decline in price. Now price is breaking above it. Price remains in a bullish trend as we continue to see higher highs and higher lows. Staying above this blue trend line is key for the weekly bullish trend. A fake break out would be a very bad sign....so far there is no such sign. The material has been provided by InstaForex Company - www.instaforex.com |
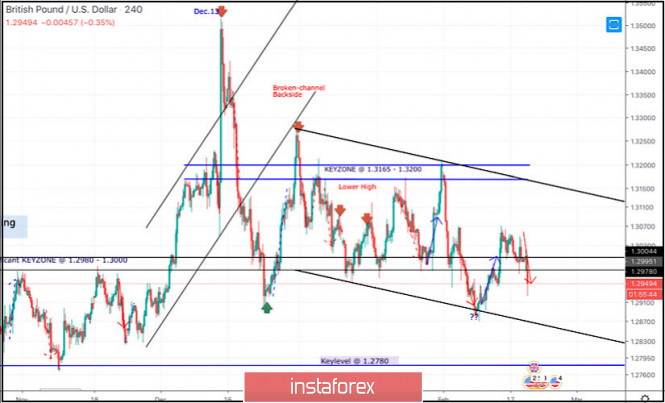
| February 19, 2020 : GBP/USD Intraday technical analysis and trade recommendations. Posted: 19 Feb 2020 08:23 AM PST
On December 13, the GBPUSD pair looked overpriced around the price levels of 1.3500 while exceeding the upper limit of the newly-established bullish channel. On the period between December 18th - 23rd, bearish breakout below the depicted channel followed by temporary bearish closure below 1.3000 were demonstrated on the H4 chart. However, immediate bullish recovery (around 1.2900) brought the pair back above 1.3000. Bullish breakout above 1.3000 allowed the mentioned Intraday bullish pullback to pursue towards 1.3250 (the backside of the broken channel) where bearish rejection and a new wide-ranged movement channel were established between (1.3200-1.2980). Recently, new descending highs were demonstrated around 1.3200 and 1.3070. Intraday technical outlook is supposed to remain bearish as long as the pair maintains its movement below 1.3070 (recently-established descending High). Recent Bearish breakdown below 1.2980 enhanced further bearish decline towards 1.2890 (the lower limit of the movement channe) where signs of bullish rejection have been manifested Since February 10. This week, Temporary bullish breakout above 1.3000 has been expressed until Today when another bearish decline was expressed few hours ago. The current bearish decline below 1.2980 will probably lead the GBPUSD pair towards the next demand-level (the lower limit of the channel @ 1.2850) where price action should be watched. On the other hand, any bullish recovery above 1.3000 invalidates the short-term bearish scenario. The material has been provided by InstaForex Company - www.instaforex.com |
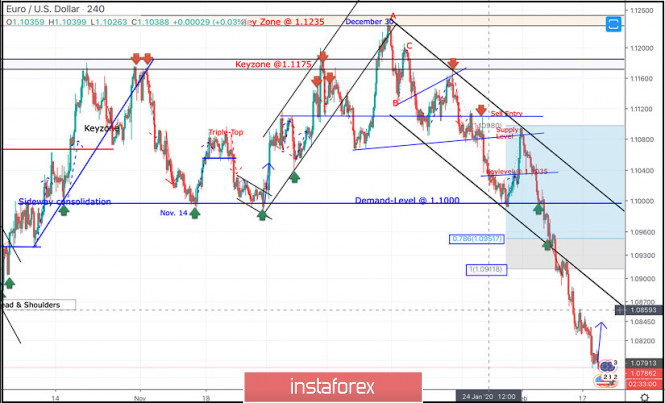
| February 19, 2020 : EUR/USD Intraday technical analysis and trade recommendations. Posted: 19 Feb 2020 07:35 AM PST
On December 30, a bearish ABC reversal pattern was initiated around 1.1235 (Previous Key-zone) just before another bearish movement could take place towards 1.1100 (In the meanwhile, the EURUSD pair was losing much of its bearish momentum). One more bullish pullback was executed towards 1.1175 where the depicted key-zone as well as the recently-broken uptrend were located. That's why, quick bearish decline was executed towards 1.1100 then 1.1035 which failed to provide enough bullish SUPPORT for the EURUSD pair. Further bearish decline took place towards 1.1000 where the pair looked quite oversold around the lower limit of the depicted bearish channel where significant bullish rejection was able to push the pair back towards the nearest SUPPLY levels around 1.1080-1.1100 (confluence of supply levels (including the upper limit of the channel). Since then, the pair has been down-trending within the depicted bearish channel until last week when bearish decline went further below 1.0950 and 1.0910 (Fibonacci Expansion levels 78.6% and 100%) establishing a new low around 1.0790. Currently, the EUR/USD pair looks quite oversold after such a long bearish decline and if bullish recovery is expressed above 1.0845-1.0860, further bullish advancement would be expected towards 1.0910 then 1.0950. Intraday traders are advised to look for signs of bullish recovery around the current price levels of (1.0790) as a valid intraday BUY signal aiming towards 1.0910 (the nearest broken demand-level). On the other hand, bearish persistence below 1.0790 may enable more bearish decline towards 1.0755 and 1.0700. The material has been provided by InstaForex Company - www.instaforex.com |
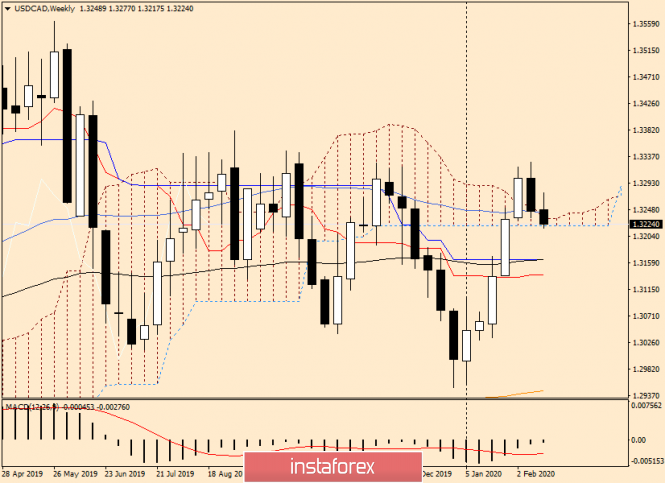
| Analysis and forecast for USD/CAD on February 19, 2020 Posted: 19 Feb 2020 06:12 AM PST Good day! In this article, we will look at the technical picture for the USD/CAD pair, based on which we will try to determine the most current trading positions and entry points. However, since there is a large flow of important macroeconomic data from the US and Canada this week, let's briefly discuss the most important ones. You can always find more information on the economic calendar. So, today at 14:30 (London time), Canada will release the consumer price index. Let me remind you that this is one of the most important indicators that affect inflation. Numerous speeches by members of the Open Market Committee of the US Federal Reserve will eventually end with the publication of the FOMC minutes at 20:00 (London time). You should also pay attention to the macroeconomic reports on American real estate. Now, let's move on to the price charts. Weekly
Despite the fact that the US dollar strengthened last week across a wide range of markets, its geographical neighbor weakened against the "Canadian". It is worth noting that the pair went within the limits of the Ichimoku indicator cloud, however, it was saved from further decline by the 50 simple moving average, which provided strong support. At the time of writing, the downward trend continues this week and the pair is on the verge of going down from the Ichimoku cloud. If the week is successful and closes below the lower border of the cloud, we can expect a decline in the area of 1.3165. The strong technical mark of 1.3160 (+-5 points) itself is reinforced by the Kijun line of the Ichimoku indicator, as well as the 89 exponential moving average. The Tenkan line passes below 1.3139. Thus, it can be assumed that in a downward scenario, the main target will be the price area of 1.3165-1.3140. To be honest, it is worth looking at the pair's purchases from here. It is a strong and important price zone for opening positions. Daily
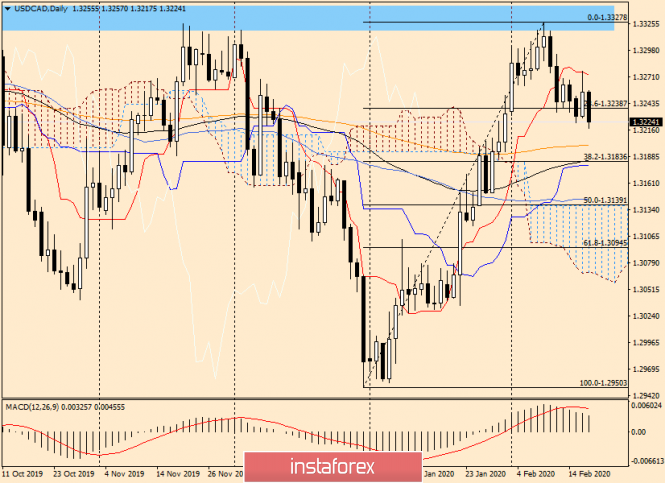
On the daily chart, I stretched the Fibonacci grid to the growth of 1.2950-1.3328. The pair is trading for the sixth day in a row near the first pullback level from this movement of 23.6 Fibo. However, it seems that it will not be able to hold the price and will still be broken. If this happens, we are waiting for the "Canadian" at the next corrective level of 38.2 Fibo, near the mark of 1.3185. However, the 200 exponential moving average, which runs at the iconic and significant level of 1.3200, may well support the quote and send the pair up. Below the price area of 1.3185-1.3180 are 89 EMA, Kijun line and 38.2 Fibo level from the growth of 1.2950-1.3328. So far, everything fits together. We are waiting for a correction to the area of 1.3185, where we are considering options for opening long positions on USD/CAD. As for sales, I think it's a little late. Good resistance was provided by the Tenkan line, but if it is approached again, then most likely it will be broken. H4
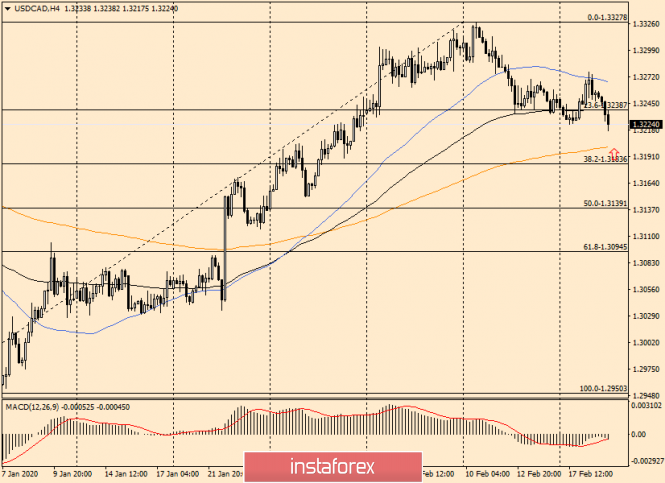
Most likely, the level of 23.6 Fibo breaks through. In this case, we are waiting for the pair in the area of 1.3200-1.3185, where 200 EMA and 38.2 Fibo. The second option for purchases at lower prices is recommended to look in the price zone of 1.3165-1.3140. As for sales, they are riskier, however, those who wish can try them after rising to 50 MA. As you can see, this moving at the moment has a decent resistance. But this position is against the main upward trend, although everything will still be decided after the release of the Fed's minutes. Good luck! The material has been provided by InstaForex Company - www.instaforex.com |
| Posted: 19 Feb 2020 05:37 AM PST Industry news:
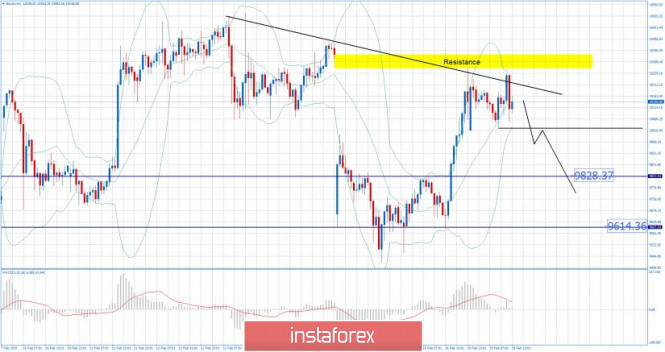
An $8 million ICO project is shutting down, citing regulatory uncertainty and difficulties in onboarding new users. Content-sharing platform Contents Protocol announced Wednesday that following numerous attempts to turn its business into a success, the firm is closing down and refunding investors as much as $7.5 million-worth of the ether (ETH) raised in its initial coin offering (ICO). "We inform you that due to continued regulatory uncertainties in cryptocurrency and lack of business prospect, we have decided to end our project," reads an announcement that has now wholly replaced Contents Protocol's website. Contents Protocol was a relative latecomer to the ICO boom, only completing its crowd sale in December 2018. It was created as a subsidiary of WATCHA Play, a popular Korean streaming service, and was designed to incentivize content sharing by effectively rewarding users who rated and reviewed films and TV featured on the platform with its native CPT token. Technical analysis: BTC has been trading sideways at the price of $10.128. Anyway, I see potential for the downside due to rejection of the resistance and the outside bearish candle on the hourly time-frame. Watch for selling opportunities if you see the breakout of the support at $10.028. Downward targets are set at the price of $9.828 and $9.614. MACD slow line did turn to the downside and it is confirms downside rotation. Resistance levels are seen at the price of $10.280 and $10.500 Support levels and downward targets are set at the price of $9.828 and $9.614. The material has been provided by InstaForex Company - www.instaforex.com |
| Posted: 19 Feb 2020 05:23 AM PST Technical analysis:
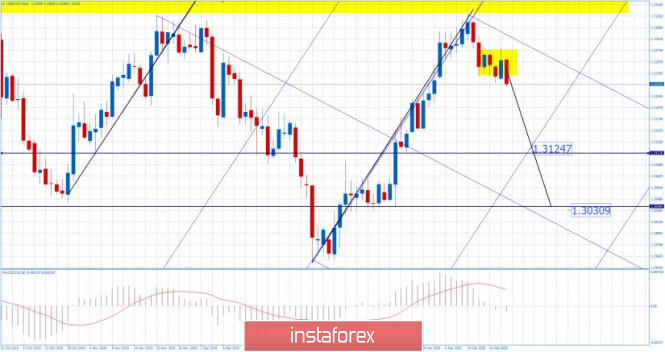
USD/CAD has been trading downside, exactly what I expected in previous forecasts. I still expect bigger drop on the USD/CAD towards the levels at 1.3125 and even 1.3030. Watch for selling opportunities on the rallies using the intraday time-frames 5/15 minutes for better timing for your entries. MACD slow line did turn to the downside and it is confirm potential bigger drop on the USD/CAD. Resistance levels are seen at the price of 1.3270 and 1.3330 Support levels and downward targets are set at the price of 1.3125 and 1.3030. The material has been provided by InstaForex Company - www.instaforex.com |
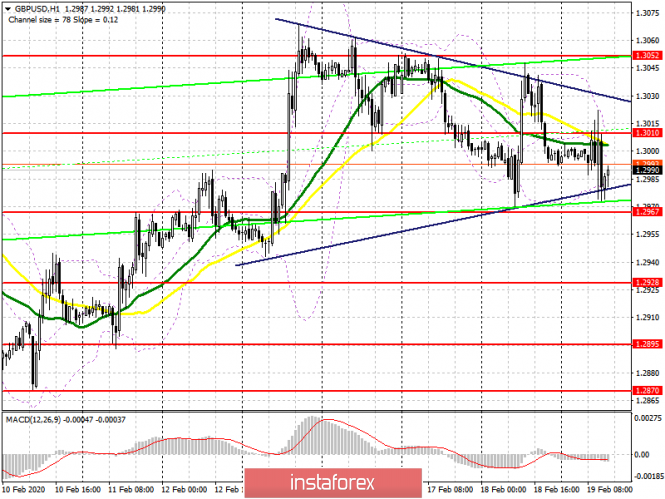
| Posted: 19 Feb 2020 05:11 AM PST To open long positions on GBPUSD, you need: In the morning forecast, I paid attention to the level of 1.3010 and noted that only a return to this range will be a signal to open long positions in GBP/USD. However, buyers failed to gain a foothold even after the inflation data, which was slightly better than economists' forecasts but generally indicated a slowdown in the growth rate of price pressure. Only a break in the resistance of 1.3010 will lead the pound to a new maximum of 1.3052, on which the further direction of the pair depends since the upper border of the triangle will be broken along with the test of 1.3052. Only fixing above 1.3052 will open a direct road to the area of 1.3093 and 1.3133, where I recommend fixing the profits. In the scenario of maintaining pressure on the pound, it is best to return to long positions only after forming a false breakdown in the support area of 1.2967, just above which the lower border of the triangle passes, but I recommend buying GBP/USD immediately for a rebound after updating the minimum of 1.2928. To open short positions on GBPUSD, you need: Today, the bears have already coped with the task of forming a false breakdown in the resistance area of 1.3010, which led to a decrease in the pound in the area of the lower border of the triangle, where the main trade is now taking place. A break in this range, along with a drift of the level of 1.2967, will increase the pressure on the pair, which will lead to a test of the lows of 1.2928 and 1.2895, where I recommend taking the profits. If the bulls still regain the area of 1.3010, in this case, it is best to consider new short positions only after the maximum of 1.3052 is updated or sell GBP/USD immediately for a rebound from the area of 1.3092 with the aim of a downward correction of 20-30 points. Signals of indicators: Moving averages Trading is conducted just below the 30 and 50 daily averages, however, this does not indicate a complete victory of sellers over buyers but rather indicates the side nature of the market. Bollinger Bands Volatility is reduced and a breakthrough in the upper limit of the indicator in the area of 1.3010 will lead to a sharp increase in the pound.
Description of indicators
|
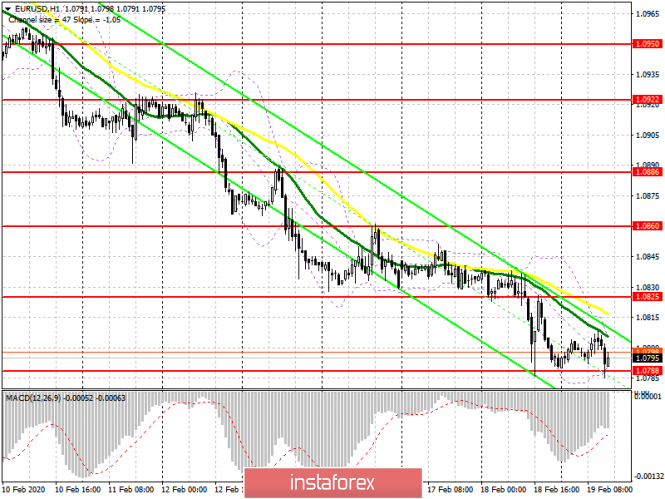
| Posted: 19 Feb 2020 05:11 AM PST To open long positions on EURUSD, you need: Given the latest weak data on the eurozone, namely the current account balance of the balance of payments, which showed growth less than expected by economists, the euro moved up a little. At the moment, the bulls are focused on yesterday's low around 1.0788 and the update of which led to the formation of a divergence on the MACD indicator, which is a bullish signal. However, there are no strong buyers in the market yet. In the scenario of a breakdown of this range, it is best to consider new long positions after updating the lows of 1.0765 and 1.0740. However, in the current bear market, one should be careful in finding the bottom. A better solution for buyers of the euro will be a return to the resistance of 1.0825, from which a good upward correction will be formed in the area of the highs of 1.0860 and 1.0886, where I recommend fixing the profits. To open short positions on EURUSD, you need: Bears continue to bend their line and weak fundamental data on the state of the European economy helps them in this. Already in the first half of the day, sellers updated the minimum of a year but it was not possible to gain a foothold on it. Most likely, the bears will rely on good reports on the US real estate market, as well as on the minutes of the Federal Reserve, which can put even more pressure on the euro. A break in the support of 1.0788 will bring EUR/USD in the area of the lows of 1.0765 and 1.0740, where I recommend taking the profits. In the scenario of the pair's growth in the second half of the day, only the formation of a false breakdown in the area of 1.0825 will signal the opening of short positions in the euro. I recommend selling immediately for a rebound only after testing the maximum of 1.0860. Signals of indicators: Moving averages Trading is conducted below the 30 and 50 moving averages, which indicates a further bearish trend in the euro. Bollinger Bands A break of the lower border of the indicator at 1.0768 will lead to a further fall in the euro. A break of the upper border of the indicator in the area of 1.0810 will help the bulls to build an upward correction.
Description of indicators
|
| Posted: 19 Feb 2020 04:43 AM PST Technical analysis:
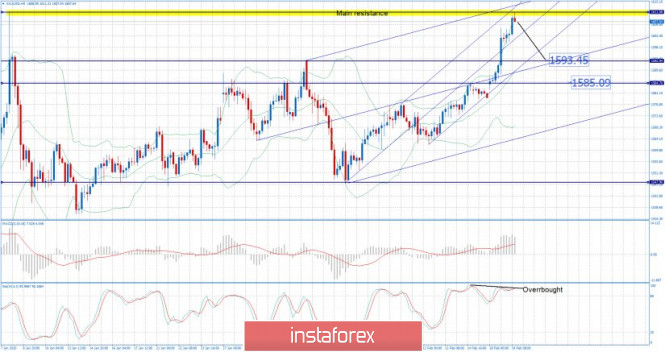
Gold has been trading upside. The price tested and rejected so far from of the main resistance at $1.611(January High), which is sign that buying at this stage looks very risky. I would watch for potential selling opportunities and downside rotation towards the levels at $1.593 and $1.585. Due to the test of major resistance at $1.611 and bearish divergence on the stochastic oscillator, downside opportunities are preferable. Major resistance is set at the price of $1.611 Support levels are seen at the price of $1.593 and $1.585. The material has been provided by InstaForex Company - www.instaforex.com |
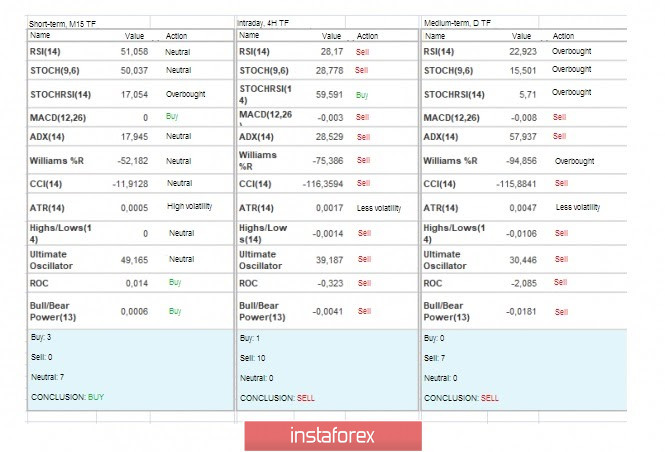
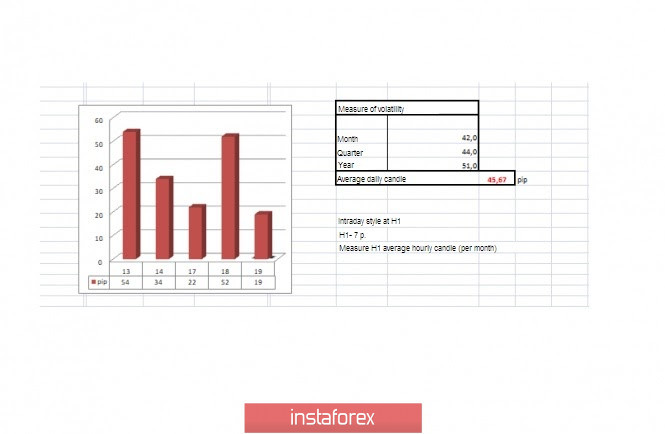
| Trading recommendations for EURUSD pair on February 19 Posted: 19 Feb 2020 03:58 AM PST From a comprehensive analysis, we see a breakdown of the lower limit of accumulation, which led to a new surge in short positions. Now, about the details. The 60-hour stagnation in the form of an accumulation of 1.0827/1.0861 is still broken by the impulse candle in the downward direction, lowering the quote to the area of 1.0785. In fact, the overheating of short positions did not become an obstacle but only confirmed the judgment stated in the previous review regarding FOMO (lost-profit syndrome). The fracture of an oblong correction, paired with the update of the lows, led to abundant attention. And as it often happens, traders do not pay attention to the movement until the "X" moment. So it turns out that short positions are overheated. There is a continuous decline in the market for 12 days and there was no correction either. Regarding the downward trend theory, we see further confirmation, which is expressed in updating the lows, as well as fixing the price beyond the control values. Only one thing is alarming: we consider a gradual course that has both impulses and corrections in its composition. As a result, we have a single impulse that can violate the entire concept of the theory. The danger is a fatal overheating, where stability takes a back seat, followed by another oblong correction. Now I am making an adjustment to FOMO, where perhaps common tact will still resume and the main prospects will still be achieved. In terms of volatility, we record an acceleration after two days of slowing down, where activity has returned to the area above the daily average. In fact, we see high speculative interest due to which activity is growing. A notable point was that the day before the surge, there was a sharp drop in volatility. I advise you to remember this pattern for the future as a life hack. Analyzing the past day by the minute, we see a characteristic zigzag-shaped oscillation, where the first impulse was in terms of a breakdown of accumulation in the downward direction. However, after that, there was a recovery and again a return. Details: 13:45-16:00 - down; 16:15-17:45 - up; 18:00-23:30 - Down (trading terminal time). As discussed in the previous review, medium-term traders are working on the downside, where there is already sufficient profit. At the same time, everyone else was watching the accumulation limits. Looking at the trading chart in general terms (the daily period), we see that the quote is developing around the spring of 2017. And about 100 points left before the base of the first psychological range (1.0700/1.0850). The news background of the last day did not contain significant statistical data on Europe and the United States, the main focus was on the speculative part. In terms of the general information background, we see a multi-faceted noise - all of the same toxic topics that the media likes to discuss. However, let's take it in order. Brexit has been accomplished and negotiations on trade relations are just ahead. Now, in the run-up to the event, a bubble of disagreements is being inflated, where each side defends its positions. Against this background, the Netherlands once again managed to stand out by providing statistics on how many companies moved from Britain to their country because of Brexit. So 62 organizations moved as soon as the referendum was held, after which another 78 moved, and now another 425 firms are negotiating to expand or move the company to this country. We are talking about the largest companies, thus the flow of investment is enormous. We go further and come across a high-profile theme of coronavirus, which is replete with its scary headlines. On this topic, China temporarily removes duties on 696 products from the United States. The information is confirmed by the Chinese Ministry of Finance, which provided a list of goods from the United States on Tuesday, including soy, pork, beef, corn, wheat, medical devices, medicines, some metals, as well as crude oil and liquefied natural gas. Naturally, we should not blame the coronavirus for everything. China's actions are related to the implementation of the first phase of the trade agreement between Washington and Beijing Today, in terms of the economic calendar, we have data on producer prices in the United States, where growth is expected from 1.3% to 1.7%. Then we get data on the construction sector, where the data is not good. The volume of construction of new homes in January fell by 30.7% (forecast), and the number of permits issued for construction has not changed. Today ends with the publication of the minutes of the January meeting of the Federal Reserve, where we do not expect anything drastic in terms of interpretation since all the main points regarding the actions of the regulator are already known. In turn, the head of the Federal Reserve Bank of Dallas, Robert Kaplan, said a day earlier that the committee is likely to leave the base interest rate at 1.5-1.75% until the end of 2020. Further development Analyzing the current trading chart, we see an insignificant pullback from the base point of 1.0789, where sellers are still eager for further declines. I do not exclude that the rollback still has the opportunity to expand the scope to the recently passed accumulation. At the same time, there is a prospect of a decline towards the lower limit of the first psychological range (1.0700/1.0850), but speculative interest is becoming unstable. By detailing the available period every minute, we record extremely weak activity in the direction of a pullback, which is more like another stagnation. In terms of the emotional mood of market participants, we see instability, which is expressed on the chart in the form of a variable surge. This symptom may be caused by FOMO syndrome, paired with psychological pressure from the ranges located under the quote. In turn, medium-term traders are considering a further downward trend: 1.0700->1.0500->1.0350. Intraday traders still expect a move to the border of 1.0700, however, the risk of a rebound is high. It is likely to assume that the downward interest will continue in the market but the overheating has already reached its limit. And at any moment, we may see a technical correction. Take this into account when calculating the risk for the transaction. Based on the above information, we will output trading recommendations: - Buy positions will be considered if the price is fixed higher than 1.0815, with the prospect of a move to 1.0830-1.0850, a local transaction. - Positions for sale are already held by traders both intraday and medium-term. The first point of interaction is in the area of 1.0700. Indicator analysis Analyzing different sectors of timeframes (TF), we see that the indicators of technical instruments are focused on the sell signal, due to the general downward background. Volatility for the week / Volatility Measurement: Month; Quarter; Year. The volatility measurement reflects the average daily fluctuation from the calculation for the Month / Quarter / Year. February 19 was based on the time of publication of the article. The volatility of the current time is 19 points, which is an extremely low indicator. It is likely to assume that due to the high speculative mood, the acceleration of volatility is still possible. Key levels Resistance zones: 1.0850**; 1.0850**; 1.0879*; 1.0900/1.0950**; 1.1000***; 1.1080**; 1.1180; 1.1300**; 1.1450; 1.1550; 1.1650*; 1.1720**; 1.1850**; 1.2100. Support zones: 1.0700; 1.0500***; 1.0350**; 1.0000***. * Periodic level ** Range level *** Psychological level ***** The article is based on the principle of conducting a transaction, with daily adjustments. The material has been provided by InstaForex Company - www.instaforex.com |
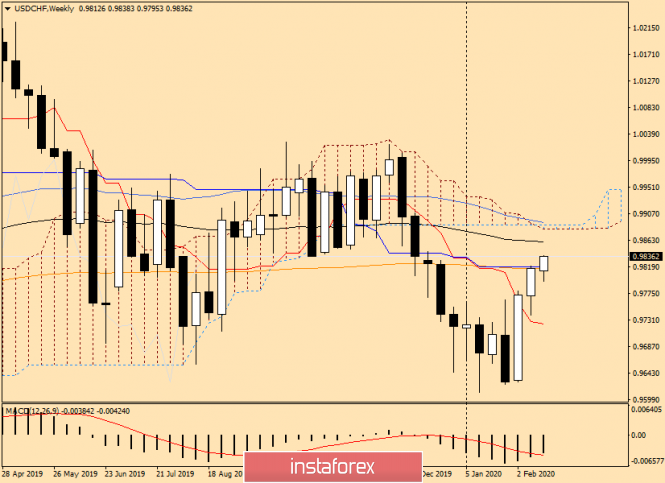
| Technical analysis for USD/CHF on February 19, 2020 Posted: 19 Feb 2020 03:50 AM PST Hello! For the dollar/franc currency pair, we can say that it "woke up" and began to actively move in the north. Growth has been going on for the third week in a row. The EUR/USD pair is actively declining and USD/CHF is a mirror image of the euro/dollar. At least it used to look more distinct and recently it's become a bit blurry. I believe that the reason for this is in some cross-rates and the unambiguous status of the Swiss franc - it is either a safe-haven currency or not. However, the correlation trend of the two pairs persists. Weekly
The pair overcomes very serious and important resistances. First, the Tenkan line of the Ichimoku indicator was passed. Last week's trading ended right at the 200 exponential moving average and just a little below the Kijun line. As a result of the growth that the pair is currently showing, trading is already above 200 EMA and Kijun. However, there is still a long way to go before the closing of the week and a lot can change. It is necessary to take into account a very large flow of macroeconomic data that will be coming from the United States during this week. And today at 20:00 (London time), the minutes of the last meeting of the Open Market Committee (FOMC) will be published. Perhaps this is the main event of the week that will determine the fate of the US dollar. At the moment, the US currency is experiencing quite strong bullish sentiment. If the growth continues, the dollar/franc will rise to the area of 0.9860-0.9890. I would like to note that 0.9860 is a fairly strong technical level that has repeatedly influenced the price. Now there are 89 exhibitors at this level, which will further strengthen this mark. Both borders of the Ichimoku indicator cloud and the 50 simple moving average are located near 0.9890. Thus, the area of 0.9860-0.9890 seems to be quite difficult to pass. It is worth taking into account the fact that a significant level of 0.9900 passes a little higher. In general, if the pair gets to these prices, there will be a serious struggle between the opposing sides. A bearish candlestick analysis model with a closing price below Kijun and 200 EMA signal a weakening of bullish sentiment or even a reversal at all. In this case, it is possible to correct or cancel the ascending scenario, however, it is still being implemented. Daily
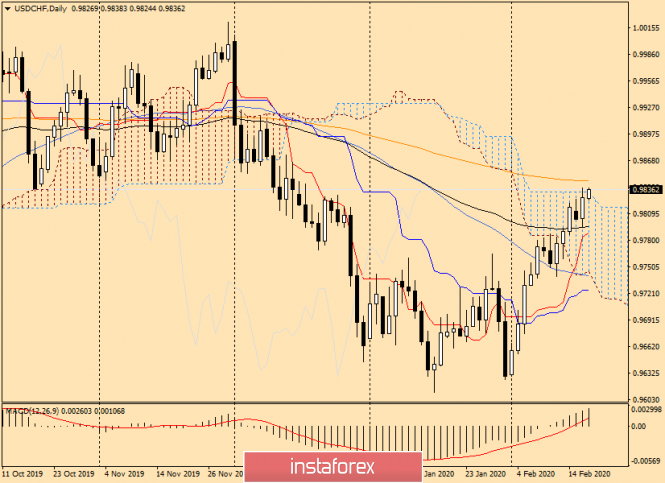
Interesting and important events also occur on the daily chart. The pair is trying to get out of the Ichimoku indicator cloud. This was not possible yesterday, however, the USD/CHF bulls are persistent. And at the moment of writing, the pair is trading above the upper border of the cloud. If the growth continues, it will test the 200 exponential moving average for strength. Thus, the nearest resistance in the form of 200 EMA can be expected at 0.9846. Its closing price will be extremely important for further understanding of the price dynamics of the dollar/franc. The closing of today's trading above 0.9846 will further indicate bullish sentiment for the pair. If the closing price of today's session is within the Ichimoku cloud and a bearish reversal candle appears, you should think about the pair's sales. H4
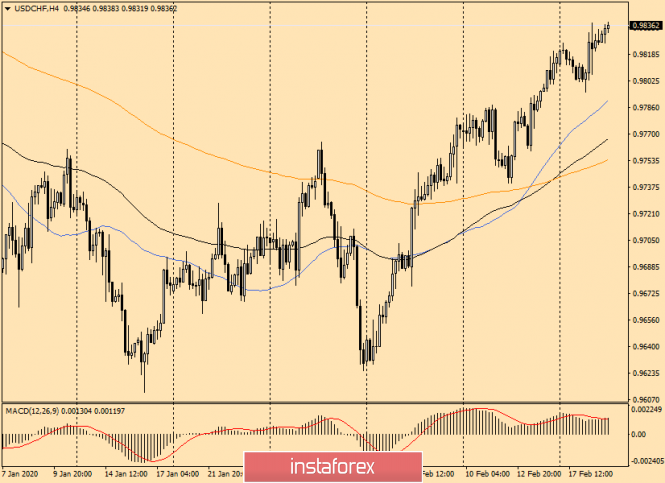
On this chart, the strong bullish trend slowed down near 0.9835. As we remember, on the daily chart, there are attempts to exit up from the Ichimoku cloud, which is why the pair met resistance on the 4-hour timeframe. If a candle indicating a decline is formed, we wait for a correction in the area of 0.9800 and try to buy. Lower prices for opening long positions are in the price zone of 0.9770-0.9750. In general, today is not the most favorable day for forecasts. When market participants will get acquainted with the Fed's minutes at 20:00 (London time), volatility will increase significantly and we will see sharp and strong movements, perhaps in each of the parties. Good luck! The material has been provided by InstaForex Company - www.instaforex.com |
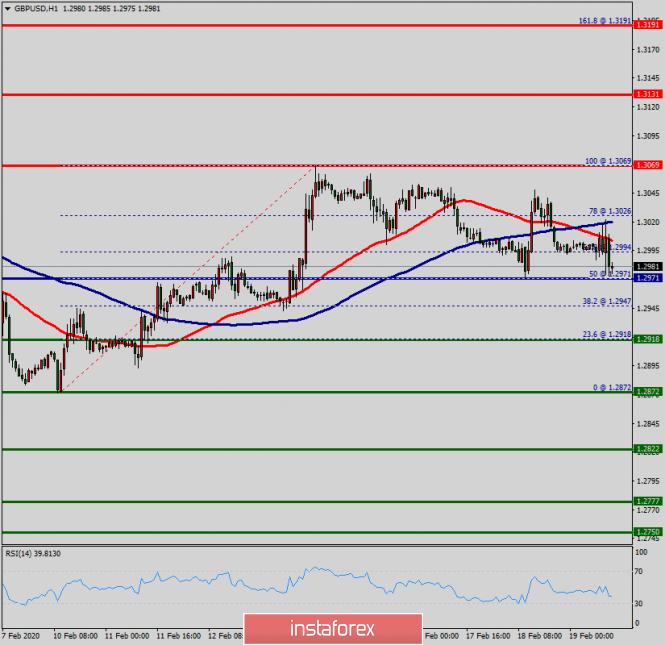
| Technical analysis of GBP/USD for February 19, 2020 Posted: 19 Feb 2020 03:38 AM PST Overview: The trend of GBP/USD pair movement was controversial as it took place in a narrow sideways channel, the market showed signs of instability. Amid the previous events, the price is still moving between the levels of 1.3069 and 1.2918. Also, the daily resistance and support are seen at the levels of 1.3069 and 1.2918 respectively. Therefore, it is recommended to be cautious while placing orders in this area. So, we need to wait until the sideways channel has completed. The market moved from its top at 1.3069 and continued to drop towards the pivot point of 1.2971. Today, in the one-hour chart, the current rise will remain within a framework of correction. However, if the pair fails to pass through the level of 1.3069, the market will indicate a bearish opportunity below the strong resistance level of 1.3069 (the level of 1.3069 coincides with the double top too). Since there is nothing new in this market, it is not bullish yet. Sell deals are recommended below the level of 1.3069 with the first target at 1.2918. If the trend breaks the support level of 1.2918, the pair is likely to move downwards continuing the development of a bearish trend to the level 1.2872 in order to test the daily support 2 (horizontal green line). The material has been provided by InstaForex Company - www.instaforex.com |
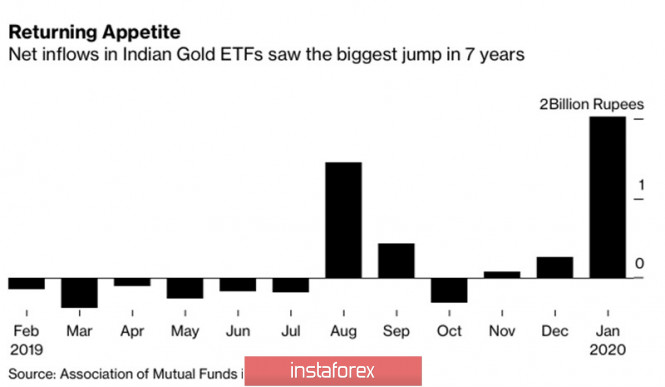
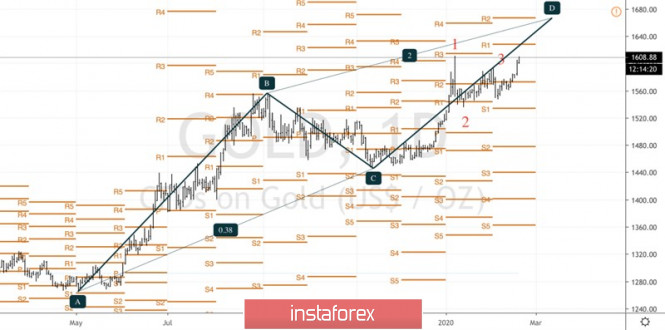
| Gold is not confused by the weather Posted: 19 Feb 2020 02:48 AM PST Encouraged by the example of palladium, which is not tire of rewriting historical highs, and the gloomy prospects of the world economy, gold easily crossed the psychologically important mark of $1,600 per ounce. The precious metal is not confused by the confident pace of US stock indices or the growth of the dollar to the area of a 4-month high against the main world currencies. Fears of a global recession and the belief that leading central banks will maintain ultra-loose monetary policy keep demand for safe-haven assets at an elevated level. Strong positions of gold on the physical market provide support for the "bulls" on XAU/USD. Stocks of the largest specialized fund SPDR Gold Shares reached 929.8 tons - the highest since November 2016. Capital inflows of 11 Indian ETFs in January amounted to 62 billion rupees ($870 million), which is 31% more than in January 2019. Dynamics of capital inflows to Indian gold ETFs
If you look at the external background, the recovery of the upward trend for the precious metal looks strange. Historical highs for the S&P 500 and a strong dollar indicate the strong position of the US economy and high global risk appetite. However, the rest of the world doesn't look as good as the United States because of the coronavirus. The Chinese economy risks slowing to 4-4. 5% in the first quarter and dragging Europe and other continents to the bottom. At the same time, the revaluation of the dollar complicates the Fed's task of achieving the 2% target for the personal consumption expenditure index. In order to stimulate inflation, the Fed may choose to resume the cycle of preventive rate cuts, which should be considered a "bullish" factor for XAU/USD. If ETF products are in high demand and gold is growing against an unfavorable background, can you imagine how it will spread its wings if external conditions improve? The deterioration of macroeconomic statistics for the United States will increase the likelihood of a weakening of the Fed's monetary policy and correction of US stock indexes. The precious metal will be able to benefit from these events, so it is not necessary to talk about the limited potential of the XAU/USD rally. The key events of the economic calendar for gold can be considered the publication of the minutes of the January meetings of the Federal Reserve and the ECB and the release of data on business activity in Germany and the eurozone for February. Investors do not expect anything new from the FOMC and the Governing Council. The Fed is likely to praise itself for three acts of monetary easing in 2019, and the European Central Bank will prefer to take time to assess the impact of the coronavirus on the eurozone. Nevertheless, the protocols are a reason for fixing profits on long positions for the US dollar, which should lend a helping hand to the "bulls" for XAU/USD. Technically, the inability of the bears to implement the 1-2-3 reversal pattern for the precious metal indicates their weakness. A break in resistance near point 3 opens the way for buyers to go north in the direction of the target by 200% using the AB=CD model. It corresponds to the mark of $1,675 per ounce. Gold, the daily chart
|
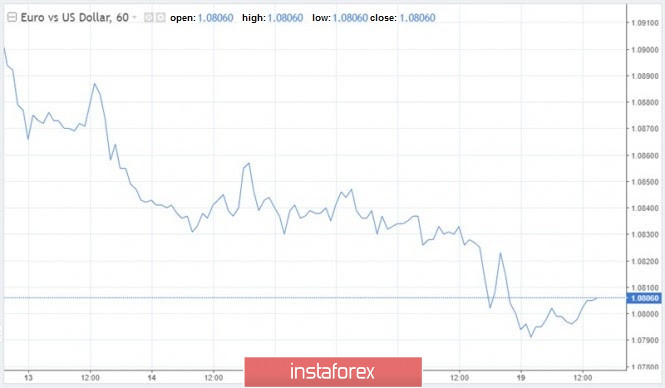
| Posted: 19 Feb 2020 01:36 AM PST The dollar continues to push its main competitors. The USD index is still near 4.5-month highs. At the same time, the leader in the decline against the US currency is the euro, which has already lost about 3.7% of its value against the US dollar this year, which is the worst indicator in the last five years. Moreover, America looks like a kind of security island, which is not afraid of winds blowing. Therefore, it is not surprising that money continues to flow to the United States, supporting the dollar. Last year, non-residents increased their stocks of US Treasury bonds by $ 425 billion, to $ 6,696 billion. This is the most serious influx of foreign capital in the United States since 2012. The main buyers of the treasuries were the Japanese ($ 115 billion) and Europeans (more than $ 100 billion), who, in the face of negative interest rates in the Land of the Rising Sun and the eurozone, were looking for where to put their money better. A strong American economy, an attractive US securities market, high demand for USD as a defensive asset. How can the euro respond to its opponent? The uncertainty around future trade negotiations between the United Kingdom and the European Union? The fall in economic expectations of investors regarding the prospects for German GDP from 26.7 to 8.7 and the deterioration of their opinion about the current state of the country's economy from -9.5 to -15.7? The data published on the eve of the ZEW Institute turned out to be significantly worse than preliminary estimates due to concerns about the negative impact on the world economy of the coronavirus epidemic and the deplorable results on German industrial production and GDP. It is noteworthy that the next inversion of the yield curve of treasuries no longer scares the fans of the dollar. The reduction in the differential of rates on ten-year bonds and three-month bills is regarded as a sign of a global recession and pulls down EUR / USD. On Tuesday, the euro against the US dollar drop below the $ 1.08 mark, updating the minimum since April 2017. "The exceeding drop in the euro is understandable. Key data on the eurozone continue to show deterioration, while in the US the situation is more favorable. Moreover, a downward revision of Chinese and global GDP growth in the face of an outbreak of coronavirus will have a stronger effect on the currency block, given the links in the supply chain between Europe and the Middle Kingdom. At the same time, political risks in Germany and Italy are intensifying, "Citigroup experts said. Meanwhile, investors are not expecting anything new from the publication of the minutes since the FOMC meeting in January. Most likely, Fed officials will continue to talk about the effectiveness of the three acts of monetary expansion in 2019. The US labor market is in excellent shape, inflation in the country is close to the Fed target, while it is too early to talk about the impact of the coronavirus epidemic on national GDP. In this situation, it is hardly worth counting on serious movement in the main currency pair. However, it is not yet clear whether the release of the minutes of the January meeting of the American Central Bank will become an occasion for profit taking on short positions in EUR / USD by large speculators, or whether they would prefer to see the 1.0750 mark. Amid the weakening of major currencies against the US dollar, the pound has been keeping special attention, which has fluctuated around the $ 1.30 mark since the beginning of the year. On Tuesday, the GBP / USD pair climbed above 1.30 after British Finance Minister Rishi Sunak announced that he would submit the budget, as planned, on March 11th. "I continue to prepare for the presentation of my first budget on March 11, which will fulfill the promises we made to the British people - to unlock the country's potential," he said. The pound was also supported by data on the British labor market, which showed that the number of people employed in the country rose again over the last three months of 2019, and the unemployment rate is at a multi-year low. However, the pound did not manage to maintain profit, and it quickly lost its gained position. "The British currency has demonstrated its obsession with the level of $ 1.30 once again. The GBP / USD pair continued moving in different directions amid the release of good UK labor market data indicating that the Bank of England is unlikely to see any urgency for lowering the interest rate," strategists told Rabobank. The fact that trade negotiations between the UK and the EU have not budged suggests that the risk of an uncontrolled Brexit remains relevant. The Alliance still requires Foggy Albion to comply with European law in exchange for access to its market, which London strongly disagrees with. Therefore, the pound's resilience to the overall strengthening of the US dollar is likely to be temporary. The material has been provided by InstaForex Company - www.instaforex.com |


| You are subscribed to email updates from Forex analysis review. To stop receiving these emails, you may unsubscribe now. | Email delivery powered by Google |
| Google, 1600 Amphitheatre Parkway, Mountain View, CA 94043, United States | |
No comments:
Post a Comment