
Forex analysis review |
- EUR/USD for February 21,2020 - Major upward target at the price of 1.0855 has been reached, still more room to the upside
- February 21, 2020 : GBP/USD Intraday technical analysis and trade recommendations.
- Gold 02.21.2020 - Pitchfork Warning line 1 is on the test at $1.650, watch for potential selling divergence on 4H time-frame
- BTC analysis for 02.21.2020 - Watch for potential downside continuation ,bear flag is in creation and there is potential
- February 21, 2020 : EUR/USD Intraday technical analysis and trade recommendations.
- Analysis of EUR/USD and GBP/USD on February 21. Weak inflation in the European Union ruined the effect of increased business
- GBPUSD and EURUSD: the British pound has risen sharply and is fighting back against the US dollar. The euro cannot determine
- EUR/USD. February 21. Analysis of COT reports for the euro over the last 5 weeks
- GBP/USD. February 21. Analysis of COT reports for the pound over the past 5 weeks
- Market review. Trading ideas. Q&A
- Trading plan for GBP/USD for February 21st, 2020
- GBP/USD: plan for the US session on February 21. The pound continues to break the stereotypes of fundamental analysis. The
- EUR/USD: plan for the US session on February 21. The bulls have problems with the level of 1.0820. Good data on PMI indices
- Trading plan for EUR/USD for February 21st, 2020
- The euro saw a ray of light
- Trading recommendations for EUR USD pair on February 21
- Analysis and forecast for EUR/GBP on February 21, 2020
- EUR/USD: Euro still far from being completely defeated
- Technical analysis of GBP/USD for February 21, 2020
- USD/CAD reversing below resistance
- USD/CAD – on its way upwards
- EUR/GBP approaching support, potential bounce!
- EUR/USD approaching support, potential bounce!
- Trader's Diary: EUR/USD on 02/21/2020, Coronavirus stops, but its consequences are yet to come
- Trading recommendations for GBP/USD pair - prospects for further movement
| Posted: 21 Feb 2020 07:37 AM PST Technical analysis
EUR/USD has been trading upwards, exactly what I predicted yesterday. EUR did reach our first upward target at the price of 1.0855 and its heading towards the second at 1.0887 and third at 1.0924. Main reason for this rally was breakout of the downward channel in combination with bullish divergence on MACD oscillator. I would still watch for buying but on the dips. Watch for eventual bull flag pattern on hourly of 4H time-frame to confirm further upside continuation. MACD oscillator is showing increased momentum on the upside. Resistance levels are set at the price of 1.855, 1.0887 and 1.0924 Major support level is set at 1.0777 The material has been provided by InstaForex Company - www.instaforex.com |
| February 21, 2020 : GBP/USD Intraday technical analysis and trade recommendations. Posted: 21 Feb 2020 07:30 AM PST
On December 13, the GBPUSD pair looked overpriced around the price levels of 1.3500 while exceeding the upper limit of the depicted bullish channel. On the period between December 18th - 23rd, bearish breakout below the depicted channel followed by temporary bearish closure below 1.3000 were demonstrated on the H4 chart. However, immediate bullish recovery (around 1.2900) brought the pair back above 1.3000. Bullish breakout above 1.3000 allowed the mentioned Intraday bullish pullback to pursue towards 1.3250 (the backside of the broken channel) where bearish rejection and a new wide-ranged movement channel were established between (1.3200-1.2980). Recently, new descending highs were demonstrated around 1.3200 and 1.3070. Recent Bearish breakdown below 1.2980 enhanced further bearish decline towards 1.2890 (the lower limit of the movement channe) where evident bullish rejection has been manifested on February 10. This week, temporary bullish breakout above 1.3000 has been expressed until Wednesday when another bearish decline below 1.3000 was expressed. As expected, the previous bearish decline below 1.2980 has lead the GBPUSD pair towards the lower limit of the channel @ 1.2870 -1.2850 where significant bullish recovery was recently demonstrated. The current bullish pullback will probably pursue towards the price zone of 1.2980-1.3000 where price action should be watched again. Intermediate-term technical outlook is supposed to remain bearish as long as the pair maintains its movement below 1.3000 (Supply-zone). On the other hand, bullish breakout above 1.3000 invalidates the bearish scenario for the intermediate-term. The material has been provided by InstaForex Company - www.instaforex.com |
| Posted: 21 Feb 2020 07:29 AM PST Technical analysis
Gold has been trading upwards. The price tested the level of $1.650. I projected Pitchfork warning lines 1 and 2 to find potential resistance for the gold. Warning line is set at the price of $1.651 and Warning line 2 at $1.680. I would watch for selling opportunities in case of the bearish divergence on the hourly or 4H time-frame or any topping pattern with the target at the price of $1.632. Anyway, in case of the bigger breakout of the $1.650, there is potential for test of WR2 at $1.680. MACD oscillator is showing increased momentum on the upside. Resistance levels are set at the price of $1.650 and $1.680. Support levels are set at the price of $1.632 and $1.611. The material has been provided by InstaForex Company - www.instaforex.com |
| Posted: 21 Feb 2020 07:17 AM PST Industry news:
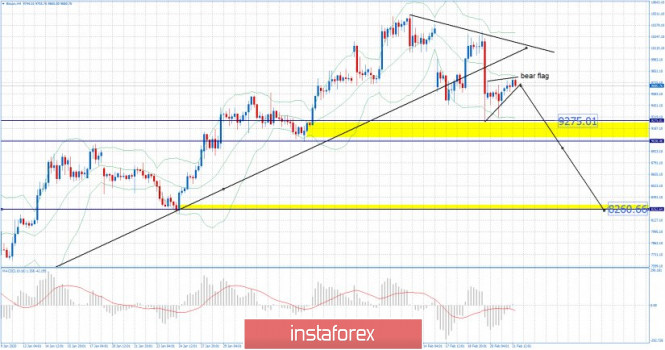
New Jersey lawmaker Yvonne Lopez is concerned. There is a lack of consumer protection in the crypto space and she wants to put that right by introducing new regulatory measures. New Jersey Assemblywoman Lopez is the prime sponsor of new legislation labeled the "Digital Asset and Blockchain Technology Act" (A-2891). In a release this Wednesday, Lopez explained that the bill has two main purposes. Primarily, it aims to protect consumers who "are not quite sure what [crypto] is." At the same time, it proposes to establish "licensure requirements" for virtual currency businesses operating in the State. Lopez maintains that she wants the crypto industry to grow in New Jersey. However, this can only happen in the right regulatory environment. Technical analysis BTC has been trading sideways at the price of $9.685. Due to the strong downside momentum in the background and the breakout of the support trend line, I do expect potential for further downside movement and eventual test of $9.725 and $8.260. I would watch for selling opportunities with the downward targets at the price of $9.275 and $8.260. MACD oscillator is showing neutral stance but the slow line is turned to the downside. Resistance levels are set at the price of $9.800 and $10.215. Support levels and downward targets are set at the price of $9.275 and $8.260. The material has been provided by InstaForex Company - www.instaforex.com |
| February 21, 2020 : EUR/USD Intraday technical analysis and trade recommendations. Posted: 21 Feb 2020 07:05 AM PST
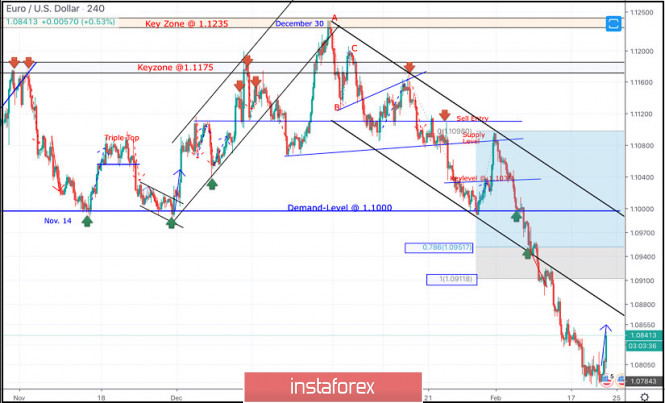
On December 30, a bearish ABC reversal pattern was initiated around 1.1235 (Previous Key-zone) just before another bearish movement could take place towards 1.1100 (In the meanwhile, the EURUSD pair was losing much of its bearish momentum). One more bullish pullback was executed towards 1.1175 where the depicted key-zone as well as the recently-broken uptrend were located. That's why, quick bearish decline was executed towards 1.1100 then 1.1035 which failed to provide enough bullish SUPPORT for the EURUSD pair. Further bearish decline took place towards 1.1000 where the pair looked quite oversold around the lower limit of the depicted bearish channel where significant bullish rejection was able to push the pair back towards the nearest SUPPLY levels around 1.1080-1.1100 (confluence of supply levels (including the upper limit of the channel). Since then, the pair has been down-trending within the depicted bearish channel until last week when bearish decline went further below 1.0950 and 1.0910 (Fibonacci Expansion levels 78.6% and 100%) establishing a new low around 1.0790. Currently, the EUR/USD pair looks quite oversold after such a long bearish decline and if bullish recovery is expressed above 1.0845-1.0860, further bullish advancement would be expected towards 1.0910 then 1.0950. Intraday traders were advised to look for signs of bullish recovery around the price levels of (1.0790) as a valid intraday BUY signal aiming towards 1.0910 (the nearest broken demand-level). Earlier today, recent signs of bullish recovery were manifested around 1.0790 leading to the ongoing bullish movement which will probably pursue as high as the price level of 1.0910. On the other hand, bearish persistence below 1.0790 may enable more bearish decline towards new historical lows around 1.0755 and even 1.0700. The material has been provided by InstaForex Company - www.instaforex.com |
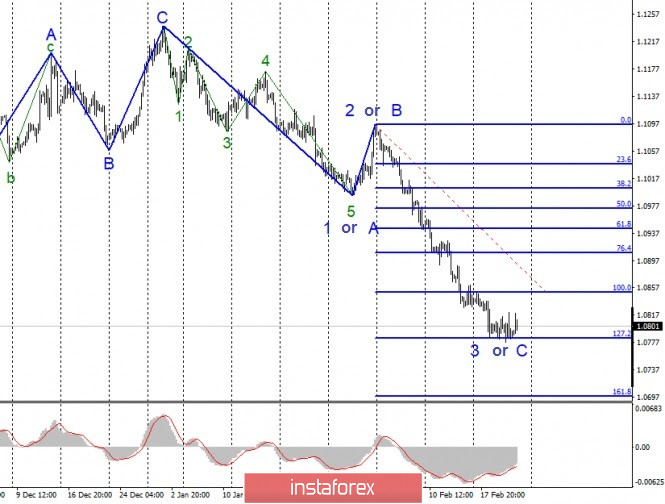
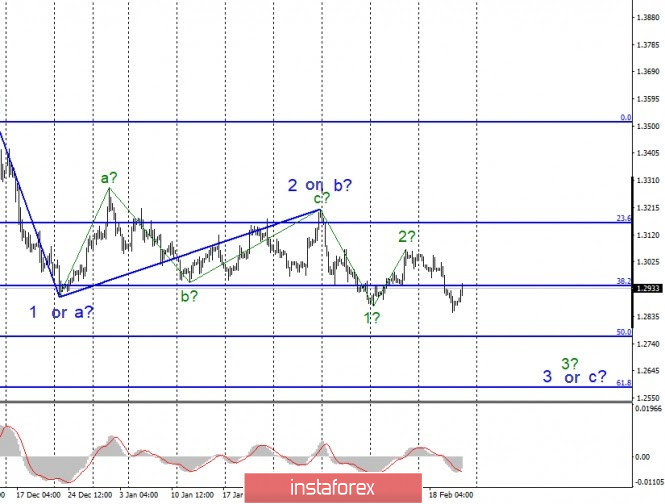
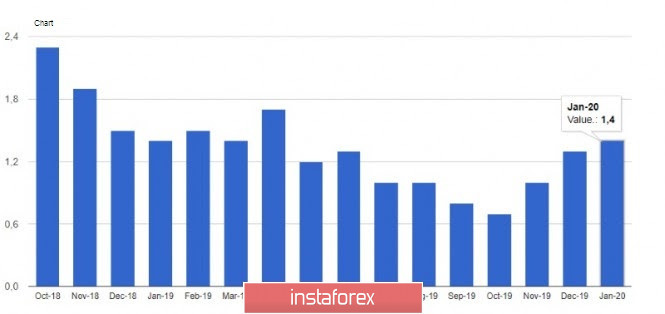
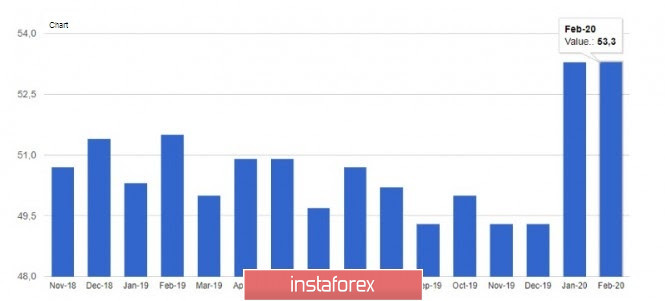
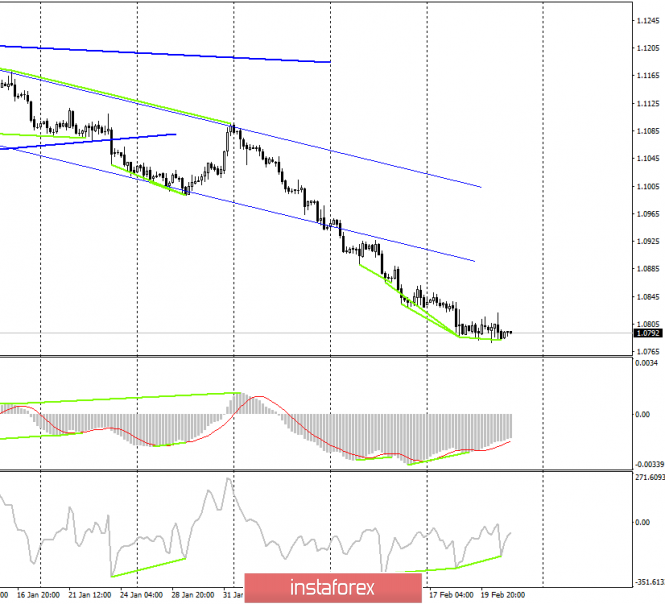
| Posted: 21 Feb 2020 06:53 AM PST EUR/USD On February 20, the EUR/USD pair lost 20 basis points and made an unsuccessful attempt to break the 127.2% Fibonacci level. Thus, it is still unclear whether the construction of the proposed wave 3 or C has been completed, or whether it will become even more complicated and continue its construction. Until a successful attempt to break the mark of 1.0784 is made, the working option will be to build a corrective ascending wave or even a set of waves. Fundamental component: The news background for the EUR/USD instrument was again absent on February 20. This is noticeable in the amplitude over the past day. The instrument's quotes are trading just above the 127.2% Fibonacci level and cannot determine whether to continue moving. Already today, on February 21, the chances of increased activity were much greater, however, several economic reports from the European Union did not attract the attention of the market. It should be noted that all the reports on Friday were somewhere in-between. Nevertheless, the markets could rejoice that business activity in Germany and the European Union in the services and production sectors showed a positive trend. Although it is possible to evaluate these indices in different ways. For example, business activity in the manufacturing sectors of Germany and the EU increased, however, it still remained below the key mark of 50. Thus, the decline in these areas persists despite the improvement in values. But the markets could not help but pay attention to the report on inflation in the European Union for January. The value of inflation coincided with expectations: +1.4% y/y and -1.0% m/m. And it is quite possible that this report did not allow the demand for the euro to increase today. After all, the value of +1.4% y/y is still a fairly low value, and -1.0% y/y is a reduction in inflation, which can not be regarded by the markets as a positive result. There are still indices of business activity in the US services and manufacturing sector, which are also unlikely to cause strong changes in the instrument's amplitude. We need stronger reports to make a successful attempt to break the 127.2% Fibonacci level. General conclusions and recommendations: The euro/dollar pair continues to build a downward set of waves. Based on the current wave markup, I recommend waiting for a successful attempt to break the 127.2% Fibonacci level for new sales with targets located near the mark of 1.0699, which corresponds to 161.8% Fibonacci. GBP/USD The GBP/USD pair lost about 40 basis points on February 20 and thus continued to build a downward section of the trend within the expected wave 3 in 3 or C. If this is true, the increase in the instrument's quotes today can be regarded as building an internal corrective wave 3 in 3 or C. Thus, after a small deviation of the quotes from the reached lows, I expect a resumption of the decline in the direction of the previously defined goals. Fundamental component: The news background for the GBP/USD instrument on Thursday was only in the report on retail sales in the UK, and it should be said that this report brought a small bit of optimism to the markets. Retail sales in January were slightly higher than what markets expected. However, this report clearly did not help the pound, as demand for it remained low throughout the past day and did not change in a big way. Reports on business activity in the UK have already been released today. In the services sector, activity fell to 53.3 points, while in the manufacturing sector - it rose to 51.9. Thus, there are chances for the recovery of the industrial sector, which in recent months has been actively reduced in volume. A strong index of business activity in manufacturing, which finally left the area of decline below the mark of 50, certainly boosted demand for the Briton on Friday. General conclusions and recommendations: The pound/dollar instrument continues to build a downward wave 3 or C. Thus, I recommend selling the instrument with targets located near the mark of 1.2767, which corresponds to 50.0% of Fibonacci on the new MACD signal "down", which will signal completion building corrective rising wave. The material has been provided by InstaForex Company - www.instaforex.com |
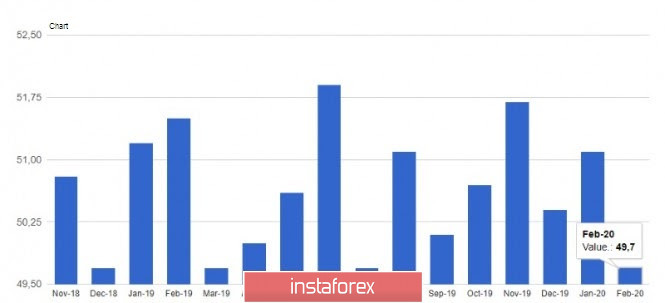
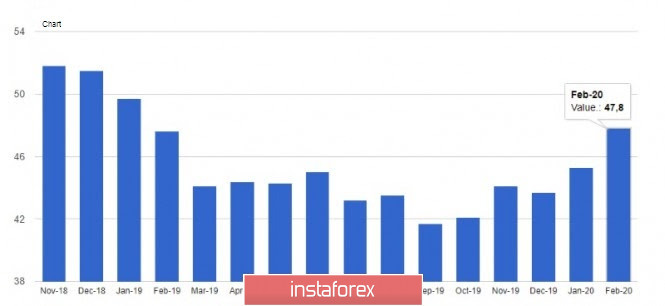
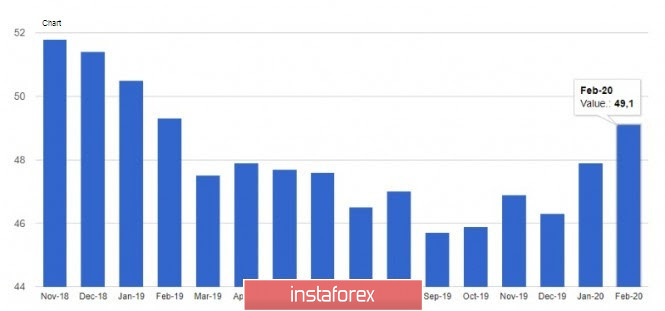
| Posted: 21 Feb 2020 06:19 AM PST The euro regained its position slightly against the US dollar, however, the growth was short-lived. After which the bears re-entered the game, gradually pushing the pair to the lows of the year. The growth occurred against the backdrop of mixed indicators for PMI activity indices, although it can already be noted that the spread of coronavirus to the euro area only slightly affected production activity, while the service sector showed good growth at all. Even if the data is preliminary, a positive trend in the indices will favorably affect the appetite for risky assets. According to Markit data, the preliminary purchasing managers' index (PMI) for the French manufacturing sector declined in February, dropping 50 points to 49.7 points, indicating a contraction in the sector. In January, the manufacturing PMI was 51.1 points. Economists had expected a decline to only 50.8 points. As for the service sector, there are no problems. In February, the index rose to 52.6 points against 51.0 points in January, with a forecast of 51.3 points. But in Germany, both indices performed well, given the negative statistics released recently. For investors and traders, the current indicators are a "breath of fresh air". According to the Markit report, the preliminary purchasing managers' index (PMI) for Germany's manufacturing sector rose to 47.8 points in February, compared with 45.3 points in January. Although the manufacturing sector continues to decline, as the index is below 50 points, the data please the traders. Economists had forecast the index falling to 44.8 points. The preliminary purchasing managers' index (PMI) for the German services sector fell slightly in February to 53.3 points, however, the activity continued to grow. In January, the index was 54.2 points and economists had expected a decline to 53.7 points. In the eurozone as a whole, a report published by IHS Markit indicated that the purchasing managers' index for the eurozone manufacturing sector rose to 49.1 points in February, almost reaching 50 against 47.9 points in January. The PMI for the services sector in February reached the level of 52.8 points. The data on inflation failed to please and completely coincided with the forecasts of economists, which did not affect the market since it has long been clear that additional measures from the European Central Bank or a minimum healthy growth of the economy are necessary for its growth. According to the report, the consumer price index (CPI) of the eurozone in January this year fell by 1.0% compared to December and increased by only 1.4% compared to the same period in 2019. The data fully matched economists' expectations. Core inflation, which does not take into account volatile categories, fell by 1.7% in January compared to December and increased by 1.1% year-on-year. The eurozone consumer price index excluding tobacco products fell by 1.0% in January and rose only 1.3%, far from the 2.0% target. As for the technical picture of the EURUSD pair, it remained unchanged. The bulls are protecting the level of 1.0785, however, there are no active purchases from major players. Most likely, a break of 1.0785 will return the downward trend to the trading instrument, which will lead to an update of the lows of 1.0740 and 1.0700. The bears' longer-term goal is a 2017 low around 1.0500. It will be possible to talk about building an upward correction only after the return of the level of 1.0820, which will ensure the growth of risky assets to the highs of 1.0860 and 1.0890. GBPUSD The pound decided to follow a logical scenario, and after the data on the composite index of UK supply managers for February of this year, it strengthened against the US dollar. The growth of the index is in addition to good indicators for the labor market, inflation and retail sales, which indicates a recovery in the economy at the beginning of this year. This once again confirms market participants' expectations that the Bank of England's monetary policy committee will not have to ease policy and lower interest rates at its next meeting in March. According to the report, the composite purchasing managers' index (PMI) in February this year remained at 53.3 points, and index values above 50 indicate an increase in the activity. The manufacturing PMI rose to 51.9 points in February from 50 points in January, while economists again expected it to fall to 49.7 points. The PMI for the services sector also remained above 50 points, falling only to 53.3 points from 53.9 points in January. In general, the technical picture for the pound is still on the side of sellers, but today's sharp response from buyers is still returning a positive mood to the market. Bulls need to close the week above the support of 1.2920, which will maintain the upward momentum. Even a breakdown of 1.2920 will not cause panic since it is quite possible that buyers will try to build a new border of the ascending price channel around the support of 1.2890. If we talk about sellers, they confidently formed the upper border of the downward channel from February 18, which still keeps the market on their side, but the fight promises to be tough. The material has been provided by InstaForex Company - www.instaforex.com |
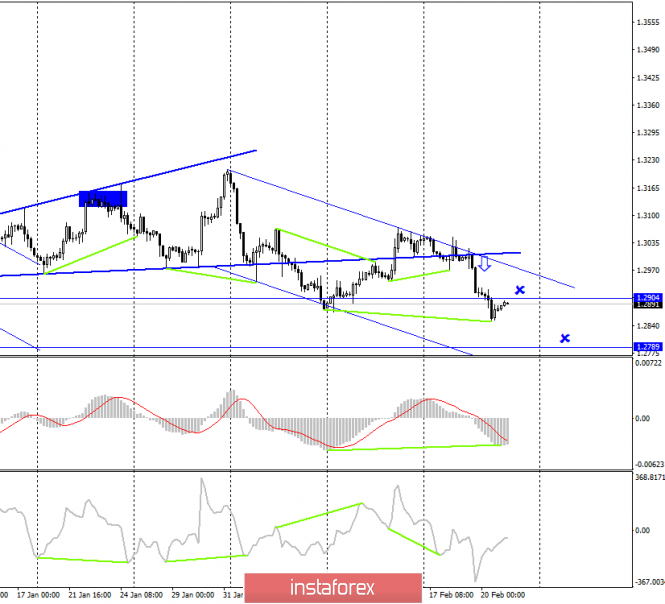
| EUR/USD. February 21. Analysis of COT reports for the euro over the last 5 weeks Posted: 21 Feb 2020 06:19 AM PST EUR/USD – 4H.
Hello, traders! Graphical analysis on the 4 charts warns of the approaching reversal of the pair in favor of the European currency. In this review, I suggest analyzing the report on Commitments of Traders to understand what is happening now in the market and what sentiments prevail among the major players.
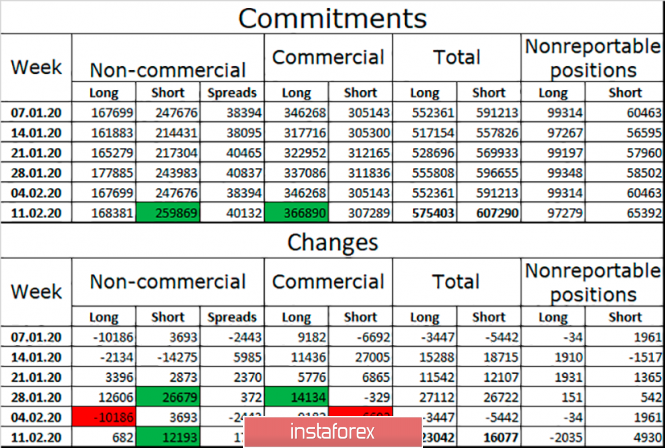
So, the first thing I would like to draw to your attention is the completely different moods in the non-commercial and commercial categories in the part of the changes table. Let me remind you that non-commercial is large market players who trade currency for a profit and commercial is a variety of companies that buy currency not for profit due to exchange rate differences. So, in the last three weeks before February 11, non-commercial actively increased short positions and reduced long positions. At the same time, the commercial category was increasing its long positions, getting rid of short positions. First, this means that sooner or later the non-commercial category will close positions to lock in profits. In contrast to the commercial category, which uses its futures and options for a particular currency to hedge against future strong price changes. It is the reset of short positions by the first category that will mean a reversal of the trend in favor of the euro. Let's also pay attention to the upper part of the table. Reflecting the total number of positions for different categories of players. In the last report dated February 11, the non-commercial category was dominated by short positions with a strong margin, while the commercial category was dominated by long positions. However, the total number of long positions was less than short: 575403 contracts against 607290. The gap in comparison with the previous month did not increase much, so the euro continued to fall at the usual pace. A new COT report for February 18 will be released today, which is likely to show a reduction in the total number of short positions. Terms: Non-commercial - major market players: banks, hedge funds, investment funds, private, and large investors. Commercial - commercial enterprises, firms, banks, corporations, companies that buy currency to ensure current activities or export-import operations. Non-reportable position - small traders who do not have a significant impact on the price. The material has been provided by InstaForex Company - www.instaforex.com |
| GBP/USD. February 21. Analysis of COT reports for the pound over the past 5 weeks Posted: 21 Feb 2020 05:41 AM PST GBP / USD - 4 H. Good afternoon, dear traders! Here's a graphical analysis of the GBP / USD currency pair speaks in favor of a restrained "bearish" mood. The downward trend range maintains good prospects for the decline of the British quotes; however, the pair often has corrections and pullbacks. Let's try to figure out what is happening with the Briton by reviewing COT reports over the past 5 weeks. The first thing that immediately catches your eye is the lack of a clear advantage of bulls or bears in the market. According to the latest report for February 11, the total number of open long and short positions was approximately equal: 199,222 contracts versus 203,764 contracts. Thus, based on these figures, we can conclude that the advantage is now minimal for bears, and it is for hedger bears, since the Non-commercial group is more in long-positions. But, having studied the Changes section, we clearly see that speculators in the last three weeks until February 11 practically did not change the ratio of long and short positions. The Commercial group has grown over 10,000 longs. Thus, in general, we can say that the advantage remains with sellers, but it is small, so for now we should not expect a strong drop in the pound. TERMS: Non-commercial - major market players: banks, hedge funds, investment funds, private, large investors. Commercial - commercial enterprises, firms, banks, corporations, companies that buy currency not for speculative profit, but for ensuring current activities or export-import operations. Non-reportable positions - small traders who do not have a significant impact on the price. The material has been provided by InstaForex Company - www.instaforex.com |
| Market review. Trading ideas. Q&A Posted: 21 Feb 2020 05:07 AM PST Trading recommendations: USDCAD - buy is to 1.33500 level. EURCHF - buy through opening limit orders below 1.06. The material has been provided by InstaForex Company - www.instaforex.com |
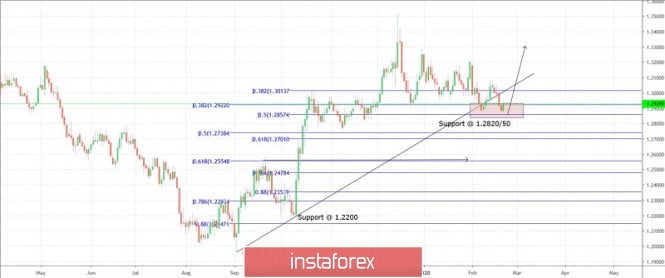
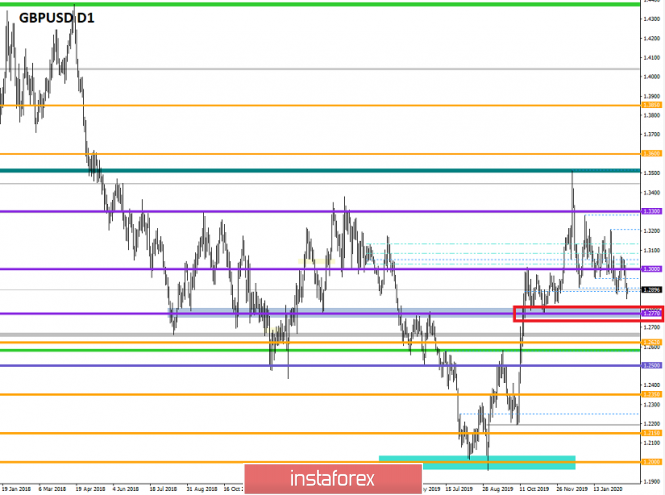
| Trading plan for GBP/USD for February 21st, 2020 Posted: 21 Feb 2020 04:55 AM PST
Technical outlook: The GBP/USD corrective drop might have finally found some support around the 1.2850 level. Please note that a minimum requirement for the correction to complete was a drop below the 1.2900 level. Also, 1.2850 was the termination point of the previous support as labeled here. Immediate resistance is seen at the 1.3072 level and a break higher can confirm that a meaningful low is at 1.2850. The rally between 1.1950 and 1.3515 is a boundary, which is being retraced at the moment. GBP/USD has found interim support around the Fibonacci 0.382 level. It is still highly possible that prices may continue dropping lower to 1.2750 and 1.2550 as well. At the same time, it is also possible that a shallow retracement is completed and the next leg of the rally can resume from here. We would either initiate long positions between the 1.2550 and 1.2750 levels or allow the price to break above 1.3072 and buy on dips from there. Trading plan: Remain flat for now. Buy lower. Good luck! The material has been provided by InstaForex Company - www.instaforex.com |
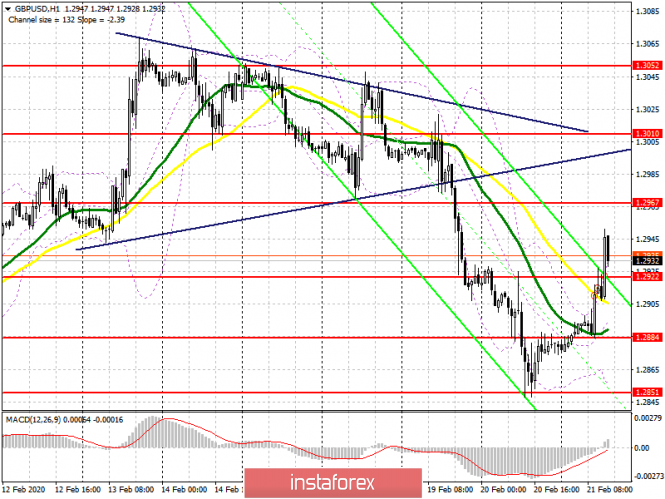
| Posted: 21 Feb 2020 04:54 AM PST To open long positions on GBPUSD, you need: If the British pound has been falling all week on the back of good fundamental data on the labor market and retail sales, then weak report on the services sector, on the contrary, returned buyers to the market. The breakthrough of the resistance of 1.2922, which I drew attention to in the morning review, allowed the bulls to build growth in the area of the resistance of 1.2967, which is now their first goal. Fixing above this level will lead to an update of the maximum of 1.3010, where I recommend fixing the profit. In the scenario of a decline in GBP/USD, the formation of a false breakdown at the support level of 1.2922 will signal the opening of new long positions, however, it is best to wait for the release of fundamental data on the American economy. In the event of a breakdown of the above support, I recommend considering new purchases of the pound only for a rebound from the minimum of 1.2884. To open short positions on GBPUSD, you need: The bears failed to push the pound below the support of 1.2884, and also failed to protect the resistance of 1.2922. The breakdown of which led to the demolition of a number of stop orders and a sharp rise in GBP/USD in the first half of the day. At the moment, the priority of sellers is the support of 1.2922, under which they need to return the pound. Only good data on manufacturing activity in the US will push GBP/USD below this range and allow the pair to return to the minimum of 1.2884, where I recommend fixing the profit. In the scenario of the pound growth, you can open short positions on a false breakdown from the maximum of 1.2967 or sell GBP/USD from the maximum of 1.3010. Signals of indicators: Moving averages Trading is conducted just above the 30 and 50 daily averages, which indicates another change in the direction of the market in the short term. Bollinger Bands If the pair declines, the average border of the indicator around 1.2895 will provide support.
Description of indicators
|
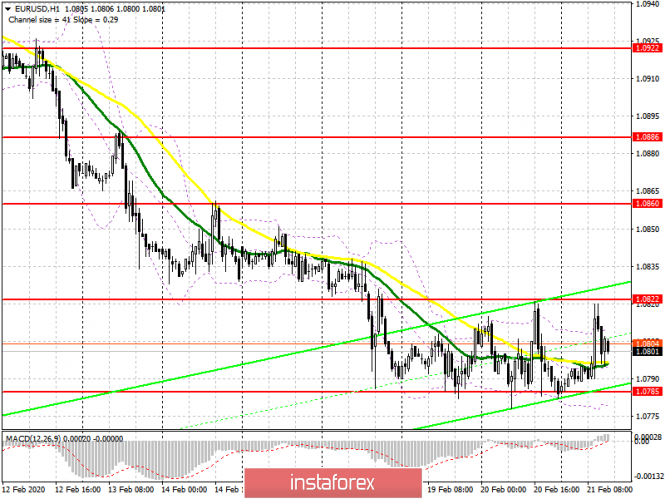
| Posted: 21 Feb 2020 04:53 AM PST To open long positions on EURUSD, you need: Buyers of the euro took advantage of the good data on the PMI indices, which rose for the services and manufacturing sectors. They maintained an important support level of 1.0785, however, they did not manage to get above the resistance of 1.0822. The task for the second half of the day remains the breakdown of the area of 1.0822, which will lead to an update of the highs of 1.0860 and 1.0886, where I recommend fixing the profits. However, everything will now depend on data on similar indices for the United States. Good indicators will again return the pressure on EUR/USD, which will lead to a repeat test of the minimum of 1.0785. If it breaks, I recommend that you postpone long positions on the euro until the test lows of 1.0765 and 1.0740. To open short positions on EURUSD, you need: The bears did not take long to wait and returned to the market after an unsuccessful attempt to break the resistance of 1.0822, which I paid attention to in my morning review. Apparently, the sellers are counting on good reports on the American economy, which are scheduled for the second half of the day. Only a break in the support of 1.0785 will drop EUR/USD in the area of the lows of 1.0765 and 1.0740, where I recommend fixing the profits. In the scenario of the pair's growth in the second half of the day, only the formation of a false breakdown in the area of 1.0822 will signal the opening of short positions in the euro. I recommend selling immediately for a rebound only after testing the maximum of 1.0860. Signals of indicators: Moving averages Trading is conducted in the area of 30 and 50 moving averages, which indicates market uncertainty in the short term. Bollinger Bands A break of the lower border of the indicator at 1.0780 will increase the pressure on the euro.
Description of indicators
|
| Trading plan for EUR/USD for February 21st, 2020 Posted: 21 Feb 2020 04:35 AM PST
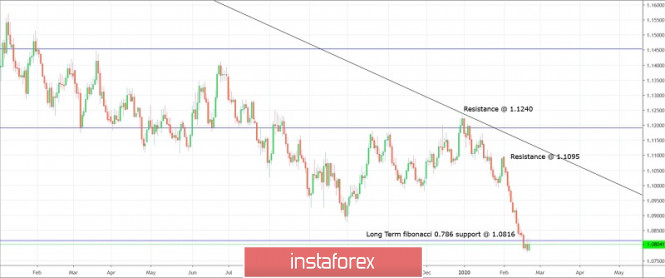
Technical outlook: EUR/USD has been giving in to bears for the last 13 trading sessions from February 3rd, 2020. The entire drop from 1.1240 through 1.0780 can be the last leg within the ending diagonal structure on a larger time frame. Please note that prices found support at the Fibonacci 0.786 retracement of the previous rally between 1.0340 and 1.2555. A bullish reversal day can confirm that the drop is certainly completed and that the EUR/USD bulls are expected to remain in control. Please note that the drop from the 1.1095 level was very sharp. Hence, the recovery can also be the same since there is no resistance in the charts until the 1.1095 level. It is recommended to remain flat for now and wait for a bullish reversal signal in the daily chart before initiating long positions again. A potential engulfing bullish candlestick pattern is in progress. A day close above 1.0803 can confirm that. Trading plan: Remain flat for now. Wait for a bullish pattern to initiate long positions. Good luck! The material has been provided by InstaForex Company - www.instaforex.com |
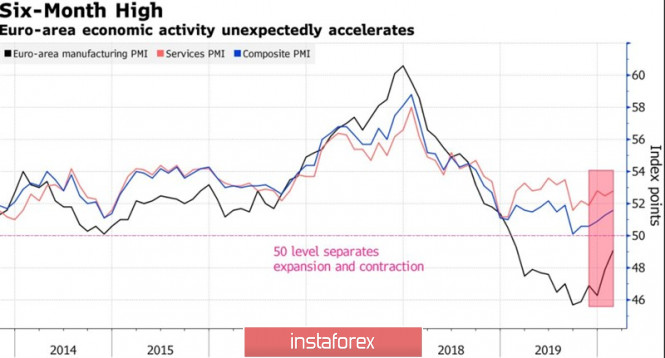
| Posted: 21 Feb 2020 04:35 AM PST Optimistic statements by ECB Vice-President Luis de Guindos noted that a strong labor market and low interest rates can support economic growth in the eurozone. The acceleration of European business activity from 51.3 to 51.6 in February became a kind of ray of light in the dark realm for fans of the euro and allowed EUR/USD to the base of the 8th figure. However, there are few reasons for the development of a full-fledged correction for the single European currency. The release of data on German and European PMI rightfully claimed to be the key event of the week. The minutes of the January meetings of the Fed and the ECB failed to shake the confidence of the "bears" in the main currency pair. The Fed exuded optimism about the bright future of the US economy. The European Central Bank expressed doubt that a cease-fire in the trade war between Washington and Beijing will be able to lift the eurozone economy from its knees. In the end, most tariffs remain in effect, which negatively affects both international trade and global GDP. Data on the business activity should show how the eurozone economy has adapted to the pernicious influence of the coronavirus. And at first glance, the rise of the German purchasing managers' index in the manufacturing sector to an annual high indicates that not everything is as bad as it is commonly believed. Nevertheless, you need to understand that companies are trying to act ahead of the curve. They may well have increased new orders because of concerns about the epidemic. If so, the PMI may start to fall in March. Dynamics of European business activity
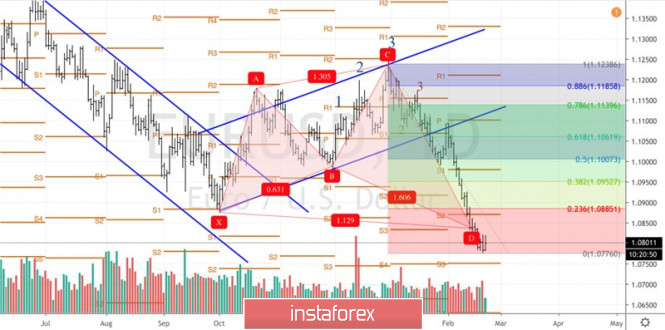
The "bulls" on EUR/USD really want to hope that the European economic sentiment index and the German business climate index from IFO will be the key events of the week by February 28. Nevertheless, we must understand that the euro's weakness is structural. The export-oriented economy of the eurozone looks weak due to a decrease in external demand, the index of economic surprises is falling, and the euro is actively sold as a funding currency in the context of high global risk appetite. The latter is evidenced by historic highs in the US and European stock indices. The collapse of EUR/USD was the result of dashed hopes for the pair's growth at the end of 2020. As a result, many banks and investment companies are forced to make quick adjustments to their "bullish" forecasts. Societe Generale expects to see the euro at best at $1.16 by December. ABN Amro, JPMorgan Chase, Standard Chartered and Wells Fargo are among the companies that admitted their mistakes. Technically, if the "bulls" on EUR/USD manages to catch on to the important level of 1.08, where the target for 113% is located on the "shark" pattern, they will have the opportunity to develop a correction to 23.6%, 38.2% and 50% of the CD wave as part of the transformation of the "shark" into 5-0. EUR/USD, the daily chart
|
| Trading recommendations for EUR USD pair on February 21 Posted: 21 Feb 2020 04:26 AM PST From a comprehensive analysis, we see a flat with variable boundaries of 1.0782/1.0820. Now, about the details. The downward movement that was set at the beginning of the year managed to lower the rate of the single currency by more than 440 points. Moreover, since the beginning of February, the movement has been inertial at all. Such vivid stability leads to overheating of short positions and the lack of proper corrections can disrupt that stability. The market is emerging from this difficult situation with the help of accumulations and variable flat, where a horizontal movement of 60 hours is currently observed, which is not a small fluctuation in terms of time weight. Regarding the theory of downward development, we see a kind of synchronicity, where a fellow GBP/USD market has a similar development in itself with one exception - that it is just beginning the recovery process. While on the EURUSD pair, we are already storming the psychological ranges. It turns out that we have a positive correlation and there is a chance of an additional incentive when trading moves interact. Regarding the development of the euro/dollar pair, we are faced with a 50% range level 1.0700//1.0775//1.0850 and the existing flat was formed near it. The main focal point remains the level of 1.0700 and only its breakdown would give a further turn to the new psychological range. To better understand the psychological ranges, I advise you to analyze the period of 2015-2017. In terms of volatility, we see that the activity of the previous day increased by 48% compared to the day before, which we expected due to the regularity - a sharp slowdown (29 points) -> acceleration (43 points). Analyzing the past day by the minute, we see a V-shaped formation (15:15-18:15 time on the trading terminal) inside the flat movement of 1.0782/1.0820. The subsequent fluctuation was in terms of price concentration near the lower end of the range. As discussed in the previous review, the majority of traders are working on the downside, which corresponds to the general background of the market, as well as the characteristic FOMO syndrome (lost profit syndrome). Looking at the trading chart in general terms (the daily period), we see a significant downward movement that develops in the area of April 2017. We have about 460 points left to the 17-year low, which does not seem such a long distance but the psychological pressure is enormous. The news background of the previous day included data on applications for unemployment benefits in the United States, where the total increase was 25,000: Primary +4,000; Repeated +21,000. The market reaction to the negative data on the US was in terms of a local weakening of the dollar, and then within the flat. The US currency has remained on the horseback, although the overheating of short positions is significant. In terms of the general information background, we have the start of an emergency EU summit, where the burning issue of the seven-year EU budget was discussed. The first day ended with literally nothing, as everyone was faced with a disagreement – who and how much would contribute to the community treasury? Members of the European Union can be understood since they lost a lot in the face of the United Kingdom, which gave more than 11 billion euros a year to the budget. And now, a hole in the seven-year budget is the size of a small country. As we understand it, Germany is not ready to cover all costs and is trying to shift responsibility to all members of the community. Thus, there are conflicts of interest. This is the end of the first day of the summit. Everything will continue on Friday but there will be no results. Details: The budget for 2021-2027 assumes funding at the level of €1.087 trillion for the entire seven-year period at constant prices in 2018. The total payments of all countries to the EU budget for the final seven-year period 2014-2020 were planned at the level of €908.4 billion in constant prices in 2011. Today, in terms of the economic calendar, we had data on inflation in Europe, where there was an increase from 1.3% to 1.4%. An hour before the publication of inflation data, preliminary PMI figures were released, which were slightly better than forecasts. There was an increase in the PMI data and inflation expectations, then a descent on the coincidences of the inflation expectations. In the second half of the day, similar PMI data will be released. However, in the United States, nothing positive is expected but if you refer to the fact that the dollar is now ignoring bad data, then there is a chance of holding positions. The upcoming trading week in terms of the economic calendar is quite measured and the only day that may interest us is Thursday, where we are waiting for a package of statistics on the United States. The most interesting events displayed below: On Wednesday, February 26 USA 16:00 London time - new home sales (Jan): Prev -0.4% -> Forecast 1.5% On Thursday, February 27 USA 14:30 London time - basic orders for durable goods USA 14:30 London time - applications for unemployment benefits USA 14:30 London time - preliminary GDP data: Prev. 2.1% Further development Analyzing the current trading chart, we see the movement in the same range as the day before. This is another signal that downward interest is now a priority. If market participants turn a blind eye to such a significant overheating of short positions, reflecting all this in a sideways course, then trading operations can be regrouped. I believe that the FOMO syndrome played an integral role here and it persists in the market, which may lead to a further descent towards the middle level (1.0775) and the main (1.0700). Detailing the available period every minute, we see that the beginning of the European trading session was expressed as an upward movement due to the publication of statistical data. The subsequent oscillation was already in the plan of the reverse course, just at the moment of approaching the upper limit of the range. In terms of the emotional mood of market participants, we see the high speculative interest that came with FOMO. In turn, traders still consider the downward trend as the main prospect but it is worth considering that traders use the optimal risk for transactions. Thus, they are not afraid of a flat and technical correction. It is likely to assume that the fluctuation within the flat 1.0782/1.0820 will persist, where you can build work on the method of breaking the frames with the entrance to the impulse candle. If you are already trading for sale, then your path is directed towards the border of 1.0700 with a top-up below 1.0775. Local buy operations are considered in case of a technical correction. However, you need a reason and fix the price higher than 1.0820 with the output of a pulse candle. Based on the above information, we will output trading recommendations: - Buy positions will be considered if the price is fixed higher than 1.0820, with the prospect of a move to 1.0850, a local transaction. - Positions for sale are already held by medium-term traders. Intraday traders are waiting for a break of the mark of 1.0775, with a characteristic impulse. Indicator analysis Analyzing different sectors of timeframes (TF), we see that the indicators of technical instruments signal a multidirectional slip. Volatility for the week / Volatility Measurement: Month; Quarter; Year. The volatility measurement reflects the average daily fluctuation from the calculation for the Month / Quarter / Year. (February 21 was based on the time of publication of the article) The volatility of the current time is 36 points, which is not bad in terms of dynamics for this period. It is likely to assume that volatility may still locally accelerate within the range but the main turn will come after the breakdown of the boundaries. Key levels Resistance zones: 1.0850**; 1.0850**; 1.0879*; 1.0900/1,0950**;1.1000***; 1.1080**; 1.1180; 1.1300**; 1.1450; 1.1550; 1.1650*; 1.1720**; 1.1850**; 1.2100. Support zones: 1.0775*; 1.0700; 1.0500***; 1.0350**; 1.0000***. * Periodic level ** Range level *** Psychological level ***** The article is based on the principle of conducting a transaction, with daily adjustments. The material has been provided by InstaForex Company - www.instaforex.com |
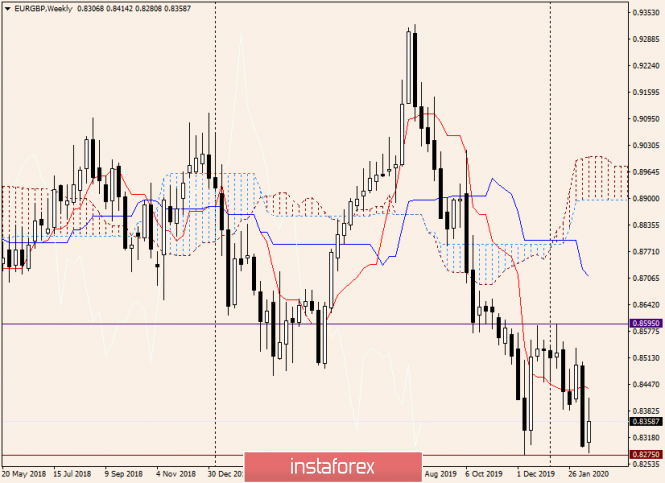
| Analysis and forecast for EUR/GBP on February 21, 2020 Posted: 21 Feb 2020 02:28 AM PST Hello! Perhaps the main driver that affects the price dynamics of the euro/pound pair's rate is still Brexit. More specifically, this is a deal on a trade agreement between the UK and the EU. Optimism after the victory of the Conservative is fading. We can assume that this event has already been played by the market. As for the monetary policy of the Bank of England, many market participants expect that this year the British Central Bank will go to the easing of monetary policy and reduce the main interest rate. Some speculate that this will happen at the meeting of the Bank of England in May. Such assumptions, along with sluggish economic growth in the UK, are not in favor of the pound and paired with the euro in particular. Let's look at the price charts of this interesting pair's rate. As a rule, you can get a lot of information from them and understand the prospects for the further direction of a particular tool. Weekly
The range in which the euro/pound has been trading for a long time can be designated as 0.8275-0.8595. In this regard, it is logical to assume that the exit from this range will indicate the direction of the price movement of EUR/GBP in the medium term. Last week, the cross declined significantly. Moreover, on the current five-day trading week, the euro/pound shows the growth that can be estimated as quite restrained. The pair met strong resistance near 0.8400, then rebounded. At the time of writing, it is trading near 0.8370. If you look closely, this week opened higher than the previous one ended. At the moment, the current candle can be characterized as "Harami" since it is located inside the body of the previous large black candle. If everything remains approximately the same, then the reversal candlestick pattern at the lower end of the range can be perceived as a signal to buy. If the Tenkan line of the Ichimoku indicator is passed, the bullish sentiment for this cross-rate will increase, and the next targets will be the psychological level of 0.8500 and the mark of 0.8530. I would like to pay special attention to the resistance of sellers - 0.8595. If the pair can rise to this level, we will most likely see it break through and consolidate above 0.8600. In this case, the market for EUR/GBP can be considered bullish and wait for the continuation of growth, the goals of which will be 0.8700, 0.8800 and 0.8840. The cross may reach a very important level of 0.8900, where you can expect a reversal for a correction or a change in the trend. Daily
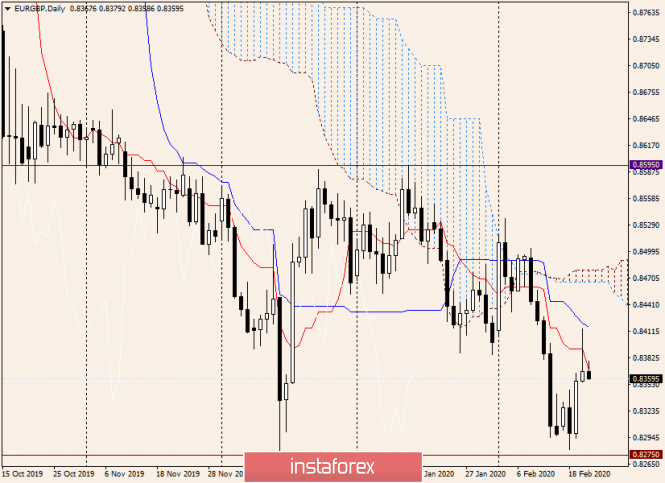
In this timeframe, the picture is twofold. After a good growth on February 19, yesterday we could hope for a continuation of the rise. However, after rising to 0.8414, the pair began to lose upward momentum, and as a result, a candle with a huge upper shadow and a small bullish body was formed. Such a model can be classified as a "Tombstone", and if it appeared at the end of the upward movement, it would be a good signal for opening sales. As you can see, the Tenkan and Kijun lines of the Ichimoku indicator also affected the price movement, providing resistance to the quote. From my point of view, only fixing above 0.8416, where Kijun is located, will give a signal to continue rising to 0.8465, where the border of the Ichimoku cloud passes. The longer-term goals for possible growth have already been mentioned above when describing the weekly timeframe. If we talk about the downward scenario and the goals at the bottom, these are 0.8356, 0.8295 and 0.8275. A breakdown of the last level and consolidation below will clearly indicate bearish sentiment at the euro/pound cross rate. In my personal opinion, at the moment, the pair has a better chance of strengthening. However, this will only happen if the bulls on the instrument manage to gain a foothold above 0.8416. Good luck! The material has been provided by InstaForex Company - www.instaforex.com |
| EUR/USD: Euro still far from being completely defeated Posted: 21 Feb 2020 02:20 AM PST
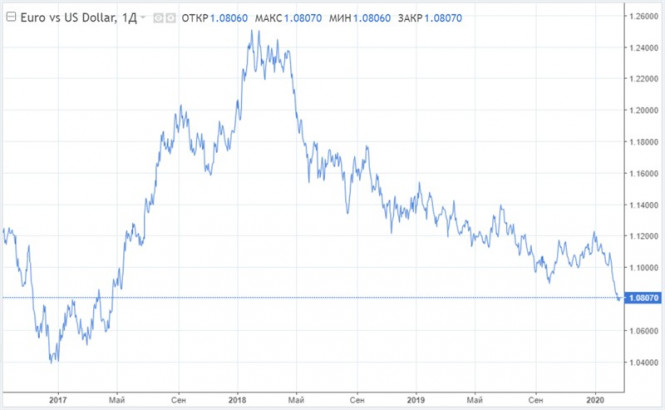
What happens on Forex in February is nothing but the surrender of the greenback's main competitors. The EUR / USD pair fell to a 3-year bottom, the yen against the US dollar sank to a 2.5-year low, and GBP / USD fell below the base of the 29th figure. The dollar bulls made a real feast, and technical analysts for USD are looking forward to the formation of a "golden cross" - the intersection of 50 and 200-day moving averages. This figure rose 13 times in the 21st century and signaled the strengthening of the American currency by an average of 2.5% over the next 40 days. However, the strength of the dollar is only the other side of the coin. The decline in EUR / USD would not have been so swift if not for the weakness of the single European currency. Judging by the protocol from the ECB Governing Council meeting in January, the regulator believes that even a ceasefire in the Washington and Beijing trade war will have a negative impact on the eurozone economy since most of the trade tariffs introduced by the parties remain valid. Although production activity in the region has improved, it is still at a level that signals a decline. But the meeting of the Governing Council of the ECB took place at the end of January when investors were not so worried about the impact of coronavirus on the world economy as it is now.
The European Central Bank notes that domestic demand is the main driving force for the GDP of the foreign exchange bloc, however, the decline in German consumer sentiment from GFK in March indicates that a reduction or cessation of production in China could lead to a complete stop in Germany, which will negatively affect the labor market countries and domestic demand. The euro is getting cheaper not only against the US dollar but also against other competitors. It particularly lost about 2.7% of its value to the renminbi, and 2.2% to the franc. As a result, the trade-weighted exchange rate of the single European currency fell to the lowest level since April 2017. If only the ECB had managed to respond a little sooner to the criticism of the head of the White House, Donald Trump, about the competitive devaluation that the overly strong dollar is to blame. Hence, now it is becoming obvious that the weakness of the bulls is another reason for the peak of the main currency pair. The situation for the euro is aggravated by the fact that there is practically nowhere to wait for help from it. The ECB's monetary policy is already super soft, while fiscal stimulus cannot be counted on. After the UK's separation from the EU, a hole of € 75 billion was formed in the alliance's budget, and the region's finance ministers do not yet know how to patch it. The rich countries in the bloc do not want to pay more, while the poor do not want to suffer losses due to the reduction of agricultural simulation programs. In general, this is a dead-end that does not bode well for the euro and strengthens the position of the Eurosceptics. According to some experts, even despite the worst start since 2015, it is too early to call the fall of the euro a defeat. They expect greater weakness of the single European currency. This is because the factors that pushed the euro to a 34-month low against the US dollar, such as carry trade, remain unchanged.
According to analysts, even when the fears associated with the outbreak of coronavirus have subsided and the full economic impact of the epidemic on China will be taken into account in quotes, the euro can still feel the consequences of the desire for profitability and attractiveness of the dollar. "The problem with the long position in the euro is that you need it to work a little for you before you start making money. Due to the negative carry, I am quite sure that there is no catalyst for an immediate EUR / USD reversal, "said Kieran Curtis of Aberdeen Asset Management. Negative rates by the ECB and the regulator's purchase of corporate bonds in the domestic market are forcing European investors to seek positive returns either through euro-denominated bonds issued by emerging market borrowers or in dollar assets. Since the difference in yield between US and German government bonds is almost 2%, this demand is unlikely to disappear soon. "When you hedge your risks in euros using, say, a three-month rate, the other side will pay you. As soon as you add this profitability, you will get a higher total profitability in dollars, minus the cost of hedging," Curtis noted. And this dynamics is unlikely to change since the difference in the monetary rate of the American and European Central Banks seem to have fixed for a long time - for the next twelve months. According to the rates of traders, none of the regulators will be able to increase interest rates. "Since the Fed has a significant easing of monetary policy, the dollar should retain a percentage advantage over the euro," said Petr Krpata, an ING analyst. "Given that the threat of the spread of coronavirus is still high, the full impact of the epidemic on the Chinese economy is not taken into account in quotes. From both a fundamental and a technical point of view, the euro may expect a weakening. It is still vulnerable, "said Anders Faergemann of Pinebridge Investments. The material has been provided by InstaForex Company - www.instaforex.com |
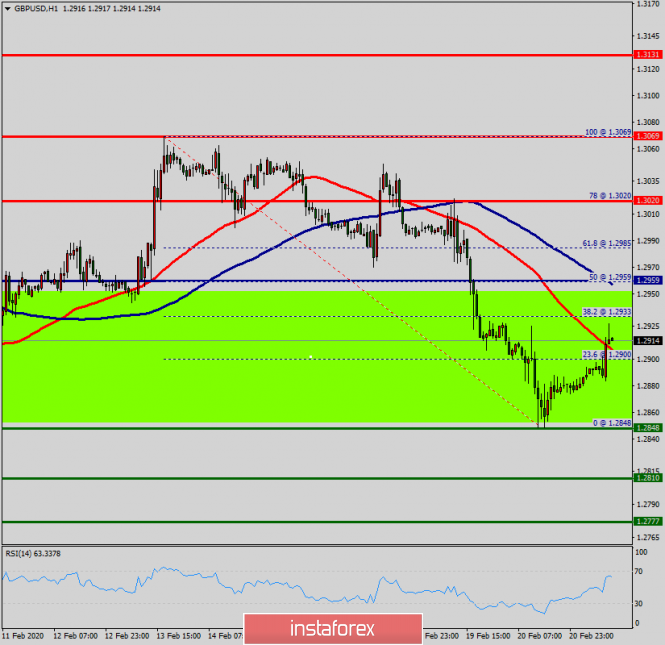
| Technical analysis of GBP/USD for February 21, 2020 Posted: 21 Feb 2020 02:15 AM PST Overview: Pivot : 1.2959. The GBP/USD pair faces resistance at 1.2959, while strong resistance is seen at 1.3020. Support is found at 1.2848 and 1.2810 levels. The GBP/USD pair continues to move downwards from 1.2959 level. The pair could fall from 1.2959 level to the first support around 1.2848. In consequence, if the GBP/USD pair will break support at 1.2848, this level will turn into resistance (1.2959) today. In the H1 time frame, the 1.2959 level is expected to act as minor resistance. Hence, we expect the GBP/USD pair to continue moving in the bearish trend from 1.2959 level towards the target at 1.2848. In the long term, if the pair succeeds in passing through 1.2848 level , the market will indicate the bearish opportunity below 1.2848 level in order to reach the second target at 1.2810. However, the 1.2810 mark remains a significant support zone. Thus, the trend will probably rebound again from 1.2810 level as long as this level is not breached. in overall, we still prefer the bearish scenario below the area of 1.2959. The material has been provided by InstaForex Company - www.instaforex.com |
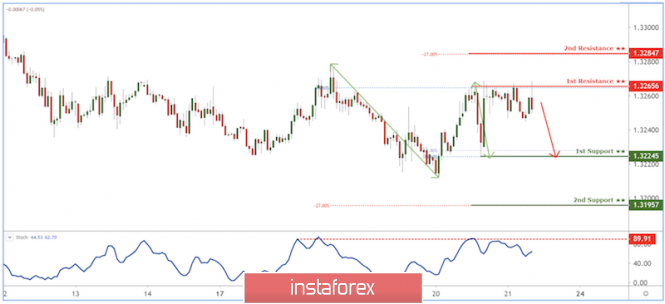
| USD/CAD reversing below resistance Posted: 21 Feb 2020 01:31 AM PST
Trading Recommendation Entry: 1.32656 Reason for Entry: 78.6% Fibonacci retracement, Horizontal swing high Take Profit : 1.32245 Reason for Take Profit: 78.6% Fibonacci retracement, 61.8% Fibonacci extension Stop Loss: 1.32847 Reason for Stop loss: -27.2% Fibonacci retracement The material has been provided by InstaForex Company - www.instaforex.com |
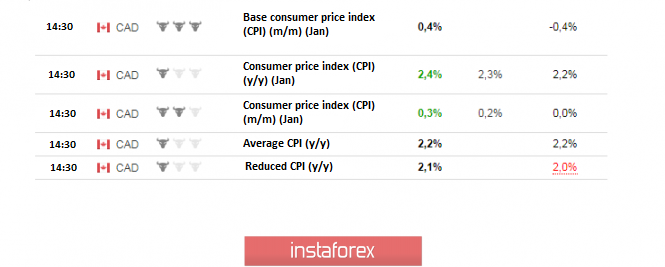
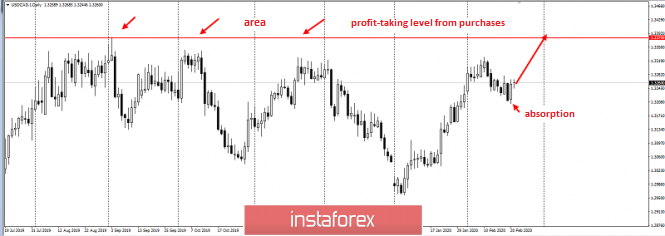
| Posted: 21 Feb 2020 01:29 AM PST Good day, dear traders! I present to your attention, a trading idea for the USD/CAD pair. The US dollar is strengthening against all currency pairs, winning over majors such as EUR/USD, GBP/USD, and AUD/USD. The fall against the dollar is almost vertical, as not everyone can jump into such movements. However, there is a pair that remains relatively calm - the USD/CAD pair. On Wednesday, good data on inflation was released, so the loonie was positive, even against the background of the strong dollar. As you can see, a buy signal was formed yesterday, as part of the Price Action strategy: Once again, the pair is growing for the second month. And, against the background of a very strong annual stop level of sellers in the area of 1.3500, the pair looks very attractive for medium-term purchases. From the current prices, although the risk/profit ratio is 1 to 2, the breakdown itself can be volatile. On the other hand, if you focus on the closing of daily candles, the ratio can be 1 to 3, which is generally not bad, given the crisis that we are facing at the moment. Good luck in trading and control your risks! The material has been provided by InstaForex Company - www.instaforex.com |
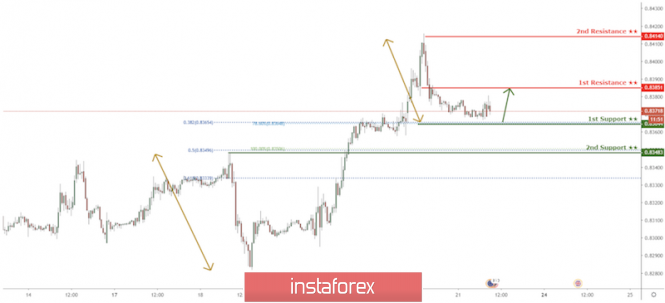
| EUR/GBP approaching support, potential bounce! Posted: 21 Feb 2020 01:27 AM PST
Trading Recommendation Entry:0.8364 Reason for Entry: Horizontal overlap support.78.6% Fibo extension Take Profit : 0.83851 Reason for Take Profit: Horizontal pullback resistance Stop Loss:0.8348 Reason for Stop loss: Horizontal pullback support The material has been provided by InstaForex Company - www.instaforex.com |
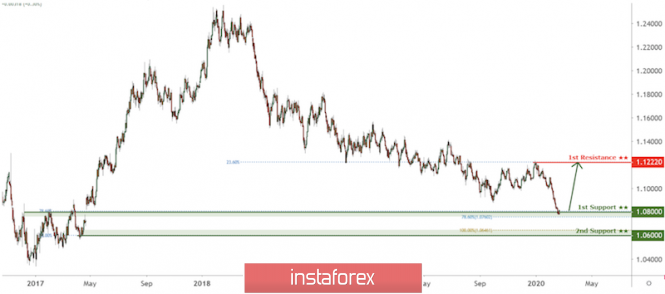
| EUR/USD approaching support, potential bounce! Posted: 21 Feb 2020 01:26 AM PST
Trading Recommendation Entry: 1.08000 Reason for Entry: 78.6 % Fibonacci extension, 78.6% fibonacci retracement, Horizontal pullback support Take Profit : 1.12220 Reason for Take Profit: 23.6% Fibonacci retracement, Horizontal swing high resistance Stop Loss: 1.06000 Reason for Stop loss: Horizontal swing low support, 88% Fibonacci retracement, 100% Fibonacci extension The material has been provided by InstaForex Company - www.instaforex.com |
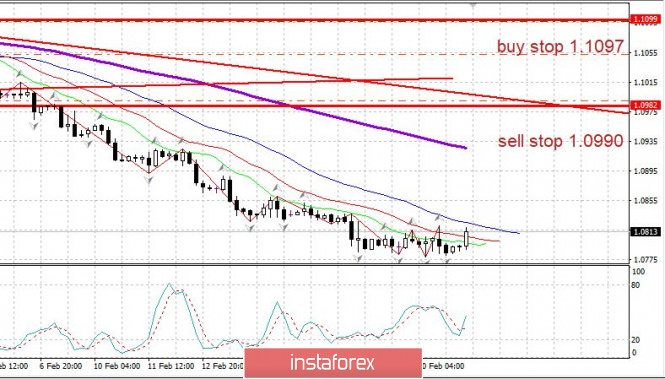
| Trader's Diary: EUR/USD on 02/21/2020, Coronavirus stops, but its consequences are yet to come Posted: 21 Feb 2020 01:17 AM PST
A simple picture to understand: Car sales in China fell by a whopping 92% in the first half of February due to the coronavirus epidemic. Given the role of China as the second largest economy in the world, one can assess the danger to the global economy. Germany: Amid the epidemic in China, industrial orders fell sharply, and industry forecasts were negative. The fall of the euro is associated with risks for German exports. EURUSD: We look forward to a new fall. We keep euro sales from 1.0990 and sell from upward bounces, starting at 1.0860 or higher. The material has been provided by InstaForex Company - www.instaforex.com |
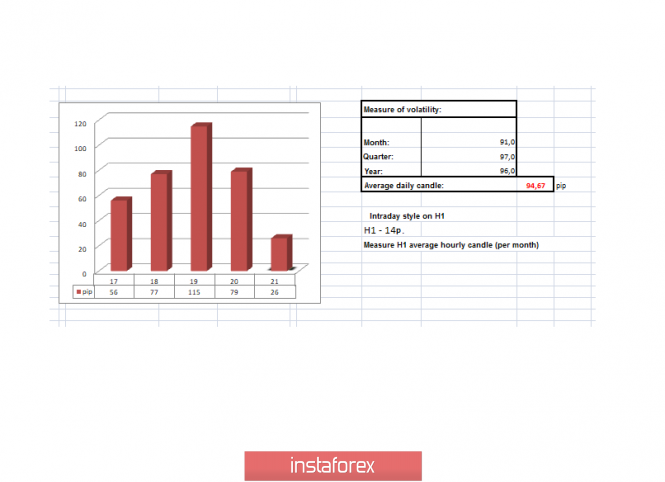
| Trading recommendations for GBP/USD pair - prospects for further movement Posted: 21 Feb 2020 01:10 AM PST From the point of view of a comprehensive analysis, we see an update of the lows of the current year with local slippage towards 1.2848, and now let's talk about the details. The assumptions regarding the downward move come true, the quote resumed the initial move after a short correction, where it declined at least on February 10, and after it the average level of the range 1.2770 // 1.2885// 1,3000. In fact, we have confirmation from sellers who are increasingly considering short positions and the prospect of a more significant decline. There was an overheating of short positions at the moment of the pulse code of the past day, I doubt it, since the activity was within the acceptable range, wherein the correction was 100% developed. Thus, the foundation of February 10, paired with the level of 1.2885, is no longer such dangerous coordinates for sellers, where only a regrouping of trading forces is needed to resume the downward move. Regarding the theory of the development of the downward move, we see that the next price fixation below the average level of 1.2885 gives a round of judgments regarding the speediest move to the main coordinate 1.2770. In fact, the level of 1.2770 is the key in terms of the development of the theory, since a change in the clock component has already occurred, but the restoration of the downward movement relative to the medium-term trend has not yet arrived. Thus, fixing the price lower than 1.2770 will give the first round of judgments about the restoration, which will lead to an even more significant reduction in the pound. In terms of volatility, we see a regularity of several weeks, where the activity of a currency pair systematically tends to the values of 70-80 points. It is worth considering that it is possible to maintain stability even with activity below the average daily market. Details of volatility: Thursday - 79 points; Friday - 79 points; Monday - 74 points; Tuesday - 74 points; Wednesday - 44 points; Thursday - 125 points; Friday - 62 points; Monday - 56 points; Tuesday - 77 points; Wednesday - 115 points; Thursday - 79 points. The average daily indicator, relative to the dynamics of volatility is 94 points [see table of volatility at the end of the article]. Detailing minute by minute, we see that the main surge of activity occurred in the period 8:30–12:30 [UTC+00 time at the trading terminal], where downward interest prevailed. The subsequent fluctuation was in terms of partial recovery, with stagnation in the form of accumulation. As discussed in the previous review, medium-term and intraday traders are working on the decline, which is currently the most relevant. Considering the trading chart in general terms [the daily period], we see that the change in the clock component moved into the movement within the range 1.2770 // 1.2885 // 1.3000, where a breakdown of the level of 1.2770 could give the prospect of a move in side 1.2620 --1.2500 --- 1.2350. The news background of the previous day contained data on retail sales in the United Kingdom, where the slowdown was from 0.9% to 0.8% with a forecast of 0.7%. After that, the data on applications for unemployment benefits in the United States was released, where the total growth was 25 thousand: Primary +4 thousand.; Repeated +21 thousand. The market reaction was surprisingly calm, where the pound did not receive support from statistics, which led to a further decline. In terms of the general informational background, we see that the degree of the upcoming negotiations between England and Brussels is growing, and the first official meetings will begin with proposals literally in a few weeks, where we will probably encounter disagreements that will stir up the mood of investors and, as a fact, the market. Today, in terms of the economic calendar, we have preliminary data on the PMI of Britain, where in the manufacturing sector a decrease is expected from 50 to 49.7, and in the services sector a decrease from 53.9 to 53.4. In the afternoon, similar PMI data will be released for the United States, but they also do not expect anything positive. The upcoming trading week in terms of the economic calendar is quite measured, the only day that may interest us is Thursday, where a package of statistical data for the United States is waiting. The most interesting events displayed below ---> Wednesday, February 26 USA 15:00 Universal Time - New Home Sales (Jan): Prev -0.4% ---> Forecast 1.5% Thursday, February 27 USA 13:30 Universal time - basic orders for durable goods USA 13:30 Universal time - applications for unemployment benefits USA 13:30 Universal time - preliminary GDP data: Prev 2.1% Further development Analyzing the current trading chart, we see a slight rollback from the low of the past day, where the quote without excessive activity produces accumulation in the region of the average level of 1.2885. In fact, we see a stop where sellers regroup trade forces, and the levels below [1.2885 and 1.2850] are no longer so dangerous and can be broken in the course of a normal move. From the point of view of the emotional mood, we see that the downward move made it possible for many to return to the market, where the emotional component of the market participants is positive. By detailing the time interval per minute, we see a rollback of 1.2848 ---> 1.2901 with available accumulations in the form of small ranges of 10-15 points. In turn, medium-term traders as well as intraday traders, are considering a further downward move after the process of regrouping trading forces. Having a general picture of actions, it is possible to assume that accumulation in the variable frameworks of 1.2850 / 1.2915 will still remain for some time, but if the price is fixed lower than 1.2850, the direction will open for us towards the main level of 1.2770. If there is an upward trend, it will be in terms of local movement, but the downward trend strategic deals remain. Based on the above information, we derive trading recommendations: - Local buy positions were considered in case of price fixing higher than 1.2915, towards 1.2930-1.2950. - Positions for sale in the medium-term are already being conducted by traders in the direction of the level of 1.2770. At the same time, some intraday traders also hold short positions, but if we don't have any deals, then we are waiting for the price to pass lower than 1.2850. Indicator analysis Analyzing a different sector of timeframes (TF), we see that indicators unanimously took a downward position due to the movement within the level of 1.2885, which corresponds to the general mood of the market. Volatility per week / Measurement of volatility: Month; Quarter; Year Measurement of volatility reflects the average daily fluctuation, calculated for Month / Quarter / Year. (February 21 was built taking into account the time of publication of the article) The current time volatility is 26 points, which is a low value and acceleration is still possible. It is likely to assume that the volatility of the day will be at least around 70 points, in accordance with the pattern. Key levels Resistance Zones: 1.2885 *; 1.3000; 1.3170 **; 1.3300 **; 1.3600; 1.3850; 1.4000 ***; 1.4350 **. Support Areas: 1.2885 *; 1.2770 **; 1.2700 *; 1.2620; 1.2580 *; 1.2500 **; 1.2350 **; 1.2205 (+/- 10p.) *; 1.2150 **; 1,2000 ***; 1.1700; 1.1475 **. * Periodic level ** Range Level *** Psychological level **** The article is built on the principle of conducting a transaction, with daily adjustment The material has been provided by InstaForex Company - www.instaforex.com |


| You are subscribed to email updates from Forex analysis review. To stop receiving these emails, you may unsubscribe now. | Email delivery powered by Google |
| Google, 1600 Amphitheatre Parkway, Mountain View, CA 94043, United States | |
No comments:
Post a Comment