Forex analysis review |
- Forecast for USD / JPY on February 5, 2020
- Control zones for NZD/USD on 02/05/20
- GBP/USD. February 4. Results of the day. Boris Johnson wants an agreement, "like with Canada or Australia."
- EUR/USD. February 4. Results of the day. Final stage of Trump's impeachment case hearing; coronavirus remains to spread
- EUR/USD: dollar remains on its wave which is good for it, but bad for others
- Evening review for EUR/USD on February 4, 2020
- Analysis of EUR/USD and GBP/USD for February 4. Business activity in production increased both in US and EU, but stronger
- EUR/USD. February 4. Euro currency is declining again; Sales remain relevant
- GBP/USD. February 4. Trading signal for purchasing the pound has triggered
- GBP/USD. Pound tripped over Gibraltar
- February 4, 2020 : GBP/USD Intraday technical analysis and trade recommendations.
- February 4, 2020 : EUR/USD Intraday technical analysis and trade recommendations.
- GBP/USD 02.04.2020 - Strong rejection of the support level, watch for intraday buying positions and key resistance at 1.3050
- Gold 02.04.2020 - Breakout to the downside of multiply supports, big sell is coming soon and the level at $1.535 might be
- Oil: will OPEC stop the wave of sales?
- BTC analysis for 02.04.2020 - Broken mini PItchfork channel and support trendline, potential for drop towards $8.250
- Long-distance pound: Brexit accomplished, running continues
- Technical analysis of GBP/USD for February 04, 2020
- Trading recommendations for EUR/USD for February 4, 2020
- NZD/USD drop expected!
- Analysis and forecast for AUD / USD on February 4, 2020
- USD/CHF approaching support, potential bounce!
- EUR/JPY approaching resistance, potential drop!
- Trading idea for EUR/USD
- Trader's Diary: EURUSD on 02/04/2020, China epidemic and nonfarm
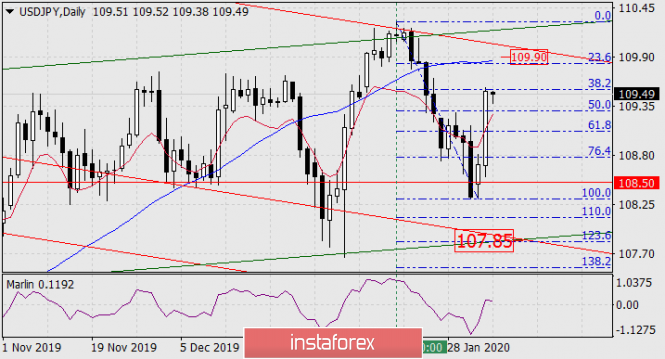
| Forecast for USD / JPY on February 5, 2020 Posted: 04 Feb 2020 06:55 PM PST USD / JPY Due to the general pressure of the dollar and the growth of the stock market, the USD / JPY pair jumped 81 points yesterday. The dollar index, on the other hand, gained 0.12%, and an additional 1.50% on the S&P 500. Today, Nikkei225 is growing at 1.35%, and even the Chinese Shanghai Composite Index is gaining 0.45%. We believe that optimism on the Asia-Pacific stock markets is temporary. The coronavirus itself is not so terrible as the consequences for the Chinese economy after unreasonably harsh measures to overcome its spread. According to pessimistic estimates, 2/3 of the Chinese economy is paralyzed, and the volume of bad loans is expected to increase to 6.3%. Of course, China can gloss over the following statistics, but this will not change its overall negative picture. So the January Manufacturing PMI has already shown a decrease from 51.5 to 51.1. Services PMI has worsened from 52.5 to 51.8, and on Friday the most important data on the trade balance for January will come out where the forecast for Trade Balance is 36.8 billion dollars against 46.8 billion in December.
Thus, this makes the situation on the yen look shaky. The price increase up to the peak of January 17 (110.30) is corrective in nature, even if it is part of the trend movement from last August. It is observed on the daily chart that the correctional price increase was 61.8% (in the figure, due to the overturn of the grid 38.2%). Perhaps this is where the price will unfold. But higher are the stronger resistances with the correctional level of 76.4% which is equivalent to 23.6% in the figure and at 109.90 in the MACD line. Turning the price down will once again direct the price to the area of attraction of the price channel lines and the Fibonacci reaction level of 123.6% at 107.85.
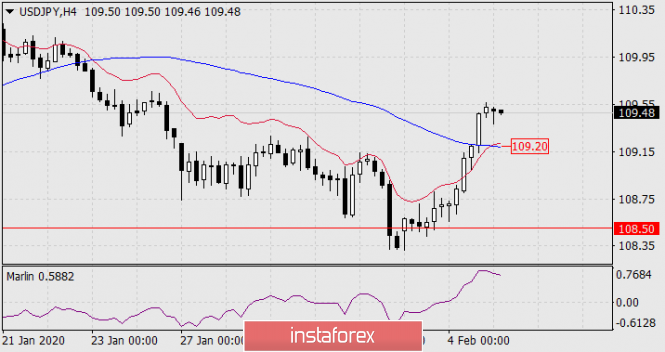
Price-fixing below the MACD line of 109.20 on the four-hour chart, will be a sign of the development and strengthening of the falling scenario. At the moment, the situation is neutral. The material has been provided by InstaForex Company - www.instaforex.com |
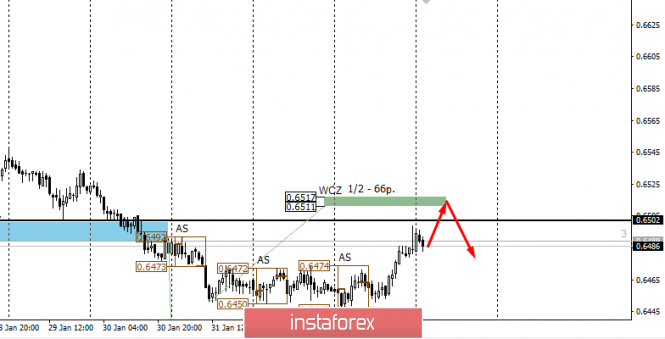
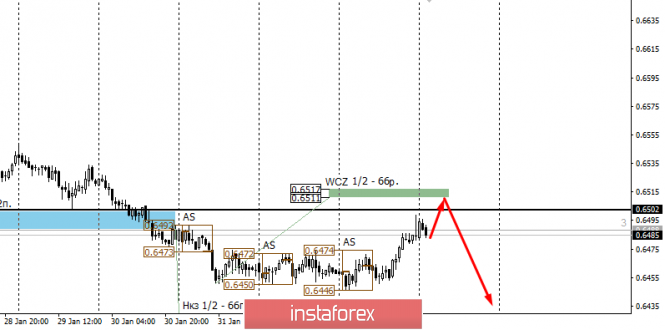
| Control zones for NZD/USD on 02/05/20 Posted: 04 Feb 2020 06:28 PM PST Yesterday's growth was the main model, as the pair was trading outside the average course. The level of 0.6502 remains the main target and is within the daily range. Meanwhile, the defining resistance zone of Weekly Control Zone 1/2 0.6517-0.6511 is located just above the level. Now, reaching this zone will determine the future priority. Yesterday's purchase of the instrument should be partially fixed after touching the level of 0.6502, while the rest can be transferred to breakeven. The continuation of the fall model will be developed if the Weekly Control Zone 1/2 test leads to the formation of the "absorption" or "false breakdown" pattern. This will pave the way for further lowering and updating the monthly minimum. Last month's downward movement remains a medium-term impulse. Daily CZ - daily control zone. The zone formed by important data from the futures market that changes several times a year. Weekly CZ - weekly control zone. The zone formed by the important marks of the futures market, which change several times a year. Monthly CZ - monthly control zone. The zone that reflects the average volatility over the past year. The material has been provided by InstaForex Company - www.instaforex.com |
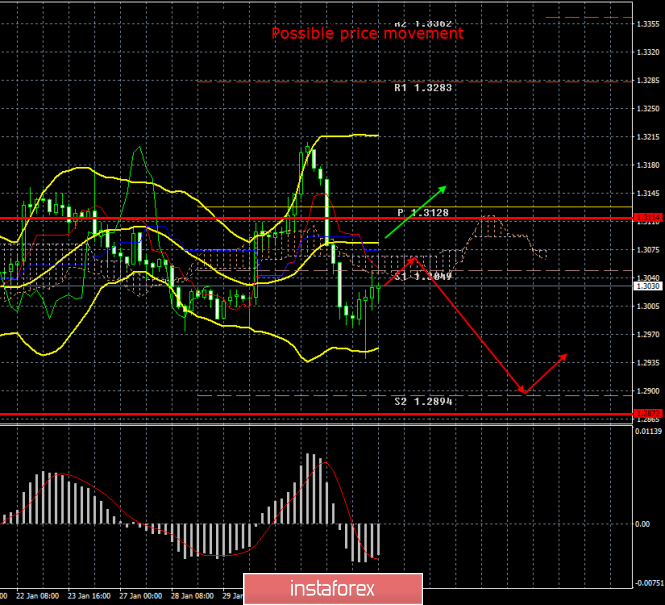
| Posted: 04 Feb 2020 03:33 PM PST 4 hour timeframe Amplitude of the last 5 days (high-low): 54p - 118p - 132p - 126p - 217p. Average volatility over the past 5 days: 121p (high). The British pound began a not too strong correction on Tuesday, February 4, but the downward trend has already been formed, so the upward movement is now the correction, and not an attempt to resume the upward trend. However, we are forced to make a much more important conclusion that the GBP / USD pair failed to overcome a strong support area again near the level of 1.3000. According to the results of today, the British currency tried to gain a foothold below, but it can be observed that the rebound from this area is expressed by a huge pin at the candle. The nearest goals for correction now are the lines of the indicator Ichimoku Senkou Span A and Kijun-sen. If the pound / dollar rebounded these levels, then the downward movement will resume with the prospect of declining to $ 1.29. There was little macroeconomic data from the UK today, or rather, there was not at all. Thus, traders had nothing to turn their attention to during the day. All this provoked an upward correction, as market participants did not find a reason for new sales of the British pound; however, there are grounds. After all, the threat of the failure of trade negotiations between London and Brussels has not gone away. Moreover, if there was simply no information on this, then the markets would not react to this. However, Boris Johnson personally stimulates issues by making such statements, after which even the most optimists begin to have doubts about the reality of signing a deal between the EU and Britain. Meanwhile, more and more experts are starting to focus not only on the economic problems that Britain has already encountered, but also on the geopolitical problems that the UK may face. This is primarily about Scotland. Thus, the British pound now has two huge areas of potential problems. The first area is economic problems that already exist (capital outflows, business problems, financial losses, a slowdown in the economy, a decline in production and GDP growth rates, as well as a slowdown in inflation), and problems that Britain may face during the year (lack of a trade deal) with the EU, which will further worsen all of the above economic problems). The second area is geopolitics and this is a potential referendum on independence in Scotland, but quite possibly without the approval of London. In this case, riots are possible as well as armed conflict. Scotland does not want to leave the EU, does not want to follow Boris Johnson, and its ruler Nicola Sturgeon is very radical. There are also problems with Gibraltar, the sphere of influence of which is now owned by Britain, but Spain has huge claims on this territory. In addition, problems on the island of Ireland are also possible, and of a completely different nature. Starting from the discontent of various nationalist forces and organizations with the next division of the island, ending with possible problems with smuggling, illegal border crossings and others. In fact, it is Northern Ireland that will now be the "window to Europe" and vice versa. Thus, as soon as one of these problems worsens, as yesterday, for example, a problem with a trade deal the pound will immediately react with a decline to this. Once again, Boris Johnson said today that the UK government has "made its choice" and wants to get a free trade agreement similar to that with Canada or even Australia. "If we do not succeed, although this is unlikely, then our trade will be based on the current agreement to exit the EU," said the British Prime Minister. Tomorrow will be much more interesting in terms of macroeconomic statistics, because the index of business activity in the manufacturing sector of the United Kingdom and the United States will be published. These data can cause high interest on the part of trailers and, accordingly, have a quite strong influence on the movement of the pound / dollar pair on Wednesday, February 5. Also tomorrow, the President of the United States is scheduled to appeal to the nation as part of the completion of the Senate consideration of the case of impeachment. At the same time, the ECB President Christine Lagarde will also make a speech. Trading recommendations: GBP / USD has started a new downward trend. Thus, sales of the British pound are currently relevant with a target support level of 1.2894, however, we recommend waiting for the completion of the current correction (MACD indicator turning down or other signals about it). The pair's purchases can be considered again if the price returns to the area above the Kijun-sen line with the first target of 1.3283. All targets are quite distant, and the price makes sharp turns. Thus, extra caution is recommended when opening any positions. Explanation of the illustration: Ichimoku indicator: Tenkan-sen is the red line. Kijun-sen is the blue line. Senkou Span A - light brown dotted line. Senkou Span B - light purple dashed line. Chikou Span - green line. Bollinger Bands Indicator: 3 yellow lines. MACD indicator: Red line and bar graph with white bars in the indicators window. Support / Resistance Classic Levels: Red and gray dashed lines with price symbols. Pivot Level: Yellow solid line. Volatility Support / Resistance Levels: Gray dotted lines without price designations. Possible price movements: Red and green arrows. The material has been provided by InstaForex Company - www.instaforex.com |
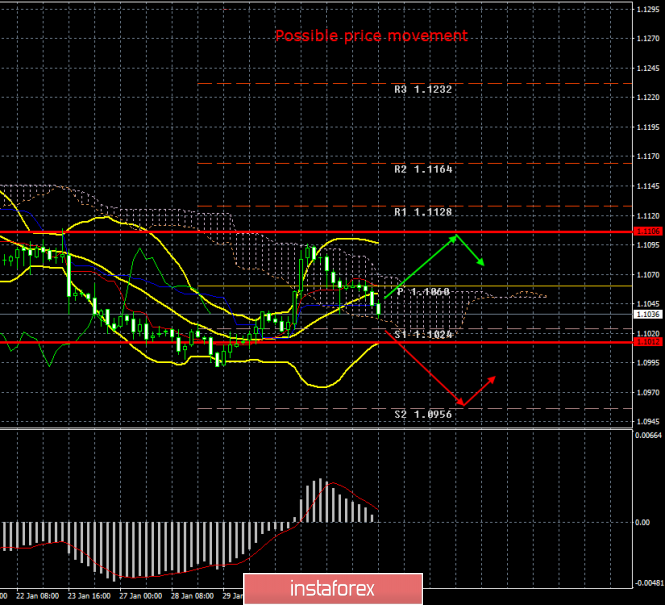
| Posted: 04 Feb 2020 03:33 PM PST Amplitude of the last 5 days (high-low): 28p - 36p - 32p - 79p - 58p. Average volatility over the past 5 days: 47p (average). The second trading day of the week was much more boring than the first one. The currency pair calmly continued the downward movement while maintaining low volatility and threatens to overcome the Kijun-sen critical line at the current bar. It can be recalled that breaking through this line will mean a change in the trend to a downward trend and, in fact, the resumption of a downward trend. In principle, this will be even logical based on the readings of the Ichimoku indicator, as the pair quotes failed to overcome the Senkou Span B strong line and, accordingly, failed to overcome the Ichimoku cloud as well. This moment shows the weakness of the bulls once again, and also proves the existence of the same "paradoxical situation", which we spoke about repeatedly. As a result, we have a declining European currency again. Nevertheless, there are still chances to resume the upward movement, even if it's not strong. However, in general, they will not change the general picture of the state of things since fundamental and macroeconomic factors remain on the side of the US dollar. Tuesday, February 4, was almost empty in terms of macroeconomic events. An insignificant producer price index for December was published in the European Union, which decreased by 0.7% y / y in full accordance with the forecast values. The United States also published a minor indicator of changes in production orders in December, which significantly exceeded forecast values and amounted to + 1.8% y / y. Thus, American statistics won even in the confrontation between insignificant reports. We have already said that the final Senate vote on impeachment of the US president will take place tomorrow. Today, the last hearings in the framework of the investigation ended, the prosecution and defense parties made closing speeches. Representatives of the Democrats said that the Senate is simply obliged to remove Trump from his post, as the evidence of guilt is "impressive". One of the initiators of the impeachment, Adam Schiff, said that "Trump violated the oath to defend the US constitution." Well, of course, the defenders of the US president called on the Senate to recognize Trump as innocent. According to the defense, the entire impeachment procedure is nothing more than an attempt by the Democrats to cancel the results of the 2016 elections, as well as to prevent Trump from being re-elected in 2020. It can be recalled that even half of the senators did not vote for calling additional witnesses; however, it was the new witnesses who could bring to the case new evidence and new evidence of Donald Trump's guilt. The Senate did not want this and, most likely, will justify the president tomorrow, February 5. Meanwhile, the new coronavirus continues to spread across planet Earth. The epidemic is mainly spreading so far in China, but cases have already been reported in European countries, America, and Australia. But scientists at Hong Kong University warn that official data on the number of people infected with the virus can be much lower than real numbers. And unfortunately, this is easy to believe, given the desire of any state and government to hide such facts from the whole world. No one wants to admit what real losses have already been and can be incurred. Thus, China is likely to underestimate the official figures, the spread of the virus is already happening exponentially. Having studied all the data on air travel and railway traffic, scientists came to the conclusion that about 75,000 people should have been infected in Wuhan by January 25. While officially reported about 2,000 infected. In addition, the infection should have spread to neighboring cities and provinces - Chongqing, Beijing, Shanghai, Guangzhou and Shenzhen. Even official data suggests that more and more people become infected every day. It is unlikely that healthy citizens are placed in the hospital, but the likelihood that there is a certain number of patients outside the hospitals is very high. Therefore, the real numbers are in any case higher than the official ones. From a technical point of view, the downward movement continues. If the bears manage to overcome the critical line, then a downward trend will be formed for the euro / dollar pair again and short positions will become relevant. Trading recommendations: EUR / USD continues to adjust against a new upward trend. Thus, it is recommended to buy euro currency in small lots with targets at levels 1.1106 and 1.1128, if the pair rebounds from the Kijun-sen critical line. On the contrary, it will be possible to consider the sales of the euro / dollar pair with the goals of 1.1024, 1.1012 and 1.0956, if traders manage to overcome the critical line. Explanation of the illustration: Ichimoku indicator: Tenkan-sen is the red line. Kijun-sen is the blue line. Senkou Span A - light brown dotted line. Senkou Span B - light purple dashed line. Chikou Span - green line. Bollinger Bands Indicator: 3 yellow lines. MACD indicator: Red line and bar graph with white bars in the indicators window. Support / Resistance Classic Levels: Red and gray dashed lines with price symbols. Pivot Level: Yellow solid line. Volatility Support / Resistance Levels: Gray dotted lines without price designations. Possible price movements: Red and green arrows. The material has been provided by InstaForex Company - www.instaforex.com |
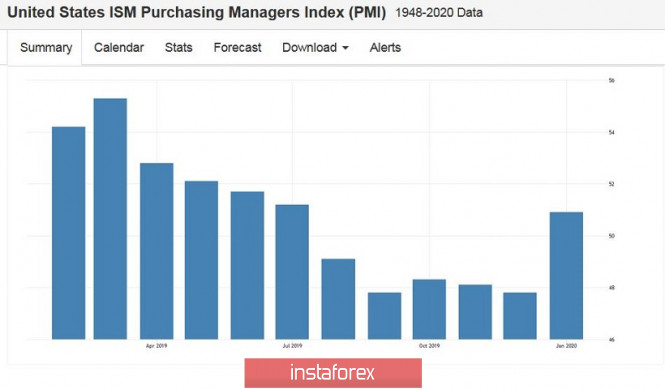
| EUR/USD: dollar remains on its wave which is good for it, but bad for others Posted: 04 Feb 2020 03:33 PM PST Unlike trade wars, the coronavirus returned the classic risk aversion to markets. If it was possible to observe surprisingly synchronous dynamics of profitable and reliable assets in 2018-2019 periodically, then in 2020, they move as described in textbooks. Increased demand for treasury leads to a decrease in their profitability, correction of US stock indexes and the strengthening of the dollar's positions. Experts argue that the new epidemic will have an impact not only on the global, but also on the US economy. This is the current year which differs from the previous ones. In addition, investors believed that the United States would benefit from trade wars, so they bought both the dollar and the S&P 500. According to Goldman Sachs experts, if the Celestial authorities succeed in defeating the coronavirus in February – March, then global GDP will lose 0.1–0.2% in 2020 and will show a modest growth acceleration - from 3.1% to 3.25% . According to the bank's forecast, US production will decline by 0.4% in the first quarter. Bloomberg analysts believe that the Netherlands will do the most damage among European countries. They also expect that economic growth in China in January – March will slow to 4.9%. At the same time, Beijing is even going to ask Washington to grant a delay to fulfill its obligations to increase purchases of American agricultural products in 2020 (by $ 76.7 billion compared with 2017). It can be recalled that there is a reference to natural disasters or other unforeseen circumstances in the interim trade agreement previously concluded between the parties that may serve as an obstacle to the fulfillment of the PRC terms of the agreement from mid-February. Due to trade wars, the Shanghai Composite index has been declining repeatedly in 2018–2019, while the S&P 500 has been growing. In 2020, coronavirus forced both indices to go downwards. Last Monday, the Chinese stock market declined more than 7%, which happened only eight times in its history. Loss of market capitalization amounted to a record $ 720 billion. At the same time, US stock indices fell and the dollar, which serves as a protective asset, strengthened. In this regard, only the release of a positive report on business activity in the US manufacturing sector from ISM for January somewhat changed the situation. The indicator rose above the critical level of 50 for the first time since July last year, noting to be the best monthly increase since mid-2013. Against this background, investors returned to stocks, and the dollar lost part of their achievements. The reaction of the American currency to macroeconomic statistics convinces how nervous the market is once again due to the uncertainty associated with the coronavirus. Now, it is possible that there was an effect of deferred sales in early February. Chinese investors have just left their holidays after the New Year holidays on the Lunar calendar, and the large-scale decline in the Shanghai Composite looks quite logical. The Chinese index pulled down the European and American counterparts. Today, the situation has stabilized a bit. Nevertheless, the dollar continues to enjoy support as a safe haven asset. At the beginning of the week, the EUR / USD pair came under pressure, retreating from Friday's values around 1.11. Last week, it formed a short-term basis at 1.0990. Thus, it is possible that the rebound may continue, but the pair will face strong resistance at 1.1180. Meanwhile, a breakthrough of strong support 1.1015 may signal that expectations for a rebound were still early. The material has been provided by InstaForex Company - www.instaforex.com |
| Evening review for EUR/USD on February 4, 2020 Posted: 04 Feb 2020 03:33 PM PST
The coronavirus epidemic in China is spreading. The risks of a global recession are increasing every day. The standard behavior of investors during a crisis is to go to the dollar and the US government bonds. We can see the dollar strengthening against euro, franc and yen. EUR/USD: Sell the euro at a break down of 1.0990. Buy when it breaks up to 1.1100. On Wednesday, the US employment report for January will be released. However, news from China about the virus is more important. The material has been provided by InstaForex Company - www.instaforex.com |
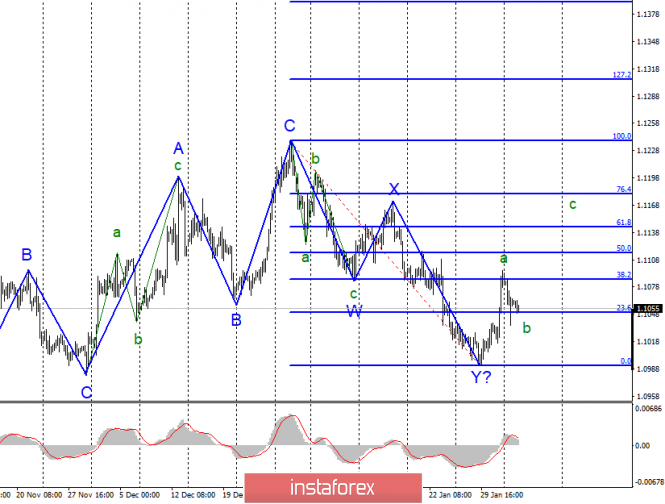
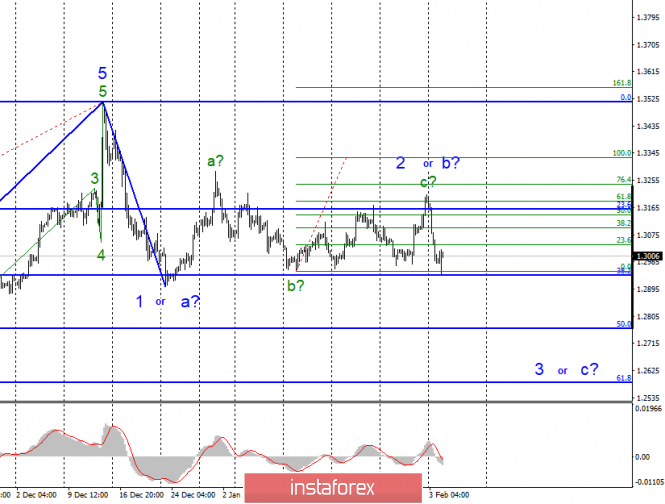
| Posted: 04 Feb 2020 03:33 PM PST EUR / USD On February 2, the EUR / USD pair declined by 35 basis points and thus, began the construction of the proposed correctional wave as part of the future upward trend section. If this is indeed the case and the downward trend section is fully integrated, then the quote of the instrument will resume in the near future within the framework of the expected wave C. However, an unsuccessful attempt to break through the 23.6% Fibonacci level may just lead to the completion of the construction of the correctional wave b. Fundamental component: Monday's news background was interesting enough again for the euro-dollar instrument. Almost the whole day was focused on the release of data on business activity in the manufacturing sectors of the European Union, individual EU countries, as well as the United States. And I must say that these data did not disappoint the markets since both European and American indices turned out to be better than the markets expected to see. However, due to the fact that the US indices were higher, the US dollar received additional demand, which, by the way, completely coincided with the current wave marking of the instrument. But first things first. The EU business activity index increased to 47.9, adding only 0.1 points. The same index in Germany also increased by 0.1 and amounted to 45.3, in the UK - by 0.2 and amounted to 50.0. Thus, the gains of all key indicators were minimal. Moreover, European and German business activity remained below 50, indicating a continuing slowdown in industries. It is a completely different matter in America, where both business activity indexes have grown. If the Markit index grew by only 0.2 and amounted to 51.9, then the ISM index rose immediately by 3.7 points and amounted to 50.9. Thus, American reports turned out to be corny stronger both in absolute terms and in relative terms. This is precisely what caused the increase in demand for the American currency. During Tuesday, the news background will be weaker. But mainly, there's nothing to pay attention to, only the producer price index in the eurozone, which already came out and amounted to -0.7% in December, which led to a slight decrease in the European currency. General conclusions and recommendations: The euro-dollar pair supposedly began to build an upward set of waves. Thus, before a successful attempt to break through the Y- wave minimum, I recommend buying the euro using MACD signals "up" with targets located near the calculated levels of 1.1115 and 1.1144, which equates to 50.0% and 61.8% Fibonacci. GBP / USD On February 2, GBP / USD lost about 205 basis points. Thus, the alleged wave 2 or b has acquired a very complex internal wave structure, but can still be considered completed at this time. If this is true, then the pound / dollar instrument has moved on to building a downward wave 3 or c with targets located much lower than 30th figure. However, an unsuccessful attempt to break through the 38.2% Fibonacci level may lead to a departure of quotes again from the lows reached and even more complicate the entire wave structure. Fundamental component: The news background for the GBP / USD instrument on Monday was average in strength. Well, at least such a conclusion was suggested based on the contents of the news calendar. The business activity index in the UK manufacturing sector increased by only 0.2 points, but left the area of slowdown, reaching 50.0. This is positive news for the pound. It would have been if it had not been for Prime Minister Boris Johnson, who has made statements before the start of negotiations on a trade agreement with the EU casting doubt on whether this agreement can be reached at all. Johnson said that "the UK intends to get an agreement that will be beneficial to it," he admitted that London could leave negotiations by summer if the European Union does not make concessions. In general, the Prime Minister took a very tough stance on this issue, and the markets responded to Johnson with the bitter sales of the British. On the other hand, the European Union members namely Michel Barnier and Ursula von der Leyen immediately criticized Johnson, saying that he can not sit at the negotiating table at all with such a position. General conclusions and recommendations: The pound / dollar instrument supposedly moved to the construction of a downward wave of 3 or C. Thus, now, I recommend selling the British currency with targets located around the level of 1.2764, which equates to 50.0% Fibonacci, and lower. At the moment, I recommend selling the instrument after a successful attempt to break the level of 1.2939, which corresponds to 38.2% Fibonacci. The material has been provided by InstaForex Company - www.instaforex.com |
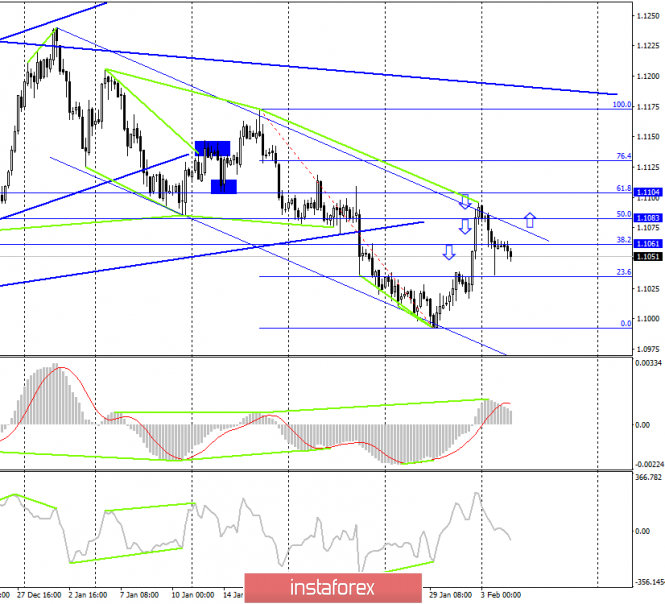
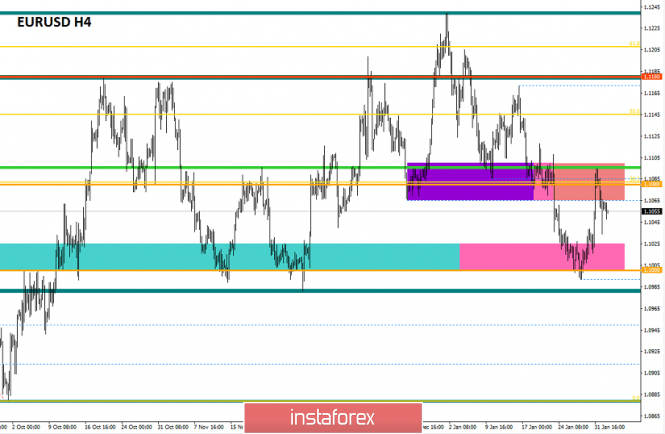
| EUR/USD. February 4. Euro currency is declining again; Sales remain relevant Posted: 04 Feb 2020 03:33 PM PST EUR / USD - 4 H. Good evening, dear traders! The EUR/USD currency pair on the 4-hour chart, continues the process of declining towards the correction levels of 23.6% - 1.1035 and 0.0% - 1.0993 which was already expected last Monday. Since a bearish divergence was formed and a rebound from the upper line of the downward trend range, the decline in quotes can continue. At the same time, I admit that another attempt will already be made to close the pair's course over the downward range either today or tomorrow. Thus, while I recommend selling the pair with the stated goals, but when closing above the range, they will recommend buying the euro-dollar pair. On the other hand, upcoming divergence is not observed today in any indicator. The informational background helped bear traders yesterday, as a strong index of business activity ISM in the manufacturing sector crossed out all other business activity indices in the eurozone and the USA and led to a growth in the dollar. Today, there are practically no economic reports, and thus, the pair's movement will be calm. Forecast on EUR / USD and recommendations to traders: The latest trading idea is to sell the pair when closing below the Fibo level of 38.2% - 1.1061 with targets at 1.1034 and 1.0992. The first of these goals was already completed yesterday, but now the pair is moving towards it again. The rebound of quotes from the level of 1.1035 will work in favor of the euro and the beginning of growth. However, I recommend buying the euro after the closing quotes over the downward range. The material has been provided by InstaForex Company - www.instaforex.com |
| GBP/USD. February 4. Trading signal for purchasing the pound has triggered Posted: 04 Feb 2020 03:33 PM PST GBP / USD - 4H.
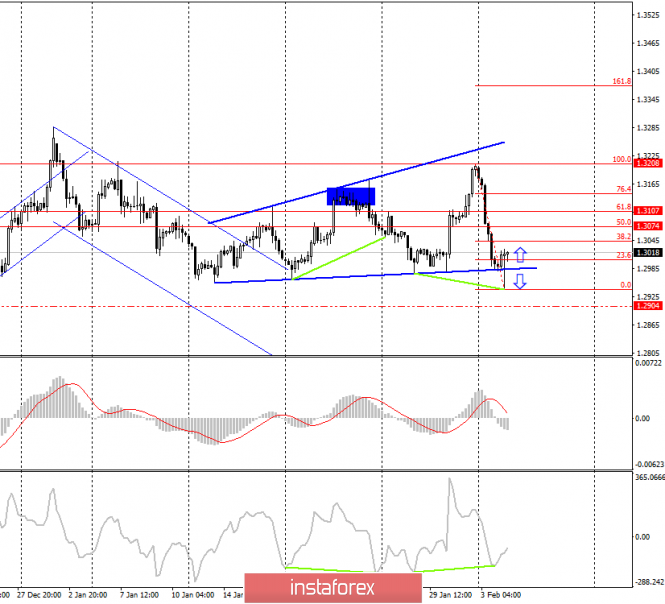
Good evening, dear traders! In a review for Monday, I pointed out that the global correction line plays a key role now in determining the mood of traders. Yesterday, the pound-dollar pair declined to it, as I expected, and after the formation of a bullish divergence, the CCI indicator reversed in favor of the "British". Moreover, a strong increase in the quotes of the pair has not yet been achieved, however, the mood among traders will be clearly "bullish" today and tomorrow. Therefore, I expect the pair to increase by 50% or 62% from the last decline, that is, to the levels of 1.3074 or 1.3107. At the same time, fixing quotes under the global correction line will work in favor of the US currency and the resumption of the decline in the direction of the level of 1.2904, which is the minimum goal for a further decline. In turn, an informational background could help the "Briton" yesterday, but news from America was stronger. In addition, the speech of Boris Johnson, which significantly reduces the chances of concluding a trade deal with the European Union after Brexit, negatively affected the pound. Today, the information background is calmer. Forecast on GBP / USD and recommendations for traders: A new trading idea is to sell the pound when fixing below the correction line with the target of 1.2904 (the first goal, the drop in quotes can be much stronger). Moreover, if quotes rebound from 1.2995, then purchases with targets of 1.3074 and 1.3107 are recommended, while Stop Loss levels are recommended to be moved outside the correction line. The material has been provided by InstaForex Company - www.instaforex.com |
| GBP/USD. Pound tripped over Gibraltar Posted: 04 Feb 2020 03:33 PM PST The pound-dollar pair is going through hard times again: Britain is seriously worried about the prospects for further relations between London and Brussels, after a surge of optimism due to the January meeting of the Bank of England.. European and British politicians with their comments only stimulate interest in this topic. It can be said that all the most controversial issues that were resolved during the negotiation process are returning to the agenda again. The transition period began with harsh statements that put significant pressure on the pound: the GBP/USD pair literally collapsed 200 points in a day, returning to the area of the 29th figure. The British overseas territory - Gibraltar, became an obstacle again. A few centuries ago, the British conquered this strategically important piece of territory from the Spaniards, and since then, disputes over its ownership have not ceased between the countries. British sovereignty was formalized by the Utrecht Treaty of 1713, but Spain never recognized it.
During the Brexit negotiation process, Madrid reasonably decided that for the first time in many years it had effective leverage in negotiations on this issue. After a long fight, the British agreed to conduct direct consultations on the disputed territory, and not as part of general negotiations with the EU. At the same time, the Spaniards demanded separately to prescribe in the draft transaction a clause that London undertakes to agree with Madrid on the fate of Gibraltar. At that time, Gibraltar was not mentioned at all in the agreement - the text contained only a vague clause that all outstanding issues would be agreed upon by Britain and the EU after the country officially left the Alliance. The issue of ownership was not discussed then - at the end of 2018, the parties focused only on the fate of the Spaniards who live and work in Gibraltar. According to statistics about 15 thousand people daily come to Gibraltar from Spain to work. Now, passport checks should arise at the border, which will inevitably lead to long lines, additional costs and other inconveniences. It is worth noting that, at a historical referendum, the majority of Gibraltar residents voted to remain in the European Union. At the end of the year, London undertook to agree with Spain on the fate of Gibraltar, and now, as they say, "the time has come". Brussels has already announced that it will support the Spaniards "in the matter of its territorial claims" in Gibraltar. This irreversible position increased pressure on the British currency. And it is worth noting that the problem of Gibraltar is far from the only one of its kind. Another difficult issue is Britain's observance of EU rules and a mechanism for resolving possible conflicts. The European side insists that London comply with EU standards in exchange for access to a single market. Boris Johnson, in turn, rejects this ultimatum, declaring government's readiness to abandon negotiations with Brussels on a trade deal. In addition, the British leader proposes the so-called "Canadian version" of the trade agreement. According to which, London will conclude a deal with Brussels similar to the Comprehensive Free Trade Area Agreement (SETA) between the European Union and Canada. This will allow the UK to enter into trade agreements with third countries. The main negotiator from the European Union, of course, rejects this idea. Obviously, if the parties do not compromise in the foreseeable future, the likelihood of a trade deal between Brussels and London will decrease day by day, putting pressure on the pound. Traders are also concerned about the tight deadlines for the transition period: experts unanimously argue that the parties will not have time to agree on a colossal volume of issues in a few months. For example, the EU entered into a trade agreement with Canada only after eight years of the negotiation process. Similar negotiations with Japan lasted almost seven years, and with Singapore - almost 10. Analysts believe that certain issues will be agreed before the end of this year, but the most complex and strategically important problems will remain unresolved. Among them are the access of European agricultural producers to the British market, the regulation of European automotive giants, the access of the French, Germans, and Spaniards to British waters for fishing and the aforementioned issue of Gibraltar. Thus, the British currency is now under significant pressure amid fierce trade negotiations between London and Brussels. In turn, the US dollar regained its position yesterday due to the ISM manufacturing index, which exceeded the key 50-point mark - for the first time since July last year. It is worth recalling that the December figure unexpectedly collapsed to 10-year lows, reaching 47.2 points. Therefore, the January result brought the dollar back to life after an unstable sharp decline on Friday (the factor of the completion of the week and month played here - many traders took profits). Moreover, the inflation component of the indicator - the Indicator of the dynamics of growth in commodity prices also showed a positive trend, rising to 53.3 points.
The prevailing fundamental picture allows the bears of GBP/USD to test the nearest support level of 1.2950 in the foreseeable future - this is the lower line of the Bollinger Bands indicator on the daily chart. The material has been provided by InstaForex Company - www.instaforex.com |
| February 4, 2020 : GBP/USD Intraday technical analysis and trade recommendations. Posted: 04 Feb 2020 08:37 AM PST
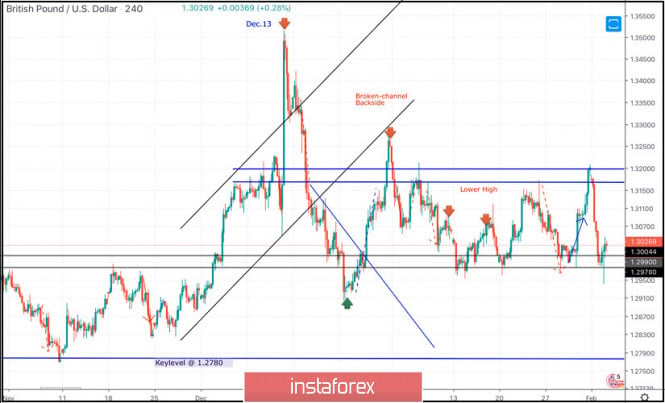
On December 13, the GBPUSD pair looked overpriced around the price levels of 1.3500 while exceeding the upper limit of the newly-established bullish channel. On the period between December 18 - 23, bearish breakout below the depicted channel followed by initial bearish closure below 1.3000 were demonstrated on the H4 chart. However, early signs of bullish recovery were manifested around 1.2900 denoting high probability of bullish pullback to be expected. Thus, Intraday technical outlook turned into bullish after the GBP/USD has failed to maintain bearish persistence below the newly-established downtrend line. That's why, bullish breakout above 1.3000 allowed the recent Intraday bullish pullback to pursue towards 1.3250 (the backside of the broken channel) where bearish rejection and a sideway consolidation range was established between (1.3200-1.2980). Moreover, new descending highs were also demonstrated around 1.3120 and 1.3085. Intraday technical outlook was supposed to remain bearish as long as the pair maintained its movement below 1.3120 (recently established descending high). That's why, conservative traders were advised to wait for bearish breakdown below 1.2980 as a signal for further bearish decline towards 1.2900, 1.2800 and 1.2780. However, on Thursday, early signs of bullish recovery have been manifested around 1.2980-1.3000 (Bullish hammer followed by a Bullish Engulfing H4 candlestick) and this is being repeated as you're reading now. Early signs of bullish rejection are being manifested around 1.2980-1.3000. However, upcoming bearish breakdown below 1.2980 is more probable to occur based on the recent price action. In the Meanwhile, Intraday traders can wait for H4 candlestick closure below 1.2980 as a valid SELL signal with T/P level to be projected towards 1.2910 then 1.2830 if sufficient bearish momentum is maintained. The material has been provided by InstaForex Company - www.instaforex.com |
| February 4, 2020 : EUR/USD Intraday technical analysis and trade recommendations. Posted: 04 Feb 2020 08:22 AM PST
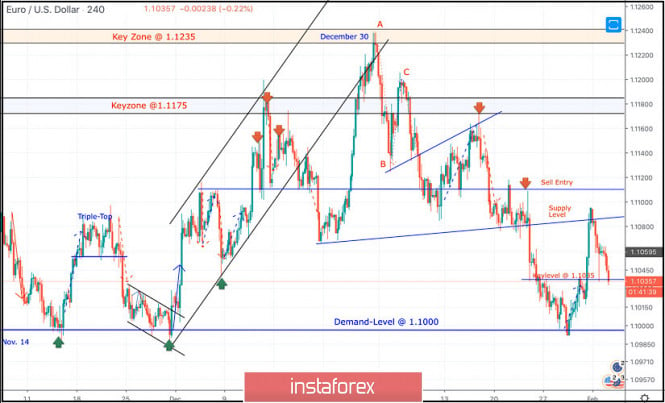
On December 30, a quick bullish spike towards 1.1235 (Previous Key-zone) was suggested to be watched for bearish rejection and a valid SELL entry. A bearish ABC reversal pattern was demonstrated just before another bearish movement took place towards 1.1100. However, the EURUSD pair has lost much of its bearish momentum while approaching the price levels around 1.1100. That's why, another bullish pullback was executed towards 1.1175 where the depicted key-zone as well as the recently-broken uptrend were located. Evident signs of bearish rejection were demonstrated around 1.1175. That's why, another bearish decline was executed towards 1.1100 then 1.1035 which failed to provide enough bullish SUPPORT for the EURUSD pair. Further bearish decline took place towards 1.1000 where the pair looked quite oversold. Hence, significant bullish rejection was able to push the pair back towards the nearest SUPPLY level around 1.1080-1.1100. To be noted, the EURUSD pair had a recently-established Key Level around 1.1035 which is being breached to the upside, now being retested as a demand level. Hence, intraday traders should be looking for signs of bullish recovery around the current price level (1.1035) as a BUY signal. Intermediate technicaloutlook remains neutral as long as the pair remains trapped between 1.1000 and 1.1100 (Supply Area). Hence, further bullish advancement may be expected towards 1.1100 unless bearish breakdown below 1.1035 occurs, which clears the way for another bearish attempt to invade the mentioned demand-level of 1.1000. Trade recommendations :Intraday traders can wait for signs of bullish rejection around the current key-level (1.1035) on H4 timeframe as a valid BUY signal. T/P level to be located around 1.1100 while S/L to be located below 1.0980. The material has been provided by InstaForex Company - www.instaforex.com |
| Posted: 04 Feb 2020 04:33 AM PST Technical analysis:
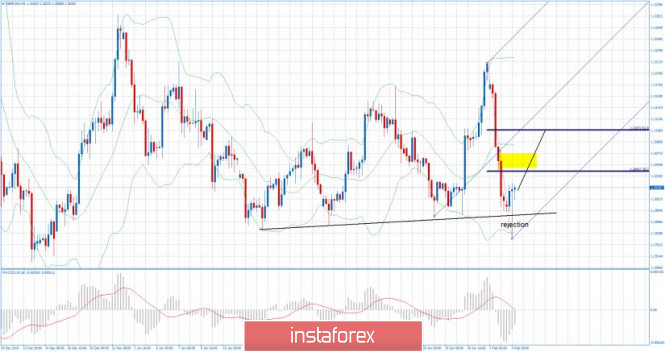
GBP has been trading downwards. The price tested and rejected of the main support at the $1.2950 leaving the strong tail/ Due to strong rejection of the support, I see potential upside movement towards the level at $1.3065-1.3070. Watch for buying opportunities on the dips using the intraday frames 5/15 minutes. MACD oscillator is showing decreasing momentum to the downside, which adds more strength into our bullish view... Major support levels are set at the price of 1.2983 and 1.2950. Resistance levels are seen at the price of 1.3045, 1.3065 and 1.3070. The material has been provided by InstaForex Company - www.instaforex.com |
| Posted: 04 Feb 2020 04:20 AM PST Technical analysis:
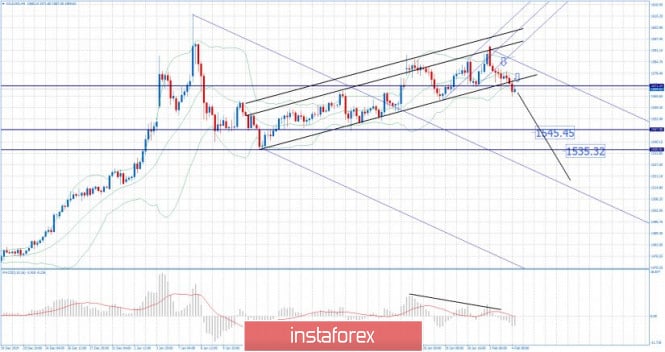
Gold has been trading downwards as I expected yesterday. The price tested the level of $1.566. The breakout of the mini upwards Pitchfork channel and the most recent breakout of support trendline were the key for downside pressure. Watch for selling opportunities on the rallies using intraday frames 5/15/30 minutes and downward targets at the price of $1.545 and $1.535. MACD oscillator is showing negative reading below the zero and the slow line is turned to the downside, which adds confirmation for further downside. Major resistance is set at the price of $1.571 and intraday at $1.925 Support levels are seen at the price of $1.551, $1.545 and $1.535 The material has been provided by InstaForex Company - www.instaforex.com |
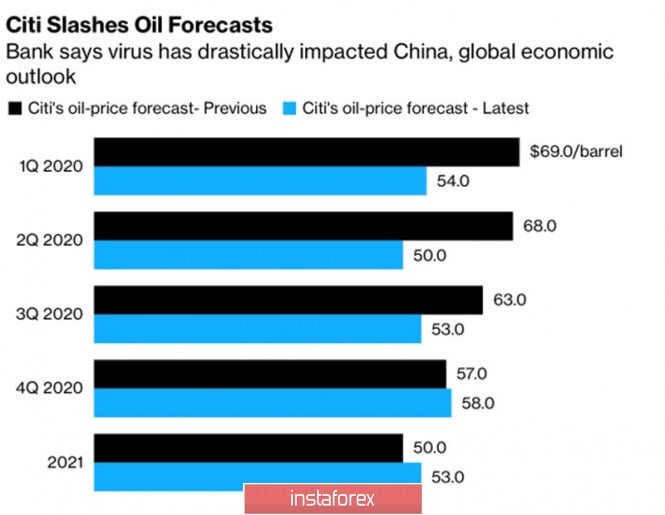
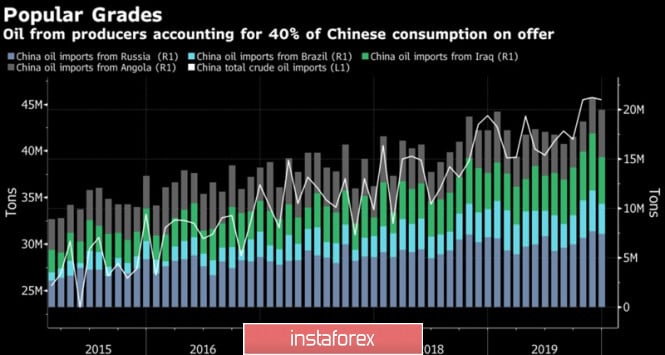
| Oil: will OPEC stop the wave of sales? Posted: 04 Feb 2020 04:17 AM PST The transition of the black gold market to the territory of the "bears" has caused serious concern within the OPEC. At an emergency meeting of the cartel with the participation of Russia and other allies on February 4-5, questions of price stabilization will be discussed. Saudi Arabia and other producing countries need enormous efforts because they will have to fight with an external enemy namely the coronavirus. According to rumors circulating on the market, the virus has reduced Chinese oil demand by 3 million bps, which is equivalent to 20% of domestic consumption. Since Beijing announced the new virus on January 7, Brent quotes have sagged by 16%, since the conflict in the Middle East with 20%. It is believed that the epidemic will bring more pain to the black gold market than the outbreak of SARS in 2003. British Petroleum estimates global demand losses at 0.3-0.5 million bps for the whole year, Citi says the figure is 1 million bps during the first quarter and lowers the forecast for North Sea prices from $ 69 to $ 54 per barrel in January-March and from $ 68 to $ 50 per barrel in April-June. According to the consulting company JBC, oil consumption in China in February-March will be reduced by 1 million bps. Oil Price Forecasts:
Dynamics of Chinese oil imports:
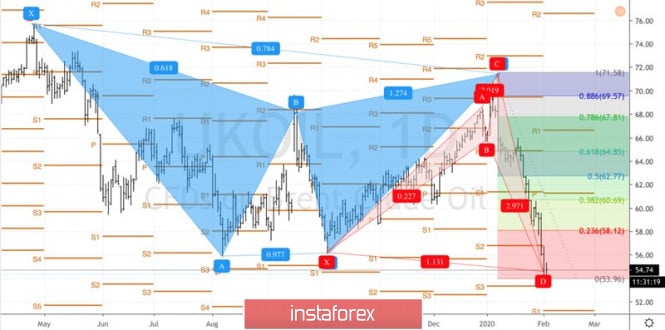
OPEC, which barely had time to start fulfilling its obligations to reduce production by 1.7 million bps, faced a serious problem and is considering two options for interfering in the life of the black gold market. The first scenario provides for an increase in cuts by 500 thousand bps throughout the year, the second is based on the need to provoke a shock in the oil market. The cartel and Russia are cutting production by an additional 1 million bps (a total of 2.7 million bps), prices are skyrocketing and then stabilizing. Of key importance in addressing the suspension of the peak of Brent and WTI is the position of official Moscow. The budget of the Russian Federation will withstand the North Sea grade at $ 40- $ 42 per barrel, so the Kremlin has an airbag. He perfectly understands that the main preferences from the current situation in the oil market are received by American producers, who are increasing their share in the global supply. Russia needs a balanced approach. It is ready to cooperate with Saudi Arabia but does not speak directly about reducing domestic production. There was a collapse of black gold without a strong US dollar. The American currency in the face of growing risks of a slowdown in the global economy performs the function of an asset-refuge. At the same time, an increase in the USD index, as a rule, leads to a drop in oil prices. In my opinion, the coronavirus factor has already been largely taken into account in the quotes of black gold futures, the gradual stabilization of the situation in China and the operational intervention of OPEC will allow Brent and WTI to grope underfoot. Technically, the North Sea variety reached the target by 113% according to the Shark pattern, which increases the likelihood of a rollback in the direction of 23.6%, 38.2% and 50% of the CD wave. These resistance levels correspond to the levels of $ 58.1, $ 60.7 and $ 62.75 per barrel. Immediate support should be sought in the area of $ 52.5- $ 53.4, formed by the levels of Pivot. Brent daily chart:
|
| Posted: 04 Feb 2020 04:09 AM PST Industry news: Fourteen of Japan's biggest banks and securities companies will begin running a pilot for a blockchain-powered inheritance platform. The pilot, which is being spearheaded by the Sumitomo Mitsui Trust Bank, will begin in mid-February. If successful, financial institutions in the country could aim to roll the solution out before the end of 2020. Per Nikkei, the Sumitomo Mitsui Trust Bank has been joined on the project by another Sumitomo Group banking subsidiary, as well as banking arms of financial heavy-hitters such as Mitsubishi UFJ, Mizuho and Nomura Securities. Technical analysis:
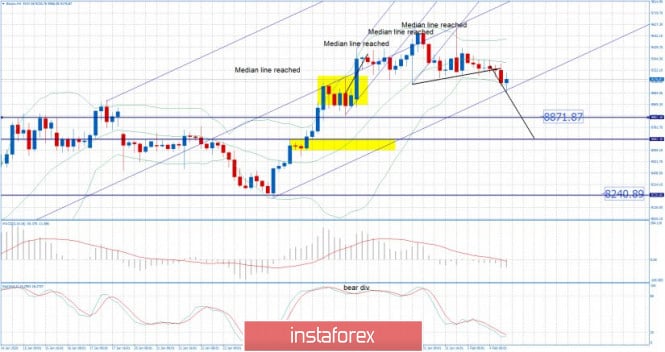
BTC has been trading downwards as I expected yesterday. The price tested the level of $9.500. The multiply rejections of the median Pitchfork line and the most recent breakout of support trendline were the key for downside pressure. Watch for selling opportunities and potential tests of $8.870 and $8.240. MACD oscillator is showing negative reading below the zero and the slow line is turned to the downside, which adds confirmation for further downside. Major resistance is set at the price of $9.600 and intraday at $9.200. Support levels are seen at the price of $8.871and $8.240. The material has been provided by InstaForex Company - www.instaforex.com |
| Long-distance pound: Brexit accomplished, running continues Posted: 04 Feb 2020 03:52 AM PST According to experts, the most interesting time has come for the British currency. The pound rejoined the race under the name Brexit, trying to overcome the period of exit from the Euroblock with the least losses. Analysts are confident that sterling expects dizzying ups and downs. British politicians, particularly British Prime Minister Boris Johnson, expect a relatively calm transition during the Brexit and minimal losses for the British economy. It seems that in this situation, the sterling is in solidarity with the Prime Minister seeking to find the long-awaited balance. However, at the moment, fortune is not on the side of the British currency. This week, the pound began with a sharp drop after the prospective growth last Friday, January 31. Recall, this was the release date of the United Kingdom from the Euroblock. Experts believe the reason for the rapid collapse of sterling is the statement by the British Prime Minister that Britain would refuse to follow European rules as part of a potential trade deal. At the same time, Brussels insists on the unification of trade legislation. Analysts find it difficult to answer whether the parties can agree on mutually beneficial cooperation. Representatives of the European Commission believe that now a tough stance on the part of the United Kingdom in trade negotiations is unacceptable. At the moment, free access to a single market does not exist, specifically in Brussels. Also, relations between the United Kingdom and the EU will be strictly regulated and both parties expect strict observance of mutual rights and obligations, experts say. The current situation is desperately pushing the pound. The British pound is not supported even by relatively positive data on activity in the country manufacturing sector. According to IHS Market, in January 2020, the index of PMI purchasing managers in the manufacturing sector of Misty Albion grew to 50 points, compared with 47.5 points in December 2019. Recall that the excess of the index bar of 50 points indicates the restoration of activity and relative stabilization in the economy. However, a significant fly in the ointment in this situation is the spread of the Chinese coronavirus, which may put pressure on the manufacturing sector in the UK. According to analysts, this will lead to an increase in stocks and a reduction in demand for new orders, which will block the flow of investor capital. Experts attribute Friday's pound rise as a temporary weakening dollar, triggered by the comments of Jerome Powell, head of the Fed. Market participants mistakenly believed that the Fed was ready to soften monetary policy. Currently, the greenback is gaining strength again, ignoring concerns over the spread of the coronavirus epidemic. Experts added that the sterling can return lost positions only in case of further weakening of the USD, and this is unlikely. An additional traumatic factor for the pound is the prospect of a rate cut by the Bank of England. The information background for this week includes information on business activity in the UK services sector. Note that this sector accounts for more than 80% of the country economic growth. In the case of the publication of weak data, the likelihood of softening the British monetary policy will increase at times, analysts are sure. The current situation holds the pound in suspense, forcing it to run again and again in a circle of ups and downs. According to experts, now the best tactic for the GBP / USD pair is to wait. Experts do not exclude that the British pound will be weak before the greenback after a false breakdown of 1.3335. Last Friday, the pair rose to 1.3085–1.3090, but then a rapid rollback began. Subsequently, the tandem fell to 1.3037–1.3040, but did not stop there. The peaks were left behind, and the pound rolled to low positions. Morning of February 4, the pair began relatively positive as it remained at the level of 1.3016. However, the downward trend took its toll, and the tandem began to decline again. In the future, the GBP / USD pair went to around 1.2950, having long felt for the bottom and not finding the strength to get out. However, despite the current negative, many experts are rather optimistic about the pound. They believe that the upward trend, formed on January 28-29, is still in force, and after a slight stabilization of the situation, demand for the pound may return. Further developments will depend on the outcome of negotiations between the UK and the European Union, experts emphasize. Experts are unanimous in the opinion that in the short term, the British currency expects difficulties. The pound will have to fight for a place under the financial sun, proving its strength and stability. The transition period that began in Britain after Brexit makes its contribution to the current difficulties. Meanwhile, in this struggle, the pound is a support for the British economy, and against it is political and foreign economic uncertainty. Recall that the transition period will last until the end of this year, although investors believe that this time is not enough to agree on mutually beneficial trading conditions between the UK and the countries of the Euroblock. The material has been provided by InstaForex Company - www.instaforex.com |
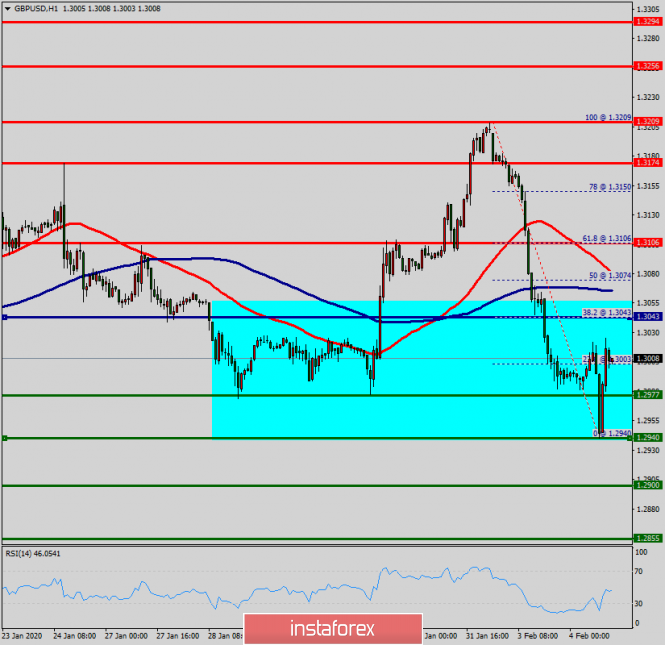
| Technical analysis of GBP/USD for February 04, 2020 Posted: 04 Feb 2020 03:21 AM PST Overview: The GBP/USD pair fell from the level of 1.3106 to bottom at 1.2940 yesterday. Today, the GBP/USD pair has faced strong support at the level of 1.2940. So, the strong support has been already faced at the level of 1.2940 and the pair is likely to try to approach it in order to test it again and form a double bottom. Hence, the GBP/USD pair is continuing to trade in a bullish trend from the new support level of 1.2940; to form a bullish channel. According to the previous events, we expect the pair to move between 1.2940 and 1.3106. Also, it should be noted major resistance is seen at 0.3209, while immediate resistance is found at 1.3106. Then, we may anticipate potential testing of 1.3043 to take place soon. Moreover, if the pair succeeds in passing through the level of 1.3043, the market will indicate a bullish opportunity above the level of 1.3043. A breakout of that target will move the pair further upwards to 1.3106 and 0.3209. Buy orders are recommended above the area of 1.3043 with the first target at the level of 1.3106; and continue towards 0.3209. On the other hand, if the GBP/USD pair fails to break out through the resistance level of 1.3106 ; the market will decline further to the level of 1.2900 (daily support 2). The material has been provided by InstaForex Company - www.instaforex.com |
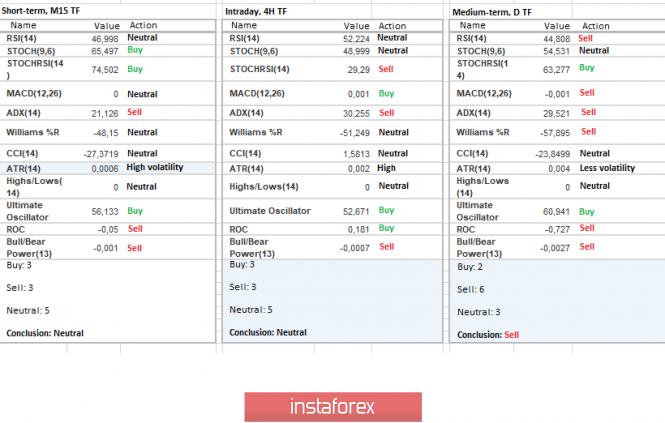
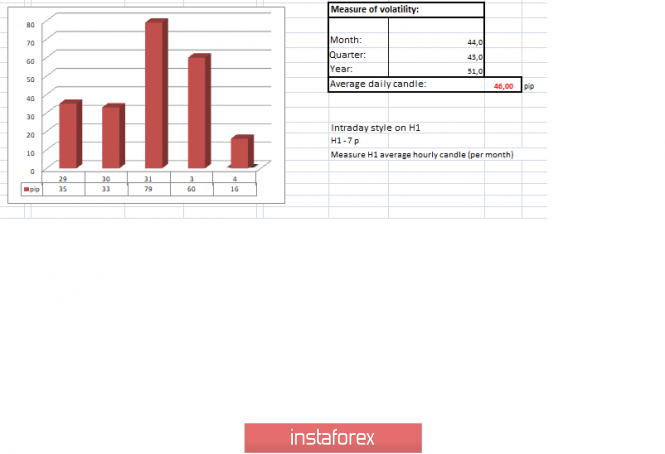
| Trading recommendations for EUR/USD for February 4, 2020 Posted: 04 Feb 2020 03:03 AM PST From a complex analysis point of view, we see the next development of the range level 1.1080, within which the quotes found a resistance point. In fact, the past day managed to win back more than 50% of the inertial course of Friday, returning sellers to the market. Considerable merit in this movement lies on the cries of the pound sterling, which in a similar period of time showed ultra-high activity in terms of reduction, pulling a correlated pair of EUR/USD. Is it possible to consider tact 1.1000 ---> 1.1080 as the structure of the downward movement from the beginning of January, hypothetically it is possible to see a reverse move in the direction of 1.1000. At the same time, it is worth taking into account such a moment that if the pound did not have such a strong reaction to the background, the euro would have remained near the range level. Thus, what will happen when the noise subsides? Will the euro return within the limits of 1.1080 [1.1060 // 1.1080// 1,1100]? We will not remove this theory from consideration. Regarding the recovery process from an oblong correction, it is not so simple here, the psychological level of 1.1000 is firmly in place and we will talk about recovery only in case of a breakdown, not earlier. From the volatility's vantage point, we see acceleration for the second day in a row, and here we can clearly see the echoes of FOMO syndrome [Syndrome of lost profit], which began to occur at the time of the breakdown of the accumulation of last week. Analyzing the past minute by minute, we see that the main turn of short positions from the range of 1.1080 fell on the period 06:00 -14:00 UTC [time on the trading terminal]. After that, a rollback was recorded, followed by a slowdown in the form of a flat 1.1055 / 1.1065. As discussed in the previous review , speculators considered a rebound from the range level, therefore, the area of 1.1060 / 1.1065 was given special attention in terms of price-fixing where the short positions took place. Considering the trading chart in general terms [the daily period], we see the concentration of prices between the first [1,1080] and second degree [1,1000] of the recovery process relative to the elongated correction. At the same time, I advise you to consider the period 10/15/19 vr., where you will see that for a long time the market moves conditionally horizontally, with a wide amplitude. The news background of the past day contained data on the Eurozone PMI, where acceleration in the manufacturing sector from 46.3 to 47.9 was recorded. A similar indicator also appeared in the United States, where a slowdown from 52.4 to 51.9 was recorded with a forecast of 51.7. The market reaction was outside the statistical data, since we already had a background of decline. In terms of the general information background, we have a wave of noise, raised on the basis of the subsequent relationship after Brexit between Britain and the European Union. So, investors' fear arose during high-profile statements, where the British Prime Minister outlined London's position in the upcoming talks, saying that it was them who should set the standards and rules that would be adopted by the British services. In fact, this direct manipulation of competition, as in which case limited measures are introduced for imports from Europe. The EU typically responds immediately through its main negotiator, Michel Barnier to such statements. Which brings us to remember that the trade agreement is drawn up precisely on EU standards, and not differently, adding that the best relations with the European Union would be if EU membership remains, but Britain chose its path. Today, in terms of the economic calendar, we had data on producer prices in Europe, where a characteristic improvement of -1.4% was recorded ---> - 0.7%. In the afternoon, data on the volume of US industrial orders will be released, where they expect an increase of 1.2%. Further development Analyzing the current trading chart, we see the conditional standing still, which in comparison with the correlated pair, GBP/USD confirms the discrepancy. This means that restraint is what we have, and this greatly affects the activity of market participants who still focus on the range of 1.1080. In this case, it is worthwhile to carefully look at the price-fixing points relative to the existing stagnation, since equilibrium can lead to acceleration. In terms of the emotional mood of market participants, we have a slight decline in terms of speculative activity, but this is probably temporary and is associated with a regrouping of trading forces. In turn, traders will focus on the values of 1.1040 and 1.1065, since further fluctuation will depend on the fixation point. It is likely to assume that the existing stop has two possible developments, the first considers the concentration of prices within the range of 1.1080 [1.1060 // 1.1080 // 1.1100], where the quotes will return. The second option considers the existing measure as the structure of the downward movement, which was set back in early January. In this case, fixing the price lower than 1.1040 will lead to a return to the area of 1.1000. Based on the above information, we derive trading recommendations as follows: - Buy positions will be considered in case of price-fixing higher than 1.1065 with a move towards 1.1080-1.1100. Further movement is considered in the case of a clear price-fixing higher than 1.1110. - We consider selling positions in terms of returning to the psychological level of 1.1000, but in this case we need to fix lower than 1.1040. Indicator analysis Analyzing a different sector of timeframes (TF), we see that due to the current situation, there is a characteristic multidirectional interest, and only in the medium term does a sell signal remain. Volatility per week / Measurement of volatility: Month; Quarter; Year Measurement of volatility reflects the average daily fluctuation calculated for Month / Quarter / Year. (February 4 was built taking into account the time of publication of the article) The current time volatility is 16 points, which is a low indicator for this time section. It is likely to suggest that a break in existing stagnation may result in local acceleration. In the case of a downward movement, acceleration may be more extensive. Key levels Resistance zones: 1.1080 **; 1,1180; 1.1300 **; 1.1450; 1.1550; 1.1650 *; 1.1720 **; 1.1850 **; 1,2100 Support Areas: 1,1000 ***; 1.0900 / 1.0950 **; 1.0850 **; 1,0500 ***; 1.0350 **; 1,0000 ***. * Periodic level ** Range Level *** Psychological level ***** The article is built on the principle of conducting a transaction, with daily adjustment The material has been provided by InstaForex Company - www.instaforex.com |
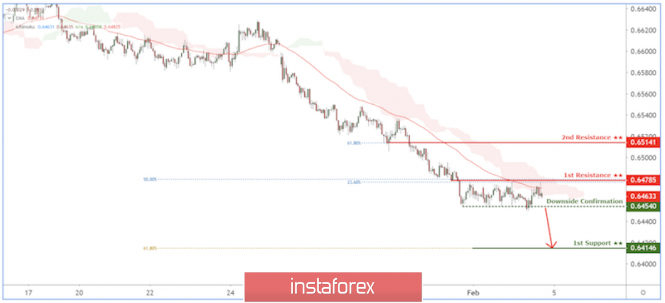
| Posted: 04 Feb 2020 02:27 AM PST
Trading Recommendation Entry: 0.64540 Reason for Entry: Horizontal swing low Take Profit : 0.64146 Reason for Take Profit: 61.8% Fibonacci retracement Stop Loss: 0.64785 Reason for Stop loss: 23.6% Fibonacci retracement The material has been provided by InstaForex Company - www.instaforex.com |
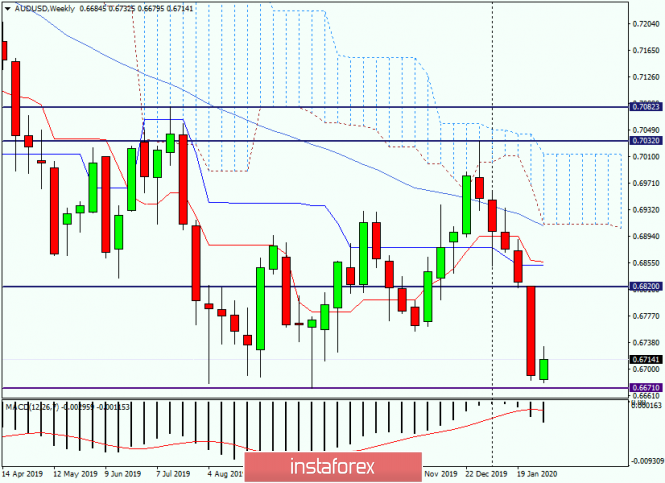
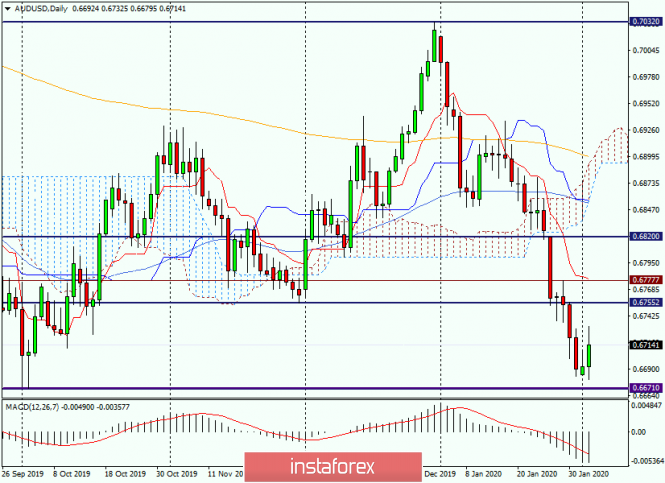
| Analysis and forecast for AUD / USD on February 4, 2020 Posted: 04 Feb 2020 02:26 AM PST Hello dear traders! Today at 03:30 UTC, the Reserve Bank of Australia (RBA) announced its decision on the basic interest rate, and also issued an Accompanying Statement. As expected, the RBA did not change the parameters of its monetary policy, and the discount rate remained at the same level of 0.75%. As for the Accompanying statement, the Bank noted that it is ready to ease monetary policy if necessary. The RBA also said that current rates are appropriate for this time period and will remain so for a specific time only. This year, Australia's economy is expected to reach 2.75% and around 3% by 2021. In terms of this year's inflation as well as the next, the RBA hopes it to be close to 2%. The bank intends to continue to monitor changes in the country's labor market, and the current level of unemployment as the bank's economists assume that it will remain in a certain amount of time. The Australian Central Bank noted the negative impact of low-interest rates on the rate of its national currency, and forest fires and coronavirus were identified as the main risks. The trade war between the US and China is a major uncertainty for the global economy. These are so far all the main points of the Australian Central Bank, and now we move on to analyzing the price charts for the AUD / USD currency pair. Weekly:
As can be clearly seen on the weekly timeframe, the pair completed the last five-day trading with a rather impressive decline. The course was close to reaching a key support level near 0.6670 but still failed to test its strength. From 0.6679, the Australian dollar began a recovery that continues at the time of this writing. Given the strong decline last week, the immediate target of the Aussie bulls will be the January 27–31 highs at 0.6820. A further target of possible growth will be the price area of 0.6852-0.6856, where the Tenkan and Kijun lines of the Ichimoku indicator are located. A break in the support level of 0.6670 and consolidation below this level will signal the persistence of bearish moods in the pair. Daily:
After yesterday's "Hammer" candle with a bull's body, which is a reversal model of candlestick analysis, the pair's growth is really observed today and it's pretty good. In many ways, this is the reaction of market participants to the decision of the Reserve Bank of Australia at the interest rate and the Accompanying Statement. However, in my opinion, there was no significant bullish rhetoric in the comments of the RBA, but the market counted as it counted. It seems that the technical factors influenced the strengthening of the pair to a greater extent as the previous rather protracted downward dynamics, as well as the proximity of the strong support level of 0.6670. As you can see, after reaching today's highs at 0.6732, the quotes slightly decreased, and at the time the review is completed, trading takes place near 0.6717 / 15. In an upward scenario, the nearest targets will be the levels of 0.6755, 0.6777 and, possibly, 0.6820. If the market for the AUD / USD pair is again under the control of the bears, we should expect a decline towards the support level of 0.6670. Perhaps this significant mark will be tested for a breakdown. Important American statistics are not expected today, except for production orders, so trading is likely to be influenced by market sentiment, technical factors and reports on the situation with the coronavirus. For trading ideas, I can offer purchases from current prices (0.6715), but I note that, despite some euphoria from the decision and comments of the RBA, a bearish trend continues in the pair. Based on this, I consider the most relevant sales after the pair rises to the levels of 0.6755, 0.6777, 0.6800, 0.6820 and 0.6830. Successful and profitable trading! The material has been provided by InstaForex Company - www.instaforex.com |
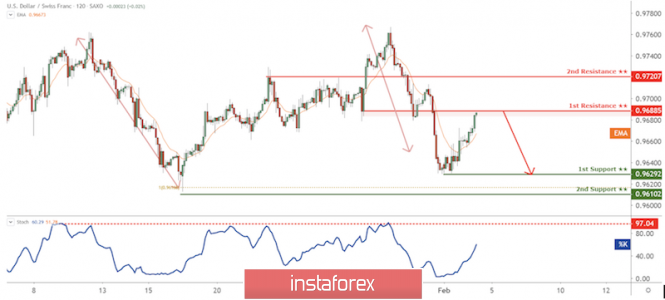
| USD/CHF approaching support, potential bounce! Posted: 04 Feb 2020 02:21 AM PST
Trading Recommendation Entry: 0.9689 Reason for Entry: 50% Fibo retracement, 38.2% Fibo retracement, horizontal pullback resistance Take Profit : 0.9629. Reason for Take Profit: Horizontal swing low support Stop Loss: 0.9721 Reason for Stop loss: Horizontal swing high resistance The material has been provided by InstaForex Company - www.instaforex.com |
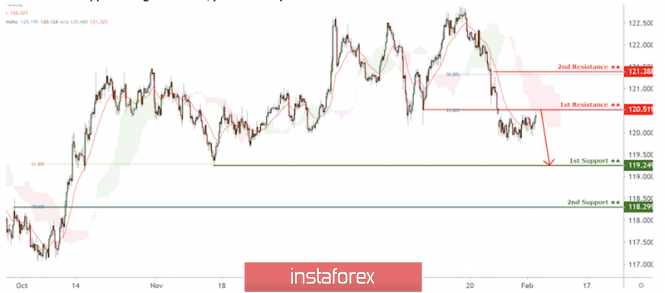
| EUR/JPY approaching resistance, potential drop! Posted: 04 Feb 2020 02:19 AM PST
Trading Recommendation Entry: 120.519 Reason for Entry: 23.6% fibonacci retracement, horizontal pullback resistance Take Profit : 119.249 Reason for Take Profit: Horizontal swing low support, 61.8% fibonacci retracement Stop Loss: 121.388 Reason for Stop loss: 50% fibonacci retracement The material has been provided by InstaForex Company - www.instaforex.com |
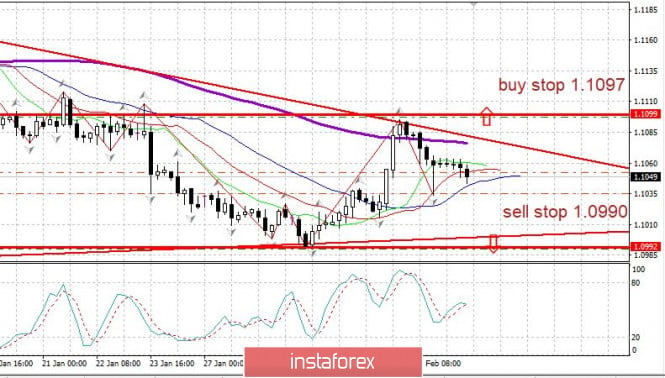
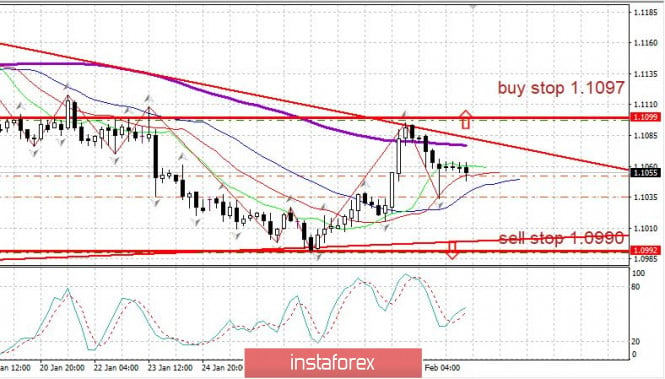
| Posted: 04 Feb 2020 02:14 AM PST Good day, dear traders! I present to your attention, a trading idea for EUR/USD. On Friday, the EUR/USD pair showed a significant increase on the weak dollar. Yesterday, Americans bought euros for the entire American session. A bullish trend is beginning to form, and sellers are held hostage at the round level of 1.11. The price of the purchase is now 20p against a profit of 50p (4 sign). This idea will be relevant as long as yesterday's American buyers do not sell in the market (marked in green). Let's now turn to the daily TF: As you can see, the tool still has goals at the bottom. The potential to reach them is much greater. On the other hand, I do not rule out the possibility that they will remove the bottom first, and then go upwards. Nonetheless, the potential will not change: Good luck in trading and control your risks! The material has been provided by InstaForex Company - www.instaforex.com |
| Trader's Diary: EURUSD on 02/04/2020, China epidemic and nonfarm Posted: 04 Feb 2020 01:20 AM PST
The epidemic in China will remain the main theme until the Chinese authorities manage to stop the increase in the number of cases, or at least significantly reduce the growth rate of diseases. Right now it is increasing to about 10% per day, which is a little bit too much. Currently, there are 20 thousand cases and it is expected that by mid-February, this will double to 40 thousand cases. On the other hand, the epidemic seems to play in favor of the US dollar. And in addition, Trump's victory over impeachment is also in favor of the dollar where Democrats look debilitated. On Monday, the ISM Industrial Index showed industrial growth in the US. This is for the first time in several months. The US employment report for January will be on Wednesday which comes from ADP, while the report on the nonfarm is set on Friday. Both of which are important. EURUSD: Sell from 1.0990. Buy from 1.1100. The material has been provided by InstaForex Company - www.instaforex.com |
| You are subscribed to email updates from Forex analysis review. To stop receiving these emails, you may unsubscribe now. | Email delivery powered by Google |
| Google, 1600 Amphitheatre Parkway, Mountain View, CA 94043, United States | |






No comments:
Post a Comment