Forex analysis review |
- How is coronavirus spreading around the planet? The US, Italy, Spain, China and Iran are at high risk
- Comprehensive analysis of movement options of #USDX vs EUR/USD vs GBP/USD vs USD/JPY (WEEKLY) for March 2020
- GBP/USD. Results of March 10. Pound sterling "repays debts" to US dollar
- EUR/USD. Results of March 10. EU GDP accelerated by 1%. Panic continues to be present in the markets
- EUR/USD. Trump's haste, US inflation, and COVID-19
- GBPUSD at major short-term support
- EURUSD confirms short-term reversal signal and moves below 1.13
- EURUSD and GBPUSD: pound drops amid rumors of new budget rules. Euro tries to stay near weekly lows before an important ECB
- Evening review 03/10/2020 EURUSD. Respite before a new spurt
- March 10, 2020 : GBP/USD Intraday technical analysis and trade recommendations.
- GBP/USD: plan for the US session on March 10. The desire of the pound buyers alone is clearly not enough. The bears are aimed
- EUR/USD: plan for the US session on March 10. The euro is bought around 1.1338. The bullish momentum may resume
- Fed led a crusade against coronavirus: where will the dollar go?
- Trading recommendations for EURUSD pair on March 10
- BTC analysis for 03.10.2020 -The level of $8.460 is strong resistance pivot and good shorting spot, potential for the further
- EUR/USD analysis for 03.10.2020 - Breakout of the symmetrical triangle in the background, watch for selling opportunities
- Analysis for Gold 03.10.2020 - Broken upward channel in the background, potential for the downside movement towards the level
- Gold above $1700: the next step is $2000?
- March 10, 2020 : Corona Virus News is showing an impact on the EUR/USD pair outlook.
- Oil unleashed a war
- Analysis and forecast for USD/JPY on March 10, 2020
- Technical analysis of EUR/USD for March 10, 2020
- Market review. Trading ideas. Answers for questions.
- Trader's diary for March 10th, 2020 for EUR/USD. USD hit 72 rubles, EUR rises to 82 rubles
- Gold's trap for buyers
| Posted: 10 Mar 2020 07:52 PM PDT The Chinese pneumonia virus COVID-2019 has "captured" more than 100 countries around the world. More than 105,000 people are infected, mostly in China. The largest number of infected and deaths is in the "hotbed" of infection - China. Apart from China, Italy has been the most affected at the moment, with more than 6,000 cases of infection. More than 200 people were killed. The entire country is under quarantine. Schools and cinemas have been closed, all sporting events have been canceled, and any events where a large number of people may gather are prohibited. Some regions with the highest number of cases are quarantined. Citizens are not allowed to leave their homes without good reason. According to the current plan, such measures have been taken until April 3. No one knows what will happen after April 3. Everything will depend on whether it is possible to stop the spread of infection in the country. The Italian authorities decided to involve an additional 20,000 doctors and nurses in the fight against the virus. The main thing now is to stop the infection. It is noted that about 600 people are in intensive care, but about 600 have fully recovered. The average age of those who died from the virus is 81 years. It follows that first of all deaths are recorded in the elderly. People with weak, due to age-related reasons, immunity and health. 80% of people who died from the virus had other diseases. Thus, on the example of Italy, we can conclude that the virus is not fatal, but can lead to a fatal outcome if the patient has poor health. Thus, the elderly and people with weak immune systems are primarily at risk. About 3000 cases of infection have been recorded in the UK, five have died. All of them were elderly people with poor health. All who contacted the dead are isolated, including medical staff. The United States also recorded several hundred cases of the disease (about 700). Most are in the New York State, where a state of emergency has already been declared. Several people died. New York Governor Andrew Cuomo believes mass quarantine is the best way to slow the spread of infection. Washington state has also been one of the most infected. The state recorded about 70 cases of the disease. As in many other countries, those who die from the virus are elderly people. In addition, a large number of patients were recorded in Iran - about 6,000. 145 people died. At the same time, firstly, representatives of the medical sphere believe that the real numbers can be much higher, and secondly, two representatives of the Parliament have already died from the coronavirus. Meanwhile, panic is brewing in countries with the highest incidence of the disease. Thank God that so far this word only refers to the desire of people to stock up on all necessary products and not to leave the house without unnecessary need. Therefore, a shortage of certain foods may occur. For example, in the UK, Secretary of Health Matt Hancock urged people not to buy more than they needed, assuring that there was enough food for everyone. The minister also assured that he works with supermarkets in the direction of delivering food and necessary goods to the home in case people have to isolate themselves. However, representatives of UK supermarkets argue that the demand for the most necessary food products is "going wild" and cast doubt on the fact that the authorities will be able to keep the situation under control and provide all citizens with food and basic necessities. One of the directors of large supermarket chains even stated that there were no contacts with the government. Quite unexpectedly, Spain took the lead in the number of cases, where according to the latest data, the number of infected exceeded 1200. According to the Minister of Health of Spain, Salvador Illa, the situation with coronavirus in the country has significantly worsened in recent days. Most infections have been reported in Madrid. Most of the cases are elderly people in nursing homes and employees of these homes. Two weeks quarantine has also been announced in Madrid with the closure of all schools, universities and kindergartens. The material has been provided by InstaForex Company - www.instaforex.com |
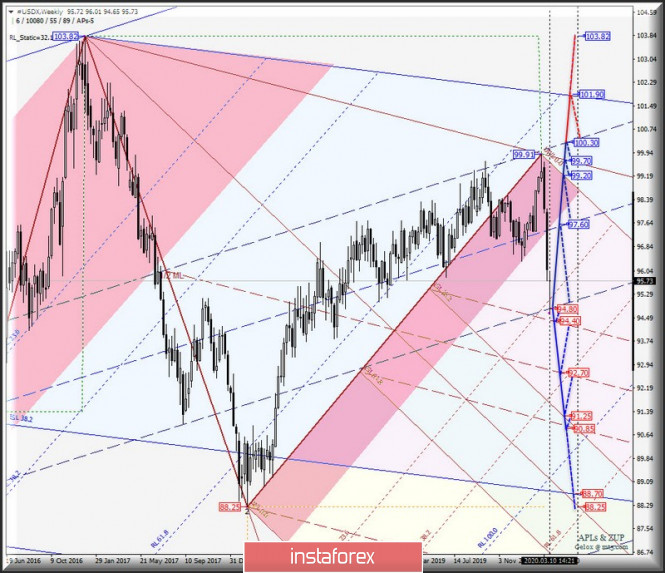
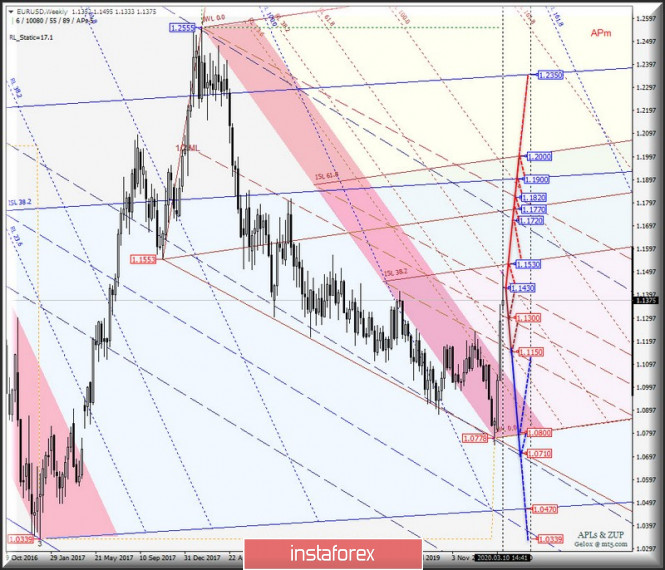
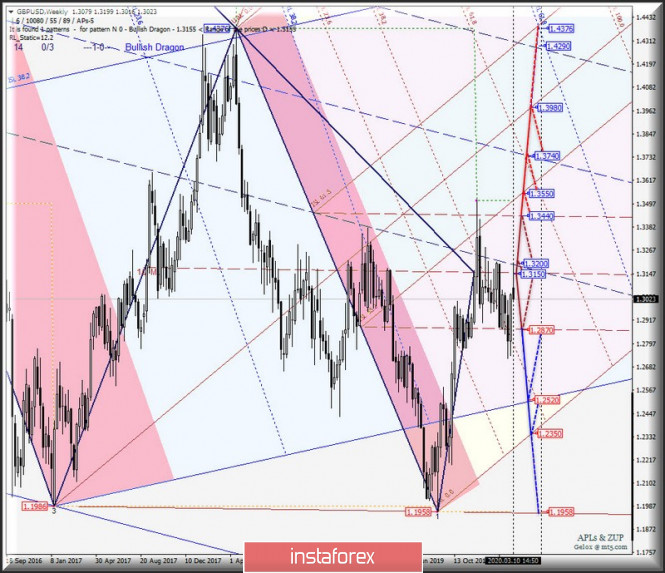
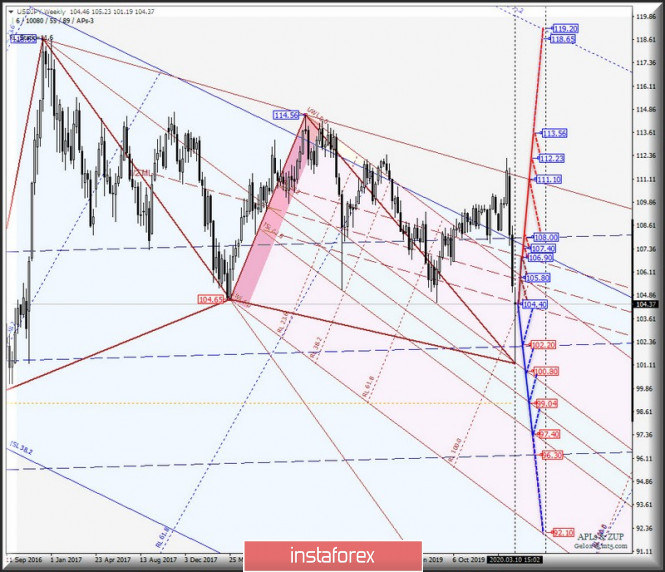
| Posted: 10 Mar 2020 04:35 PM PDT What are the options for the development of the movement #USDX, EUR / USD, GBP / USD and USD / JPY (Weekly) during the spring-summer period of 2020? Intermediate Operational Scale (Weekly) ___________________ US dollar index The development of the #USDX dollar index movement in the spring-summer period of 2020 will continue in the 1/2 Median Line (94.80 - 97.60 - 100.30) of the Intermediate operational scale forks, taking into account initial SSL processing (99.20) and the control UTL (99.70)of the Minor operational scale forks. The markup for developing the mentioned levels is presented on the animated chart. The upward movement of the dollar index can be continued after the breakdown of the upper boundary of the 1/2 Median Line channel (100.30) of the Intermediate operational scale forks and will be directed to the levels: - 101.90 - the initial SSL Intermediate line; - 103.82 - maximum of 01/01/2017. On the other hand, in case of breakdown of the lower boundary (support level of 94.80) of the 1/2 Median Line channel of the Intermediate operational scale forks, the option to continue the development of the downward movement #USDX to the boundaries of the 1/2 Median Line channel (94.40 - 92.70 - 90.85) of the Minor operational scale forks. Marking options for the movement #USDXin the spring-summer period of 2020 is shown on the animated chart. ____________________ Euro vs US dollar The movement of the single European currency EUR / USD in the spring-summer period of 2020 will be due to the development and direction of the breakdown of the boundaries of 1/2 Median Line channel (1.1430 - 1.1300 - 1.1150) of the Minor operational scale forks. The traffic marking in 1/2 Median Line channel of the Minor operational scale forks is shown in the animated chart. Now, in case of breakdown of the lower boundary (support level of 1.1150) of the 1/2 Median Line Minor channel, then the downward movement of EUR / USD can be continued to the initial SSL (1.0800) and control LTL (1.0710) lines of the Minor operational scale forks. Alternatively, in case of breakdown of the upper boundary (resistance level of 1.1430) of the 1/2 Median Line channel Minor, the upward movement of the single European currency can be continued to the equilibrium zone (1.1530 - 1.1770 - 1.2000) of the Minor operational scale forks. The details of the EUR / USD movement options in the spring-summer period of 2020 are shown in the animated chart. ____________________ Great Britain pound vs US dollar Her Majesty's Currency continues to remain on 1/2 Median Line (1.2870 - 1.3150 - 1.3440) of the Minor operational scale forks, respectively, in the spring-summer period of 2020, the development of the GBP / USDmovement will be determined by working out the above levels - the movement details inside the 1/2 Median Line Minor channel are presented on the animated chart. The breakdown of the lower boundary (support level of 1.2870) of the 1/2 Median Line channel Minor - will make it possible to continue the downward movement of Her Majesty's Currency to the initial SSL line (1.2520) of the Intermediate operational scale forks and the initial SSL Minor line (1.2350). On the contrary, the breakdown of the upper boundary (resistance level of 1.3440) of the 1/2 Median Line channel of the Minor operational pitchfork will determine the further development of the GBP / USD movement to the equilibrium zone (1.3550 - 1.3980 - 1.4376) of the Minor operational scale forks. The details of the GBP / USD movement in the spring-summer period of 2020 can be seen on the animated chart. ____________________ US dollar vs Japanese yen The development of the USD / JPY currency movement of the "country of the rising sun" in the spring-summer period of 2020 will be determined by the development and direction of the breakdown of the boundaries of 1/2 Median Line channel (104.40 - 105.80 - 106.90) of the Minor operational scale forks. The detail movements within the 1/2 Median Line Minor channel are presented on the animated chart. The breakdown of the upper boundary (resistance level of 106.90) of the 1/2 Median Line channel of the Minor operational scale forks will lead to the continuation of the upward movement of USD / JPY to the targets: - SSL start line (107.40) of the Intermediate operational scale forks; - the upper boundary of the 1/2 Median Line channel Intermediate (108.00); - control line UTL Minor (111.10); - maximum 112.23 of February 16, 2020; - maximum 114.56 of September 30, 2018. Meanwhile, the breakdown of the lower boundary (support level of 104.40) of the 1/2 channel Median Line Minor will lead to the option of continuing the downward movement of the currency of the "country of the rising sun" to 1/2 Median Line (102.20) of the Intermediate operational scale forks and the boundaries of the equilibrium zone (100.80 - 99.04 - 97.40) of the Minor operational scale forks. We look at the details of the USD / JPY movement in the spring-summer period of 2020 on the animated chart. ____________________ The review was compiled without taking into account the news background. Thus, the opening trading sessions of major financial centers does not serve as a guide to action (placing orders "sell" or "buy"). The formula for calculating the dollar index : USDX = 50.14348112 * USDEUR0.576 * USDJPY0.136 * USDGBP0.119 * USDCAD0.091 * USDSEK0.042 * USDCHF0.036. where the power coefficients correspond to the weights of the currencies in the basket: Euro - 57.6% ; Yen - 13.6% ; Pound Sterling - 11.9% ; Canadian dollar - 9.1%; Swedish krona - 4.2%; Swiss franc - 3.6%. The first coefficient in the formula leads the index to 100 at the start date of the countdown - March 1973, when the main currencies began to be freely quoted relative to each other. The material has been provided by InstaForex Company - www.instaforex.com |
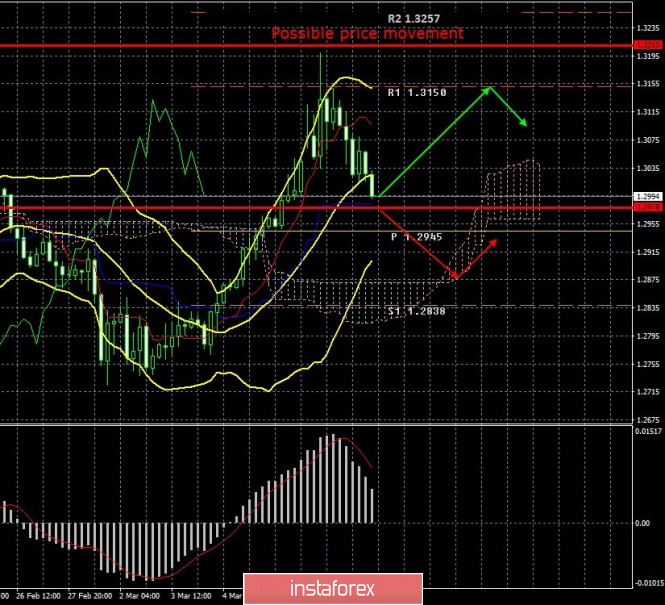
| GBP/USD. Results of March 10. Pound sterling "repays debts" to US dollar Posted: 10 Mar 2020 03:42 PM PDT 4-hour timeframe Amplitude of the last 5 days (high-low): 111p - 103p - 107p - 103p - 165p. Average volatility over the past 5 days: 116p (high). The British pound sterling followed the European currency and began to adjust. Moreover, the British currency grew much weaker against the dollar than the euro, and now - it has adjusted much stronger than the euro. What is it? Market participants recalled that everything is not as good as we would like in the UK? Remember Brexit and the low probability of a trade agreement with the EU? Or were British pound traders simply less likely to panic than the rest? One way or another, but the pound has already adjusted to the Kijun-sen line and so far does not show any signs that it might linger near this line. One gets the impression that the pound has undergone only a general market trend called "getting rid of the dollar", but quickly came to its senses and is now returning to the usual trading mode. If so, then the downward trend may well be resumed now, as the British currency did not have growth factors either. Strange as it may seem, we have not received any important news, messages, and comments from "top officials" from the UK. No new reports on negotiations with the European Union, no new data on the fight against coronavirus, no new comments on possible actions of the Bank of England. Therefore, traders can only guess at the coffee grounds. The main subjects of these divinations are now the possible actions of the BoE and the Federal Reserve. The fact is that, unlike the ECB, the BoE's rates are at a more or less stable level – 0.75%. And the factor of weak monetary policy in Britain compared with the US was one of the main factors along with Brexit, the fall of the British currency in the last three years. However, if the Fed continues to mindlessly reduce the key rate, it will soon catch up with the British regulator. And then one of the main factors for the strengthening of the US dollar against the pound will be offset. Brexit will continue, negotiations on a trade deal that will continue to have a negative impact on the pound, but it is the Fed that can put an end to the hegemony of the US dollar against European currencies. And how can we not remember that Donald Trump strongly opposed the expensive dollar from the very beginning of his term as president? How can we not remember that he blamed all the troubles of the Fed and Jerome Powell personally for high interest rates? How can we not remember the emergency meeting between Powell and Trump in the White House, after which the criticism of the first noticeably subsided? In any case, the Fed has not yet taken a new step to ease monetary policy, and there are still very high chances that the BoE will go for a policy easing in March. This way, the gap can remain. Macroeconomic statistics are currently not available from overseas or Great Britain. Wednesday will only be the only day this week that is full of important macroeconomic data, and the rest of the days will be completely empty. However, even tomorrow, we have no confidence that market participants will respond to the reports. In the last 7-10 days, the markets were completely under the impression of the collapse of stock markets, the fall in the cost of oil, and did not pay attention to the ordinary reports. Whether the period of total ignoring of statistics has ended, we will find out just tomorrow. In the meantime, we can only say that the coronavirus that caused panic in all world markets has not gone away and continues to spread throughout Europe. In Italy, a quarantine has already been declared, and all sports events have been canceled. Many other countries have also taken measures to prevent the possible spread of the virus. Of course, tourism and industrial production are the first to suffer. The latter sector is highly dependent on international activities, import/export operations. However, supply disruptions related to quarantine in some countries, such as China, and the transfer of employees to remote work in many international companies, cannot but affect business activity and production volumes. Oil has already fallen down due to the fact that the demand for it has decreased banally. And demand is reduced when production and consumption of products derived from oil, such as gasoline, are reduced. From a technical point of view, the current movement of the pound/dollar pair is hardly even a correction. This is the British pound's collapse, since this currency has lost almost 200 points during the day. Thus, we can only once again note that now is clearly not the best time to trade, since the pair can travel long distances during the day that cannot be predicted in advance. Recommendations for short positions: The pound/dollar began a strong downward movement on the 4-hour timeframe. It is advised that you sell the British currency not earlier than when the pair has consolidated below the Kijun-sen critical line with the goals of Senkou Span B line and the support level of 1.2838. It is this moment that will allow us to conclude that the trend is changing to a downward one. Recommendations for long positions: Traders are advised to buy the pair again only if quotes return to the area above the critical line with the goal of a first resistance level of 1.3150. When opening any positions, it is recommended to act as carefully as possible and remember about the increased risks. Explanation of the illustration: Ichimoku indicator: Tenkan-sen is the red line. Kijun-sen is the blue line. Senkou Span A - light brown dotted line. Senkou Span B - light purple dashed line. Chikou Span - green line. Bollinger Bands Indicator: 3 yellow lines. MACD indicator: Red line and bar graph with white bars in the indicators window. Support / Resistance Classic Levels: Red and gray dashed lines with price symbols. Pivot Level: Yellow solid line. Volatility Support / Resistance Levels: Gray dotted lines without price designations. Possible price movements: Red and green arrows. The material has been provided by InstaForex Company - www.instaforex.com |
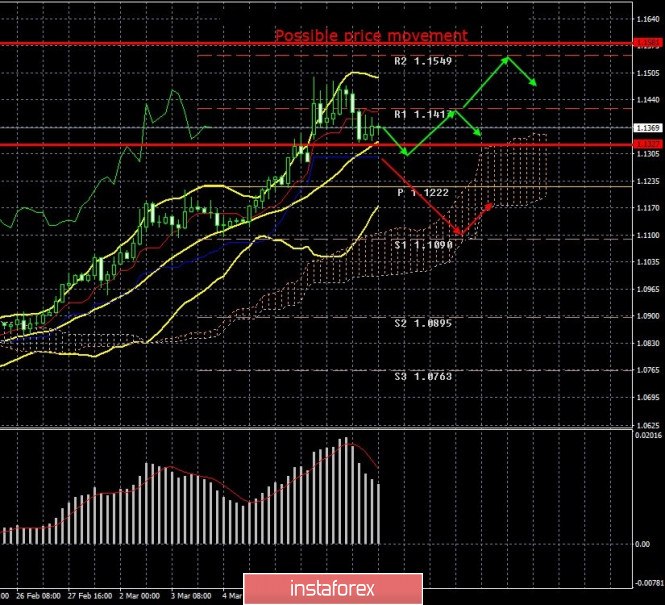
| EUR/USD. Results of March 10. EU GDP accelerated by 1%. Panic continues to be present in the markets Posted: 10 Mar 2020 03:42 PM PDT 4-hour timeframe Amplitude of the last 5 days (high-low): 119p - 92p - 125p - 143p - 156p. Average volatility over the past 5 days: 127p (high). The long-awaited correction began on the EUR/USD pair, but so far it is very weak and unstable. At the moment, the price has not even been able to work out the critical Kijun-sen line, which, by the way, is not so far from it. Thus, a strong upward trend persists, and at any moment, traders can again begin to move the pair up. The panic mood of the market is fully preserved, which is perfectly visible by the volatility indicators, which have been breaking all records in the last ten days. Thus, the market is still very dangerous for opening any positions, since within a few hours the pair can go 100-150 points in any direction. Most importantly, it is very difficult to predict the movement of the euro/dollar pair, as it does not react to macroeconomic statistics. An emergency speech by US President Donald Trump was held tonight, in which he announced negotiations with Congress and the Senate to lower America's payroll tax as part of the fight against coronavirus. Many traders and experts considered this a bear factor. However, we believe that a downward correction has begun. That is, the quotes reduction factors on Tuesday, March 10, are exclusively technical. Firstly, Trump has not yet reduced taxes, so market participants had nothing to respond to. Secondly, during the last 7-8 trading days there were news and messages much more important than this, and all of them were ignored. Meanwhile, the fourth quarter GDP indicator was published in the European Union. The increase was 1% in annual terms. This is very small, but more than experts predicted (+ 0.9%). The increase was + 0.1% in quarterly terms. As you might guess, this publication was also left without market attention. At the same time, most traders are looking forward to further actions by the ECB and the Fed. We have already said that the emergency rate cut looks, to say the least, strange. Yes, the coronavirus continues to spread and slow down the world economy. However, the problem of the epidemic must be solved first of all by medical methods. It is clear that the US central bank decided to play it safe and stimulate the economy in advance, when there were no signs of its slowdown. All recent macroeconomic reports were at a fairly high level. The Fed does not want to allow a repeat of 2008, so it plays "ahead of the curve". At the same time, the more the Fed lowers the rate now, the less room for maneuver it will have in the future. Coronavirus is a dangerous phenomenon for the entire planet and its economy, but it is not the only potential threat. In recent years, there have been many events in the world that have successfully slowed down the economy, but there have been few events that would have stimulated it. It is only worth recalling that GDP and industrial production in the United States have been declining in the past year and a half, even without the coronavirus. The situation is no better in the eurozone, which "distinguished itself" by exactly the same reductions in GDP and industrial production. In addition, global growth rates have been affected by trade wars, mainly between China and the United States. What if new cataclysms occur in the next few years? What measures will the Fed take then? We believe that the actions to reduce the rate in the US is clearly traced to Trump's figure. As analysts, it is difficult for us to judge what is happening in the highest government circles. It is obvious that we do not have all the necessary information to make such conclusions. However, if you simply compare Trump's fierce desire to bring rates to zero and the coronavirus factor, which allows you to legally lower them to the required levels, then some questions arise. For example, isn't the coronavirus a simple excuse? Why not direct all your efforts and financial flows to fight this virus? However, instead of regularly reporting on medical advances in the fight against the virus and new investments in the health sector, Trump declares that the virus will not survive the warm season, then that Americans have nothing to worry about. Now, when the number of cases is growing in the United States, Trump has come under a barrage of criticism for spreading false information. However, he is no stranger to being criticized. Soon, one can expect statements in the style: "the coronavirus is not fair in relation to the United States." Former US coordinator for countering the Ebola virus, Ron Klein, believes the president is misleading American citizens and says obviously false things. According to Klein, the US president is fixated on the "prosperity of America" and carefully denies any problems in the country. That is, Trump's policy is to constantly say how everything is good in America, and that this, of course, is his merit. Such rhetoric is absolutely logical in the run-up to the 2020 elections. It is possible that Trump will also win the coronavirus. Also, according to Klein, there may be many more infected in the United States . Only such a small number of infected people are reported because most states do not conduct any infection tests at all . Accordingly, there is simply no data from many states . Many experts also agree with Klein. "A vaccine in two to three months is absurd," they say. Recommendations for short positions: For selling the euro, we recommend waiting for quotes to consolidate below the critical line. And this is the condition for shorts with the lowest volumes while aiming for a support level of 1.1090. Recommendations for long positions: Euro currency purchases with the target resistance level of 1.1549 can be opened in case of a price rebound from the Kijun-sen line. In any case, it is recommended that you to be as careful as possible with the opening of any positions. Explanation of the illustration: Ichimoku indicator: Tenkan-sen is the red line. Kijun-sen is the blue line. Senkou Span A - light brown dotted line. Senkou Span B - light purple dashed line. Chikou Span - green line. Bollinger Bands Indicator: 3 yellow lines. MACD indicator: Red line and bar graph with white bars in the indicators window. Support / Resistance Classic Levels: Red and gray dashed lines with price symbols. Pivot Level: Yellow solid line. Volatility Support / Resistance Levels: Gray dotted lines without price designations. Possible price movements: Red and green arrows. The material has been provided by InstaForex Company - www.instaforex.com |
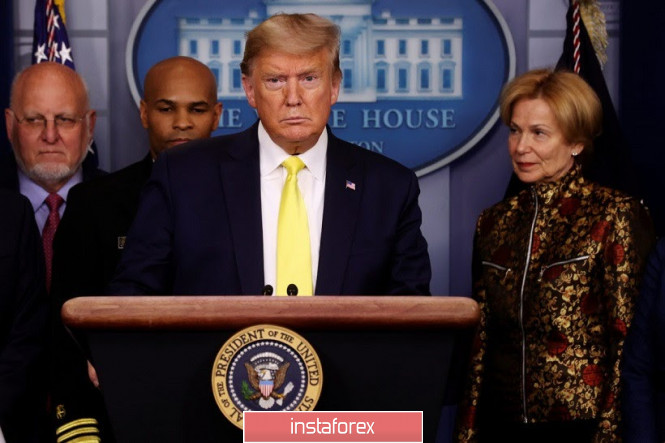
| EUR/USD. Trump's haste, US inflation, and COVID-19 Posted: 10 Mar 2020 03:42 PM PDT The euro-dollar pair sharply dropped this morning, losing almost 150 points in a few hours. But the price slowed its fall in the middle of the 13th figure: the initial euphoria from Donald Trump's speech faded, while the news background regarding the dynamics of the spread of the coronavirus continues to instill fear in investors. Let me remind you that the dollar strengthened throughout the market thanks to the speech of the US President, who promised to support the country's economy. According to him, the White House is now preparing a package of measures to combat the negative impact of the consequences of the coronavirus epidemic on the US economy. The announced measures will affect, in particular, income tax and loans for small businesses. Trump told reporters that a possible payroll tax cut or "very substantial" tax relief will be discussed at an upcoming meeting with congressional Republicans. Dollar bulls were enthusiastic about this news, which became a kind of "spoon of honey in a barrel of tar". After a series of negative infopods for the US currency, the White House's intentions were able to provide significant support to the greenback. At the same time, the bears of the EUR/USD pair were not able to develop success – after reaching the local low of 1.1330, the pair stopped its fall and started marking time, even showing attempts to grow. Looking ahead, it should be noted that the pair can still go down to the area of the 12th figure and even test the nearest support level of 1.1190 (the Tenkan-sen line on the daily chart) - especially if the White House's intentions are confirmed, and the ECB announces a monetary policy easing the day after tomorrow. But sales look very risky at the moment. First, there was information on the market that Trump hastened to announce such large-scale changes. According to the US press (in particular, CNBC), the White House is not yet ready to offer Congress an incentive program that would limit the negative impact of the coronavirus. So, according to unnamed sources, the statement of the American leader caught economic advisers and administration officials by surprise, since there is no formed program yet, and the corresponding ideas are under discussion. Secondly, at the moment, any more or less loud statement by Trump must be viewed through the prism of the upcoming presidential election. The "convenient opponent" in the form of Democrat Sanders continues to lose points – according to the latest polls, Biden is ahead of him by 16%. With a high probability, we can assume that he will become the winner of the primaries. Therefore, the current head of the White House, who is already famous for his populism, could not help but use the situation with the coronavirus in his favor. But the de facto "exit" result may be more modest than market expectations. Especially since Trump only announced consultations with Congress, and not specific economic measures. By the way, House speaker Nancy Pelosi and Senate minority leader Chuck Schumer have already told reporters that any payroll tax cut should only be taken against those affected by the virus. While the head of the White House announced a general tax relief. In other words, the market began to doubt that the Trump administration will take large-scale and, accordingly, effective steps to counter the negative impact of the coronavirus. In any case, today all attention will be focused on the announced press conference of the US President. If the market is disappointed with the proposed measures, the dollar will collapse again "on all fronts". Meanwhile, the Federal Reserve is preparing to further reduce the interest rate – at least, almost all experts and currency strategists are sure of this. The market is only arguing about how aggressive the actions of the US regulator will be. According to some analysts, the Fed will limit the rate cut to 25 points in March, while others allow a reduction of 50 or even 75 points. By the way, today Trump once again criticized the Fed, calling the central bank a "pathetic, slow moving Federal Reserve, headed by Jay Powell". He called on the central bank to immediately reduce the base interest rate "to the level of competing countries." Thus, Trump's bellicose rhetoric may provide temporary support for the US currency – the Fed's dovish intentions will in any case put background pressure on the greenback. If the previously announced measures are called into question (for example, Trump will accuse the congressmen of "intransigence"), the EUR/USD pair will quickly return to its previous positions. The decline in US inflation may also put additional pressure on the dollar. The preliminary data for February will be released tomorrow. According to forecasts, the overall consumer price index will show a negative trend: on a monthly basis, it will slow to zero, and to 2.2% on an annual basis. Core inflation should come out at the level of January - both in monthly and annual terms. If the indicators come out at the expected level, the dollar is unlikely to react to the release. However, any deviation from the forecast values can raise the volatility of the pair. The material has been provided by InstaForex Company - www.instaforex.com |
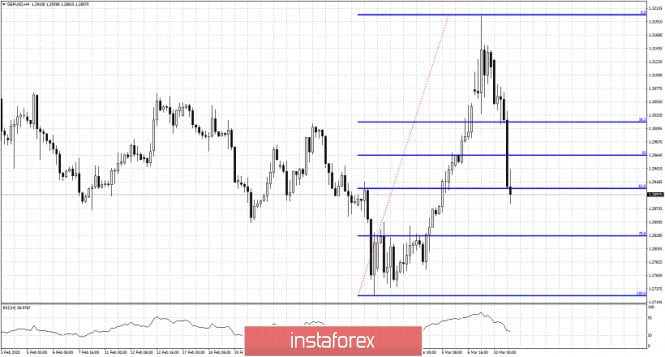
| GBPUSD at major short-term support Posted: 10 Mar 2020 02:00 PM PDT GBPUSD as expected has pulled back towards the 61.8% Fibonacci retracement level of the entire move higher from 1.2775 to 1.32. Support is critical for the short-term at 1.29 and at I expect at least a bounce from current levels.
|
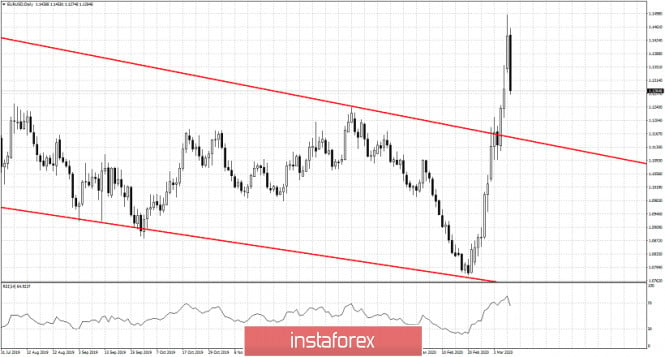
| EURUSD confirms short-term reversal signal and moves below 1.13 Posted: 10 Mar 2020 01:55 PM PDT EURUSD as we explained in our last analysis has most probably topped and is looking for a healthy pull back towards 1.1230-1.1135. Our first target is getting very close as price is now trading around 1.1280.
The RSI in the Daily chart has just started turning lower. I do not expect at this point the RSI to fall to oversold levels but I expect a pull back and a try for a new high both in EURUSD and in the RSI. My most probable target area for this pull back is at the upper wedge boundary where we could see a back test of the break out area at 1.1160. The material has been provided by InstaForex Company - www.instaforex.com |
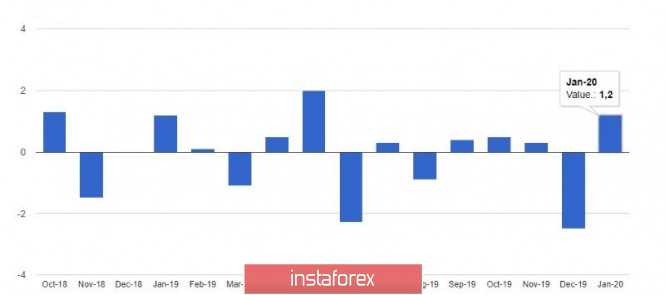
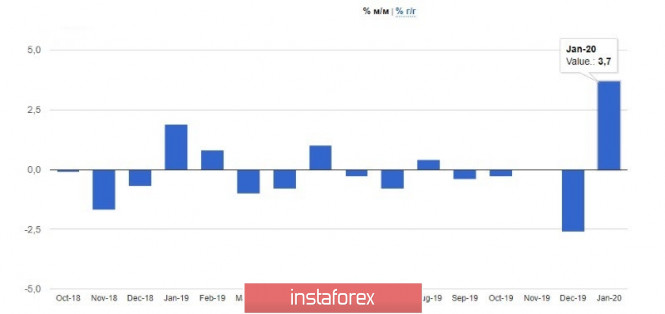
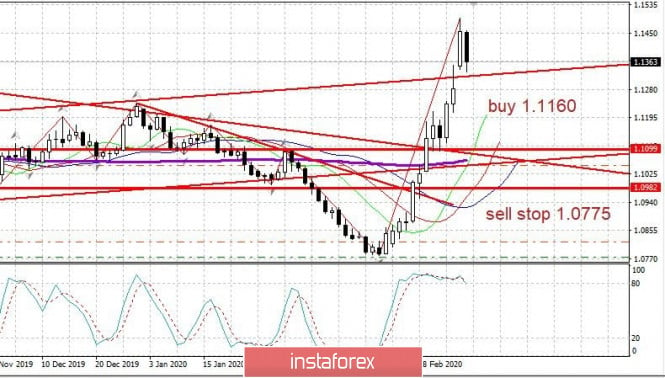
| Posted: 10 Mar 2020 08:17 AM PDT Talk about what the European Central Bank will do at its meeting this Thursday continues to bring the market back to its senses, especially the European currency, which managed to update the 15th figure at the beginning of the week, but now it has adjusted to the support area of 1.1350. Almost everyone is confident that the ECB will expand its asset purchase program, but as for the key interest rate, it may remain unchanged. Only the deposit rate will be reduced by 10 bps. The expansion of the asset repurchase program can be doubled, from 20 billion euros per month to 40 billion euros. The terms of the TLTRO targeted long-term refinancing program can also be significantly eased. As I noted above, the euro remains under pressure amid concerns about such programs, as well as due to the likely reduction in interest rates. However, the spread of the coronavirus will continue to maintain demand for risky assets and put pressure on the dollar and US bond yields. On the other hand, traders ignore the good fundamental statistics for the eurozone countries, since, most likely, next month's reports will clearly be negative, since the coronavirus epidemic has seriously affected the European continent. Take at least one Italy, where the quarantine was extended until April 5 this year. All borders and educational institutions have been closed, and all sporting events have also been canceled. I noted above that data on industrial production in France in January of this year were ignored by traders, even though production was restored after the end of a series of strikes that were related to the pension reform. According to a report by the statistics Agency Insee, industrial production increased by 1.2% in January compared to December, while economists had forecast an increase of 1.7%. Let me remind you that in December 2019, production fell by 2.5% at once. Growth was observed in all sectors. Thus, production in the manufacturing industry increased by 1.2%, and in construction by 1.8% at once. The energy sector received the least support – 0.9%. In Italy, industrial production also turned out to be much larger than economists had predicted. However, as I noted above, all reports were prepared before the coronavirus outbreak and should not be taken seriously. According to a report by the statistics Agency Istat, industrial production in Italy increased by 3.7% in January this year compared to December. Economists had expected growth of only 2%. Let me remind you that in December, production fell by 2.6% at once. As for the technical picture of the EURUSD pair, the support border has shifted to the 1.1338 area. A break in this range will increase the pressure on risky assets, which will lead to an update of the lows in the area of 1.1280 and 1.1240. The return of euro buyers to the market will be indicated by the breakout of the 1.1395 resistance, which will open a direct road to the week's highs in the area of 1.1460 and 1.1490. GBPUSD The British pound remains under pressure after a report on the weakening of retail sales, which is directly related to the February bad weather. According to the data, retail sales increased by only 0.1% in February compared to the same period last year, while there was an annual growth of 3.2% in February 2019. Experts expected a jump in food sales amid the spread of the coronavirus, but there was no significant spike. Also, the improvement in consumer sentiment did not lead to an increase in sales. Rishi Sunak, the British Finance Minister, is expected to announce a package of measures today that will address the consequences of the coronavirus epidemic, but this is unlikely to support the British pound, as it will lead to changes in budget rules that will keep the budget deficit for a longer period than previously expected. The material has been provided by InstaForex Company - www.instaforex.com |
| Evening review 03/10/2020 EURUSD. Respite before a new spurt Posted: 10 Mar 2020 07:51 AM PDT The markets paused after heavy moves on Monday. Oil stopped at around $33.70 - after the collapse on Monday due to the outbreak of the OPEC-Russia price war. Furthermore, the news on the coronavirus is very negative - but the market will wait for the latest data on the dynamics of the disease in the morning on Wednesday. What is important now? Will there be new large foci of the disease - more than 3-5 thousand people - other than the known ones (China, South Korea, Italy, Iran). We look at Germany and France. We look at the growth of patients per day - more than +10% per day or not? This task is for Wednesday morning. The US market, as we can see, shows a good rebound +3.5% in indices - after a collapse of -7% on Monday. Today will probably be a day of respite - and a new report on coronavirus on Wednesday will set the dynamics. EURUSD: We keep purchases from 1.1100 and wait for a new approach to the top. We buy from a strong pullback - no higher than 1.1200. The material has been provided by InstaForex Company - www.instaforex.com |
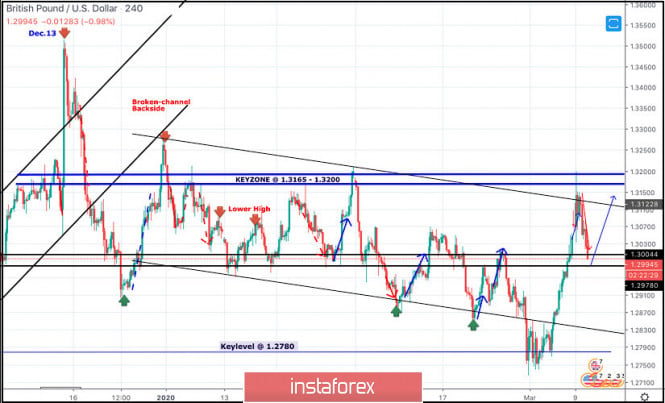
| March 10, 2020 : GBP/USD Intraday technical analysis and trade recommendations. Posted: 10 Mar 2020 07:48 AM PDT
In the period between December 18th - 23rd, bearish breakout below the depicted previous bullish channel followed by quick bearish decline below 1.3000 were demonstrated on the H4 chart. However, Immediate bullish recovery (around 1.2900) brought the pair back towards 1.3250 (backside of the broken channel) where the current wide-ranged movement channel was established below 1.3200. Since January 13, progressive bearish pressure has been built over the price zone of 1.2980-1.3000 until February 5. On February 6, recent bearish breakdown below 1.2980 enhanced further bearish decline towards 1.2890 (the lower limit of the movement channel) where two episodes of bullish rejection were manifested on February 10th and 20th. Shortly after, the lower limit of the channel around 1.2850 has failed to provide enough bullish Support for the GBPUSD pair. That's why, further bearish decline was expressed towards the nearest DEMAND level around 1.2780 where significant bullish rejection and an inverted Head & Shoulders reversal pattern was demonstrated in the period between Feb. 28 - March 4 especially after The Fed unexpectedly cut rates by half-point for the first time since 2008 to protect against an anticipated slowdown of US economy for the fear of a possible Corona Virus outbreak. Hence, a quick bullish movement was demonstrated towards the price zone of 1.2980-1.3000 which has failed to offer enough bearish pressure on the GBPUSD pair. The current bullish recovery was expected to pursue towards 1.3150-1.3200 where bearish rejection and bearish pullback was expected to exist. Earlier Yesterday, Early signs of bearish rejection were manifested indicating a high-probability bearish pullback opportunity towards 1.2980. The current price zone of 1.2980-1.3000 stands as a prominent demand-zone to be watched for bullish rejection and a valid BUY entry. On the other hand, bearish persistence below 1.2980 enhances the bearish side of the market towards 1.2870 then 1.2830 if enough bearish momentum is maintained. The material has been provided by InstaForex Company - www.instaforex.com |
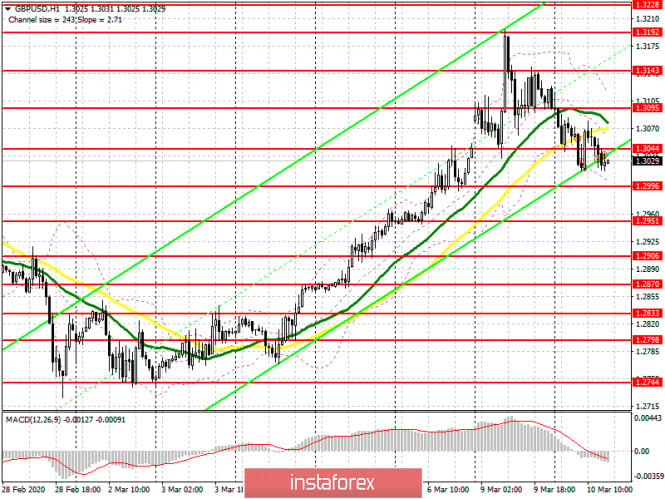
| Posted: 10 Mar 2020 07:24 AM PDT To open long positions on GBPUSD, you need: In the first half of the day, after a sharp decline in the pound, the bulls tried to return to the support level of 1.3044 but failed to do so. As a result, the pound remained under pressure. The task of GBP/USD buyers remains the same – it is a breakthrough and consolidation above the resistance of 1.3044, which will necessarily lead to repeated purchases in the area of the maximum of 1.3095, and it is quite possible to update the area of 1.3143, where I recommend fixing the profits. If the bulls do not show activity in the near future, it is best to count on long positions only after forming a false breakdown in the resistance area of 1.2996 or buy immediately for a rebound from the minimum of 1.2951. All attention will continue to shift to news about the coronavirus and negotiations between the UK and the EU. To open short positions on GBPUSD, you need: Sellers managed to cope with the level of 1.3044, which I paid attention to this morning, and fixing below this range keeps the downward potential in the pound, which in the near future may lead to a support test of 1.2996. The lack of activity among sellers in this area is likely to push GBP/USD even lower to a minimum of 1.2951, where I recommend fixing the profits. In the scenario of buyers returning their resistance to 1.3044, I recommend that short positions be postponed only until the test of 1.3095, and a false breakdown is formed there, or sell the pound immediately on a rebound from the maximum of 1.3143. Signals of indicators: Moving averages Trading is conducted below the 30 and 50 daily averages, which indicates that the downward correction potential is still there. Bollinger Bands A break in the lower border of the indicator around 1.3010 will increase the pressure on the pair. Growth will be limited to the upper level in the area of 1.3120.
Description of indicators
|
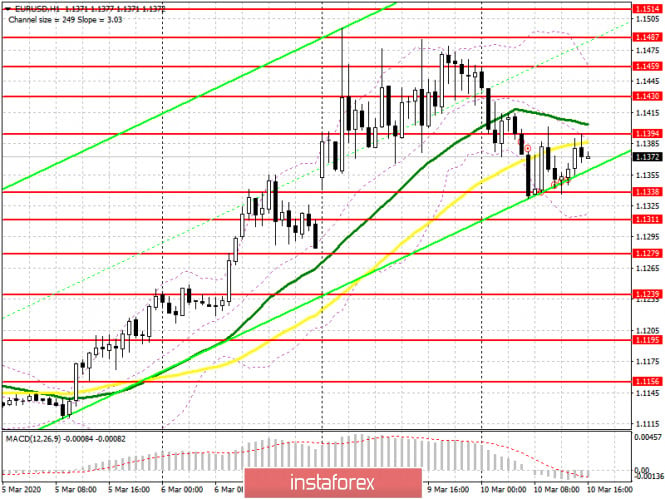
| Posted: 10 Mar 2020 07:22 AM PDT To open long positions on EURUSD, you need: Data on the growth of industrial production in France and Italy did not impress traders, who continued to close long positions in the euro. In the morning forecast, I paid attention to purchases in the support area of 1.1338, which happened. At the moment, while trading is above this range, the bulls will try to build a new lower border of the ascending channel, as well as regain the resistance of 1.1394. Only in this scenario can we expect the upward trend to continue with the test of the highs of 1.1430 and 1.1459, where I recommend fixing the profits. If the pressure on EUR/USD continues in the second half of the day, then a repeated test of the minimum of 1.1338 will certainly lead to its breakdown. In this scenario, it is best to return to long positions on a false breakdown from the support of 1.1311 or buy the euro immediately on a rebound from the minimum of 1.1279. To open short positions on EURUSD, you need: The situation with the spread of coronavirus continues to maintain demand for risky assets, and when important support levels are updated, the bulls return to the market. In the second half of the day, the first signal to open short positions will be the formation of a false breakdown in the resistance area of 1.1394, but the more important task for sellers will be to repeat the test and break through the support of 1.1338. Only this will increase the pressure on the pair and lead to an update of the lows of 1.1311 and 1.1279, where I recommend fixing the profits. In the scenario of EUR/USD growth in the second half of the day above the resistance of 1.1394, it is best to return to short positions on the rebound from the maximum of 1.1430 and even higher, from the resistance of 1.1459. Signals of indicators: Moving averages Trading is conducted just below the 30 and 50 moving averages, which indicates that the correction potential is still in the second half of the day. Bollinger Bands In case of further decline, the euro will be supported by the lower border of the indicator around 1.1311, while growth will be limited to the upper level in the area of 1.1459.
Description of indicators
|
| Fed led a crusade against coronavirus: where will the dollar go? Posted: 10 Mar 2020 06:45 AM PDT Leading central banks declared war on the coronavirus, and analysts were divided on the future dynamics of the dollar. The Federal Reserve unexpectedly lowered the interest rate by 0.5% last Tuesday. Several central banks followed its example, and now the market is waiting for similar actions from other regulators. CIBC and Deutsche Bank forecast further depreciation of the US currency due to a reduction in the differential of returns between the United States and other countries. Goldman Sachs and JPMorgan, by contrast, are waiting for the greenback to strengthen amid increased demand for reliable assets. At the beginning of the year, experts from a number of banks predicted a drop in the USD rate, which instead rose in January – February. However, then the expectation that the Fed would lower borrowing costs to combat the deterioration of financial conditions due to the coronavirus outweighed the attractiveness of the dollar carry and the US currency fell in price. Fed Chief Jerome Powell promises to take additional measures to support the national economy, if necessary. "The decrease in US rates by 0.5% immediately strengthened our bearish views on the dollar. The greenback's reputation as a highly profitable defensive currency has been seriously affected. In the near future, we expect a further depreciation of the dollar against the euro and the yen," said CIBC strategists. Deutsche Bank experts recommend investors to stay in short positions in the US dollar against the euro, the yen and the Swiss franc. They believe that a reduction in the differential of returns between the United States and other countries will provoke foreign investors to sell the US currency. Meanwhile, JPMorgan believes that the potential for USD depreciation is limited. "History suggests that simultaneous easing of monetary policy around the world usually provides support for the US currency. There have been four such episodes in the recent past, including October 2008 and November 2011. On November 30, 2011, the Fed lowered the interest rate, and the USD index rose by 1.7% the following month," the bank's analysts said. They advise investors to stay in long positions on defensive currencies, including the US dollar, waiting for further deterioration in the global economy. The same view is shared by strategists at Goldman Sachs. "If the market remains volatile, as we predict, it will be difficult for risky currencies to compete with the US one. The yield differential between the dollar, euro and yen will continue to shrink, as the Fed has the ability to cut rates, while the ECB and the Bank of Japan have almost none. At the same time, central banks in some developed and most developing countries can and will do this, which will support greenback," they said. The material has been provided by InstaForex Company - www.instaforex.com |
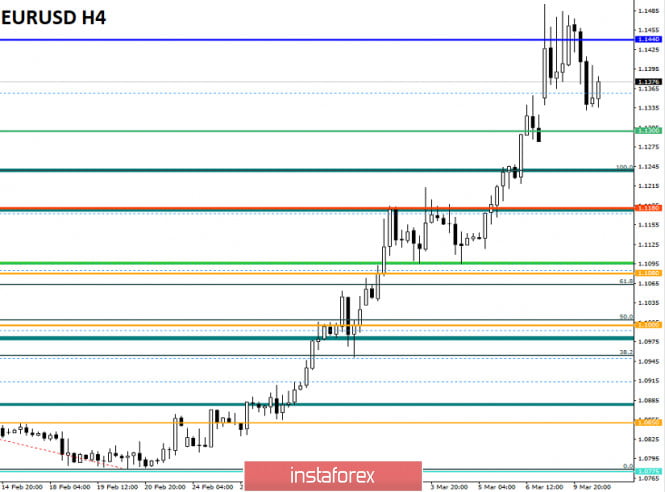
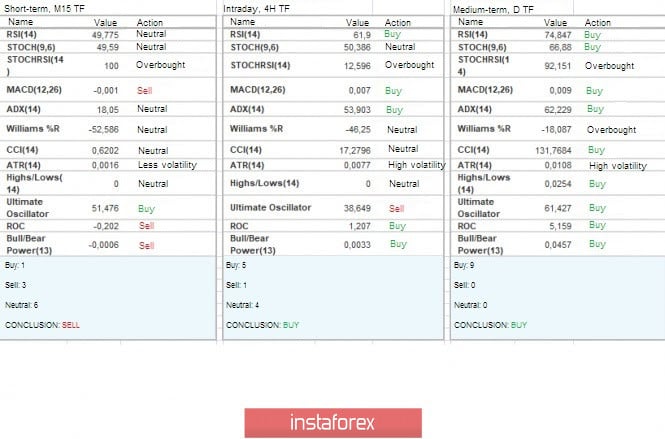
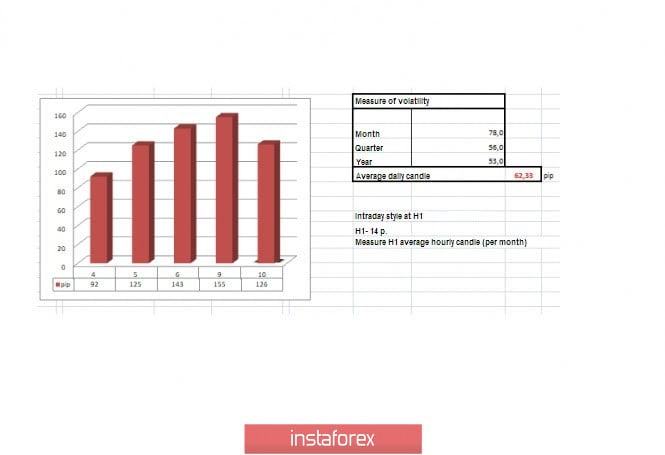
| Trading recommendations for EURUSD pair on March 10 Posted: 10 Mar 2020 05:55 AM PDT From a comprehensive analysis, we see the heights at which the trend change is ringing. Now about the details. The week began with a loud gap - a size that exceeded the average daily candle (68 points). Buyers were already charged, but this did not seem enough for them. The upward movement resumed and in the area of the Pacific session, the quote draws a momentum towards the mark of 1.1500, having such high activity that the stops crunched unusually loudly. Holding the quote at the heights of 1.1440/1.1480 led to a wave of discussions about changing the medium-term trend, which had a real basis for implementation in terms of technical analysis. In a short period of time, the current circumstances in the world did not spare the market. Just in two weeks, the quote was able to do what at other times took a year. I don't think it's worth counting the fixed price at 1.1440/1.1480 as a reference point in the trend change. Such high speed, charged with information bursts, carries a local character and here we need not just fixing, but consistent development with news support. Is it worth catching price trends now, or putting forecasts for the month ahead? I do not think so since the external noise is so great that speculators will literally not let you navigate in space. Now the most suitable method is to work on the noise and surge, that is, to become a speculator. It is worth considering that having a phenomenon with mega-activity is short-term. If you are not confident in your abilities, and this style does not suit you, it is better to sit out of the market. In terms of volatility, we see that ultra-high indicators continue to please speculators, and the past day exceeds the daily average by 150%. Volatility details: Monday-152 points; Tuesday-118 points; Wednesday-92 points; Thursday-125 points; Monday-155 points. The average daily indicator relative to the volatility dynamics is 62 points (see the volatility table at the end of the article). Analyzing the past day by the minute, we see the same gap at the start, where the upward momentum is set. Already in the period of 3:30-3:45, there are ascending candles that lead us to the value of 1.1495. The subsequent oscillation had wide borders of 1.1370/1.1475, where everything ended at a concentration near the upper frame. As discussed in the previous review, many traders entered long positions at the time of the breakout of the maximum on December 31 (1.1239). The first fixing point was in the area of the level of 1.3000 and the subsequent coordinates are 1.1400/1.1440. Looking at the trading chart in general terms (the daily period), we see a vertical move, where locally flew to the levels of January last year. The exchange rate change is somewhat similar to 2017, but the activity is still higher. The news background of the previous day included data on industrial production in Germany, where the decline has slowed, but we are still in a hole: Previous -5.3%; Current -1.3%. The main driver of all the jumps was the collapse of the oil market, where the rate of a barrel, WTI fell below $30, and Brent fell to the area of $34. The reason for such a significant decline was the news that OPEC+ could not agree on a further reduction in oil production, and the existing agreement ceases to operate on April 1. Panic hit the entire market, and the dollar began to lose its position against almost all currency pairs, and this is mainly due to the fact that American companies that work on the production of shale oil and gas may be bankrupt. Now we understand the reason for such a sharp strengthening of the single currency, where the existing overheating recovery is simply necessary. Today, in terms of the economic calendar, we have data on eurozone GDP for the fourth quarter, where another estimate confirms a slowdown from 1.2% to 1.1%, but it is worth considering that we predicted a slowdown to 0.9% at all. Thus, the best data locally slowed the rapid recovery of the dollar, after its significant decline. Further development Analyzing the current trading chart, we see a consistent recovery process, where the level of 1.1300 stands in the way of quotes, and the current development is carried out relative to the framework of the recent gap. If the given downward move in the recovery process does not undergo an external background, then the existing gap can play a strengthening role, just in the direction of the level of 1.1300. In terms of emotional mood, we see that the coefficient of speculative positions is breaking new records, and the external background helps it in this. Detailing the available period every minute, we see that the main round of the recovery process came to us during the Pacific and Asian trading sessions, where the quote passed more than 100 points. The subsequent oscillation was in terms of oscillation from the upper boundary of the gap. In turn, speculators have probably already worked on a partial recovery, where they are currently fixing and placing the next orders. So, new deals are considered in terms of a local move towards the level of 1.1300. It is likely to assume that the recovery process will still be able to roll back the quote in the direction of 1.1300-1.1285, where the point for entering local positions is located near the middle of the gap - 1.1330. We will consider a more significant descent after fixing the price below 1.1285. Based on the above information, we will display trading recommendations: - Buy positions are considered if there is a sharp change in trading interest and the price is fixed higher than 1.1410. - We consider selling positions if the price is fixed at the value of 1.1330, with the prospect of a move to 1.1300-1.1285. Indicator analysis Analyzing different sectors of timeframes (TF), we see that due to the rapid upward movement in history, the indicators of technical instruments mainly signal purchases. It is worth considering that the minute intervals are conditionally between the neutral and descending signal, and the hour periods are between the ascending and neutral signal. Volatility for the week / Volatility Measurement: Month; Quarter; Year. The volatility measurement reflects the average daily fluctuation from the calculation for the Month / Quarter / Year. (March 10 was based on the time of publication of the article) The volatility of the current time is 126 points, which is already higher than the daily average by 103%. It is likely to assume that a slight acceleration is still possible, just in the direction of the level of 1.1300. Key levels Resistance zones: 1.1440; 1.1550; 1.1650*; 1.1720**; 1.1850**; 1.2100. Support zones: 1.1300; 1.1180; 1.1080**; 1.1000***; 1.0950**; 1.0850**; 1.0775*; 1.0700; 1.0500***; 1.0350**; 1.0000***. * Periodic level ** Range level *** Psychological level ***** The article is based on the principle of conducting a transaction, with daily adjustments. The material has been provided by InstaForex Company - www.instaforex.com |
| Posted: 10 Mar 2020 05:47 AM PDT Industry news:
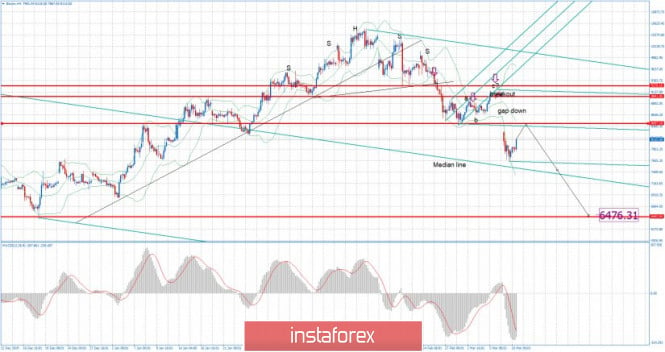
In brief China appears to have brought its coronavirus epidemic under control, with new cases slowing. The global Bitcoin hashrate didn't drop off during the peak of China's epidemic in February. That's despite China accounting for two thirds of the global Bitcoin hashrate. China's drastic measures in response to the coronavirus outbreak appear to have brought the epidemic under control—and the country's Bitcoin mining industry seems to have shown no signs of slowing down during the crisis. Although half of Bitcoin's hashrate comes from Chinese mining pools, it has consistently set new highs throughout the past two months, with no major drop off during the height of the coronavirus crisis in February. Technical analysis: BTC been trading upwards. In my opinion, the BTC is in upward correction phase and the level at $8.460 seems like a strong resistance level and potential short-zone. In the background, there is the gap down and the BTC is trying to test the gap area. There is no indication of any reversal yet. Watch for selling opportunities on the ralllies with the main target at $6.475. MACD is showing the new momentum down, which is good confirmation for the further downside. Major resistance is set at the price of $8.460 Support levels are set at the price of $7.615 and $6.476 The material has been provided by InstaForex Company - www.instaforex.com |
| Posted: 10 Mar 2020 05:37 AM PDT
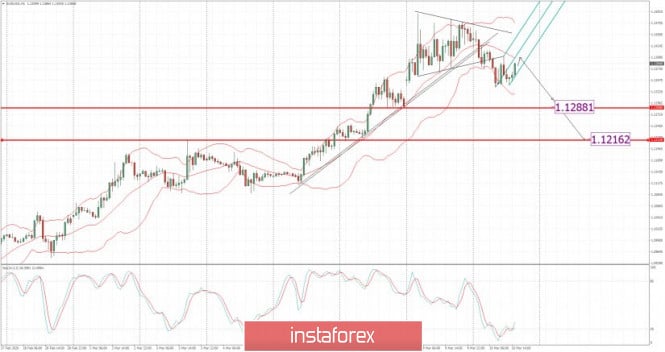
EUR/USD been trading sideways at the price of 1.1385.I found the breakout of the contracting flat pattern, which is first indication for potential bigger downside movement.I would still watch selling opportunities on the rallies with the main targets at 1.1288 and 1.1216. In the background, there is the fake breakout of the breakout of the upward channel, which is good confirmation for our bearish view. Stochastic oscillator is showing overbought condiiton. Resistance levels are set at the prrice of 1.1400 and 1.1495 Support levels are set at the price of 1.1330, 1.1288 and 1.1215 The material has been provided by InstaForex Company - www.instaforex.com |
| Posted: 10 Mar 2020 05:26 AM PDT
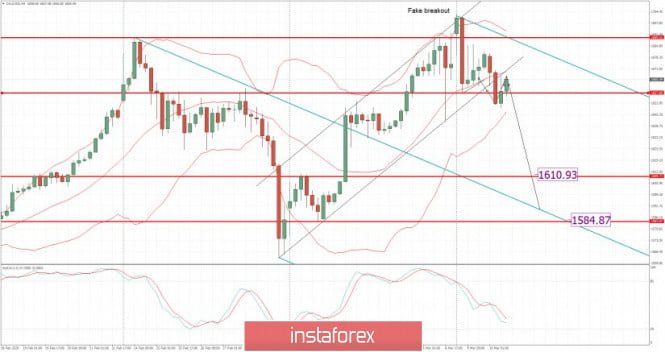
Gold been trading sideways at the price of $1.667.Today, we got the breakout of the upward channel, which is first indication for potential bigger downside movement.I would still watch selling opportunities on the rallies with the main targets at $1.610 and $1.584 (Pitchfork median line). In the background, there is the fake breakout of the major swing high at $1.689 and the breakout of the upward channel, which is good confirmation for our bearish view. Stochastic oscillator is showing downside cycle . Resistance levels are set at the prrice of $1.689 and $1.702. Support levels are set at $1.657, $1.641 and $1.610 The material has been provided by InstaForex Company - www.instaforex.com |
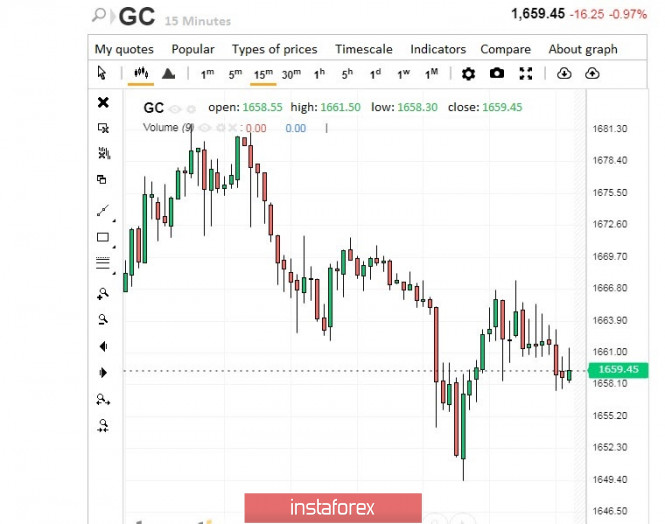
| Gold above $1700: the next step is $2000? Posted: 10 Mar 2020 05:26 AM PDT The yellow metal feels confident amid sagging oil and a slowdown in global financial markets, justifying the status of a safe haven asset. The cost of precious metals surged at the beginning of the week, although experts are confident that it is unlikely for it to stay in high positions for a long time. The yellow metal was trading above $1,700 per ounce on Monday, March 9, surpassing 7-year highs. Experts explain the rapid rise in precious metals by the total spread of the coronavirus COVID-19 and the deafening collapse of oil prices. Recall that black gold prices dipped 30% after Saudi Arabia announced plans to dramatically increase oil production, and OPEC+ countries could not agree to reduce the volume of raw materials. According to experts, the key factors supporting the gold market are negative interest rates, increased market risks, aggravation of crisis phenomena in the world economy and the raging epidemic of coronavirus COVID-19. Many experts are certain that the yellow metal is the only reliable refuge of investors, which is not afraid of any cataclysms. The sharp rise in the price of precious metals forced many analysts to reconsider their previous forecasts. Many of them expect further gold growth up to $1900– $2000 per ounce. However, the currency strategists of a number of large banks believe that the precious metal will not hold at $1,700 or more, but will slightly fall back from these levels. This forecast was confirmed on Tuesday, March 10. Gold is currently trading near $1,659– $1,660 per ounce. Most analysts expect a slight decrease in the cost of precious metals in the near future. However, in the long run, gold will be able to regain its lost positions and strengthen them, experts said. The yellow metal is one of the most liquid assets and the most preferred for investors, especially during periods of political and economic crises. A number of currency strategists are awaiting its sale to compensate for losses on oil, stocks and other financial instruments. The material has been provided by InstaForex Company - www.instaforex.com |
| March 10, 2020 : Corona Virus News is showing an impact on the EUR/USD pair outlook. Posted: 10 Mar 2020 04:49 AM PDT
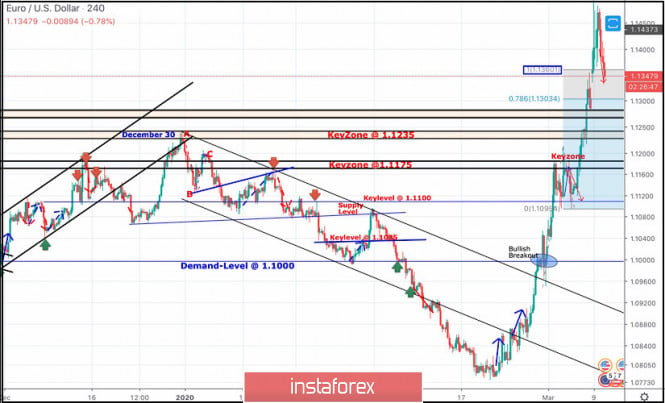
On December 30, a bearish ABC reversal pattern was initiated around 1.1235 which turned the technical outlook into bearish. Since then, the EURUSD pair has trended-down within the depicted bearish channel until few weeks ago, when extensive bearish decline established a new low around 1.0790 especially after Coronavirus news has delivered a bump to non-volatile Currency Markets. This was where the EUR/USD pair looked OVERSOLD after such a sudden quick bearish decline. Hence, Intraday traders were advised to look for signs of bullish recovery around the price levels of (1.0790). On February 20, recent signs of bullish recovery were demonstrated around 1.0790 leading to the current steep bullish movement towards 1.1000, 1.1175 and 1.1235. On Tuesday, The Fed unexpectedly cut rates by half-point for the first time since 2008 to protect against an anticipated slowdown of economy for the fear of a possible Corona Virus outbreak. This unexpected move made the G-7 currencies like the EURO more appealing than USD. The price level of (1.1175) constituted a transient congestion-zone in confluence with the origin of the previously-mentioned ABC pattern. Temporary bearish pullback was demonstrated towards 1.1100-1.1095 before another bullish swing was initiated targetting 1.1300, 1.1360 and 1.1480. Currently, the price-Level of 1.1360 (100% Fibo Expansion) is being breached to the upside by the EURUSD pair. That's why, bearish rejection was anticipated around the price levels of 1.1480 (after the fact that the market has digested the Fed's emergency decision) with bearish targets around 1.1360, 1.1300 and 1.1235. Bearish persistence below 1.1360 is needed to ensure further bearish decline towards the mentioned target levels. However, Bullish persistence above 1.1360 (100% Fibo Expansion) enables another upward movement towards 1.1450-1.1480 where a high-probability double-top reversal pattern may be established. The material has been provided by InstaForex Company - www.instaforex.com |
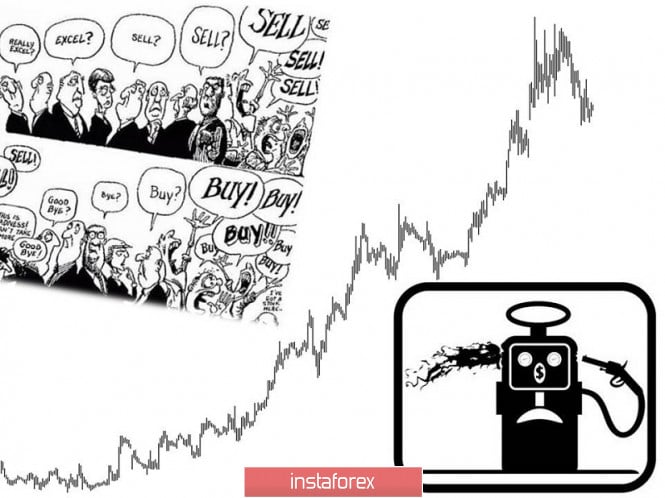
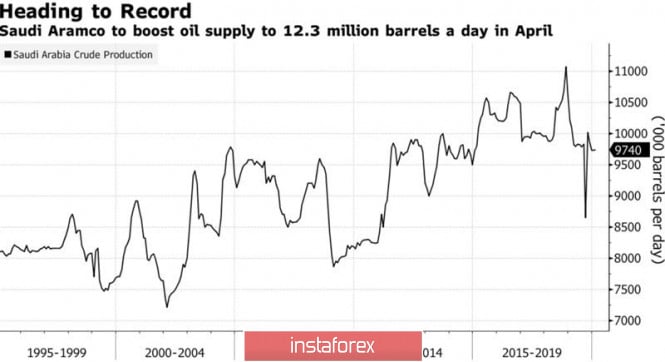
| Posted: 10 Mar 2020 04:44 AM PDT From love to hate one step, or so, where were we? Where is the dog buried in the conflict between Saudi Arabia and Russia, which led to the fastest subsidence of Brent and WTI since the Gulf crisis in 1991? After a seemingly fruitful 3-year cooperation between Riyadh and Moscow, the cat ran: the Russian Federation did not support the idea of reducing production, the OPEC+ alliance fell apart, and oil prices collapsed to their lowest level in the last four years. However, a quarrel between the powers that can cause a double low. We should not exclude that its goal is another competitor- the United States. When your attempts to increase your commitments to reduce production do not give the desired result, but, on the contrary, weaken your own position in the market, you should try to change your tactics. The loss of more than half of the value of oil from the levels of January highs hurt American oil companies. At the auction on March 9, they faced a double-digit slump of their share prices, that is, a serious loss of capitalization, which will certainly reduce investment in exploration and production, as well as increase the risks of defaults on bonds. US oil and gas corporations have debts with maturities of up to four years in excess of $200 billion, and Pioneer Natural Resources estimates that half of them may become bankrupt. On the other hand, the price war between OPEC and the US in 2014 turned out to be a failure for the cartel, and the active use of hedging operations by the Americans allows us to speak of their greater preparedness compared with the events of six years ago. The situation is exacerbated by the negative impact of coronavirus on demand for black gold. The combination of low interest in oil and substantial supply is extremely rare. According to Rapidan energy Group, this is the most bearish combination since the 1930s, which allows the company to claim that the March collapse of Brent and WTI is only the beginning of the end. Prices became a bone of contention for yesterday's allies. They are too low for Saudi Arabia and acceptable for Russia. However, in order to punish Moscow, which does not want to participate in further production cuts, Riyadh is ready to make sacrifices. It cut the price for buyers of its own oil by 20% and declared its readiness to increase production to 12.3 million b/d in April. Taking into account the fact that there were 9.7 million b/d in February, we are talking about an increase in the indicator by a quarter. Dynamics of oil production in Saudi Arabia Russia can respond by expanding production by 500,000 b/d, up to 11.8 million b/d.it does not have the same network of strategic reserves as Saudi Arabia (Rotterdam, Okinawa and the Egyptian port of Sidi Kerir). At the same time, according to the Blomberg insider, there were actually 30-50% more people who wanted to get discounts from Riyadh. By distracting buyers from the spot market, the OPEC leader contributes to falling prices. Technically, the daily Brent chart achieved a target of 88.6% on the Bat pattern. If the bulls manage to keep quotes above $30 per barrel in the next few days, the risks of a correction to the downward trend will increase. The material has been provided by InstaForex Company - www.instaforex.com |
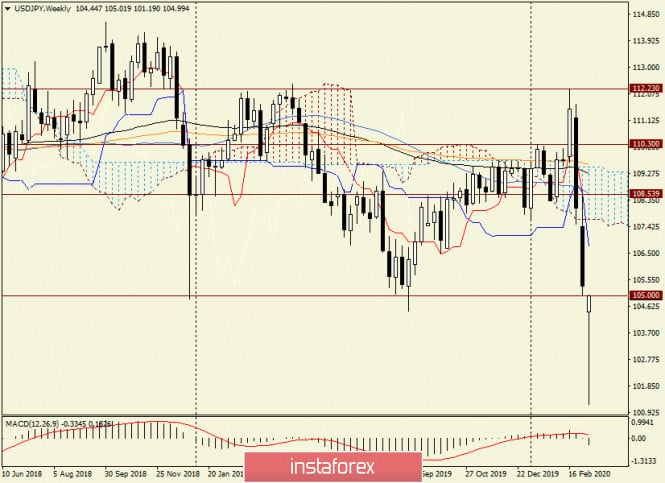
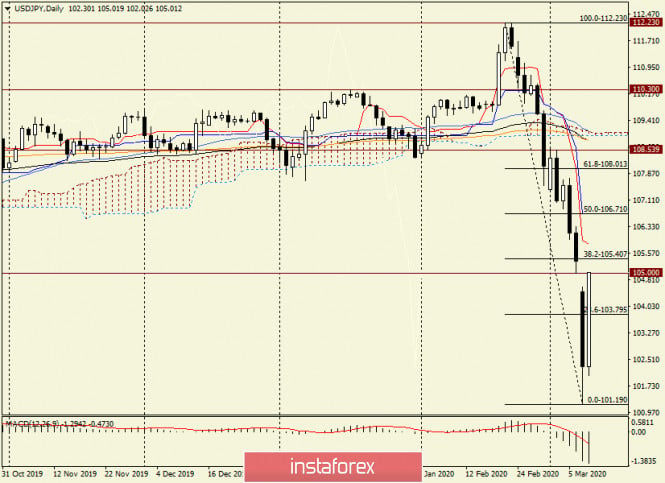
| Analysis and forecast for USD/JPY on March 10, 2020 Posted: 10 Mar 2020 04:28 AM PDT Hello, colleagues! There are very strong price movements for the dollar/yen currency pair. In my opinion, there are two main reasons for the fall of the US dollar. First, it is an epidemic of coronavirus, which continues to "walk" almost all over the globe, and, no doubt, has a negative impact on the world economy. Many of the world's leading central banks are already taking steps to support their economies, comparable to those that took place during the global financial and economic crisis of 2008-2009. In fact, if COVID-19 continues its rapid spread and negative impact on the world economy, it is unlikely to avoid another economic crisis. In this regard, the world's leading central banks have already moved to ultra-loose monetary policy. Ahead of the planet is the US Federal Reserve System (FRS), which last week, for the first time since the global financial and economic crisis of 2008-2009, lowered the main interest rate by 50 basis points. I think this is not the limit. Thus, the US dollar paired with the Japanese yen came under double pressure. On the one hand, the yen has become very much in demand, with the continued spread of the coronavirus as a safe asset. Investors go to safe havens and do not intend to take risks in the current situation. On the other hand, due to the spread of the coronavirus, the Fed is taking steps to support its own economy and has moved to significantly ease its monetary policy. However, it is worth adding that US President Donald Trump intends to hold a press conference where measures to counteract the coronavirus for the American economy will be outlined. US Treasury Secretary Steven Mnuchin echoes President Trump, who said that this week there will be a meeting with the leaders of America's leading banks to discuss measures to prevent the negative impact of the coronavirus on the US economy. Weekly
Expectations of the White House press conference and Mnuchin's comments provided support for the US currency, and after falling to 101.19, the US dollar began to recover its losses against the Japanese yen. At the time of writing, we see that there is a huge shadow at the bottom, and now the pair is trading above the opening price of 104.45. I believe that much of the USD/JPY price dynamics will be clarified after the White House press conference. If the rhetoric is convincing and reassures investors, the US currency will continue to recover the huge losses incurred against the Japanese yen. Otherwise, the pair will go back to the downward trend, where the most important level remains 105.00. In case of consolidation below this mark, and closing of weekly trading below, we can expect the continuation of a strong downward trend. If the current candle is executed in the form of a reversal, which is at the end of the review, the USD/JPY pair will get all the prerequisites for continuing the recovery, where the nearest target will be the area of 106.70. Daily
On the daily chart, the current upward scenario can be continued. In this scenario, the nearest possible growth targets will be the levels of the Fibonacci grid 38.2 and 50.0, stretched to a decrease of 112.23-101.19. I dare to assume that the pair will continue to recover to the levels of 105.40 and (or) 106.70. The rest will depend on the rhetoric of the White House press conference. If market participants believe in the ability of the US administration to protect its economy from the effects of the coronavirus, the dollar will strengthen, and across a wide range of markets. Otherwise, the US currency will again be under selling pressure. The main trading idea for the USD/JPY pair, in my personal opinion, is to buy, which is better to consider when reducing to the area of 104.20-104.00 or more aggressively, from the current prices of 104.90. Another option for opening long positions is to fix above 105.00 and roll back to this level, after which you can try buying. Good luck! The material has been provided by InstaForex Company - www.instaforex.com |
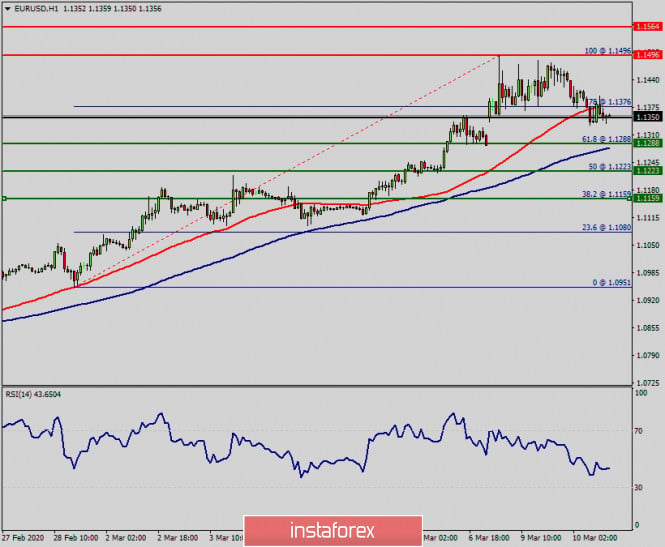
| Technical analysis of EUR/USD for March 10, 2020 Posted: 10 Mar 2020 04:17 AM PDT Coronavirus issue will probably impact on the currencies in coming days because its significant impact on the economy. Such as the oil was already affected by this problem. Technical analysis: Despite the bad economic news, but the EUR/USD pair is still moving in uptrend since last week. So, on the one-hour chart, the EUR/USD pair continues moving in a bullish trend from the support levels of 1.1223 and 1.1288. Currently, the price is in a bullish channel. This is confirmed by the RSI indicator signaling that we are still in a bullish trending market. As the price is still above the moving average (100), immediate support is seen at 1.1288, which coincides with a golden ratio (61.8% of Fibonacci). Consequently, the first support is set at the level of 1.2288. Thus, the market is likely to show signs of a bullish trend around the spot of 1.1288/1.1300. In other words, buy orders are recommended above the golden ratio (1.1288) with the first target at the level of 1.1496. We should see the pair climbing towards the double top (1.1496) to test it. Furthermore, if the trend is able to break through the first resistance level of 1.1496, then the EUR/USD pair will climb to this week's major resistance at 1.1564. It would also be wise to consider where to place a stop loss; this should be set below the second support of 1.1223. The material has been provided by InstaForex Company - www.instaforex.com |
| Market review. Trading ideas. Answers for questions. Posted: 10 Mar 2020 04:12 AM PDT Trading ideas: EUR/USD - neutral GBP/USD – neutral GOLD – sell positions can be opened until gold prices break the 1,640 level The material has been provided by InstaForex Company - www.instaforex.com |
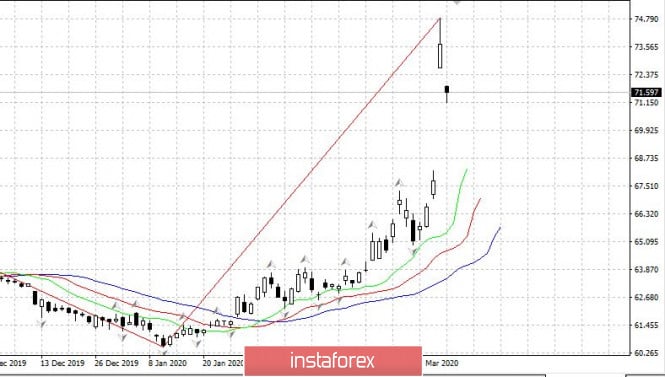
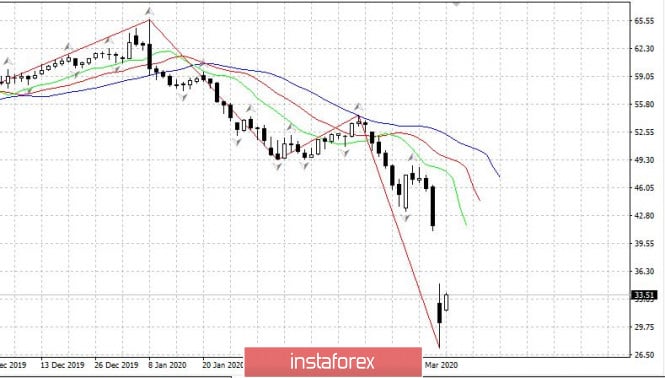
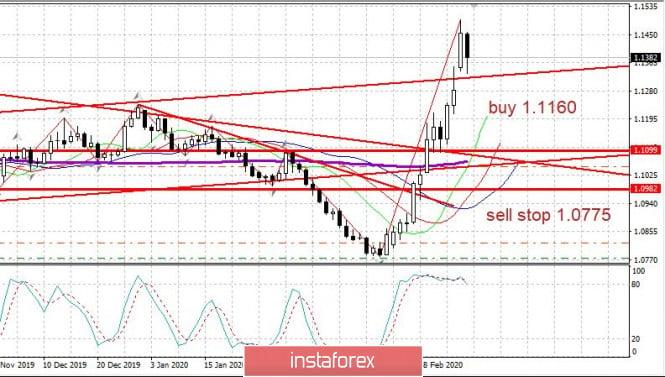
| Trader's diary for March 10th, 2020 for EUR/USD. USD hit 72 rubles, EUR rises to 82 rubles Posted: 10 Mar 2020 04:11 AM PDT On the Moscow exchange, the US dollar jumped to 72 rubles whereas the euro skyrocketed to 82 rubles. (The dollar/ruble daily chart is above.) The Russian stock market also showed a slump. The RTS Index dropped by 13% and the MOEX Russian index lost 8%. Shares of Rosneft Oil Company and Lukoil Oil Company declined by 15%. The Sberbank shares decreased by 13% whereas shares of Gazprom lost 10%. The VTB shares slid by 8%. There are three reasons for such a slump: the Saudi Arabia – Russia oil war that has led to lower oil prices, the US stock market drop by 7%, and the coronavirus outbreak. This is CL daily chart. Traders should wait until markets calm down. As far as the coronavirus is concerned, traders should monitor its spread. According to the latest news, Italy has expanded its quarantine to the entire country. EUR/USD: a day of correction. The pair is likely to resume the upward movement today or during the next two days. Buy positions can be opened from the 1.1200 level. The material has been provided by InstaForex Company - www.instaforex.com |
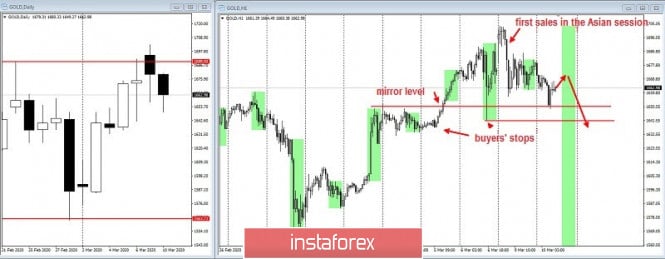
| Posted: 10 Mar 2020 03:03 AM PDT Good day, dear traders! I present to your attention, a trading idea for gold. Gold has not grown for two days in a row, bouncing off in the round level of $ 1,700 per troy ounce. The first short pulses were held on Monday during the Asian session, on the statements of Chinese officials about the "final victory over the coronavirus", which is predicted to happen this summer. As a result, longs were fixed near the round level of $ 1700. Today though, there is a classic "buyer trap", where all traders can clearly see the support level in the area of 1650, and the resistance level at the area of Friday's low at 1640, where the main stop orders of buyers will be placed. In order to update these two levels, I suggest working downwards during the US session. Truthfully, this situation is a hunt for the buyers who are caught in a long trap on the slowing bullish trend of this instrument, so I suggest paying special attention to the American session when trading. The material has been provided by InstaForex Company - www.instaforex.com |
| You are subscribed to email updates from Forex analysis review. To stop receiving these emails, you may unsubscribe now. | Email delivery powered by Google |
| Google, 1600 Amphitheatre Parkway, Mountain View, CA 94043, United States | |







No comments:
Post a Comment