Forex analysis review |
- Forecast for EUR/USD on March 24, 2020
- Forecast for GBP/USD on March 24, 2020
- Forecast for AUD/USD on March 24, 2020
- Forecast for USD/JPY on March 24, 2020
- Comprehensive analysis of movement options of #USDX vs EUR/USD vs GBP/USD vs USD/JPY (H4) on March 24, 2020
- EUR/USD: 1.05 or 1.10?
- EUR/USD and GBP/USD. March 23. Results of the day. Oil prices collapsed again, US and Asian stocks open with a fall
- Short-term Ichimoku cloud indicator analysis of EURUSD
- Short-term Ichimoku cloud indicator analysis of Gold
- March 23, 2020 : EUR/USD Intraday technical analysis and trade recommendations.
- March 23, 2020 : GBP/USD Intraday technical analysis and trade recommendations.
- Analysis for Gold 03.23.2020 - Strong demand and potential testing of $1.554-$1.570
- EUR/USD analysis for 03.23.2020 - Potential end of the upward corrrection ABC and downside continuation towarrds the level
- BTC analysis for 03.23.2020 - Potential end of the upward correction and downside continuation, drop towards the level of
- Evening review 03/23/2020. EURUSD. Virus does not slow down. Negative is growing
- GBP/USD: plan for the US session on March 23. Bears control the market and expect a breakthrough of the level of 1.1470
- Overview of USDCAD and USDJPY: coronavirus and the collapse of the world economy
- Trading recommendations for EURUSD pair on March 23
- Yen is in no hurry to return home
- Technical analysis of GBP/USD for March 23, 2020
- EUR/USD: euro is trying to be ahead of the curve
- Analysis of EUR/USD and GBP/USD for March 23. Coronavirus spreading in the US could weaken demand for the dollar
- Analysis and forecast for GBP/USD for March 23, 2020
- Technical analysis of EUR/USD for March 23, 2020
- Trading recommendations for GBP/USD pair on March 23
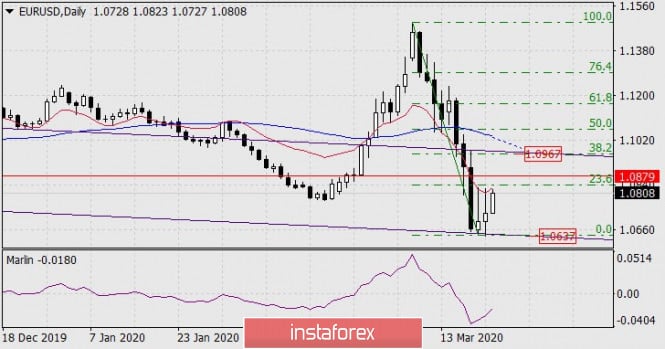
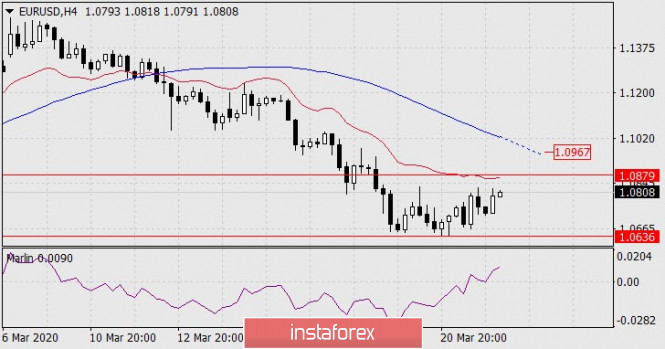
| Forecast for EUR/USD on March 24, 2020 Posted: 23 Mar 2020 08:19 PM PDT EUR/USD The euro showed a timid correction growth on Monday, but this growth has become confident today in the Asian session. The signal line of the Marlin oscillator continues to gain strength. The first goal of the correction is still the 1.0879 level – the October 1, 2019 low, its overcoming opens the second goal of 1.0967 – the area where the 38.2% Fibonacci level intersects with the embedded line of the price channel and, possibly, also the MACD line, which is approaching this point. The level is created strong, so now we expect the euro to fall from it with a high probability. The Marlin oscillator strengthened the growth on the four-hour chart, the signal line was fixed in the zone of positive values – the first goal of 1.0879 is likely to be taken, and the pair's quote will continue to grow towards the second goal. |
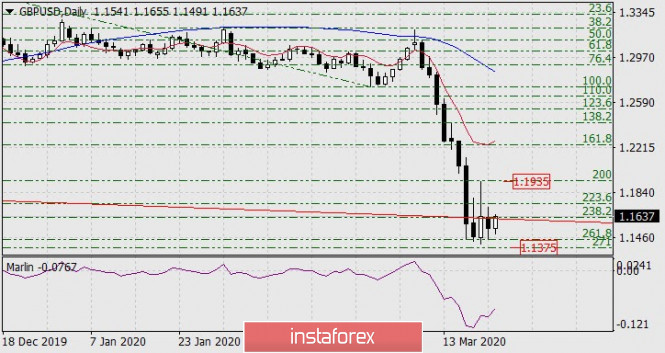
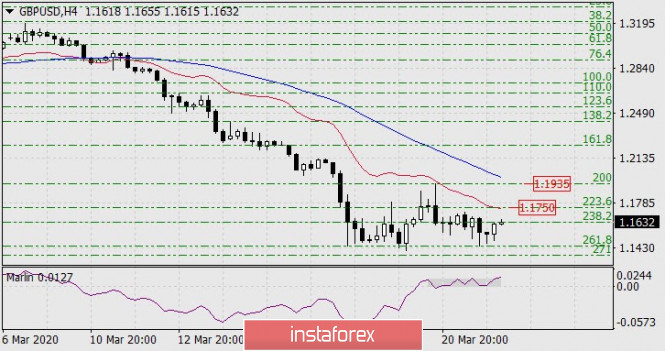
| Forecast for GBP/USD on March 24, 2020 Posted: 23 Mar 2020 08:19 PM PDT GBP/USD The British pound traded in the range of 260 points on Monday, consolidating under the Fibonacci level of 238.2% on the daily scale chart. Today in the Asian session, the price went above this level on the growing Marlin oscillator with the clear intention to continue the correction. The first and most significant target is the 200.0% Fibonacci level at 1.1935. The price already tested this level on Friday. The MACD line approaches the target level of 1.1935 on the four-hour chart, which creates its significance. The signal line of the Marlin oscillator in the last two days has created a narrow consolidation (marked in gray) and it has gone up this morning, creating an impulse to increase the price. So, we are waiting for the correction growth of the British pound to continue to the designated goal of 1.1935, but also follow the intermediate level of 1.1750 at the Fibonacci level of 223.6%. At this level, there is a balance line (red indicator), which is a certain obstacle to price growth. The material has been provided by InstaForex Company - www.instaforex.com |
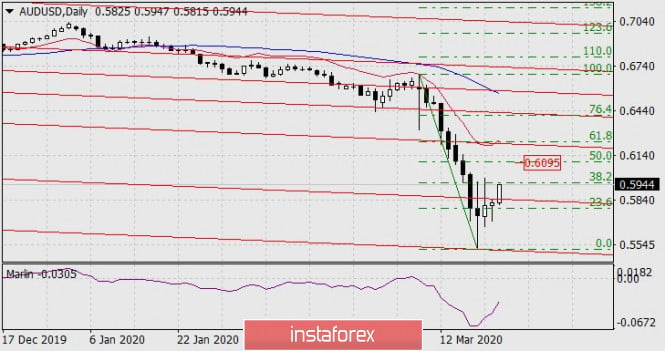
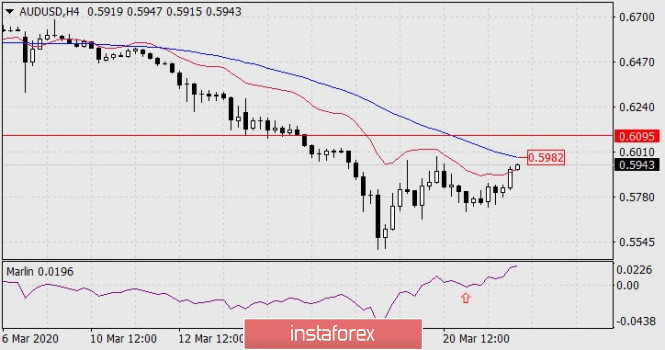
| Forecast for AUD/USD on March 24, 2020 Posted: 23 Mar 2020 08:12 PM PDT AUD/USD On Monday, the price managed to gain a foothold above the Fibonacci correction level of 23.6% of the entire movement on March 9-19. The price overcame the resistance of the embedded line of the price channel and approached the correction level of 38.2% today in the Asian session. Overcoming the level opens the goal of 0.6095 , which corresponds to a correction of 50.0%. On the four-hour chart, the main obstacle for the price to continue the correction is the MACD line at 0.5982, which is also close to the 38.2% correction level on the daily chart. The signal line of the Marlin oscillator has turned from the border separating the growth zone from the declining trend zone, which gives the price the confidence in continuing growth . |
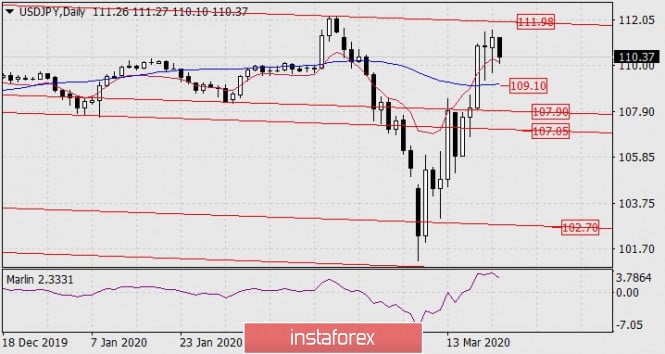
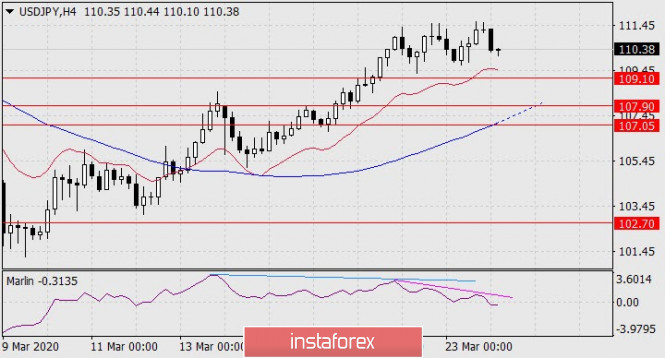
| Forecast for USD/JPY on March 24, 2020 Posted: 23 Mar 2020 08:12 PM PDT USD/JPY The Japanese yen continued to form reversal technical models on Monday, strengthening them in today's Asian session. On the daily chart, this is a more pronounced reversal of the signal line of the Marlin oscillator; This is the formation of a double complex divergence on the four-hour chart. The first goal of the decline is the MACD line on the daily chart on 109.10. Overcoming support opens the second target along the price channel in the area of 107.90. Behind it, a third target also opens along the line of the price channel at a price of 107.05. On the four-hour chart, the 107.90 target level coincides with the MACD line moving towards it. The price might probably rebound from this level. Overcoming the third goal of 107.05, consolidating below it, opens the way to a deeper decline - to the embedded line of the price channel in the 102.70 area (daily). The material has been provided by InstaForex Company - www.instaforex.com |
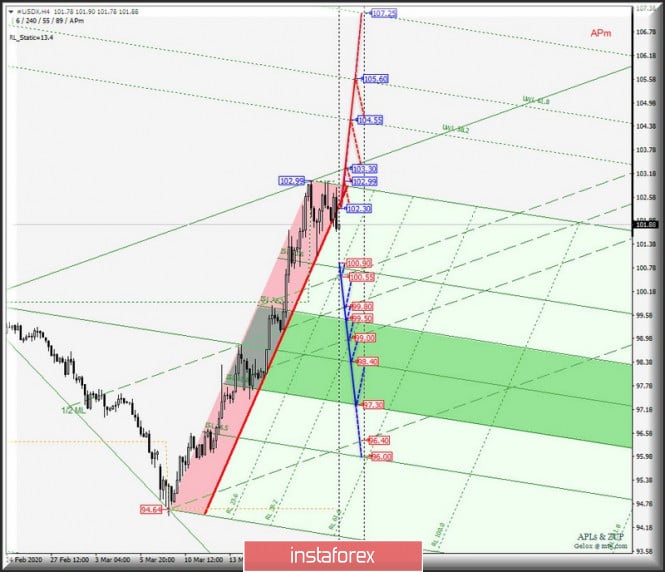
| Posted: 23 Mar 2020 06:51 PM PDT Minuettes operational scale (H4) Waiting for a reversal? Here's the comprehensive analysis for the development options of the movement of the main currency instruments #USDX vs EUR/USD vs GBP/USD vs USD/JPY on March 24, 2020. ____________________ US dollar index The movement of the dollar index #USDX from March 24, 2020 will be determined by the development and the breakdown direction of a fairly wide range:
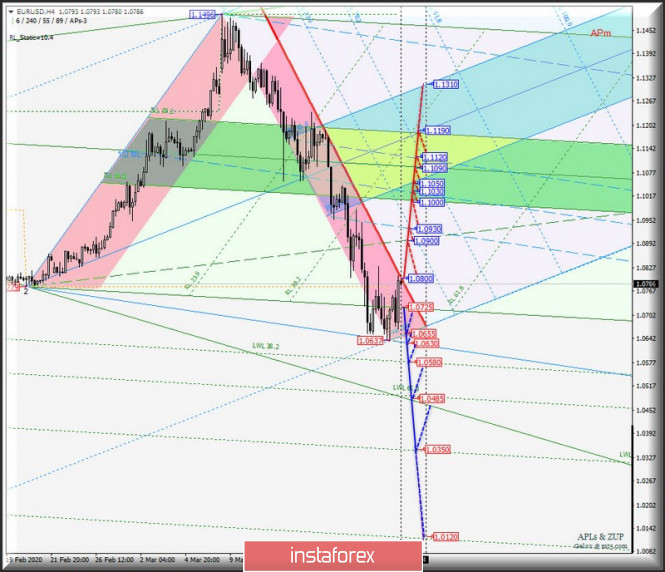
The breakdown of the signal line ISL23.6 (support level of 100.90) Minuette will cause the movement of #USDX to be extended to the boundaries of the 1/2 Median Line channel (100.55 - 99.80 - 99.00) and equilibrium zone (99.50 - 98.40 - 97.30) of the Minuette operational scale forks. On the contrary, if the dollar index returns (breakdown of the resistance level of 102.30) in the red zone of the Minuette operational scale forks, then the development of the upward movement can continue to the goals: - maximum 102.99; - control line UTL (103.30) of the Minuette operational scale forks; - warning - UWL38.2 (104.55) and UWL61.8 (105.60) - lines of the Minuette operational scale forks. The details of marking the movement of the dollar index from March 24, 2020 are presented on the animated chart. ____________________ Euro vs US dollar The movement of the single European currency EUR / USD from March 24, 2020 will also be determined by the direction of the breakdown of the range :
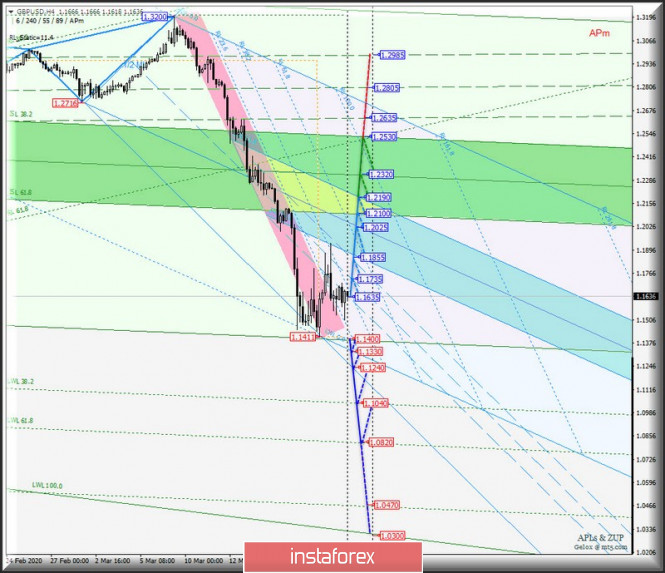
The breakdown of the resistance level of 1.0800 at the boundary of the red zone of the Minuette operational scale forks will determine the development of the upward movement of the single European currency to the final Schiff Line Minuette (1.0900), the boundaries of the 1/2 Median Line Minuette channel (1.0930 - 1.1030 - 1.1120) and the equilibrium zone (1.1000 - 1.1090 - 1.1190) of the Minuette operational scale forks. Alternatively, in the event of the breakdown of the FSL terminal line (support level of 1.0725) of the Minuette operational scale forks, then the EUR / USD movement can be continued to the initial SSL (1.0655) and control LTL (1.0630) lines of the Minuette operational scale forks with the prospect of reaching warning lines - LWL38.2 (1.0580) and LWL61.8 (1.0485) of the Minuette operational scale forks. The details of the EUR / USD movement options are shown on the animated chart. ____________________ Great Britain pound vs US dollar On March 24, 2020, Her Majesty's GBP / USD currency will continue to develop its movement depending on the development and the breakdown direction of the range:
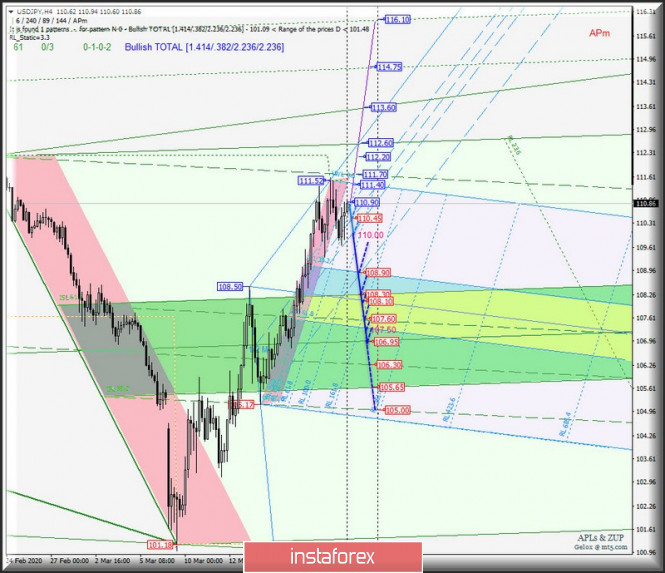
In case of breakdown of the resistance level of 1.1635, the development of Her Majesty's currency movement will continue in the a Median Line Minuette channel (1.1635 - 1.1735 - 1.1855) and within the boundaries of the equilibrium zones of the Minuette operational scale forks (1.1855 - 1.2025 - 1.2190) and Minuette (1.2100 - 1.2320 - 1.2530). Meanwhile, the breakdown of the final line of the FSL (support level of 1.1400) of the Minuette operational scale forks will lead to an option to continue the development of the downward movement of GBP / USD to the initial SSL (1.1330) and the final LTL (1.1240) lines of the Minuette operational scale forks with the prospect of reaching the warning lines - LWL38.2 (1.1040) and LWL61.8 (1.0820) of the Minuette operational scale forks. The details of the GBP / USD movement can be seen on the animated chart. ____________________ US dollar vs Japanese yen The development of the USD / JPY currency movement of the country of the rising sun from March 24, 2020 will be determined by the development and direction of the breakdown of the boundaries of 1/2 Median Line channel (110.90 - 110.45 - 110.00) of the Minuette operational scale forks. We look at the details of this movement on the chart. The breakdown lower boundary (support level of 110.00) of the 1/2 Median Line Minuette channel will lead to an option to continue the development of the downward movement of USD / JPY to the boundaries of the equilibrium zones of the Minuette operational scale forks (108.90 - 108.10 - 107.50) and Minuette (108.30 - 106.95 - 105.65). In contrast, the breakdown of the upper boundary (resistance level of 110.00) of the 1/2 Median Line Minuette channel will make it possible to continue the upward movement of the currency of the "land of the rising sun" to the goals: - the initial line SSL Minuette (111.40); - final Schiff Line Minuette (111.70); - maximum 112.20; - end line FSL Minuette (112.60); - control line UTL Minuette (113.60). We look at the details of the USD / JPY movement on the chart. ____________________ The review was compiled without taking into account the news background. Thus, the opening trading sessions of major financial centers does not serve as a guide to action (placing orders "sell" or "buy"). The formula for calculating the dollar index : USDX = 50.14348112 * USDEUR0.576 * USDJPY0.136 * USDGBP0.119 * USDCAD0.091 * USDSEK0.042 * USDCHF0.036. where power factors correspond to the weights of the currencies in the basket: Euro - 57.6% ; Yen - 13.6% ; Pound Sterling - 11.9% ; Canadian dollar - 9.1%; Swedish krona - 4.2%; Swiss franc - 3.6%. The first coefficient in the formula leads the index to 100 at the starting date - March 1973, when the main currencies began to be freely quoted relative to each other. The material has been provided by InstaForex Company - www.instaforex.com |
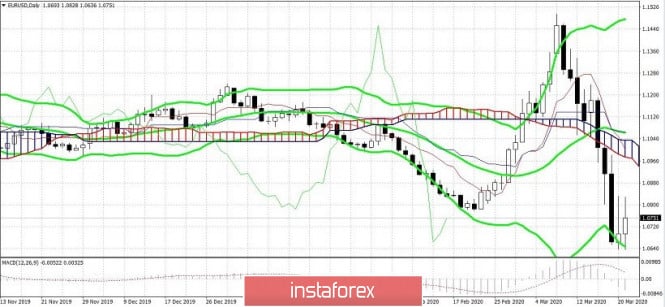
| Posted: 23 Mar 2020 03:32 PM PDT The euro-dollar pair is currently unable to determine the vector of its further movement. The price fluctuates in a wide-range flat after a 500-point decline last week: bears can not get a foothold in the sixth figure, while bulls are not able to keep the pair within the eighth price level. Despite significant intraday volatility, the pair is actually stuck in place waiting for a powerful news impulse. It is worth noting that the fundamental background is full of events, but all these events are contradictory for the dollar - on the one hand, the White House's intentions to stimulate the economy, on the other hand, the Federal Reserve's unprecedented lending measures against the background of the deteriorating epidemiological situation in the United States. The general situation on the market is quite eloquently illustrated by the dollar index – starting the trading week at 103.47 points, it plunged during the day to a daily low of 102.53 points. But the downward trend did not continue, after which the index went up again, reacting to the current news flow. The information background looks quite colorful today. First, the number of people infected with coronavirus is growing in the United States – more than 35,000 of them. The United States led the ranking of countries by daily increase in morbidity: 7,021 cases per day (Spain and Italy followed by America). The number of infected exceeded a thousand in seven states of the country, but the most affected were New York (almost 17,000 cases, 114 deaths) and Washington (more than 2,000 cases, 95 deaths). New York has already been called the epicenter of coronavirus infection in the United States – if the number of new cases continues to increase at the same rate, in two or three weeks, medical workers will lack the necessary funds. Against this background, the US Senate in a procedural vote on Sunday failed to pass a bill on a package of economic stimulus measures for 1 trillion 600 billion dollars, which was supposed to be used to fight the spread of Covid-19. The draft law did not get enough votes – according to the Democrats of the Upper House, this initiative should be partially revised. Most likely, this bill will be reviewed again today. All these circumstances at the start of the trading week put pressure on the greenback. In addition, the US Federal Reserve, which last week announced a program of quantitative easing worth $700 billion, today canceled the specified threshold and made this program unlimited in amount. Jerome Powell also announced the opening of credit lines for corporations, states, and local governments. The Fed chief added that current purchases of US Treasury and mortgage-backed securities will be expanded "as much as necessary." However, EUR/USD buyers could not take advantage of the situation. After the above statement of the Fed, the pair grew and tested the eighth figure. But traders immediately began to buy it at a bargain price, again investing in the US currency. As a result, the pair was stuck between the sixth and eighth figures, alternately testing the lower and upper limit of the price range. If we talk about longer-term prospects, the question is somewhat different – either the pair goes to the fifth figure, or it recovers to the middle of the medium-term downward trend – this is the price band of 1.0950-1.1035 (the lower and upper boundaries of the Kumo cloud on the daily chart). The bears definitely feel uncomfortable below the seventh figure – they have already tested the sixth price level three times, but in vain. Similar discomfort is felt by buyers of EUR/USD above the 1.0800 mark – the pair begins to be in demand among sellers at such heights. This is why neither bulls nor bears have a clear advantage (if, of course, we are talking about a short-term time period). The single currency also came under additional pressure today on the background of news from Germany. On Friday, Chancellor Angela Merkel was given a preventative pneumococcal vaccination, but it later emerged that her doctor had tested positive for the coronavirus. The chancellor was sent to quarantine, and buyers of EUR/USD received another reason for concern. But, according to preliminary data, the alarm was false – the first test for Cavid-19 was negative. Therefore, at the moment, the pair's traders focused only on the behavior of the US currency. At the moment, it is difficult to say whether the bulls will be able to turn the situation around or whether EUR/USD will finally gain a foothold in the sixth figure. After the impulsive decline last week, bears are forced to reckon with the actions of the Federal Reserve (which, among other things, opened dollar swap lines with the leading central bank). On the other hand, if the US Senate re-considers the above-mentioned bill and approves the program to stimulate the economy, the dollar may again test the area of the sixth figure. In other words, despite the clear downward trend in which the EUR/USD pair is currently trading, it is risky to open short positions – there is a certain risk of catching the price bottom, especially against the background of the latest decisions of the Fed. In addition, today it became known that the leaders of the EU countries agreed to suspend the budget rules, and Germany will support the "rescue program for Italy". All these factors are in favor of the euro. But on the other hand, the dollar is still regarded by the market as the most reliable defensive asset, so long positions are also in question. To confirm the downward trend, the bears need to gain a foothold below the lower line of the Bollinger Bands indicator on the daily chart (that is, below 1.0650). For bulls of the pair, the task is more complicated - to break the general situation, they need not only to gain a foothold in the eighth figure, but also to rise above the 1.0940 mark (the lower boundary of the Kumo cloud on D1). The material has been provided by InstaForex Company - www.instaforex.com |
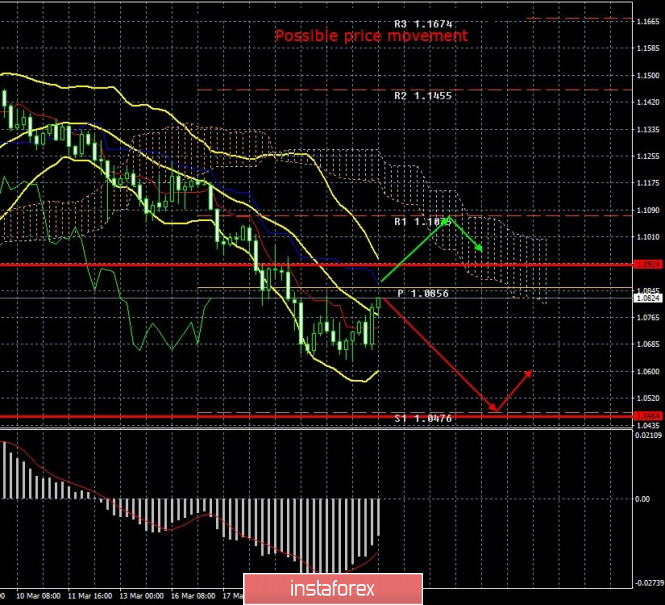
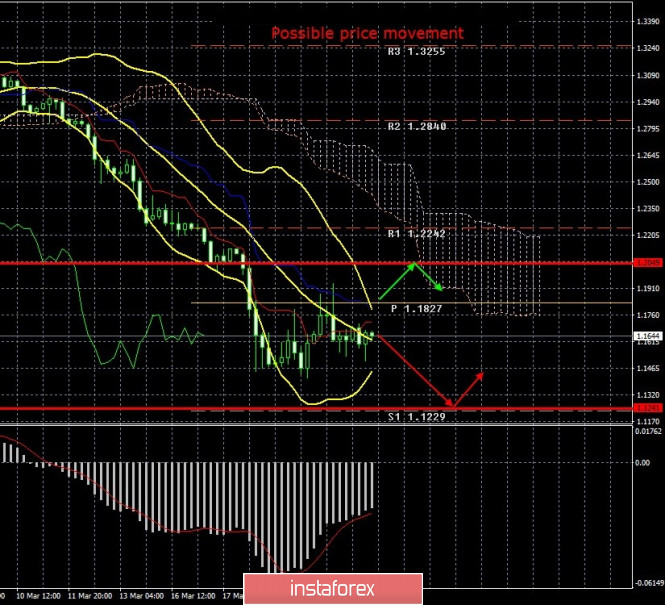
| Posted: 23 Mar 2020 03:32 PM PDT 4-hour timeframe Average volatility over the past 5 days: 230p (high). The EUR/USD currency pair did not fall in price again on Monday, March 23. Thus, there have been no new declines in the European currency for several consecutive days, and the pair has even begun to adjust today. However, it is still too early to talk about the end of the panic in the market. The volatility of the euro/dollar pair remains extremely high, and today quotes have passed almost 200 points. Despite the fact that no macroeconomic statistics were planned for Monday, and indeed new and fresh data was not available to traders. However, in any case, traders in recent weeks have not reacted to almost all statistics. Nearly all reports about the actions of the central bank or the governments of the European Union and the United States were also ignored. Thus, today's movement may be a correction, it could be the beginning of a new strong upward trend. Markets remain in a state of panic, so movement can be expected in any direction. A few days ago, we wrote about the forecasts for the fall of the global economy, which were given by Goldman Sachs and world rating agencies. Recall that initially experts assumed that the global economy would lose from 0.5% to 1.5% of GDP in 2020. However, everything will depend on the duration of the epidemic and the losses that it will bring. Now, Morgan Stanley economists voiced their forecasts. In their opinion, US GDP will decline by 30.4% in the second quarter, which corresponds to the level of the Great Depression. "We are seeing a 2.4% drop in GDP in the first quarter, as economic activity almost stopped in March. In the second quarter, a record decline of 30.1% will follow. We expect a sharp decline in consumer spending on travel, restaurants, transportation and other services," the forecast said. However, we would like to note that these are just forecasts. The fact that there will be reductions in the US economy, and in the European, and in the world - there is no need to go to a fortune teller. However, why guess what they will be? Better to wait for the official statistics. Data will begin to be available to traders tomorrow. This refers to statistics for March. At the same time, the International Monetary Fund announced its forecasts regarding the COVID-2019 pandemic and its impact on the global economy. According to Martin Muhleisen, director of the IMF's strategy, policy and analysis department, the consequences will be extremely dire, but they will ultimately be overcome. First of all, the sectors of tourism, services and any industries related to the interaction and movement of people will suffer. Economic activity will decrease very much, demand will decrease, therefore, production will also fall, which in the US and the EU has already declined over the past six months. However, according to Muhleisen, financial institutions and central banks made the right conclusions after the 2008 crisis, and the current pandemic will turn out to be "tough for them". The IMF also notes that business activity in China has begun to recover. The first quarter is likely to be completely disastrous, but in the second there will already be a restoration of economic indicators, since it was possible to localize the pandemic in China. Meanwhile, the US stock market is still not happy. On Monday, March 23, major stock indexes reopened lower despite the fact that the Federal Reserve announced an unprecedented program to help the economy. The Dow Jones Industrial Average fell almost 1%, the S&P 500 lost 0.6%, and the Nasdaq Composite immediately dropped 0.5%. However, this is only at the opening of trading. More serious price changes may occur during the day. Russian oil companies agreed to give Belarus a discount of $15.7 per tonne of Urals oil and thus resume deliveries that stopped at the beginning of the year from April 1. This is bad news for the oil market. The more discounts exporting countries provide, the longer the period of low oil prices will remain. All oil brands became cheaper again at today's auction. As you can see, markets continue to be under pressure, so "calm Monday" may turn out to be an accident. 4-hour timeframe Average volatility over the past 5 days: 404p (high). As for the British pound, this currency did not even manage to correct normally on Monday. On the other hand, correction was observed earlier. In technical terms, the pound/dollar pair ideally worked out the critical Kijun-sen line, and a rebound from it provoked a resumption of the downward movement. Thus, from a technical point of view, everything is in order, everything is going according to plan. However, questions remain: how long will the British pound fall, which objectively does not deserve such a fate? In the United States, according to recent data, the number of people infected with a pandemic has increased. And the Fed and the government are going to pour not hundreds of billions of dollars, but trillions into the economy. Accordingly, damage to the economy can be colossal. We do not yet have macroeconomic statistics from across the ocean. However, the US government has. And since it introduces such colossal incentive measures, then everything is really bad. The number of infected is not too large in the UK. Nevertheless, the pound again shows a genuine desire to collapse. In the UK, as well as in many countries of the world, the fight against the virus continues. However, judging by the statements of the country's Prime Minister Boris Johnson, who promises to introduce more stringent quarantine measures, the country's population neglects the rules that have already been introduced. It is reported that last weekend the British gathered in droves in parks, on beaches, in markets. Thus, Johnson intends to transfer Britain to quarantine like Italy, where there are strict bans on leaving citizens without an emergency. "To everyone who goes out, plays sports, has fun, I strongly declare: you must observe distance. If you cannot do this, then we will have to take tougher measures," Johnson said. As for the technical picture of the GBP/USD currency pair, the downward movement is likely to resume. But it is very difficult to say as to what can save the pound. The panic continues to remain in the markets, so we believe that we still need to wait for the downward turn. Bidding can become more logical and reasonable only after that. Recommendations for EUR/USD: For short positions: The euro/dollar continues to have a corrective movement on the 4-hour timeframe. Thus, it is recommended to sell the euro in case of a price rebound from the Kijun-sen line with the target of the support level of 1.0476. For long positions: Buying the EUR/USD pair is recommended only if quotes return to the area above the critical line with the first goal, the resistance level is 1.1075. However, when opening any positions, it is recommended to act as carefully as possible and remember the heightened risks. Recommendations for GBP/USD: For short positions: The pound/dollar resumed its downward movement after a rebound from the Kijun-sen line. Thus, it is recommended to sell the British pound while aiming to support the level of 1.1229 until new signs of correction start. For long positions: Buying the GBP/USD pair is recommended only if quotes return to the area above the Kijun-sen line with the first goal being the resistance level of 1.2242. As in the case of the euro currency, it is recommended to remember the heightened risks when opening any positions. Explanation of the illustration: Ichimoku indicator: Tenkan-sen is the red line. Kijun-sen is the blue line. Senkou Span A - light brown dotted line. Senkou Span B - light purple dashed line. Chikou Span - green line. Bollinger Bands Indicator: 3 yellow lines. MACD indicator: Red line and bar graph with white bars in the indicators window. Support / Resistance Classic Levels: Red and gray dashed lines with price symbols. Pivot Level: Yellow solid line. Volatility Support / Resistance Levels: Gray dotted lines without price designations. Possible price movements: Red and green arrows. The material has been provided by InstaForex Company - www.instaforex.com |
| Short-term Ichimoku cloud indicator analysis of EURUSD Posted: 23 Mar 2020 01:59 PM PDT EURUSD bounced today towards 1.0830 but bulls were not strong enough to push price above the kijun-sen resistance. Trend remains bearish despite price moving above the tenkan-sen indicator.
EURUSD remains in a bearish trend. Price is struggling to stay above the tenkan-sen (red line indicator). Short-term resistance is at the kijun-sen (green line indicator) at 1.0840. Bulls need to break above this level in order to push price towards the Kumo which is the major short-term resistance at 1.11. As long as price is below the Kumo trend is bearish. So far we have no reversal signal. At 1.0830-1.0840 we have a double top. Breaking above this level we will also get a technical bullish signal. Support is at 1.0665. The material has been provided by InstaForex Company - www.instaforex.com |
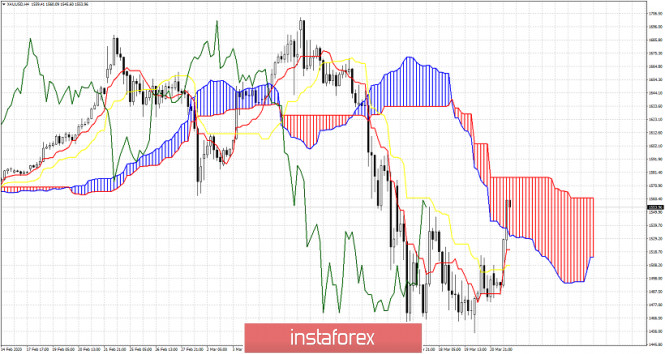
| Short-term Ichimoku cloud indicator analysis of Gold Posted: 23 Mar 2020 01:39 PM PDT Gold price has managed to push inside important short-term resistance area and Ichimoku cloud terms we have our first weak buy signal and the change of short-term trend to neutral. Gold price is bouncing as we expected from our last analysis and has so far reached our target of $1,550.
On a daily basis trend is also neutral as price is inside the Daily Kumo. The daily chart agrees with the resistance levels of the 4 hour chart, so it is important to see a daily close above $1,570-80 in order to hope for a bigger move higher. The material has been provided by InstaForex Company - www.instaforex.com |
| March 23, 2020 : EUR/USD Intraday technical analysis and trade recommendations. Posted: 23 Mar 2020 10:36 AM PDT
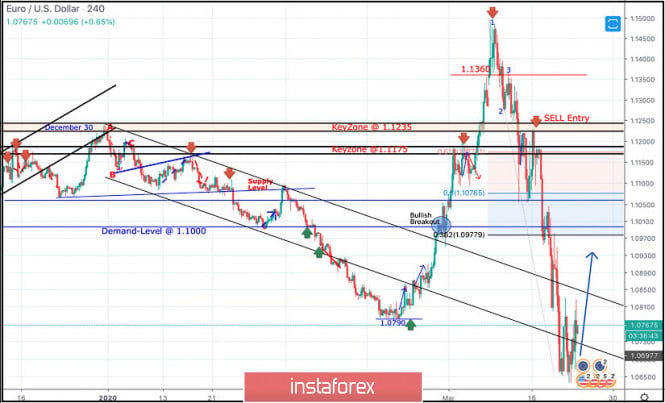
On December 30, a bearish ABC reversal pattern was initiated around 1.1235 which turned the technical outlook into bearish. Since then, the EURUSD pair has trended-down within the depicted bearish channel until few weeks ago, when extensive bearish decline established a new low around 1.0790 where the EUR/USD pair looked OVERSOLD after such extensive bearish decline. On February 20, recent signs of bullish recovery were demonstrated around 1.0790 leading to the recent steep bullish movement towards 1.1000 then 1.1175. The price level of (1.1175) constituted a transient congestion-zone in confluence with the origin of the previously-mentioned ABC pattern. Temporary consolidation range was demonstrated down to 1.1100-1.1095 where another bullish limb was quickly expressed targetting 1.1235, 1.1360 and finally 1.1480. In other words, the price-Levels of 1.1235 (KeyZone) and 1.1360 were being breached to the upside until earlier last week when a (123) bearish reversal pattern was initiated around the price level of 1.1480. This turned the short-term technical outlook for the EURUSD pair into bearish when bearish persistence below the Keyzone of 1.1235 was maintained on a daily basis. For conservative traders, the previous bullish pullback towards 1.1235 was suggested to be considered for bearish rejection and a valid SELL entry. On the other hand, the mentioned intermediate-term bearish Head & Shoulders pattern has achieved all of its projection target levels. Currently, the EURUSD pair is re-testing the backside of the broken bearish channel where signs of bullish rejection should be anticipated. The recent bullish engulfing H4 candlesticks as well as the manifested double-bottom reversal pattern (in progress) indicate a high probability bullish pullback at least towards 1.0880, 1.0980 and 1.1060 that should be watched by conservative traders. That's why, Intraday traders should be looking for any upcoming bullish breakout above 1.0790 as this would probably enhance further bullish advancement towards 1.0980. On the other hand, H4 candlestick bearish closure below 1.0650 invalidates the previous scenario and enables further bearish decline towards 1.0606 and probably 1.0580. The material has been provided by InstaForex Company - www.instaforex.com |
| March 23, 2020 : GBP/USD Intraday technical analysis and trade recommendations. Posted: 23 Mar 2020 10:14 AM PDT
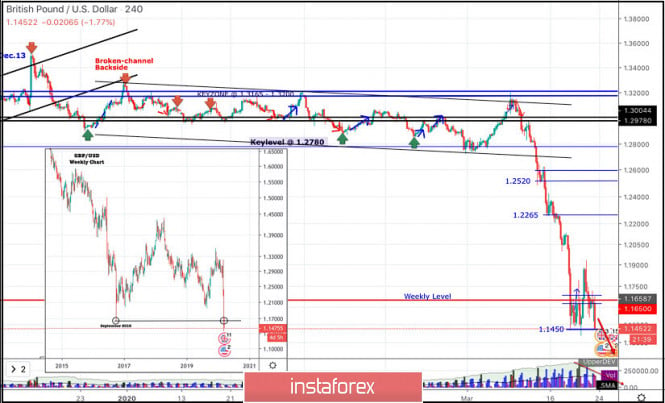
In the period between December 18th - 23rd, bearish breakout below the previous bullish channel followed by quick bearish decline below 1.3000 were demonstrated on the H4 chart. However, Immediate bullish recovery (around 1.2900) brought the pair back towards 1.3250 (backside of the broken channel) where the recently-terminated wide-ranged movement channel was established below 1.3200. Since January 13, progressive bearish pressure has been built above the price level of 1.2780-1.2800 until March, the 2nd when transient bearish breakout 1.2780 took place. Shortly after, significant bullish rejection was demonstrated around March 4. Hence, a quick bullish movement was expressed towards the price zone of 1.3165-1.3200 where significant bearish pressure brought the pair back below 1.2780, 1.2500 then 1.2260 via quick bearish engulfing H4 candlesticks. Recently, the GBPUSD has reached new LOW price levels around 1.1450, slightly below the historical low (1.1650) achieved in September 2016 (As depicted on the Weekly Chart). Currently, the GBP/USD pair looks very OVERSOLD. However, Technical outlook suggests further bearish decline as long as bearish persistence below 1.1650 is maintained on the H4 & Weekly Charts. By the end of Last week, Conservative traders were advised to look for signs of bullish rejection for a probable bullish reversal opportunity around the historical price levels of (1.1500-1.1450). Transient bullish advancement was achieved towards 1.1900. However, immediate bearish rebound is being expressed to retest the recent low around 1.1450. H4 Candlestick closure below 1.1450 & Weekly Candlestick closure below 1.1650 enhances the bearish momentum on both the short and intermediate-terms respectively. This would be supported by the positive bearish convergence manifested on the indicator. Initial Bearish targets are estimated to be located around 1.1350 and 1.1180 provided that quick H4 bearish closure below 1.1450 is achieved. On the other hand, bullish breakout above 1.1900 (Latest Descending High) invalidates the bearish scenario temporarily & enables higher bullish targets around 1.2260, 1.2520, 1.2680 to be addressed if sufficient bullish momentum is maintained. The material has been provided by InstaForex Company - www.instaforex.com |
| Analysis for Gold 03.23.2020 - Strong demand and potential testing of $1.554-$1.570 Posted: 23 Mar 2020 08:32 AM PDT Corona virus news:
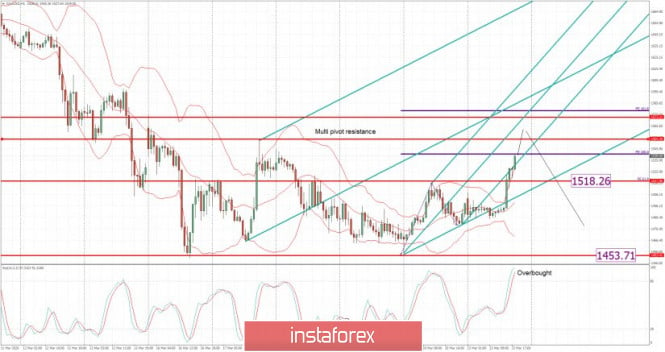
Readings from ESA's Sentinel-5P satellite show that over the past six weeks, levels of nitrogen dioxide (NO2) over cities and industrial clusters in Asia and Europe were markedly lower than in the same period last year. Technical analysis: Gold has been trading upwards. The price tested the level of $1.540. I found that Gold got strong momentum to the upside but the major resistance levels are awaiting at $1.554-$1.570. I also found the Fibonacci expansion 100% at the price of $1.540. Buying opportunities on the dips towards the levels at $1.554-$1.570 can be intraday option for today but then, your focus should shift to the bearish opportunities. Stochastic oscillator is showing Overbought reading but still without bear cross. Resistance levels are set at $1.554-$1.570 Support level is set at the price of $1.518. The material has been provided by InstaForex Company - www.instaforex.com |
| Posted: 23 Mar 2020 08:09 AM PDT Corona virus news:
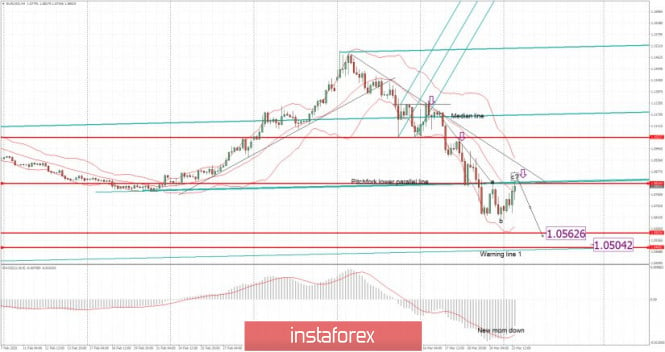
First patients enrolled in clinical trial of possible Covid-19 treatments The first UK patients have been enrolled in a clinical trial for possible Covid-19 treatments, PA reports. Researchers from the University of Oxford have launched a new clinical trial to test the effects of potential drug treatments for patients admitted to hospital with the virus. There are currently no specific treatments for the corona virus and it is possible some existing drugs used for other conditions may have some benefits. Technical analysis: EUR/USD has been trading upwards today towards the level of 1.0800. In my opinion, EU/USD still got high odds forr the downside continuation. THe important resistance pivot is set at the price of 1.0815. The short-term trend is still bearish and I couldn't find any big reversal pattern yet, which is sign of the potential downside continuation. I see potential downside continuation and completion of the ABC correction.Watch for selling opportunities with the downward targets at 1.0560 and 1.0500. MACD oscillator is showing strong selling pressure from the background, which is strong sign of the sellers are still in control. Resistance levels are set at 1.0815 and 1.0950 Support levels and downward targets are set at the price of 1.0560 and 1.0500. The material has been provided by InstaForex Company - www.instaforex.com |
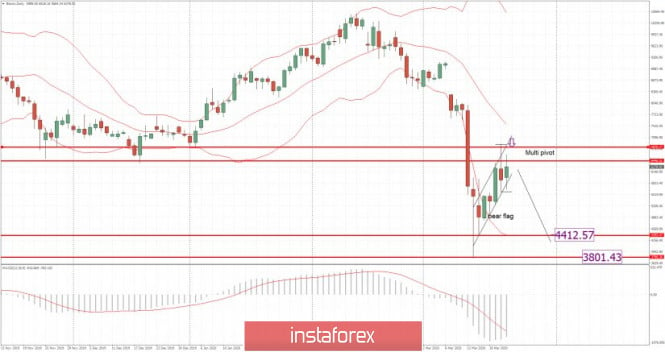
| Posted: 23 Mar 2020 07:48 AM PDT Corona virus news:
US President Donald Trump has ordered the deployment of National Guard troops in the three states hardest hit by the corona virus outbreak. Troops will be used in New York, California and Washington to deliver medical aid and set up medical stations after the number of deaths nationwide rose to 471 and infections to 35,244.There are fears of a shortage of key medical supplies in New York City.A bill to fund national relief efforts has been blocked in the Senate. Opposition Democrats want the emergency stimulus bill, which is worth almost $1.4 trillion (£1.2 trillion), to include more money for state and local governments and hospitals, while Mr Trump's Republicans are pushing for quick action to reassure financial markets. Technical analysis: BTC has been trading sideways at the price of $6.270. Anyway, the multi pivot resistance at the prrice of $7.000 held successfully, which is sign of the overall downside pressure.I see potential downside continuation and re-testing of $4.400 and $3.800. Daily chart looks like a bear flag and potential end of the upward correction. Watch for selling opportunities with the downward targets at $4.400 and $3.800. MACD oscillator is showing strong selling pressure from the background, which is strong sign of the sellers in control. Major resistance is set at $7.000. Support levels and downward targets are set at the price of $4.400 and $3.800. The material has been provided by InstaForex Company - www.instaforex.com |
| Evening review 03/23/2020. EURUSD. Virus does not slow down. Negative is growing Posted: 23 Mar 2020 07:15 AM PDT The US market opened with a new decline and fresh lows on the continued growth of the coronavirus epidemic. The US came in second place in the number of infected (35,000) after Italy (59,000). The rate of growth of cases in the United States and the main countries of Western Europe remains above +10% per day. Until the maximum speed of distribution is passed, the market will be in a fever. Morgan Stanley: The fall in US GDP in Q2 may reach a huge -30% (!!!) on an annual basis. Employment forecasts for the week: up to 500-750 thousand new applications for benefits are expected this Thursday. EUR USD: we see a rebound to the top. We are preparing sales from 1.0940 and higher. The material has been provided by InstaForex Company - www.instaforex.com |
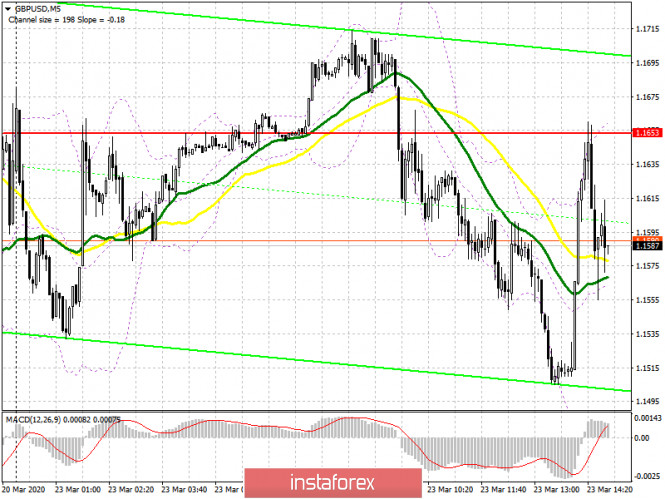
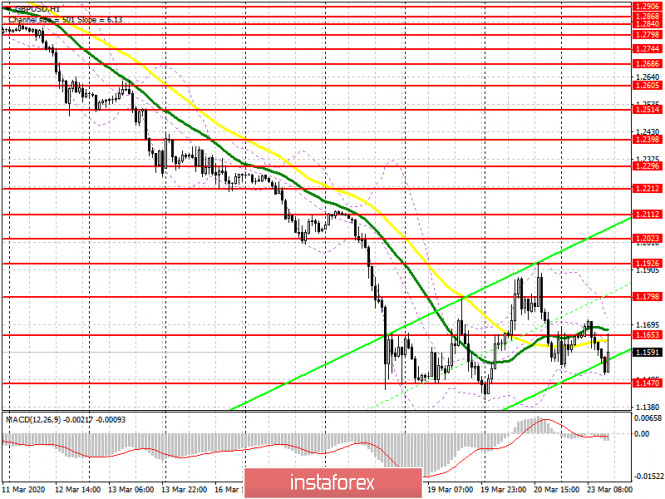
| Posted: 23 Mar 2020 05:59 AM PDT To open long positions on GBPUSD, you need: News that the Federal Reserve is ready to provide loans to anyone who needs it in unlimited quantities only momentarily weakened the position of the US dollar, which continues to enjoy demand against the backdrop of the growing crisis. On the 5-minute chart, you can clearly see how the bears return to the level of 1.1653, and after updating it from the bottom up, they arrange another sale, which was interrupted by the Fed's statements. At the moment, the bulls will try to regain this range, which will push the pair higher, to the resistance of 1.1798, and then to the larger level of 1.1926, where I recommend fixing the profits. If the pressure on the pound continues, it is best to return to long positions only after a false breakout in the area of 1.1470, or a rebound from round figures in the area of 1.1400 and 1.1300.
To open short positions on GBPUSD, you need: No news on the UK economy or Brexit is able to return optimism to the market. And what kind of negotiations can there be if the chief negotiator, Jean-Claude Juncker, has become infected with the coronavirus, and the decrease in the UK's GDP in the second quarter may amount to more than 5.0%. At the moment, the bears' task will be to protect the resistance of 1.1653, where the formation of a false breakout will be the next signal to open positions. The sellers' goal will be the minimum of this year, the breakdown of which will lead to a further sale of GBP/USD in the area of 1.1400 and 1.1300, where I recommend fixing the profits. In the scenario of growth of the pair above the resistance of 1.1653, I recommend postponing short positions until the update of the larger highs of 1.1798 and 1.1926, where you can sell immediately on the rebound. Signals of indicators: Moving averages Trading is conducted below the 30 and 50 daily averages, which indicates the continuation of the bear market, but to resume the trend, a breakthrough of the annual lows is required. Bollinger Bands In the case of an upward correction, the upper limit of the indicator in the area of 1.1730 will act as a resistance. In the scenario of a decline in the pound in the second half of the day, the lower border of the indicator around 1.1480 will provide support.
Description of indicators
|
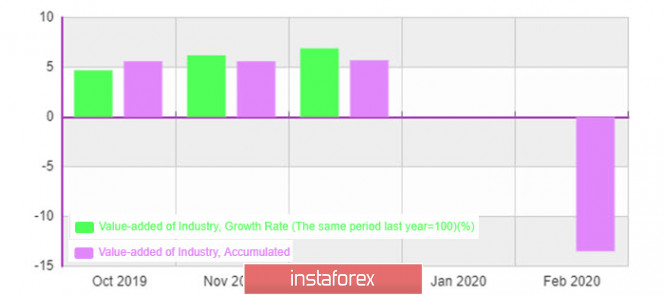
| Overview of USDCAD and USDJPY: coronavirus and the collapse of the world economy Posted: 23 Mar 2020 05:30 AM PDT European stock exchanges are trading in the red zone, losing an average of 3 to 5%. There is strong growth in demand for bonds, oil is falling, gold is growing – all the signs of panic are obvious. The scale of what is waiting for the world economy can be understood if you look at the statistics from China. Since the virus became active in China earlier than in Europe or the United States, the data for February reflects the depth of the problem. And they are as follows: retail sales -20.5%, industrial production -13.5%, foreign investment -8.6%, foreign trade fell by 11%, and for the first time in recent history, China has a deficit of -7.09%.
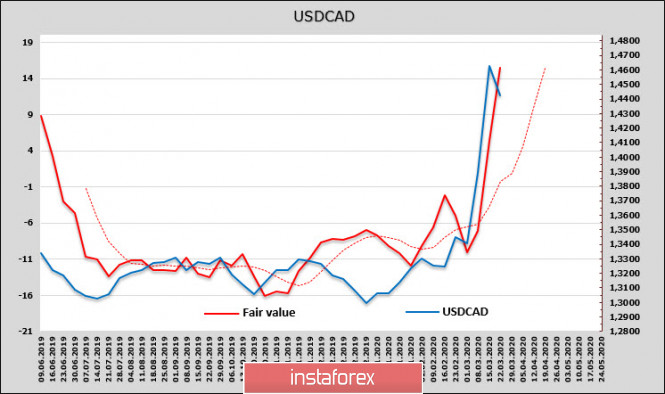
Italy will lose 100 billion euros a month from the shutdown of production due to the virus. But Italy is just the locomotive of coronavirus in Europe, not the final stop. Nordea Bank points out that the situation in Spain and the Netherlands already looks worse than in Italy, and in the United States, the epidemic is rapidly gaining momentum. Treasury Secretary Mnuchin believes that the quarantine will last until the beginning of June. The national guard is involved to help the most affected States, but the chances of success remain low. The Wall Street Journal believes that the approaching economic downturn has no analogs in history, tens of millions of jobs will be lost, which will end in the collapse of the economy. USDCAD The loonie stabilizes after testing the resistance of 1.4685 from 2016. It is too early to hope for a downward rebound, given the slowdown in economic activity, but a technical pullback may well take place. Despite the fact that technical oscillators indicate a strong overbought pair, a fundamental look at USDCAD does not show any deviations from the calculations. The fair price for the Canadian is close to the spot price, the price is directed up, and there are no signs of a reversal.
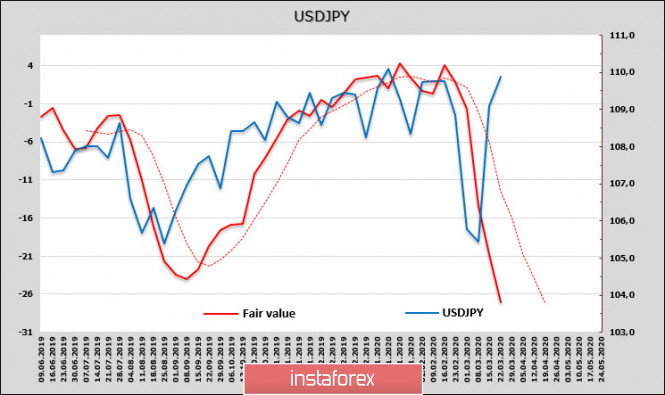
The combined short position for the Canadian, according to the CFTC, has increased, and weak oil and problems in the US, which have paralyzed retail trade, do not allow us to hope for any stabilization of exports. So the reason for the growth of the USDCAD is not only that the demand for the dollar has increased sharply, and not only in the price of oil – the entire export industry of Canada, including the one that has an indirect relationship to oil, is under threat. The massive liquidity injection undertaken by the six largest central banks helped to stabilize the situation. This week, the rate of the loonie will be determined mainly by the following factors. First, it is likely the onset of paralysis of the retail trade in the United States. Second, a sharp increase in unemployment. Third, news on coronavirus – any positive signal can serve as a trigger for an increase in demand for risky assets, which are currently monstrously oversold. Fourth, the increased threat of another emergency meeting of the Bank of Canada, which currently holds a significantly higher rate after a number of other central banks lowered it. To date, the most likely scenario is to retest 1.4685 and consolidate above this area. USDJPY The Bank of Japan has so far refrained from tough measures to support the economy, although formally there are grounds for this – consumer inflation, instead of the expected growth, showed a fall to 0.4% in February, and deflation is just around the corner. The calculation of a fair price for the yen hints that as soon as the US Federal Reserve throws the promised trillions into the market, the pair will go down sharply. Its growth in the last week was provided solely by the lack of dollars.
The Bank of Japan still intends to carry out previously planned operations. On March 25, the measures to promote corporate finance adopted at the meeting on March 16 will be announced, as well as possibly expanded purchases of ETFs and J-REITs. While none of the board members has spoken out about the deterioration of conditions, we should not wait for active actions. The USD deficit implies an increased probability of testing 112.19, but in the long term, we need to wait for the pair to turn down. Accordingly, sell on growth to return to the zone of 106/107. The material has been provided by InstaForex Company - www.instaforex.com |
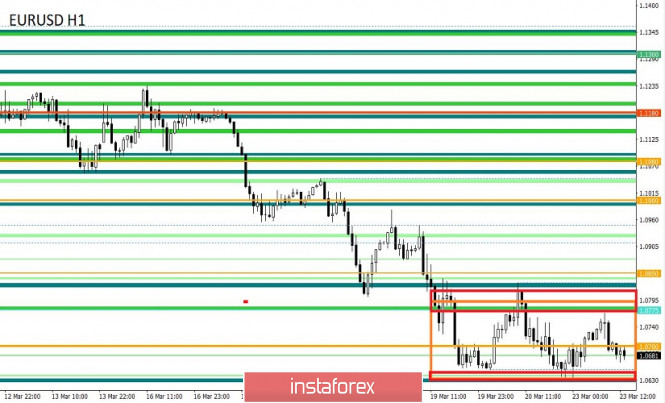
| Trading recommendations for EURUSD pair on March 23 Posted: 23 Mar 2020 05:26 AM PDT From a comprehensive analysis, we see an update of local minimums, with the transition to a sideways movement. And now about the details. The past week reflected a vigorous downward move, where sellers managed to pass more than 500 points, which led to an update of the lows and a descent of the quote to the area of April 2017. In fact, we were faced with a panic mood that brought down the financial markets and arranged a kind of fixation of positions in the dollar around the world. Relative to the last oscillation, we see the outlines of a variable flat with the borders of 1.0650/1.0775. These frames serve as a regrouping of trading forces, which does not exclude a further decline. Regarding the theory of downward development, we see that the minimum in the face of the mark of 1.0325 was not reached, but this does not mean that the price will not be able to get closer to this level in the near future since the external background is in this position. Thus, the forecast for a further decline towards 1.0500; 1.0350 (1.0325) remains with traders, where it is possible that due to the aggravation, we may see a critical mark of 1.0000. In terms of volatility, we record high activity indicators, where there is an acceleration on a daily basis, which is not ignored by speculators. Regarding the dynamics of the average daily value, we see that this indicator has almost doubled since the beginning of the year, which means that the EURUSD pair has lost its status as a conservative instrument. Volatility details: Monday-155 points; Tuesday-183 points; Wednesday-115 points; Thursday-278 points; Friday-166 points Monday-151 points; Tuesday-234 points; Wednesday-243 points; Thursday-326 points; Friday-194 points. The average daily indicator relative to the volatility dynamics is 96.67 points (see the volatility table at the end of the article). Analyzing the Friday day every minute, we see a V-shaped oscillation, where at first the quote managed to partially recover, locally returning us to the area of the level of 1.0775, but after that, at the start of the Europeans, the quote resumed its downward movement, eventually updating the minimum. As discussed in the previous review, traders are still inclined to further descend and this is confirmed by the update of the lows. Looking at the trading chart in general terms (the daily period), we see literally a free fall, which came on March 10 and still does not have a corrective course. In fact, the downward trend that took place back in 2008 has not gone away, it continues to develop. Friday's news background did not contain any noteworthy statistics on Europe and the United States, and all the market's attention was focused on the external background. In terms of the general information background, we see that the coronavirus continues to cover almost all countries where huge rates of cases are recorded. So, the epidemiological situation tells us that 338,698 have already been infected in the world, and over the past day in the United States, a record of 9,065 cases of infection was set, which scares the whole world with its scale. In Europe, where the rate of spread is not decreasing, German Chancellor Angela Merkel, who was found to have a coronavirus, has already gone to home quarantine "In this regard, the Chancellor decided to immediately go to home quarantine. She will be regularly tested for coronavirus," the Cabinet said in a statement. Also infected were the chief Brexit negotiators, Michel Barnier and David Frost, who are now in self-isolation. In turn, a member of the Board of Governors of the European Central Bank (ECB), Ignazio Visco, during an interview with La Stampa newspaper, said that the actions of the regulator are sufficient, but the EC can take great measures to deal with the consequences of the COVID-19 virus. "The set of measures adopted was effective in easing tensions. We believe today that this is enough, but we are ready to do more if necessary," said Ignazio Visco. Today, in terms of the economic calendar, we do not have statistically significant data for the EU and the US, and all attention will continue to focus on the COVID-19 virus and the consequences it brings. Further development Analyzing the current trading chart, we see a reverse downward movement, which has already returned the quote below the mark of 1.0700. In fact, the quote is located at a distance of fewer than 40 points from the update of the local minimum, but it is worth noting that the movement in the conditional sideways course (1.0650/1.0775) is still preserved. Our main task is to identify the breakdown of this flat, where the price will take focus already behind its aisles. In this case, you will be able to catch the main turn of the course. In terms of emotional mood, we see that high activity remains in the market, where the external background continues to put pressure on speculators, who take advantage of the noise and pump volatility into the market. Detailing the available period every minute, we see that the pattern regarding the start of the Europeans is still relevant. The downward move resumed just at the beginning of the European session, lowering the quote to 1.0667. In turn, traders are waiting for the price to overcome the area of 1.0636/1.1650 to resume short positions. An alternative scenario is considered if the price is fixed above the area of 1.0775 relative to the four-hour chart. We can assume that the fluctuation within the range of 1.0650/1.0775 will still remain in the market, where the main tactic is to catch a downward move in the case of a breakdown of the lower area of 1.0636/1.1650. Based on the above information, we will output trading recommendations: - We consider buying positions if the price is fixed higher than 1.0775 on H4, with the prospect of a move to 1.0830-1.0850. - We consider selling positions if the price is fixed below the area of 1.0636/1.0650, with the prospect of a move to 1.0500. Indicator analysis Analyzing different sectors of timeframes (TF), we see that the indicators of technical instruments still signal a sale relative to all major periods. It is worth noting that minute intervals are now subject to lateral movement, so the indicators may be variable. Volatility for the week / Measurement of volatility: Month; Quarter; Year. Volatility measurement reflects the average daily fluctuation from the calculation for the Month / Quarter / Year. (March 23 was based on the time of publication of the article) The volatility of the current time is 132 points, which is already 37% higher than the daily average. It is likely to assume that even a fluctuation in the range does not cancel the acceleration, and the external background will continue to focus on speculative activity on itself. Key levels Resistance zones: 1.0775*; 1.0850**; 1.1000***; 1.1080**; 1.1180; 1.1300; 1.1440; 1.1550; 1.1650*; 1.1720**; 1.1850**; 1.2100. Support zones: 1.0650 (1.0636); 1.0500***; 1.0350**; 1.0000***. * Periodic level ** Range level *** Psychological level The material has been provided by InstaForex Company - www.instaforex.com |
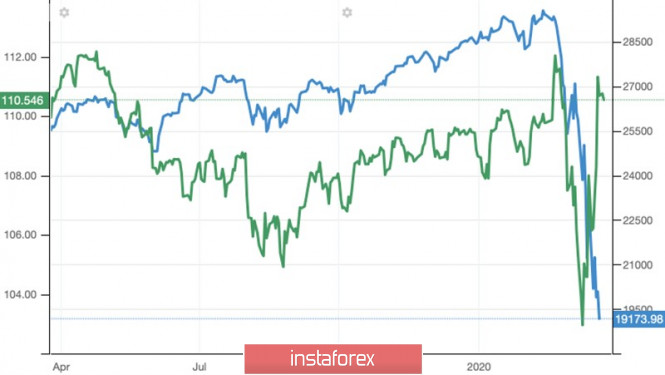
| Yen is in no hurry to return home Posted: 23 Mar 2020 04:53 AM PDT Easing monetary policy no longer leads to a fall in the exchange rates of national currencies, and the transition of the S&P 500 to the hands of "bears" – to a downward trend in USD/JPY. The Fed lowered the federal funds rate by 100 bps and revived QE by $700 billion, while the Bank of Japan responded by modestly increasing purchases of ETFs from £6 trillion to £12 trillion and kept the overnight rate at the same level. However, the yen weakened to a one-month low instead of growing against the US dollar. A paradox? Not at all! In times of economic crisis, everything is turned upside down. By aggressively easing monetary policy, the Fed actually returned the dollar to the status of the main funding currency (before that, it was actively used by the euro and the yen due to the low negative rates of the debt markets of the eurozone and Japan), which, together with the soaring volatility in Forex and high demand for the US currency outside the US, contributed to a sharp increase in the USD index. In the steel market, rumors are actively spreading that investors are going into a cache, fearing for the fate of their assets. However, the unexpected divergence between USD/JPY and US stock indices suggests that this is not the only reason. Dynamics of USD/JPY and Dow Jones index
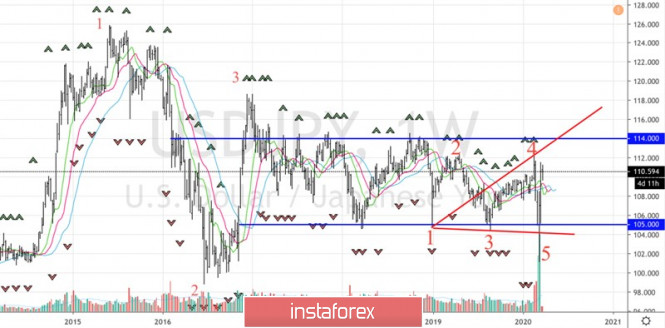
During the last 11 years of the existence of the "bull" market for American shares, residents of the Land of the Rising Sun have been active buyers of these securities. And no wonder, at home, due to low-interest rates, they could not earn money seriously. For pension funds, including the world's largest GPIF, which has a $1.6 trillion portfolio, asset diversification was a necessity due to Japan's aging population. As a result, stocks issued in the United States were bought, the growth of the S&P 500 led to a rally in USD/JPY due to the overflow of capital from the Land of the Rising Sun to the United States. In 2020, due to the reversal of the trend in American stock indices, their paths with the yen diverged. Japanese investors do not return money to their homeland, but use cash to maintain their own positions in the US stock market. Some use the correction as an opportunity to buy fairly cheap securities. As a result, the S&P 500 continues to go down, and USD/JPY goes up. The process of weakening the yen may accelerate if the market can be stabilized thanks to a large-scale monetary stimulus from the Fed and fiscal assistance from the White House in the amount of about $2 trillion. The latest collapse in stock indices was due to the fact that the Senate did not approve the project of Donald Trump and his team. Nevertheless, the President does not lose hope. His new attempts to get the program through Congress are far more important than the events of the economic calendar, which allows the yen to claim the role of the most interesting G10 currency in the week to March 27. Technically, the activation of the "Deception-Outlier" and "Wolf Wave" patterns is able to move the USD/JPY quotes at least to the levels of 112 (target on the "Wolf Wave" model) and 114 (the upper limit of the medium-term consolidation range of 105-114). Until the pair holds above 108-108.5, the situation is controlled by the "bulls". USD/JPY, the daily chart
|
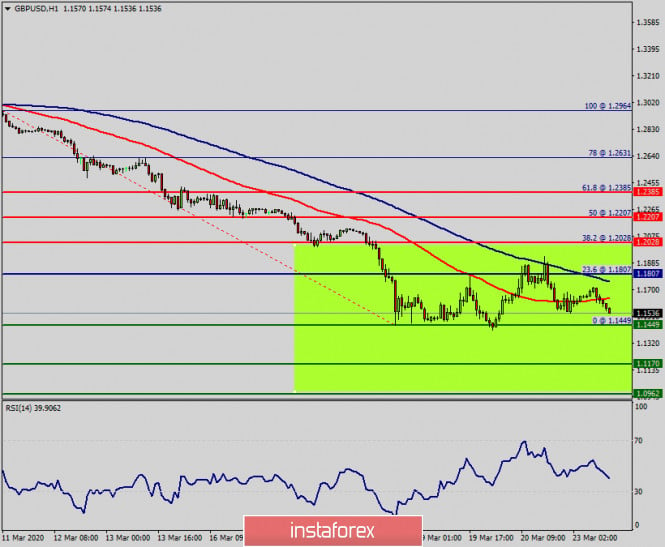
| Technical analysis of GBP/USD for March 23, 2020 Posted: 23 Mar 2020 04:39 AM PDT Overview: Pair : GBP/USD. Trend : bearish market. The GBP/USD pair suffers its worst weekly loss because the Coronavirus crisis. The GBP/USD pair bears catch a breath near the lowest levels since October 2019. Following its drop to the lowest in 6 months, the GBP/USD pair struggles for direction while taking rounds to 1.1449. Is Brexit more dangerous than coronavirus for the pound? That what will know in coming days. Technically: Pivot: 1.1817. The trend is still bearish as long as the level of 1.1817 is not broken. The level of 1.1600 has been rejected several times confirming the validity of a bearish market today. So, the first resistance is seen at 1.6000 . The market is still indicating a strong bearish trend from the spot of 1.1600. Thereupon, it would be wise to sell below the level of at 1.1600 with the primary target at 1.1445. On the downside, a clear break below 1.1449 could trigger further bearish pressure testing 1.1449, which coincides with a triple bottom. Then, the trend is keeping its bearish momentum in coming days. As a result, it is gainful to sell below this price with targets at 1.1250 and 1.1170. We expect a new range below the area of 1.1449 towards the daily support of 1.1449. The bias remains bearish in the nearest term testing 1.1250 and 1.1170. Consequently, the GBP/USD pair will probably be moved between the levels of 1.1533 and 1.1170. The stop loss has always been in consideration. Hence, it will be useful to set it above the resistance of 1.1807. The material has been provided by InstaForex Company - www.instaforex.com |
| EUR/USD: euro is trying to be ahead of the curve Posted: 23 Mar 2020 04:31 AM PDT The US Senate's rejection of the White House support plan for the national economy, pessimistic forecasts for the country's labor market and GDP, rumors about G7 currency interventions, and the fact that the Federal Reserve managed to dampen increased demand for the US currency with the help of swaps and somewhat cooled the ardor of the EUR/USD bears. The intention of the German authorities to untie the money bag added fuel to the fire. Berlin has announced the creation of an additional budget of €156 billion and an anti-crisis fund of €500 billion to help local companies affected by the coronavirus epidemic. Unlike Europe, which is quick to make decisions, the United States clearly has problems approving the proposed initiatives of the US administration by the legislature. The national economic stimulus package (almost $2 trillion) was supported by only 47 votes in the US Senate, with the necessary 60. The main stumbling block was a package of $500 billion in aid to US corporations affected by the coronavirus. Democrats said there was no guarantee that the funds would not be used to buy back their own shares. Meanwhile, the speed of decision - making on fiscal stimulus is an extremely important indicator in the current environment. According to Bloomberg experts, if the national governments of the eurozone countries take a broad step forward, the decline in the currency bloc's economy will be deep, but short-lived. Otherwise, it may not survive the recession. It is expected that in the first quarter, the eurozone's GDP will shrink by 3.1%, and in the second – by 2.4%. Banks and reputable organizations expect to see an even darker picture of the US economy. Analysts at Goldman Sachs forecast a 24% decline in us GDP in the second quarter, while experts at Oxford Economics forecast a 12% decline. According to JP Morgan estimates, by the end of 2020, the US economy will shrink by 1.8%, and in the spring, the local labor market will miss 7-8 million jobs. The head of the St. Louis Federal Reserve, James Bullard, also warns about the risk of unemployment rising to 30% in the country and a 50% decline in GDP in April–June. Obviously, with the fiscal stimulus, the United States has clearly dragged on. So far, the epidemiological situation in Europe looks worse than in the US. However, the European legislation is much more loyal to people who go on sick leave than the American legislation. Many US workers are forced to go to work rather than stay at home. As a result, the number of coronavirus infected in the country is growing faster than in other states. If we add to this the decrease in the value of cross-currency swaps, indicating that the Fed managed to somewhat cool the demand for the greenback outside the United States, as well as rumors about the repetition of the story with the Plaza Accord in 1985, when the G7 countries jointly sold the US currency, then the upward correction of EUR/USD looks quite logical. In this regard, a successful assault by the bulls on the resistance by 1.0750 will raise the chances of developing a pullback to 1.0840. The material has been provided by InstaForex Company - www.instaforex.com |
| Posted: 23 Mar 2020 03:31 AM PDT EUR / USD
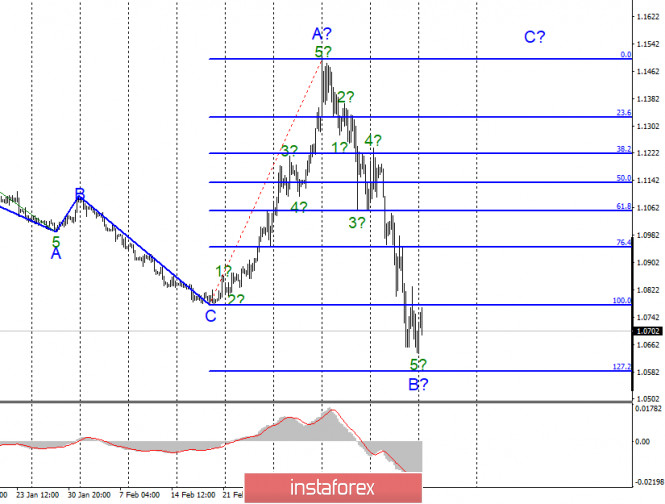
On March 20, the EUR / USD pair gained about 30 base points, although it reached the level of 1.0830 during the day. Nevertheless, Friday ended near the level of 1.0700, and trading on Monday is around it. At the moment, wave marking does not look that difficult, but ambiguous. The estimated wave B in the horizontal trend section is supposedly completed. If this is true, then the increase in prices will continue with the current levels in the direction of 15th figures within wave C. However, the main problem lies precisely in the fact that the news background has a strong influence on the markets, so the drop in the quotes of the instrument can easily continue. Fundamental component: There was no news background for the EUR / USD instrument on March 20. There were no economic reports from America and the European Union. However, they have now little influence on the currency market since much more markets are interested in the extent of the spread of coronavirus on our planet. In the past two weeks, the US dollar has been in high demand in the market, since the epidemic in America was weak, and the status of the dollar (the currency that has always been and always will be) was almost the only reason for the high demand for the US currency. However, the dollar has stopped growing in the past few days. Either due to the fact that everyone who wanted to convert their assets into American currency already did this, or because the epidemic began to gain momentum in America. If the second reason is relevant, then the demand for the US currency may now decline. After a long decline in both instruments, corrective waves are needed. The more cases there are in America, the more the American economy will shrink. Moreover, the markets have long ignored the falling US stock market, the US oil companies that are experiencing serious problems due to low oil prices. Perhaps, it's now time to pay attention to the fact that faith in the dollar is not supported by anything and the economic situation is no better than European or British. General conclusions and recommendations: The euro-dollar pair presumably completed the construction of the downward wave B. The entire trend section, starting on February 20, can have very strong correction waves, which will be equated to almost 100% of the pulsed ones. So far, the main option for the development of events is the construction of an ascending wave C. You can carefully buy an instrument using the MACD signal "up". GBP / USD
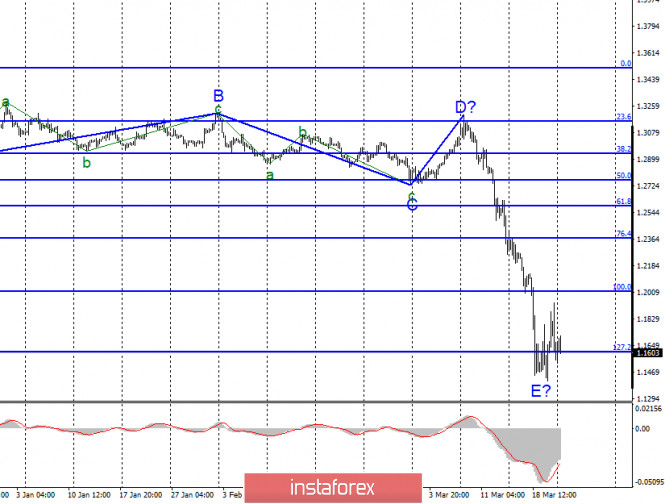
On March 20, GBP / USD added 180 basis points, which in the current conditions is not a big figure for the pound. Last Friday, the quotes of the instrument reached the level of 1.1930, but closed the week near the level of 1.1650. Around which, trading took place on Monday. The current wave marking involves the completion of the construction of wave E, as well as the entire downward trend section, which began on December 13. At the same time, given the current state of the markets, it is possible that the wave pattern will require adjustments and additions. Fundamental component: There was no news economic background for the GBP / USD instrument on Friday either. The governments of Great Britain and the United States continue to take all necessary measures to stop the spread of the COVID-2019 epidemic, as well as mitigate its impact on the economy. Unfortunately, it is not possible to stop the epidemic so far. In this regard, US President Donald Trump gave his permission to introduce the National Guard to the states most affected by the epidemic - New York, California and Washington. Meanwhile, full quarantine has been introduced with the maximum level of restrictions in the UK. According to official information, the number of infected in the US is already 40,000, and in Britain - 5,000. However, these figures are unlikely to reflect the actual volume of infection, only approximate. General conclusions and recommendations: The pound / dollar instrument continues to complicate the current wave count. Thus, I still do not recommend trading, as the situation in the markets is very unstable. Perhaps wave E is completed, which indicates the willingness of the markets to buy the pound, but the trading amplitude was 500 points on Friday. Traders must decide for themselves whether the current risks are acceptable to them. The material has been provided by InstaForex Company - www.instaforex.com |
| Analysis and forecast for GBP/USD for March 23, 2020 Posted: 23 Mar 2020 03:29 AM PDT Hello, traders! Despite the fact that the Bank of England lowered the main interest rate to 0.1% and increased the volume of the QE program to 645 billion pounds, the UK may face a recession according to many experts. It is all the fault of the COVID-19 outbreak, which threatens to lead to a significant decline in economic growth in the United Kingdom. According to some forecasts, British GDP may fall by 2.6% if Boris Johnson's cabinet fails to take adequate measures to combat the coronavirus. However, according to one well-known major bank, the American economy also remains very vulnerable to the consequences of the pandemic, and the drop in economic activity in the United States of America may be 24%. An impressive figure that is more than twice the post-war figure. Before proceeding to technical analysis, I would like to draw your attention to the fact that a large amount of macroeconomic data from the UK and the US is expected to be published this week. Today is an exception. In the economic calendar, you can only see the index of economic activity from the Federal Reserve of Chicago, which will be published at 13:30 (London time). Weekly
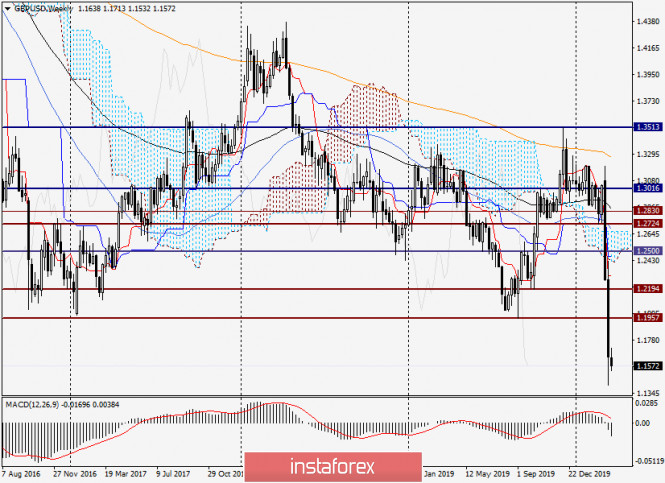
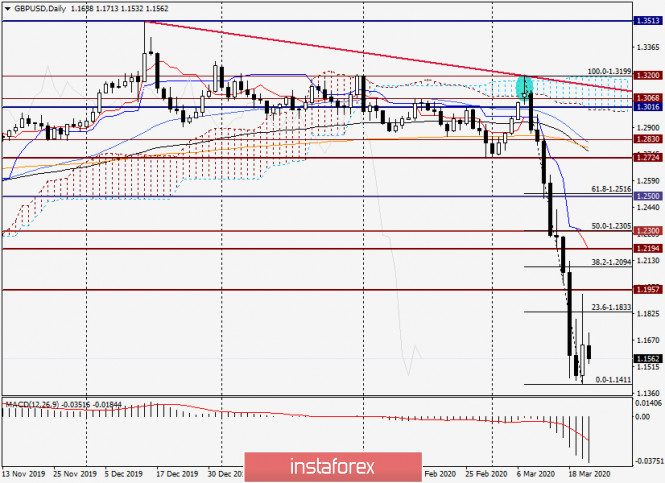
Following the results of trading last week, a second huge bearish candle appeared in a row with a very low closing price at 1.1640. At the same time, support for 1.1957 was broken. Given the strength of the downward dynamics and the closing price, there is no doubt that the breakout of 1.1957 is true. What's next? It seems that the British currency has passed through a free fall, the boundaries of which are not possible to determine now. The situation can change only if the bulls on the pound manage to return the quote above 1.1957 and finish the week above this level. Taking into account that the US dollar is currently the undisputed favorite in the foreign exchange market, this task is very difficult. If the assumption of a further fall in sterling is correct, we will look for points for selling GBP/USD in smaller time intervals. Daily
Last Friday, the pair rolled back slightly above 23.6 Fibo from the fall of 1.3199-1.1411, but fell short of the broken support level of 1.1957. In my opinion, this moment was very good for opening sales, but it is already in the past. We can assume that the pound/dollar will once again try to adjust to the area of 1.1830 and give an opportunity to open short positions. If the pair manages to rise above Friday's highs of 1.1933 and close the session above this level, there will be a probability of a deeper corrective pullback, the goals of which will be the psychological level of 1.1000, and above the level of 1.2094 and possibly 1.2194. H4
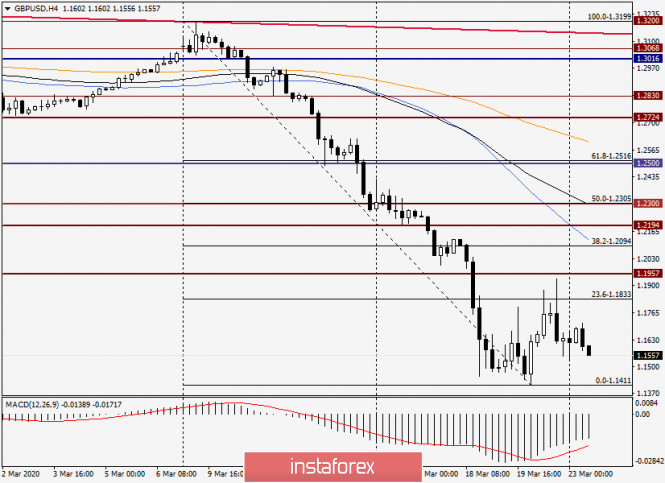
On the 4-hour chart, the pair is trading in a relatively narrow sideways range. Although, given the strong volatility of trading, it can only be called narrow. I usually suggest opening positions on the trend, and after corrective rollbacks. Despite strong bearish pressure, there is always the possibility of a rate correction, so it is risky to open short positions near the current lows. I dare to assume that in the event of a rise in the price zone of 1.1700-1.1770 and the appearance of bearish candle signals there, there will be grounds for opening sales for GBP/USD. You should look for more attractive prices for opening short positions in the area of 1.1830-1.1900. Alternatively, for those who trade on the breakdown, you can try to sell at the census of the minimum values on March 20 - 1.1411. In my opinion, this is quite risky, but it's up to you. Good luck! The material has been provided by InstaForex Company - www.instaforex.com |
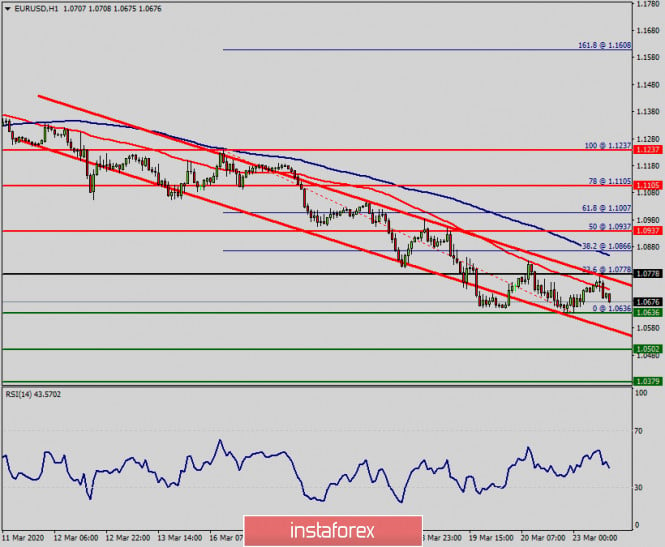
| Technical analysis of EUR/USD for March 23, 2020 Posted: 23 Mar 2020 03:01 AM PDT Overview: The EUR/USD pair continues Its down amid coronavirus crisis. The strength of the dollar nowadays, supported by concerns about the effect of coronavirus. The U.S. dollar rose against most of currencies since coronavirus crisis. Last week, the euro weakened after the European Central Bank declared more positive news to fight the effect of the coronavirus but did not lower interest rates. Technically, the EUR/USD pair dropped sharply from the level of 1.0937 towards 1.0636. Now, the price is set at 1.0685. On the H1 chart, the resistance of EUR/USD pair is seen at the level of 1.0778 and 1.0937. It should be noted that volatility is very high for that the EUR/USD pair is still moving between 1.0778 and 1.0502 in coming hours. Moreover, the price spot of 1.0778 remains a significant resistance zone. Therefore, there is a possibility that the EUR/USD pair will move downside and the structure of a fall does not look corrective. So, sell below 1.0778 with the first target at 1.0636 to test last week's bottom. In overall, we still prefer the bearish scenario as long as the price is below the level of 1.0778. Furthermore, if the eur/USD pair is able to break out the bottom at 1.0636, the market will decline further to 1.0502. However, it would also be sage to consider where to place a stop loss; this should be set above the second resistance of 1.0937. The material has been provided by InstaForex Company - www.instaforex.com |
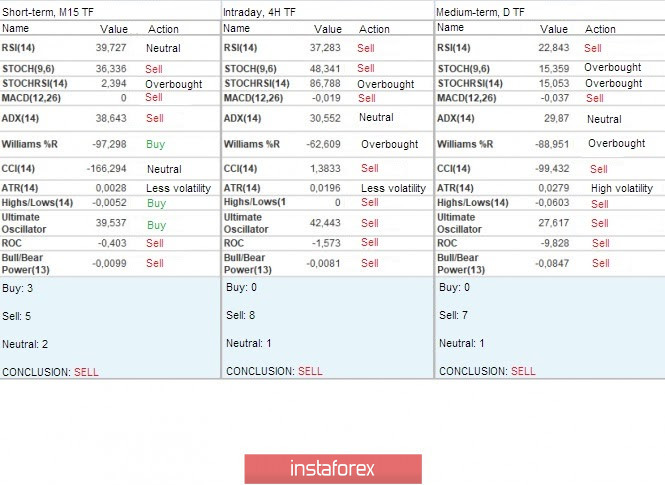
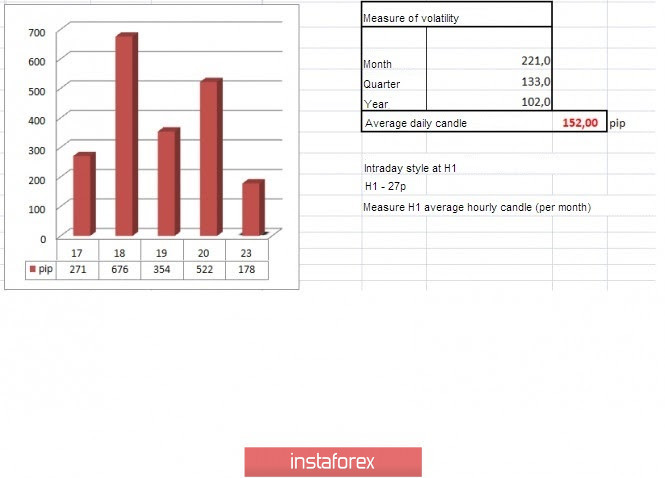
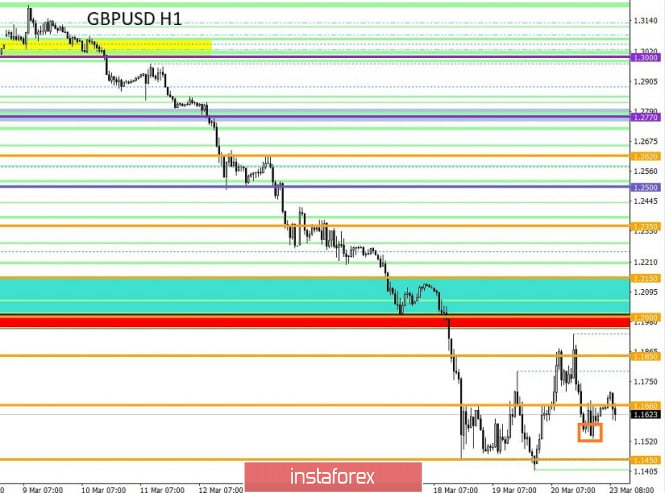
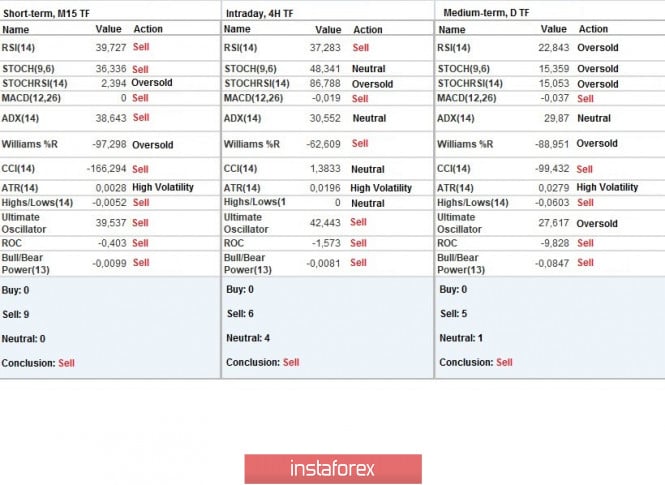
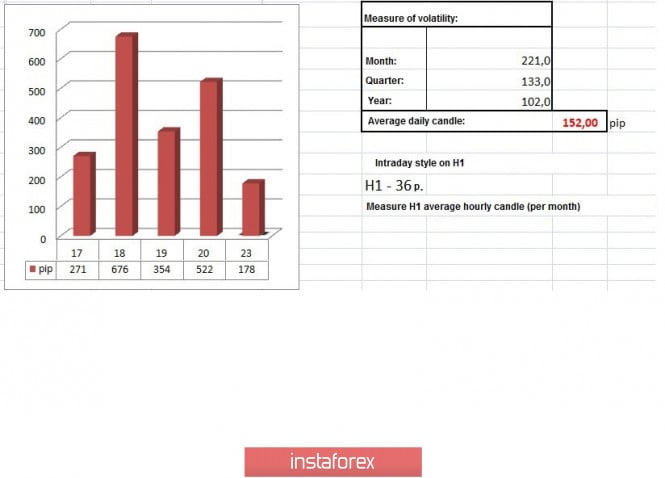
| Trading recommendations for GBP/USD pair on March 23 Posted: 23 Mar 2020 02:18 AM PDT From the point of view of a comprehensive analysis, we see a partial recovery process after updating the lows, but there are no fundamental changes. Now, let's talk about the details. Last week was one of the most active in recent years, where more than 900 points were covered, but this is not the most important, since the main event was the update of the lows. At the same time, we have not recorded such bottoms for decades, and this leads to panic among investors in Britain. The minimum mark of the week was the value of 1.1411, where the quote slowed down and formed a partial recovery. In fact, we do not see dramatic changes after a rebound from the minimum, and if we turn our attention to March 18, we will notice that this is not the first recovery, but most importantly not the first probing of the lower classes. That is, the quote faced an interesting phenomenon, where the external background does not allow it to grow, but it does not go down further farther due to the high pressure of historical lows. Thus, it turns out that the borders of a wide flat loom. Regarding the theory of downward development, we see that the key coordinates have already been reached and if it were not for the external background, then the transition to an upward recovery would have already come, but due to difficult circumstances in the world, further decline is not ruled out. With this background, special attention is paid to having a slowdown, where in order to resume the downward mood, the quote needs to concentrate on the range of 1.1450 / 1.1650. An alternative scenario will be considered with a price concentration in the range of 1.1850 // 1.2000 // 1.2150. In terms of volatility, we see the second mega activity for the week, which exceeded the daily average by 243%. The previous surge was recorded on March 18 - 676 points. Regarding the general dynamics, an acceleration has been recorded as early as a month, which does not remain without attention among speculators. Details of volatility: Monday - 165 points; Tuesday - 245 points; Wednesday - 172 points; Thursday - 358 points; Friday - 359 points; Monday - 144 points; Tuesday - 271 points; Wednesday - 676 points; Thursday - 354 points; Friday - 522 points. The average daily indicator, relative to the dynamics of volatility is 152 points [see table of volatility at the end of the article]. Detailing every minute of Friday, we see that the day began with an update of the low, where the recovery process started almost immediately, which led us to the area of 1.1850 [maximum point 1.1933]. Then with the entry into the American market, the reverse process took place, returning us below the level of 1.1660. As discussed in the previous review, traders worked locally in long positions, where profit taking occurred in the region of 1.1850. Sales positions began to be considered against the background of a possible development of the level of 1.1850, already below the level of 1.1790. Considering the trading chart in general terms [the daily period], we see a solid inertial movement, where the quote passed more than 1600 points without significant pullbacks for eight trading days. In fact, having stagnation is the first adjustment in a given time span. Friday's news background did not have significant statistics on Britain and the United States, thereby focusing on the external background. The information background continues to be under the strongest pressure of the virus raging in the world, where 338,698 have already been infected, and only 5,741 in Britain. Moreover, the coronavirus conditionally paralyzed the negotiations between Britain and Brussels on trade relations after Brexit, since Michel Barnier, the EU negotiator who had a positive result found for COVID-19. After that, information appeared that the negotiator from the United Kingdom, David Frost, was also self-isolated in connection with the appearance of coronavirus symptoms in him. In turn, British Prime Minister Boris Johnson does not intend to extend the transition period after Brexit, but the topic of extension is mentioned among the British and EU governments more and more often. With respect to Britain's actions to limit the spread of the virus, French President Emmanuel Macron spoke out that he had to threaten England in order to get Johnson to move. However, the closure of pubs and clubs in the United Kingdom did not stop citizens who continued to raid parks and coastal cities. To which the government intends to expeditiously pass a bill on the state of emergency through parliament, for tougher measures to regulate the situation. Today, in terms of the economic calendar, we do not have important macroeconomic data for Britain and the United States, but even if the statistical data were there, they would still be on the second background after the COVID-19 virus. Further development Analyzing the current trading chart, we see price fluctuations within the level of 1.1660, where an attempt is made to resume the founding towards the base. In fact, the interaction of the levels of 1.1450 / 1.1660 is considered at this time, which leads to the development of a downward movement, due to the external background. From the point of view of the emotional mood of market participants, we see that activity is still high and this is due to the panic mood caused by the fall of the financial market, as well as the COVID-19 virus. By detailing the available time interval, we see that the start of the daily candle was in a local upward trend, but when the Europeans entered the market, the downward trend resumed. In turn, traders are considering descending positions in the direction of 1.1532-1.1450. Having a general picture of actions, it can be assumed that the downward development is still relevant, where the first point of interaction is in the region of 1.1532, which reflects the minimum of the current day. The subsequent coordinates are in the region of 1.1411 / 1.1450, which reflects the basis of the historical minimum. Based on the above information, we derive trading recommendations: - We consider buying positions in case of price fixing higher than 1.1660 and a yield higher than 1.1713. The prospect of running in the direction of 1.1850. - We consider selling positions in the direction of 1.1532. The next movement will be forecasted after reaching the first value. Indicator analysis Analyzing a different sector of timeframes (TF), we see that the indicators of technical instruments continue to signal sales, due to the preservation of a downward trend in the markets. Volatility per week / Measurement of volatility: Month; Quarter; Year Measurement of volatility reflects the average daily fluctuation, calculated for Month / Quarter / Year. (March 23 was built taking into account the time of publication of the article) The current time volatility is 178 points, which already exceeds the average daily indicator by 17%. As you understand, the panic mood has not disappeared, thereby the market activity will continue to grow. Key levels Resistance Zones: 1.1660; 1.1850; 1.2000 *** (1.1957); 1.2150 **; 1.2350 **; 1.2500; 1.2620; 1.2725 *; 1.2770 **; 1.2885 *; 1.3000; 1.3170 **; 1.3300 **; 1.3600; 1.3850; 1.4000 ***; 1.4350 **. Support areas 1.1450 (1.1411); 1.1300; 1,1000; 1,0800; 1,0500; 1,0000. * Periodic level ** Range Level *** Psychological level **** The article is built on the principle of conducting a transaction, with daily adjustment The material has been provided by InstaForex Company - www.instaforex.com |
| You are subscribed to email updates from Forex analysis review. To stop receiving these emails, you may unsubscribe now. | Email delivery powered by Google |
| Google, 1600 Amphitheatre Parkway, Mountain View, CA 94043, United States | |






No comments:
Post a Comment