Forex analysis review |
- EUR/USD: trapped in a wide-range flat
- GBP/USD. March 24. Results of the day. Donald Trump's dilemma: save the economy and have a high chance of re-election or
- EUR/USD. March 24. Results of the day. Coronavirus returns to China. Business activity in the services sector of the EU countries
- USDX forecast: Dollar testing 105 soon
- Fed gives hope to gold
- EURUSD and GBPUSD: The correction of the euro and pound after the gloomy PMI data only confirms all the nervousness of the
- Short-term technical analysis of EURUSD
- Gold challenges major Fibonacci resistance
- March 24, 2020 : GBP/USD Intraday technical analysis and trade recommendations.
- March 24, 2020 : EUR/USD demonstrating double-bottom pattern, probably preparing for a potential bullish movement.
- BTC analysis for 03.24.2020 - Potential end of the upward correction and downside continuation, drop towards the level of
- Trading recommendations for EURUSD pair on March 24
- EUR/USD analysis for 03.24.2020 - Potential for upside continuiation towards the level of 1.0887
- Evening review 03/24/2020. EURUSD. Markets grow on Tuesday, but it's clear to everyone that the worst is yet to come
- Analysis for Gold 03.24.2020 - Pitchfork median line target at $1.610 has been reached, potentilal for downside rotation
- GBP/USD: plan for the US session on March 24. Buyers of the pound are full of optimism and are ready to break through the
- EUR/USD: plan for the US session on March 24. Bulls ignore the failed eurozone composite PMI and push the euro further up
- Technical analysis of AUD/USD for March 24, 2020
- Oil is looking for allies
- Analysis of EUR/USD and GBP/USD for March 24. The Fed is starting to buy back securities out of control in the hope of saving
- EUR/USD: it seems the dollar only dozed off on the throne, but is not going to leave it
- Trading recommendations for GBP/USD pair on March 24
- EUR/USD. March 24. COT report: speculators do not believe in further fall of the euro
- GBP/USD. March 24. The measures taken by the Fed do not allow the dollar to continue its carefree growth
- Analysis and forecast for EUR/USD on March 24, 2020
| EUR/USD: trapped in a wide-range flat Posted: 24 Mar 2020 02:33 PM PDT The euro-dollar pair is still marking time, although it shows a fairly high level of volatility. Buyers of EUR/USD since Friday regularly storm the eighth figure, but each time at the end of the trading session, the bears return the pair to its previous positions. However, sellers have also lost full control of the situation – any attempts at a more or less large-scale decline are used by traders to open long positions. As a result, the pair is forced to fluctuate within the seventh figure, alternately testing the eighth price level, then the sixth. However, based on the results of the last three trading days, we can conclude that a large-scale correction is overdue for the pair. By and large, there is every reason for a significant price surge, both technical and fundamental. But traders still hold on to the dollar-rather instinctively, after the huge hype around the US currency. In addition, the greenback holds its position due to the status of a defensive asset – investors do not yet see a worthy alternative, although, for example, gold is actively gaining momentum. But the dollar is still the most attractive asset among the instruments of the foreign exchange market, a safe-have in times of troubles. In other words, the Federal Reserve's unprecedented steps to provide liquidity, the Senate's inability to accept a package of economic incentives, the spread of the epidemic in the United States - all these factors only hinder the growth of the US currency, but (so far) are not able to fundamentally reverse the situation with the EUR/USD pair. The news from Europe does not help the bulls, although Brussels is also taking extraordinary steps. In particular, the European Union approved the suspension of budget rules for the first time in history. The Stability and Growth Pact, which limits the state budget deficit of the eurozone countries to three percent of GDP, was "ordered a longer life." Moreover, in Brussels they did not say for what period they suspended the operation of this fundamental document. Responding to this decision of the EU Council, the euro sharply rose in cross-pairs, however, together with the dollar, it was possible to allow only another correctional surge. This suggests that the dynamics of the pair depends only on the behavior and well-being of the dollar, while European events (and, accordingly, the reaction of the single currency) are optional. In which direction does the pendulum swing? In my opinion, in the short term, the pair will continue to fluctuate within the range of 1.0650 - 1.0890 (the lower line of the Bollinger Bands indicator and the local maximum, respectively). For example, today or tomorrow, the dollar may receive support from the Senate if the Democrats and Republicans agree on a two trillion dollar economic stimulus package. According to Reuters, the parties were able to find a common denominator, and most likely will vote for the bill in the near future. Democrats twice - on Sunday and Monday - blocked this document. In their opinion, it does not provide enough money to the state hospital, does not provide social assistance to the unemployed in the right amount, and suggests too large a fund to help large businesses. When this bill failed a second time, the dollar gave slack, making it possible for the EUR/USD bulls to re-enter the eighth figure. But the greenback regained the lost ground as soon as rumors of a compromise appeared. It can be assumed that in case of a positive outcome of the vote, the US currency will receive additional support, and will again test the sixth figure. However, this fundamental factor will not help the EUR/USD bears to overcome and gain a foothold below the support level of 1.0650. Whereas sellers need to confidently overcome this price target for the development of the downward trend. A corresponding news impulse is needed for such a price spurt, which again creates a stir around the US currency. That is why the sellers of the pair need to be careful around the middle of the sixth figure - on Friday and Monday the bears stormed this support twice, but in each case it was unsuccessful. Macroeconomic reports, both in Europe and in the US, are also ambiguous. For example, the US manufacturing PMI index reached 49.2 points, although experts expected it to be much lower - at around 43.5. But the preliminary PMI in the service sector in the United States reached a record low (39.2), while analysts predicted a higher result (44 points). A similar situation has developed in Europe: if the manufacturing PMI indices came out better than the forecast values (although below the key 50-point level), then it was just a catastrophic failure in the service sector. For example, the French indicator fell to 29 points. On the one hand, the dynamics of the above– mentioned indices were predictable-tourism has died all over the planet, and production has been languishing for the second month. On the other hand, a not so steep decline in production indicators provided little support for both the euro and the dollar. As a result, the pair again stopped almost in the middle of the intraday price range, that is, in the middle of the seventh figure. In my opinion, EUR/USD will be stuck within this wide-range flat in the medium term – the bears will be waiting for support of 1.0650 at the bottom, at the top- a local high of 1.0890 (or a little higher - the resistance level of 1.0940, the lower boundary of the Kumo cloud on D1). Both bears and bulls need a fairly powerful and unusual information occasion to overcome the limits of the specified range. The material has been provided by InstaForex Company - www.instaforex.com |
| Posted: 24 Mar 2020 02:33 PM PDT 4-hour timeframe Amplitude of the last 5 days (high-low): 272p - 680p - 320p - 523p - 268p. Average volatility over the past 5 days: 413p (high). The British pound is still the most volatile currency from the main basket. For example, during today's corrective day, the pound/dollar pair passed about 300 points. Thus, we can draw an almost unambiguous conclusion: the markets are saturated with purchases of the US currency, but remain in an overly excited state. The British currency stopped falling, but the pound/dollar pair has not grown. This means that for the most part, traders do not see the reasons and grounds for buying the British currency. The US dollar has ceased to be in demand on the basis of all the actions of the Federal Reserve, which announced an unlimited redemption of various kinds of securities in order to flood the economy with cash and save it from collapse. This is US President Donald Trump and Stephen Mnuchin who failed to push through Congress a bill that involves injecting an additional $1.6 trillion into the economy, which should have been directed to help the US population (each citizen can get about $1000), to help airlines, some of which are on the verge of bankruptcy, as well as helping small businesses that are also experiencing, for obvious reasons, not the best of times. Nevertheless, by majority vote, the bill was already blocked twice in the Senate, mainly due to the fact that it is opposed by the Democrats, who consider this package of assistance to be too expensive and aimed mainly at helping companies, rather than US workers. Democrats also believe that Trump wants to once again be promoted through such packages of assistance to the US population, because presidential elections will be held this year ... Meanwhile, business activity data for various sectors of the economy have also been released in the UK today. The numbers are almost identical to European. In the services sector, business activity in Great Britain crashed down to a preliminary estimate of 35.7 in March. In the manufacturing sector - 48 (!!!). Thus, the picture is the same as in Germany and in the European Union. The service sector collapsed, and the manufacturing sector shows a slight slowdown in business activity. The United States is still more interesting. The decline was significantly higher than experts expected in the services sector. The actual value is 39.1 with the February value of 49.4. But the production sector lost only a few points and amounted to 49.2. Such a value in current realities can even be called high. Composite PMI was 40.5 points. Thus, in general, the situation is approximately the same both in the United States and in Europe. Meanwhile, Trump, who seems to be thinking much more about how to win the presidential race this year than about the health of his fellow citizens, offers to abolish all quarantine measures. On his Twitter, the US president made a cryptic entry: "treatment of a problem cannot be worse in consequences than the problem itself." Despite the fact that the Fed and the Ministry of Finance are doing everything possible to save the economy, the US leader believes that a significant reduction cannot be avoided. And the longer the quarantine lasts, the stronger the reduction. And on the eve of the election, Trump does not need a contraction in the economy. It is precisely the growth of the US economy that the head of the White House has repeatedly pressed in his election speeches. Thus, now that the US economy can roll back to 2016 levels, Trump is losing one of his main trump cards before the Democrats. "Our country was not created for closure. We are going to open our country to business, because our country must be open," Trump said this week. At the same time, medical experts believe that the United States has not even entered the most critical stage of the epidemic. That is, the peak of the spread of the virus is yet to come. And if quarantine is now lifted, then the number of sick people will increase many times over. The US president needs a strong economy, so "let's give everyone $1,000 each and kick them back to work." However, many experts believe that "to kill two birds with one stone" in this situation will not work. If you open the economy, the infection curve will change its appearance, that is, the number of infected people will simply increase. If this is not done, then the economy will not be revived in the near future. Therefore, the dilemma: what is more important to Trump - to raise the economy or the lives of his own citizens? Meanwhile, some agencies are already beginning to calculate the possible losses to the UK economy from a pandemic. The figures are terrifying. Experts believe that the British economy could shrink by 5%. And again, everything will depend on how long the quarantine lasts and how quickly the spread of infection can be stopped. According to the latest data, almost 7,000 people have already become infected in Britain. A bit compared to other countries. However, the infection continues to spread. From a technical point of view, the British pound continues to adjust. The correction is very weak, more even lateral. However, for the British currency, the absence of a new fall against the US currency is already happiness. In our opinion, the pound may calmly resume falling in the coming days, as markets remain in a state of panic. And since now the main task of each trader and investors is to preserve their assets, and there is no better way than buying dollars, in the general opinion, it is the dollar that can resume growth in the coming days. As you can see, today's statistics from the UK and the United States was not the basis for the purchase of the British pound. Most likely, the pound is growing solely on technical factors. Recommendations for short positions: The pound/dollar pair resumed corrective movement on the 4-hour timeframe. Thus, sales of the pair with the goal of the first support level of 1.1229 are still relevant, but only in case of a price rebound from the Kijun-sen line. Recommendations for long positions: Buying the GBP/USD pair is recommended only if quotes return to the area above the critical line with the first goal, the resistance level is 1.2242. However, when opening any positions, it is recommended to act as carefully as possible and remember about the increased risks. Explanation of the illustration: Ichimoku indicator: Tenkan-sen is the red line. Kijun-sen is the blue line. Senkou Span A - light brown dotted line. Senkou Span B - light purple dashed line. Chikou Span - green line. Bollinger Bands Indicator: 3 yellow lines. MACD indicator: Red line and bar graph with white bars in the indicators window. Support / Resistance Classic Levels: Red and gray dashed lines with price symbols. Pivot Level: Yellow solid line. Volatility Support / Resistance Levels: Gray dotted lines without price designations. Possible price movements: Red and green arrows. The material has been provided by InstaForex Company - www.instaforex.com |
| Posted: 24 Mar 2020 02:33 PM PDT 4-hour timeframe Amplitude of the last 5 days (high-low): 234p - 243p - 326p - 193p - 192p. Average volatility over the past 5 days: 238p (high). The EUR/USD currency pair continues the correctional movement on March 24, which began a few days ago. As part of this movement, the Kijun-sen line of the Ichimoku indicator was worked out. Thus, there are reasons to assume the completion of the correction and the resumption of the downward movement. Moreover, at first glance, we have a rebound from the critical line, and not just a reversal around it. At the same time, we would not recommend making such high-profile conclusions in the current state of the market. The technical picture may change at any time, despite the fact that the illustration does not scare traders at all. It may seem that volatility has returned to normal and market participants have accordingly calmed down. However, this is completely wrong. During today's quiet trading, the EUR/USD pair passed 170 points. Recall that the normal volatility for the euro/dollar pair is 50-60 points per day. Thus, in general, we can draw the following conclusions. Firstly, high volatility persists, which means that panic in the foreign exchange market also persists. Secondly, the pair has performed the lowest necessary correction and can now try to resume the downward trend. Today's macroeconomic data had a chance to influence the movement of the currency pair. Recall that in the last few weeks, immediately after the onset of the general panic caused by the spread of coronavirus, the macroeconomic background was completely ignored by traders. We talked about the fact that the market conditions have changed during the epidemic and market participants can begin to respond only to data relating to the new time, that is, the month of March. Today we witnessed the first reports for this month. First, data were published on business activity in Germany, the locomotive of the European economy. Just want to note that absolutely all forecasts of business activity were, as they say, "below the baseboard". Nevertheless, the industrial sector showed lower rates of deceleration than expected. Business activity in this sector decreased to just 45.7, which is slightly lower than the previous value - 48.0. But the service sector, we can say, definitely plunged down. Business activity decreased from 52.5 points to a disastrous 34.5. Composite business activity index was 37.2. Thus, in general, it is even difficult to say whether this package of statistics was positive or negative. From our point of view, it is still negative, but traders most likely expected even worse values. Thus, the strengthening of the European currency during Tuesday may be triggered by these publications. However, with German data on business activity, everything was just beginning. Furthermore, European indices were immediately published, which practically repeated the trend of German indices. In the manufacturing sector, a reduction to 44.8 points was recorded (again, it could have been much worse), and in the service sector, a drop from 52.6 to 28.4. Composite business activity index was 31.4. In addition to European business activity, similar indicators were published in France. Here the picture is the same. The manufacturing sector remained afloat, showing 42.9, while the services sector went deep under water - 29.0. Thus, we have a situation where all nine indices in the eurozone turned out to be much worse than the values of the previous month. However, this is not surprising. These are the numbers we were expecting from the month of March. The only thing that was really surprising was the value of business activity in the manufacturing sectors. Meanwhile, the total number of patients with coronavirus worldwide is already almost 400,000. And we once again recall that this is only official data. How many people are infected, but not tested for the disease, is unknown. Thus, most likely, the real numbers are much worse. At the same time, it became known about a new amazing feature of the coronavirus. It turns out that a certain number of people infected with it may not have symptoms at all. In China, for example, 43,000 asymptomatic people were found. They were not included in those 80,000 that are officially reflected in documents on the epidemic. Also, representatives of the medical sector specify that the incubation period usually lasts about five days, but can reach both 14 and 27 days. Many medical scientists believe that it is very surprising that China managed to quickly localize the spread of the virus. Perhaps the point is precisely in these asymptomatic patients or those infected people who simply have not yet diagnosed their disease. However, scientists did not have time to suspect China of inaccurate data, as there were reports of new 78 infected with the COVID-2019 virus, in particular in Wuhan, where the spread of the virus began. Beijing and Hong Kong immediately announced a new quarantine. According to the latest data from the World Health Organization (WHO), about 85% of all infections in the last day are in the European Union and the United States. Thus, now in the world there are immediately two large foci of the spread of infection. Several countries in the EU as well as the US. Scientists believe that it is the United States that can become the new center of a pandemic, although Italy, Spain and other EU countries do not lag behind in the number of infected. From a technical point of view, the EUR/USD currency pair continues to adjust. The Ichimoku indicator is evidence of this. The Kijun-sen line will determine the trend for the euro/dollar over the next few days. In any case, we would like to note that volatility remains high, but still begins to decline and now does not exceed 200 points per day. Nonetheless, we believe that market panic and high volatility will continue for some time to come. Recommendations for short positions: An upward correction continues for the EUR/USD currency pair, which may be completed in the next few hours. Thus, we recommend selling the euro again with targets at 1.0504 and 1.0476 in case of price rebound from the Kijun-sen critical line. Recommendations for long positions: Euro-currency purchases with targets at the 1.0980 volatility level and Senkou Span B line can be considered no earlier than when the pair consolidates above the Kijun-sen line. However, in any case, it is recommended to be very careful with the opening of any positions. Panic in all markets persists. Explanation of the illustration: Ichimoku indicator: Tenkan-sen is the red line. Kijun-sen is the blue line. Senkou Span A - light brown dotted line. Senkou Span B - light purple dashed line. Chikou Span - green line. Bollinger Bands Indicator: 3 yellow lines. MACD indicator: Red line and bar graph with white bars in the indicators window. Support / Resistance Classic Levels: Red and gray dashed lines with price symbols. Pivot Level: Yellow solid line. Volatility Support / Resistance Levels: Gray dotted lines without price designations. Possible price movements: Red and green arrows. The material has been provided by InstaForex Company - www.instaforex.com |
| USDX forecast: Dollar testing 105 soon Posted: 24 Mar 2020 08:58 AM PDT The dollar index came under pressure after the measures announced by the Fed. This included a large-scale flow of liquidity to the markets. The greenback fell from record highs against a basket of major currencies, losing up to 1.5% and preparing to end the day with the strongest intraday fall in the past three weeks. The US currency managed to reduce the decline by Tuesday evening, and the assumption that the dollar's strength will remain with it, began to take real shape. The world needs defensive assets, and the US currency is doing an excellent job of this function, despite significant uncertainties in the American economy and the increase in the number of coronavirus diseases in this country. The United States came in third place in the number of cases. As of March 23, the number of infected people increased from 33.3 thousand to 43.8. At the moment, according to John Hopkins University, it has reached 46,450, of which 593 people have died. The epidemic continues to rage in Italy, where 63,927 people are sick, while the number of deaths per day increased by 602, to 6,077 people. Meanwhile, the number of people who have recovered is 7,432. The only positive thing in the country is that the number of fatalities has decreased for the second day in a row. Why will the dollar rise? Many currency strategists are confident that the US currency will still prove itself. They call the current pullback from the 103 mark a normal profit taking, but there is no question of an upward trend reversal here. Global financial markets are facing a serious problem – there are not enough dollars to make transactions. This explains why the trade-weighted dollar index gained more than 4% last week. The broad dollar index measures the value against a basket of currencies, i.e. the euro, pound, yen, C anadian dollar, Swiss franc, and Swedish Krona. The Federal Reserve, given the shortage of dollars, announced the creation of financing channels with nine other central banks, including the RBA and the Monetary Authority of Singapore. There was access to additional dollar funds with an obligation to maintain an agreement for at least six months. Nevertheless, it is unlikely that it will be possible to contain the fear of investors who are saving up dollars. They do not believe that these measures will be enough. Representatives of ANZ Bank, analyzing the situation, said the following: the dollar will grow to the 105 level against a basket of six competitors in the short term. It was last seen at this level in late 2002. "Swap lines will help to some extent. However, this is unlikely to be enough, given the volume of demand for dollars. From a technical point of view, the dollar looks overbought, so we can expect some consolidation. Nevertheless, this is probably just a pause before another increase," CIBC strategists write, acknowledging in part that the additional stimulus announced on Monday affected the dollar's rally. "We are likely to see the consolidation of the dollar for a while, but the key will be how other major central banks will react," the experts added. It is also worth noting that the actions of the Fed officials can be a good help for the unrelenting demand for the dollar. The purpose of these operations is to convince markets that any number of dollars will be readily available. This should help financial companies lend more confidently to each other. Before the markets see the bottom for risk reduction and a turn in the dollar exchange rate, it will be necessary to fix the peak of new indicators of coronavirus infection and the beginning of the decline. The material has been provided by InstaForex Company - www.instaforex.com |
| Posted: 24 Mar 2020 07:47 AM PDT Gold ignored the Federal Reserve's interest rate cut by 100 basis points, falling to the lowest levels since November last year. However, the precious metal sharply jumped against the background of the regulator's statements about unlimited purchases of Treasury and mortgage bonds. According to experts at Goldman Sachs, gold has reached an inflection point and will rise to $1,800 per ounce over the next 12 months. The bank believes that thanks to huge injections of liquidity, the Fed managed to prevent a crisis of solvency, and in the near future, investors will focus on the central bank's balance sheet, the increase of which will contribute to the weakening of the US dollar. This will allow gold to spread its wings. The main reason for the March sales of precious metals was the stress on the financing markets. The demand for the greenback, both inside the US and outside the country, to repay USD-denominated debts was off the scale. The Fed managed to dampen this demand only with the help of unlimited asset purchases and currency swaps with 14 central banks of the world. At the same time, the simultaneous decline in the value of gold and the S&P 500 index should not surprise anyone. This happens quite rarely and most often during periods of global financial crises. In particular, this was the case in 2008, when the precious metal first fell in price after the US stock indexes by 20%, to $700 per ounce, but then it rose to $1,900, reaching record values. The magnitude of the crisis provoked by the coronavirus is likely to be much more serious than in 2008, as, indeed, is the Fed's response. The regulator not only intends to buy an unlimited number of US treasury bonds, but also intends to become a lender of last resort. If the Fed really managed to prevent a solvency crisis and thereby eliminate the main bearish XAU/USD driver, then in the medium term uncertainty about the impact of the coronavirus epidemic on the global economy, low interest rates and the vulnerability of major world currencies weakened by aggressive monetary expansion by central banks issuers should help gold return above $1,700 per ounce. The material has been provided by InstaForex Company - www.instaforex.com |
| Posted: 24 Mar 2020 06:57 AM PDT Traders and analysts were prepared for this development, and, in fact, the disastrous data on the reduction of manufacturing activity in the eurozone, as well as the services sector, were completely ignored by the markets. The services sector, which was the first affected by the crisis, has suffered the most so far. The spread of the coronavirus throughout the eurozone primarily led to a reduction in the activity of catering, tourism, and air transport businesses, as well as directly affected a number of other services provided to the population. Also, a sharp drop in the indices signals a decrease in GDP compared to the previous quarter. There is also a risk of continuing further decline in activity due to the likelihood of taking more stringent measures aimed at controlling the spread of the coronavirus. The production activity also declined due to a sharp increase in delivery times and a drop in inventory, which disrupts supply chains. Problems persist for both external orders and internal market orders. There is also a probability of a sharp decline in the labor market indices. Now let's talk about numbers. According to the report, the preliminary purchasing managers' index (PMI) for the French manufacturing sector in March fell to 42.9 points against 49.7 points in February and the forecast for a decline to 40.4 points, which is not as bad as it seems. But the service sector was much less fortunate. Here, the preliminary index of France in March fell immediately to 29.0 points against 52.6 points in February, with a forecast of 42.5 points. France's composite purchasing managers' index (PMI) fell to 30.2 points in March. Now for Germany. Here, the preliminary purchasing managers' index for the manufacturing sector also fell less significantly than expected, and amounted to 45.7 points against 48 points in February. But the service sector collapsed. There, the index fell to 34.5 points against 52.5 points in February, with a forecast decline to 43.0 points. The preliminary composite index of managers was 37.2 points. As for the euro area as a whole, the indicators also declined significantly. The eurozone's preliminary manufacturing PMI for March fell to 44.8 points, while it was expected to fall to 40.0 points, which is quite good since the index was 49.2 points back in February. But the preliminary purchasing managers' index (PMI) for the eurozone services sector in March fell to a historic low of 28.4 points against 52.6 points in February, with a forecast decline to only 40.0 points. Given that the eurozone's services sector was doing quite well even last year amid the worsening trade relations between the US and the world, it is likely that after the coronavirus pandemic ends, it will recover quite quickly, which cannot be said for the manufacturing sector. The preliminary composite index of supply managers in the eurozone in March fell to 31.4 points against 51.6 points in March and forecast a decline to 40.0 points. As for the current technical picture of EURUSD, so far the bears are actively protecting the resistance of 1.0890, which may lead to a return of pressure on risky assets and a repeat test of the support of 1.0815, which was formed during the European session. A break in this area will cancel out the efforts of the bulls and return the trading instrument to a minimum of 1.0725. A break in the resistance of 1.0890 will open a direct path to the local highs of 1.0930 and 1.0980. GBPUSD The British pound also ignored a weak report on the sharp decline in the service sector, which brings more than 75% of the economy. According to the data, the UK's preliminary composite purchasing managers' index (PMI) fell to a historic low of 37.1 points in March from 53 points in February. The statistics Agency IHS Markit/CIPS noted that the PMI for the services sector fell to 35.7 points from 53.2 points in February. The manufacturing index fell only to 48 points from 51.7 points in February. A sharp decline in the index indicates a high probability of a quarterly decline in GDP to 2.0%. The lack of market reaction is due to the fact that the current indicators are only preliminary, but what the final data will be, not to mention the results for the 2nd quarter of this year, remains to be guessed. Most likely, when it is more or less clear how much the economy has declined due to the spread of the coronavirus, the data will be even darker. As for the technical picture of the GBPUSD pair, the small growth of the pound is still limited by the resistance of 1.1800, an unsuccessful breakout of which may return new sellers to the market, which will increase pressure on the trading instrument and lead to its return to the area of the year's lows. The material has been provided by InstaForex Company - www.instaforex.com |
| Short-term technical analysis of EURUSD Posted: 24 Mar 2020 06:47 AM PDT EURUSD has bounced off 1.0638 low to 1.0880 earlier today, but price is now back at 1.08. In our previous analysis we noted that major resistance is found at 1.08-1.0830. A daily close above this area would be a bullish sign, however we need to take into consideration the possibility that the bearish trend is not over yet.
Green line - support Yellow rectangle - resistance area EURUSD is making higher highs and higher lows since March 20th. In the 4 hour chart shown above we see this sequence and we also see that price has reached very close to our resistance trend line and the yellow resistance area. Holding above the short-term upward sloping green line is very important for the short-term trend. This bounce could continue to 1.11 if price holds above the green line. A rejection at the red resistance trend line and a break below the green line support at 1.0770 would be a bearish sign that would increase the chances of seeing a new lower low below 1.0638. Breaking above the red resistance trend line could push price towards the next short-term resistance at 1.0960. The material has been provided by InstaForex Company - www.instaforex.com |
| Gold challenges major Fibonacci resistance Posted: 24 Mar 2020 06:40 AM PDT Gold price has managed to break above $1,580 and bulls are now trying to recapture $1,600. We are now at a major Fibonacci retracement level and the chances of a reversal and rejection here are high. Bulls need to be very cautious.
Green rectangle - support area Gold price as expected has bounced off the green support area as we expected in previous posts. Gold has now reached the major 61.8% Fibonacci retracement level resistance. This is major short-term resistance level that traders should not ignore. A rejection here could bring Gold price sharply back towards $1,550 if not lower. Short-term support is at $1,560-50. If broken we should consider the scenario where this bounce was only a counter trend rally as the main scenario. Gold price could then move even below $1,450. However it is still too early to say anything as in the Daily chart the oscillators have just started turning upwards. A rejection would be a bad sign. That is why we keep a close eye on the Fibonacci level and the short-term $1,560 support. The material has been provided by InstaForex Company - www.instaforex.com |
| March 24, 2020 : GBP/USD Intraday technical analysis and trade recommendations. Posted: 24 Mar 2020 06:35 AM PDT
In the period between December 18th - 23rd, bearish breakout below the previous bullish channel followed by quick bearish decline below 1.3000 were demonstrated on the H4 chart. However, Immediate bullish recovery (around 1.2900) brought the pair back towards 1.3250 (backside of the broken channel) where the recently-terminated wide-ranged movement channel was established below 1.3200. Since January 13, progressive bearish pressure has been built above the price level of 1.2780-1.2800 until March, the 2nd when transient bearish breakout 1.2780 took place. Shortly after, significant bullish rejection was demonstrated around March 4. Hence, a quick bullish movement was expressed towards the price zone of 1.3165-1.3200 where significant bearish pressure brought the pair back below 1.2780, 1.2500 then 1.2260 via quick bearish engulfing H4 candlesticks. Recently, the GBPUSD has reached new LOW price levels around 1.1450, slightly below the historical low (1.1650) achieved in September 2016 (As depicted on the Weekly Chart). Currently, the GBP/USD pair looks very OVERSOLD. However, Technical outlook suggested further bearish decline as long as bearish persistence below 1.1650 was maintained on the H4 & Weekly Charts. By the end of Last week, Conservative traders were advised to look for signs of bullish rejection for a probable bullish reversal opportunity around the historical price levels of (1.1500-1.1450). Transient bullish advancement was achieved towards 1.1900. However, immediate bearish rebound was expressed to retest the recent low around 1.1450. H4 Candlestick closure below 1.1450 & Weekly Candlestick closure below 1.1650 enhances the bearish momentum on both the short and intermediate-terms respectively. Initial Bearish targets are estimated to be located around 1.1350 and 1.1180 provided that quick H4 bearish closure below 1.1450 is achieved. On the other hand, bullish breakout above 1.1900 (Latest Descending High) invalidates the bearish scenario temporarily & enables higher bullish targets around 1.2260, 1.2520, 1.2680 to be addressed if sufficient bullish momentum is maintained. The material has been provided by InstaForex Company - www.instaforex.com |
| Posted: 24 Mar 2020 06:20 AM PDT
On December 30, a bearish ABC reversal pattern was initiated around 1.1235 which turned the technical outlook into bearish. Since then, the EURUSD pair has trended-down within the depicted bearish channel until few weeks ago, when extensive bearish decline established a new low around 1.0790 where the EUR/USD pair looked OVERSOLD after such extensive bearish decline. On February 20, recent signs of bullish recovery were demonstrated around 1.0790 leading to the recent steep bullish movement towards 1.1000 then 1.1175. The price level of (1.1175) constituted a transient congestion-zone in confluence with the origin of the previously-mentioned ABC pattern. Temporary consolidation range was demonstrated down to 1.1100-1.1095 where another bullish limb was quickly expressed targetting 1.1235, 1.1360 and finally 1.1480. In other words, the price-Levels of 1.1235 (KeyZone) and 1.1360 were being breached to the upside until earlier last week when a (123) bearish reversal pattern was initiated around the price level of 1.1480. This turned the short-term technical outlook for the EURUSD pair into bearish when bearish persistence below the Keyzone of 1.1235 was maintained on a daily basis. For conservative traders, the previous bullish pullback towards 1.1235 was suggested to be considered for bearish rejection and a valid SELL entry. On the other hand, the mentioned intermediate-term bearish Head & Shoulders pattern has achieved all of its projection target levels. Currently, the EURUSD pair is re-testing the backside of the broken bearish channel where signs of bullish rejection should be anticipated. The recent bullish engulfing H4 candlesticks as well as the manifested double-bottom reversal pattern (in progress) indicate a high probability bullish pullback at least towards 1.0880, 1.0980 and 1.1060 that should be watched by conservative traders. That's why, Intraday traders should be looking for bullish persistence above 1.0790 - 1.0830 as this would probably enhance further bullish advancement initially towards 1.0980. On the other hand, H4 candlestick bearish closure below 1.0650 invalidates the previous scenario and enables further bearish decline towards 1.0606 and probably 1.0580. The material has been provided by InstaForex Company - www.instaforex.com |
| Posted: 24 Mar 2020 06:19 AM PDT Corona virus news:
Italian and Spanish PMIs will be published on 1-3 April but today's flash releases already confirm that the economic slump will be worse than in core countries, and much deeper than during the Global Financial Crisis. Technical analysis: BTC has been trading upwards. The price is again near the important resistance pivot levels at $7.000. I still expect potential downside movement towards the levels at $4.400 and $3.800. Watch for potential selling opportunities in case of the breakout of the bearish flag pattern on the daily time-frame. MACD oscillator is showing downside momentum and falling slow line, which is sign that sellers are in control on the mid-term prospective. Resistance levels are found at the price of $7.000 and $7.300. Support levels are set at the price of $4.412 and $3.800 The material has been provided by InstaForex Company - www.instaforex.com |
| Trading recommendations for EURUSD pair on March 24 Posted: 24 Mar 2020 06:18 AM PDT From a comprehensive analysis, we see a local upward movement relative to the specified framework. And now about the details. The market dynamics are still high, and the price concentration is maintained within the previously established limits. Special attention was paid to the following levels: 1.0650 - the base, where the minimum value is 1.0636; 1.0775 - the variable level, which plays a kind of mirror image; 1.0850 - the subsequent level, which played the role of a kind of resistance on periods earlier. In fact, we see a kind of correction from the lows, where there are outlines of ranges. Regarding the theory of downward development, it was revealed that the variable support point of 1.0650 can be broken with subsequent touches, and this is confirmed by the continuing trading volumes on the downside. At the same time, the panic-inducing external background raises the boiling point, which can eventually serve as a kind of catalyst that will lead to an update of historical lows in the event of an escalation of fear of the consequences of the COVID-19 virus. In terms of volatility, we are recording a similar indicator as last Friday, where the dynamics exceeded the daily average by almost twice. It is worth recalling that the characteristic acceleration has been going on in the market for more than a month, and there are no reasons for slowing down yet. Volatility details: Monday-155 points; Tuesday-183 points; Wednesday-115 points; Thursday-278 points; Friday-166 points; Monday-151 points; Tuesday-234 points; Wednesday-243 points; Thursday-326 points; Friday-194 points; Monday-191 points. The average daily indicator relative to the volatility dynamics is 98 points (see the volatility table at the end of the article). Analyzing the past day by the minute, we saw an attempt to resume the downward course, but the most notable moment was the upward surge at 14:00, which, in a matter of an hour threw the quote by more than 100 points. This behavior was of a local nature, where in the end the quote partially played back the existing surge. As discussed in the previous review, traders considered two options at once: the first one was counting on a further decline, but only if the quote managed to be fixed below the area of 1.0636/1.0650; the second option was considered in view of alternatives if the price was fixed higher than 1.0775 on H4, which eventually happened. Looking at the trading chart in general terms (daily period), we see the first signs of a possible correction relative to the downward inertia course. The news background of the last day did not contain important statistics on Europe and the United States, and all the market's attention was focused on the external background. In terms of the general information background, we see that the coronavirus continues to shock with statistics, where an increase of 41,758 cases of infection was recorded in the world over the past day. While in the United States, for two days, the increase in infected was 19,035, where against this background, US President Donald Trump insists on the adoption by lawmakers of a package of stimulating social and economic measures aimed at overcoming the consequences of the virus. "The package must be accepted because the virus has a negative impact on our country. We are going to take a number of incentives to ensure that workers live their lives. This is not their fault," Donald Trump said during a briefing at the White House. I will specify that the stimulus package is about $2 trillion, which, in trump's view, should support the economy and citizens of the country. In turn, the head of the Federal Reserve Bank of St. Louis, James Bullard, gave his forecasts, which say that the unemployment rate in the US in the second quarter may reach 30%, and GDP will collapse by 50%. The figures are extremely scary, but experts from Morgan Stanley agree with them, who predicts that the US economy will fall at an annual rate of 30% in the second quarter. Today's economic calendar has already published PMI data for Europe, where PMI fell so low that set an absolute record in the history of the EU. So, its indicators amounted to 28.4, which was never the case. The situation was saved by the index of business activity in the manufacturing sector, which also fell from 49.2 to 44.8, but this is still within common sense. In fact, only the euro production index managed to increase its price locally. In the second half of the day, similar PMI data will be released, but for the United States, where it is forecast that the index of business activity in the service sector will fall from 49.4 to 40.0, and the manufacturing index of business activity will decrease to 42.0. Further development Analyzing the current trading chart, we see just the same local upward movement that was discussed above, where the quote manages to be fixed above 1.0850. In fact, we are recording a kind of correction from the minimums, but the instability of the entire structure is obvious. Thus, although the price is fixed above the level of 1.0850, this does not guarantee that the upward movement will continue in the market. What I mean is that the downward development can resume at any moment, and you should be prepared for it. In terms of emotional mood, we see that the increasing noise from the external background does not give rest to speculators, who on a daily basis accelerate the market to unimaginable heights in terms of activity. This kind of behavior will continue to persist in the market until the external background reduces the negative pressure. Detailing the available period every minute, we see that since the beginning of the Pacific trading session, the quote has built an upward move, which led us to the area of 1.0888, but after that, there was a slowdown and the price returned below the level of 1.0850. In turn, traders worked on a local upward trend, having trading positions still from the value of 1.0775. Now, the deals switched to fixing as soon as the price reached the level of 1.0850. Subsequent actions are considered for sale, but in this case, the price must be kept below the level of 1.0850. We can assume that if the price is fixed lower than 1.0810, it will open another round of short positions, which will first return the quote to the area of the mirror level of 1.0775, and then go towards the lows of 1.0636/1.1650. Based on the above information, we will output trading recommendations: - Buy positions should be considered after fixing the price higher than 1.0890, with the prospect of a move to 1.0950 - We consider selling positions if the price is fixed below the area of 1.0810, with the prospect of a move to 1.0775-1.0650-1.0636. Indicator analysis Analyzing different sectors of timeframes (TF), we see that due to the existing upward movement, the indicators of technical instruments on the minute and hour periods were under pressure, having a variable buy signal. Daily periods continue to maintain a sell signal against the general background of decline. Volatility for the week / Measurement of volatility: Month; Quarter; Year. Volatility measurement reflects the average daily fluctuation from the calculation for the Month / Quarter / Year. (March 24 was based on the time of publication of the article) The volatility of the current time is 132 points, which is already 63% higher than the daily average. It is likely to assume that activity will continue to grow, where the dynamics may again reach 190 points. Key level Resistance zones: 1.0850**; 1.1000***; 1.1080**; 1.1180; 1.1300; 1.1440; 1.1550; 1.1650*; 1.1720**; 1.1850**; 1.2100. Support zones: 1.0775*; 1.0650 (1.0636); 1.0500***; 1.0350**; 1.0000***. * Periodic level ** Range level *** Psychological level The material has been provided by InstaForex Company - www.instaforex.com |
| EUR/USD analysis for 03.24.2020 - Potential for upside continuiation towards the level of 1.0887 Posted: 24 Mar 2020 05:57 AM PDT Corona virus news:
Data firm Markit reports that business activity across services and manufacturing has slumped this month, as the coronavirus deals the UK economy "a more severe blow than at any time since comparable figures were first available over 20 years ago". Output has slumped, new orders have contracted at their fastest pace since 2008, and business expectations have absolutely cratered. This has dragged Markit's survey of UK purchasing managers down to just 37.1 in March, down from 53.0 in February. That shows an extremely sharp fall in activity. It's the worst reading since the survey began in 1998, and means the economy is contracting much faster than after the collapse of Lehman Brothers in 2008. Technical analysis : EUR has been trading upwards. The price tested and rejected of the level 1.0887. Anyway, due to strong demand today and the breakout of the multi-pivot resistance at 1.0828, I do expect further upside and potential test of the 1.0887 and 1.0950. Watch for potential buying opportunities on the dips using the hourly time-frame. MACD oscillator is showing upside momentum and rising slow line, which is sign that buyers are in control. Resistance levels are found at the price of 1.0887 and 1.0950 Support levels are set at the price of 1.0820 and 1.0775. The material has been provided by InstaForex Company - www.instaforex.com |
| Posted: 24 Mar 2020 05:33 AM PDT Markets are growing on Tuesday - US indices +4% on futures before the opening, Chinese indices rose. Gold is growing. A novice trader/investor may get the false impression that the main market decline is complete and it is possible to buy, especially given the low stock prices. This is fundamentally wrong. Why: a) The situation in Italy with the epidemic is not yet clear. The number of deaths seems to be decreasing, but the growth of newly infected is not lower than +10% per day. b) everything is just unfolding in the US. The development of the plot is still unclear in Germany, Spain, and France. c) a big crisis in the economy of Europe and the United States, is probably inevitable. The IMF stated that the crisis was inevitable. However, the crisis has not yet begun. EUR USD: Cancellation of sale from 1.0940. We will sell on the breakout from 1.0635. The material has been provided by InstaForex Company - www.instaforex.com |
| Posted: 24 Mar 2020 05:26 AM PDT Corona virus news:
The scale of the global economic damage from the corona virus outbreak is becoming clearer after early warning signs showed the steepest plunge in business activity ever recorded in Britain, Japan and the euro zone. As more countries shut down large parts of their economies to contain the spread of the virus, the purchasing managers indices (PMI) for several of the world's biggest economies fell to the lowest levels since records began more than two decades ago. Technical analysis: Gold has been trading upwards as I expected. The price reached my yesterday's target and Pitchfok Median line at the $1.610. Since the price reached Median line, I do expect several pivots to form around the median line. Watch for potential downside rotation towards the support levels at $1.584 and $1.560. Stochastic oscillator is showing bearish divergence and potential for rotation to the downside. Major resistance level is set at the price of $1.610 Support levels and downward targets are set at the price of 1$1.584 and $1.560. The material has been provided by InstaForex Company - www.instaforex.com |
| Posted: 24 Mar 2020 05:18 AM PDT To open long positions on GBPUSD, you need: The growth of the pound in the first half of the day after fixing above the resistance of 1.1653, which can be seen on the 5-minute chart, and which I paid attention to in my morning forecast, led the pair to a maximum of 1.1798, where the bears again declared themselves. However, it is not necessary to talk about a further decline in the pound, since even the terrible data on the state of the service sector was ignored by the bears. If there is no activity on the part of sellers at the beginning of the North American session, a return to the level of 1.1798 may lead to a test and a breakdown of this range, which will open a direct path for the bulls to the highs of 1.1926 and 1.2023, where I recommend fixing the profits. In the scenario of a return of pressure on the pound, it is best to return to long positions on a false breakout from the middle of the side channel of 1.1653 or buy immediately on a rebound from the year's low of 1.1470.
To open short positions on GBPUSD, you need: Bears need to focus on protecting the resistance of 1.1798, and the next formation of a false breakout from this range, similar to March 20, will increase pressure on the pair and lead to a decrease in the support area of 1.1653. However, it will be possible to speak more boldly about the resumption of the bearish trend only after the breakout of this range, which will lead to the demolition of a number of buyers' stop orders and a faster decline in GBP/USD to the area of the year's minimum of 1.1470, where I recommend fixing the profits. In the scenario of growth of the pair above the resistance of 1.1798, which will coincide with the breakdown of the top border of the current descending channel for short positions, it is best to go back to test a high of 1.1926 or sell immediately for a rebound from a larger resistance of 1.2023. Signals of indicators: Moving averages Trading is conducted above the 30 and 50 daily averages, and while the market is on the side of buyers of the pound. Bollinger Bands The bears need to break below the average border of the indicator in the area of 1.1610, which will lead to a larger fall of the pair.
Description of indicators
|
| Posted: 24 Mar 2020 05:05 AM PDT To open long positions on EURUSD, you need: In the morning forecast, I drew attention to the likelihood of continued growth of the euro and sales from the resistance of 1.0884, which the bears took advantage of, which is clearly visible on the 5-minute chart. However, even weak reports on a sharp decline in production activity, and especially in the eurozone services sector, did not discourage traders from building long positions, which remains a fairly high probability of continued growth of the euro in the short term. In the second half of the day, the bulls will focus on the resistance of 1.0884, whose breakout will lead to a new upward trend that can reach the highs of 1.0930 and 1.0975, where I recommend fixing the profits. In the scenario of a decline in the euro, it is best to return to long positions only on a false breakout from the minimum of 1.0817 or buy immediately on a rebound from the support of 1.0727, the test of which will be a turning point for the current correction of the pair.
To open short positions on EURUSD, you need: Bears will actively defend the resistance of 1.0884, from which sales were clearly visible on the 5-minute chart in the first half of the day. However, ignoring weak fundamental statistics on the euro area gives little confidence that the pressure on the euro will continue. Therefore, if the pair returns to the level of 1.0884, I recommend that you stop selling until the test of the larger highs of 1.0930 and 1.0975. An equally important task for the bears in the second half of the day will be to return the pair to the support level of 1.0817, fixing below which will lead to the demolition of a number of stop orders and a larger movement of the euro down to the lows of 1.0727 and 1.0636, where I recommend fixing the profits. Signals of indicators: Moving averages Trading is conducted above 30 and 50 moving averages, which also keeps the probability of continuing the upward correction of the pair in the short term. Bollinger Bands In the scenario of a decline in the euro in the second half of the day, you can look at purchases on a false breakout from the average border of the indicator 1.0780, or on a rebound from the lower border in the area of 1.0710.
Description of indicators
|
| Technical analysis of AUD/USD for March 24, 2020 Posted: 24 Mar 2020 04:06 AM PDT Overview: A general rebound in risk sentiment surrounding the coronavirus-scare added to demand for the Aussie. So, the AUD/USD pair rebounded from the bottom level of 0.5510 to set around the area of 0.5817 - 0.6137. For the time being, the economic calendar provides some data, albeit partial which show the weakness. The Coronavirus (COVID-19) surely will imapct on the AUD/USD pair sooner, because the new Coronavirus (COVID-19), which is rapidly spreading around the world. Hence, we noted that uncertainty and fear about the coronavirus pandemic has driven the Australian dollar over 18-year lows below 59 cents. Currently price set at the price of 0.5912. Technically: The AUD/USD pair dropped sharply from the level of 0.6137 towards 0.5510. Now, the price is set at 0.5912 to act as a daily pivot point. It should be noted that volatility is very high for that the AUD/USD pair is still moving between 0.6007 and 0.5700 in coming hours. Furthermore, the price has been set below the strong resistance at the levels of 0.6007 and 0.6137, which coincides with the 61.8% and 78% Fibonacci retracement level respectively. Additionally, the price is in a bearish channel now. Amid the previous events, the pair is still in a downtrend. From this point, the AUD/USD pair is continuing in a bearish trend from the new resistance of 0.5912. Thereupon, the price spot of 0.5912 remains a significant resistance zone. Therefore, a possibility that the AUD/USD pair will have downside momentum is rather convincing and the structure of a fall does not look corrective. In order to indicate a bearish opportunity below 0.5912, sell below 1.59125 with the first targets at 0.5817 and 0.5700 (the double bottom is seen at 0.5510). The material has been provided by InstaForex Company - www.instaforex.com |
| Posted: 24 Mar 2020 04:05 AM PDT When there is a common goal, yesterday's enemy today can become your ally. For a long time, OPEC was at war with the United States for sales markets, tried to cut off the oxygen to American oil producers by lowering prices, and with the help of agreements on production cuts – to stabilize the black gold market, and connected Russia... Unfortunately, the United States did not care, but when the oil war between Riyadh and Moscow began, the White House itself offered its services. Either the United States is not as good as they try to imagine, or with the help of an alliance with one opponent, Washington is trying to remove the second from its path. Despite a 29% drop in WTI for the week to March 20, which is the worst result since 1991, US companies were able to increase production to 13.1 million b/d. This is a repeat of the record high that took place in February. Such dynamics of the indicator suggests that producers from the States actively using price risk hedging operations are not particularly upset about the collapse of oil futures. Yes, its value has declined more than twice from the levels of January highs, but the losses are compensated by the income received in the derivatives market. Dynamics of American oil production
According to Parsley Energy estimates, if WTI quotes continue to stay in the area below $25 per barrel, then in the next few weeks, black gold production in the States will decrease by 250-500 thousand b/d. The US Department of Energy asked Congress for money to buy 30 million of the planned 77 million barrels of oil to replenish strategic reserves, and then spread rumors about an alliance between Riyadh and Washington, whose goal is to stabilize the black gold market. Most recently, Donald Trump demanded that Saudi Arabia and OPEC reduce prices, which usually leads to a drop in the cost of gasoline and to reduce spending by American households, and now offers his services to resolve the conflict to Moscow, then Riyadh. The Kremlin claims that the time has not yet come, and Saudi Arabia is cutting its budget spending by 5% at once. Meanwhile, Brent and WTI are soaring on the back of a significant monetary stimulus from the Fed and the statement of US Treasury Secretary Steve Mnuchin that the moment of agreement with the Senate on almost $2 trillion in financial assistance to the economy languishing under the influence of coronavirus is already close. At the same time, the People's Bank of China claims that victory over the epidemic will soon be achieved, and the economy of the Middle Kingdom is ready to embark on a V-shaped recovery. If so, combined with cheap liquidity from the Federal Reserve and a potential agreement between Washington and Riyadh, this could change the rules of the game in the oil market. Technically, the "bears" for Brent do not give up trying to reduce quotes to the target of 113% for the "Butterfly" pattern (it is located near $20 per barrel), but a successful assault on the resistance at $31 and $36.6 can inspire their opponents to new attacks, the goal of which is a full-scale correction in the direction of 23.6%, 38.2% and 50% of the last downward wave. Brent, the daily chart
|
| Posted: 24 Mar 2020 03:49 AM PDT EUR/USD
On March 23, the EUR/USD pair gained about 35 more base points, although it reached 1.0830 again during the day. Since the previous local minimum was not updated, I still consider the assumed wave B completed. If this is true, then the tool has moved to build a new upward wave, presumably C, with the potential to increase to the 15th figure. Now such a potential looks rather doubtful, but I would like to remind you that in a state of panic, the market can move in any direction and with terrible force. Fundamental component: The news background for the EUR/USD instrument on March 23 was quite strong. Recently, most of the news comes from America, where the Fed and the government are fighting a desperate battle to save the stock market, as well as the entire economy. First, the Fed announced the launch of a quantitative stimulus program, then its expansion and reduction of rates to almost zero, and now it is announcing unlimited purchases of Treasury bonds and various securities. All this is done to fill the economy with liquidity. However, if in recent weeks the US currency has been rising because the markets considered the dollar to be the most attractive in these harsh times, now many investors are thinking. We thought about the current state of the American economy and what the future holds for it if the Fed has to take such measures to stimulate this very economy. Thus, I believe that the demand for the dollar will now decline. The panic can't go on forever. Markets must adapt to the new realities of life until the coronavirus can be defeated. By the way, it should also be recalled that the US government, in turn, wants to provide assistance for several trillion dollars to small businesses, ordinary workers and American citizens. These measures will also help the economy. So far, the US Senate has not approved this amount of aid, but it is unlikely that it will refuse to accept it for a long time. General conclusions and recommendations: The euro/dollar pair have presumably completed the construction of a downward wave B. The entire section of the trend, which originates on February 20, takes a horizontal form, and waves A-B-C can be approximately equal in size. For now, the main scenario is to build an ascending wave C. You can buy the instrument carefully with stop-loss orders under the low of wave B. GBP/USD
The GBP/USD pair lost about 100 basis points on March 23. However, the intended wave E can be completed. If this is true, then the increase in the quotes of the instrument will continue with the goals located between 25th and 27th figures. The dollar, therefore, can start to fall synchronously in both instruments - EUR/USD and GBP/USD. And from my point of view, it would be logical if, after the simultaneous decline of the euro and the pound, both currencies will now grow. Fundamental component: The news economic background for the GBP/USD instrument on Monday was the same as for the euro. The UK and US governments continue to take all necessary measures to stop the spread of the COVID-2019 epidemic, as well as to mitigate its impact on the economy. Unfortunately, it is still not possible to stop the epidemic. The number of cases of the virus in the US is already 46,000 and in Britain - almost 7,000. Today, the UK, the European Union and Germany have already released indices of business activity in the services and manufacturing sectors. Strangely enough, business activity in the manufacturing sectors of these countries was significantly higher than the forecasts and expectations of the markets. In the UK, it was 48, in Germany - 45.7, and in the eurozone - 44.8. However, composite business activity indices and service sector indices collapsed miserably, turning out to be much worse than market expectations. For example, in the EU, business activity in the service sector fell from 52.6 to 28.4. The euro and pound are rising in the morning on Tuesday, and this is good. General conclusions and recommendations: The pound/dollar instrument also presumably completed the construction of the descending set of waves and the last wave E. Thus, now you can carefully buy the pound in the expectation of building a new ascending set of waves with targets located near the 25th figure and with stop-loss orders under the low of the wave E. The material has been provided by InstaForex Company - www.instaforex.com |
| EUR/USD: it seems the dollar only dozed off on the throne, but is not going to leave it Posted: 24 Mar 2020 03:45 AM PDT The decision of the Federal Reserve to introduce unprecedented incentives weakened the position of the US currency and made it possible for the EUR/USD pair to move away from the lowest values since 2017 near 1.0670. The markets felt some relief, which contrasted sharply with the panic of last week, when investors sold everything except the US dollar. "Markets are preparing for a powerful influx of liquidity from the US central bank. The liquidity that the regulator provides, starting with swap lines and ending with other internal measures, makes it clear to the markets that he acts as an international lender of last resort during the crisis," said Nathan Sheets, a former FOMC economist. The Fed has promised to intervene in the corporate bond market and expand the provision of liquidity in the money market. The central bank also noted that the quantitative easing program is not limited by anything. Recent statements by the Fed have helped calm markets, but the worst is still to come. "The Fed's actions will help the market, but if the damage from the economic downturn is stronger than expected, these measures will not be enough. How effective they will ultimately depend on how long the spread of coronavirus infection lasts," said Toru Sasaki, head of research at JPMorgan Chase, Japan. In recent Fed comments, the euro has sharply risen against the US dollar, climbing above the $1.0870 mark. To date, more coronavirus deaths have been reported in Italy than in China, and this figure is growing at a double-digit rate. France and Germany found themselves in the same boat as Spain, having adopted fears of a chain reaction. Even if the governments of European countries do their best, as former ECB head M. Draghi said, the turning point in the economy will come only when Italy and the rest of the countries can confidently overcome the coronavirus and, more importantly for the markets, remove restrictions. At the same time, the discovery of an effective vaccine will be even more welcoming news, but this may take more than one month. Therefore, the EUR/USD pair should trade below 1.05, and it is only a matter of time. Nomura strategist Jordan Rochester believes that the US currency has reasons to strengthen, despite the unlimited infusion of dollars into the global financial system. "Quantitative easing by the Fed without limiting the volume will lead to some relief from the tense situation with dollar liquidity, but it will not fundamentally change the fact that many countries will have to significantly increase their budget deficits, and dollars will not be enough," he said. According to Hong Guo, head of market analysis at ANZ Bank, the fall in the USD index from 103 is just profit-taking, not a reversal of its upward trend. "The Fed has announced indefinite additional stimulus, and some steam has come out of the dollar rally," he said. "We will probably see the dollar consolidate for a while, but the key will be how other major central banks react to the Fed's actions. If the ECB and the Bank of Japan also start announcing their own additional measures, this will push the USD index to 105 in the short term," the expert believes. Thus, it seems that the greenback only dozed off on the throne, but is not going to leave it. The US currency simply takes a breath after an aggressive rally provoked by high demand for dollar liquidity. The material has been provided by InstaForex Company - www.instaforex.com |
| Trading recommendations for GBP/USD pair on March 24 Posted: 24 Mar 2020 02:20 AM PDT From the point of view of complex analysis, we see another touch of the lower boundary of the variable flat 1.1450, followed by a rebound, and now let's talk about the details. High activity continues to please the speculators, where the quote is in the conditional side range, but the volatility is above average. On the other hand, the slowdown at historical lows has characteristic boundaries: 1.1450 (1.1411) - the basis; 1.1660 - the average level, which reflects the development in the lower part of the range; 1.1850 is the upper deviation, which reflects the maximum value during the deceleration from historical lows. In fact, we are faced with the fact that the base, which has already been tested thrice for strength, puts pressure on the quote, forming a consistent rebound. From another point of view, the desire of sellers to remain in the market is still high. Regarding the theory of downward development, we see that the area of 1.1411 / 1.1450 became the stumbling block in the existing slowdown, where orders are concentrated, but successive touches still leave a chance for the base to be broken. Thus, although we are at the level of thirty years ago, a further decrease has the basis for reflection due to the growing external background and possible consequences of the virus [COVID-19], which should not be excluded from the analysis. Concerning the theory of upward development, discussions begin to appear, which is logical with such a significant decline, but at least some arguments for this assumption will appear only after fixing the price higher than 1.2000 and weakening the external background. In terms of volatility, we see activity that exceeded the daily average by 73%. The dynamics of the past three days has decreased, but is still at very high values. Details of volatility: Monday - 165 points; Tuesday - 245 points; Wednesday - 172 points; Thursday - 358 points; Friday - 359 points; Monday - 144 points; Tuesday - 271 points; Wednesday - 676 points; Thursday - 354 points; Friday - 522 points; Monday - 267 points. The average daily indicator, relative to the dynamics of volatility is 154 points [see table of volatility at the end of the article]. By detailing the minute by minute, we see a clock fluctuation inside the 1.1450 / 1.1660 frames, where the descending branches were recorded at the start of the European session, as well as at the start of the American session. As discussed in a previous review, traders looked at local selling positions in the direction of 1.1450 (1.1411), which brought profit. Considering the trading chart in general terms [the daily period], we see a global downward trend, where a relatively stagnant inertial course has formed stagnation, which does not yet have a correction status. The news background of the past day did not have the attention of statistical data for Great Britain and the United States, thereby paying special attention to the analysis of the external background. In terms of informational background, we see that a wave of coronavirus led to the closure of the United Kingdom to hard quarantine. Thus, the naughty citizens of Britain, who refused to adhere to isolation, provoked the government to take tough control measures, where in one day [Monday] the parliament approved a bill to expand the powers of the authorities during a pandemic. So, the approved bill gives the police and immigration officers, as well as medical workers, the right to detain people who might be infected with the COVID-19 virus, restrict their freedom and fine in case they refuse to take tests for infection. The document also mentions the right to close schools, kindergartens, offices, pubs, shops and the prevention of mass gatherings. In accordance with the epidemiological situation at 05.00 (Universal time) on 03/24/2020, 380, 457 cases of infection with the COVID-19 virus were recorded in the world, where, in particular, the United Kingdom has 6726 cases of infection, with an increase of 985 per day and casualties of 335, 54 per day. Today, in terms of the economic calendar, we have preliminary PMI data, where we have a collapse regardless of the country. So, in Britain, the index of business activity in the services sector falls from 53.2 to 44.0, and the production index of business activity may fall from 51.7 to 45.0. In the afternoon, similar data will be released for the United States, where they predict that the index of business activity in the services sector will drop from 49.4 to 40.0, and the production index of business activity will drop to 42.0. As you know, the data are terrible for both countries, which can lead to local fluctuations within the available ranges. Further development Analyzing the current trading chart, we see a fluctuation within the level of 1.1660, where a temporary slowdown is formed. In fact, we have a peculiar pattern, as in the previous period, which gives a signal of a possible downward move, where in case of confirmation of not the best PMI data from Britain, we can get support for short positions. However, it's too early to speak about the main movements, since the price continues to move within 1.1450 // 1.1660 // 1.1850, thus the work is temporarily carried out within the ranges. From the point of view of the emotional mood of market participants, we see that the external background on a daily basis provides the basis for new leaps, which leads speculators to action. High activity will continue to persist in the markets for a sufficient amount of time. By detailing the available time interval per minute, we see that the slowdown within 1.1600 / 1.1695 has remained in the market since the Asian trading session. In turn, traders consider having a slowdown as a possible point for starting jumps, where work can be done to break the boundaries of 1.1600 / 1.1695. Given the general picture of actions, it can be assumed that, if the pattern coincides from the border of 1.1660, paired with the information and news background, a reverse surge of activity may occur, returning us to the lower border of 1.1450. At the same time, speculators can locally drop the quote up, in the case of the slightest excess of trading forces inside the stagnant 1.1600 / 1.1695. Based on the above information, we derive trading recommendations: - We consider buying positions in case of price fixing higher than 1.1720 with the prospect of a move to 1.1790. - We consider selling positions in case of price fixing lower than 1.1590 with the prospect of a move to 1.1500-1.1450. Indicator analysis Analyzing a different sector of timeframes (TF), we see that the hourly and daily periods are prone to a downward movement, while the minute ones signal purchases. It is worth considering that due to the price movement within a wide range, the indicators of technical instruments in the short and intraday period adhere to local changes, although the signal is unstable. Meanwhile, daily periods invariably reflect the general interest of the market. Volatility per week / Measurement of volatility: Month; Quarter; Year Measurement of volatility reflects the average daily fluctuation, calculated for Month / Quarter / Year. (March 24 was built taking into account the time of publication of the article) The volatility of the current time is 190 points, which already exceeds the average daily indicator by 23%. It can be assumed that the external background, paired with upcoming statistics, will give the market new rounds of activity, while continuing to accelerate volatility. Key levels Resistance Zones: 1.1660; 1.1850; 1.2000 *** (1.1957); 1.2150 **; 1.2350 **; 1.2500; 1.2620; 1.2725 *; 1.2770 **; 1.2885 *; 1.3000; 1.3170 **; 1.3300 **; 1.3600; 1.3850; 1.4000 ***; 1.4350 **. Support Zones: 1.1450 (1.1411); 1.1300; 1,1000; 1,0800; 1,0500; 1,0000. * Periodic level ** Range Level *** Psychological level **** The article is built on the principle of conducting a transaction, with daily adjustment The material has been provided by InstaForex Company - www.instaforex.com |
| EUR/USD. March 24. COT report: speculators do not believe in further fall of the euro Posted: 24 Mar 2020 02:06 AM PDT EUR/USD – 1H.
Hello, traders! On March 23, the European currency, following the pound, which, by the way, did not last long in its "bullish" mood, began to show signs of life. Quotes of the euro/dollar pair performed a reversal in favor of the first and began a weak growth process on the hourly chart. Weak – based on the picture, in fact, almost 200 points were passed during the day, and this night and in the morning – another 140. However, this is not the main thing now. It is clear that traders remain almost in a state of shock. Thus, the amplitude of movements is high. The main thing is that the euro is recovering after a long and very strong fall. Closing the pair's exchange rate under a new and weak upward trend line will work in favor of the US currency and the resumption of falling quotes. EUR/USD – 4H.
According to the 4-hour chart, the EUR/USD pair also performed a reversal in favor of the euro currency and closed above the corrective level of 100.0% (1.0778). Thus, on March 24, the growth of quotes can be continued in the direction of the next Fibo level of 76.4% (1.0948). However, a bearish divergence is brewing in the CCI indicator, which allows traders to expect a reversal in favor of the US currency and a resumption of the fall in the direction of the corrective level of 127.2% (1.0582). Bull traders have not yet recovered from the shock of recent weeks, but if bear traders loosen their grip or simply get fed up, the euro will have a high chance of growth. EUR/USD – Daily.
As seen on the daily chart, the picture for the EUR/USD pair is identical to the 4-hour chart. There are no clear and accurate signals to buy now. There is only an indirect signal, and even then not the strongest, in the form of a possible consolidation above the corrective level of 100.0%. However, from this level, the pair performed a pullback yesterday and the day before. There are no new graphical constructions or patterns at the moment. By and large, you need to wait for the correction and its completion, so that the current picture of the currency pair allows you to build a new Fibonacci grid or, perhaps, a trend line or corridors. The coronavirus pandemic is not abating around the world, and in general, little has changed in recent days. Nevertheless, the US dollar has stopped growing, and traders remain in a state of shock, judging by the high amplitude. EUR/USD – Weekly.
On the weekly chart, the pair's quotes closed under the lower line of the narrowing triangle. Thus, the probability of resuming the fall increases sharply, although the consolidation does not look clear and strong. However, I believe that this point is extremely important for the pair. Either the pair will soon return to the triangle area, or, most likely, the euro will continue to fall. The breakdown may be false. Overview of fundamentals: On March 23, the European Union and the United States did not release any economic reports. However, as usual, there was a lot of news. This time, they all concerned the decisions of the US Treasury Department and the Federal Reserve to provide virtually unlimited funding and incentives to all sectors of the economy that were affected by the epidemic. The Fed and the US government are ready to pour an unlimited amount of dollars into the economy, just to stop its fall. News calendar for the United States and the European Union: Germany - index of business activity in the service sector (10:30 GMT). Germany - index of business activity in the manufacturing sector (10:30 GMT). EU - index of business activity in the service sector (11:00 GMT). EU - index of business activity in the manufacturing sector (11:00 GMT). US - index of business activity in the service sector (15:45 GMT). US - index of business activity in the manufacturing sector (15:45 GMT). On March 24, the European Union, Germany, and America will release quite important reports on business activity in the services and manufacturing sectors. However, the number one topic in the world remains the coronavirus epidemic. Traders continue to remain in a state of shock and it is far from certain that they will pay at least some attention to these reports. COT report (Commitments of Traders):
Until March 17, 2020, both groups of major market players were reducing the number of contracts. The total number of long contracts decreased by 60,000, and short – by 66,000. Commercial group continues to move the market, as it is the hedgers who have the largest number of contracts in their assets. Speculators also got rid of short contracts, not believing in a further fall in the euro currency. Thus, a group of traders who are professionally engaged in studying rates and forecasting them, do not believe that the euro will continue to fall. And the overall advantage of the bears is not so great now. I believe that the probability of ending the downward trend is high, but the market is in a state of shock, so at any moment the mood of major players can change dramatically. Forecast for EUR/USD and recommendations for traders: The situation for the EUR/USD pair is a bit confusing. The COT report suggests that bear traders remain strong, but a change in the picture is also possible. Thus, I recommend buying a pair with the target of 1.0948 and the stop loss level under the trend line on the hourly chart, and selling – if it is fixed under the trend line on the hourly chart with the goal of 1.0582. Terms: "Non-commercial" - major market players: banks, hedge funds, investment funds, private, large investors. "Commercial" - commercial enterprises, firms, banks, corporations, companies that buy currency to ensure current activities or export-import operations. "Non-reportable positions" - small traders who do not have a significant impact on the price. The material has been provided by InstaForex Company - www.instaforex.com |
| Posted: 24 Mar 2020 02:01 AM PDT GBP/USD – 1H.
Hello, traders! According to the hourly chart, the strong drop in quotes has stopped, but the growth of the pair's quotes does not begin. Yesterday, I built a weak upward trend line, hoping that it would be the starting point for a new upward trend. However, yesterday, the pound/dollar pair performed a consolidation under it, which showed a lack of desire for serious growth. Today, a sideways trend corridor was built, which seems to better reflect the current mood of most traders. It is neither bearish nor bullish. Traders are wondering where to go next? The actions of the Fed and the US Treasury Department do not seem to allow us to buy the US dollar as zealously as before. Measures to ease monetary policy and stimulate the economy are unprecedented. At the same time, traders firmly believe that it is the dollar that will allow them to survive the crisis that the whole world is in. GBP/USD – 4H.
As seen on the 4-hour chart, I removed the grid of Fibo levels, since it is identical to the grid on the hourly chart. There are no new trading ideas on this chart, as there are no special changes in the pair's movement. The British dollar's quotes seem to have performed an upward turn, which allows traders to expect some growth. No indicator shows any new emerging divergences on March 24. GBP/USD – Daily.
As seen on the daily chart, the picture remains the most interesting. The GBP/USD pair performed a fall to the corrective level of 127.2% (1.1538), but it was not possible to perform a clear closing under it. Thus, it is possible to interpret this attempt to overcome it as a retreat. The British currency has a certain chance of growth, but the lower charts show that there is no special desire among bull traders to move the British currency up. Thus, as long as the pair's quotes are trading above the corrective level of 127.2% (1.1538), the probability of growth remains. Fixing the pair's exchange rate under the Fibo level of 127.2% will work in favor of the US dollar and resume the fall in the direction of the corrective level of 161.8% (1.0998). GBP/USD – Weekly.
On the weekly chart, the pound/dollar pair performed a fall to the lower line of the "narrowing triangle", but the breakdown may be false. So far, it is difficult to say what exactly happened near the lower line of the triangle. A false breakout will give a high probability of growth to the first downward trend line. Overview of fundamentals: On Monday, no important economic reports were published in the UK and the US. Both America and Britain remain in strict quarantine, and now we can only wait for the growth rate of COVID-2019 virus infections among the population to go down. The economic calendar for the US and the UK: United Kingdom - index of business activity in the service sector (11:30 GMT). United Kingdom - index of business activity in the manufacturing sector (11:30 GMT). USA - index of business activity in the service sector (15:45 GMT). US - index of business activity in the manufacturing sector (15:45 GMT). Today, the US and UK business activity indices for March will show, how bad things are in these countries and what the consequences of the epidemic may be, whether traders are ready to start paying attention to economic reports again, or whether they will still be in a state of shock and track only news and data on COVID-2019. COT report (Commitments of Traders):
The new COT report, released on Friday, again showed no major changes in the number of contracts between groups of speculators and hedger companies. The total number of long and short contracts has decreased slightly but remains almost equal. The "Commercial" group immediately dropped 30,000 short contracts and 12,000 long contracts at once. A group of speculators has increased 9,000 short-contracts. Thus, speculators believe that the pound can resume the process of falling, but they have half as many contracts in their hands as in the hands of large companies that hedge their risks in the foreign exchange market. Forecast for GBP/USD and recommendations to traders: Major players do not like the GBP/USD pair too much, preferring the EUR/USD pair. Nevertheless, the COT report allows for the end of the "bearish" trend. We should start now from the corrective level of 127.2% on the daily chart. Closing the pair's rate under the side corridor on the hourly chart or under the level of 127.2% on the daily chart will work in favor of the US currency and allow traders to sell the British again. Terms: "Non-commercial" - major market players: banks, hedge funds, investment funds, private, large investors. "Commercial" - commercial enterprises, firms, banks, corporations, companies that buy currency to ensure current activities or export-import operations. "Non-reportable positions" - small traders who do not have a significant impact on the price. The material has been provided by InstaForex Company - www.instaforex.com |
| Analysis and forecast for EUR/USD on March 24, 2020 Posted: 24 Mar 2020 01:58 AM PDT Hello, dear colleagues! The topic of coronavirus continues to dominate and influence the global financial markets, so I will start today's review of EUR/USD with COVID-19. In Italy, 601 people died from a new type of coronavirus over the past day. This is less than in previous days, but it is still a terrifying figure. The number of infected people is approaching 4,800. The situation in Spain and France is not much better. The COVID-19 epidemic has already claimed the lives of more than 2,000 Spaniards. In France, a total of 860 people died from the coronavirus. In general, Europe has taken perhaps the most severe blow from the epidemic, and the description of the number of infected and dead resembles military reports. Of course, this is a global tragedy. At the same time, it is predicted that the peak of the epidemic has not yet passed. It is expected to occur around the middle of April. I wish it was over sooner. If you go to the analysis of the euro/dollar currency pair, you should first recall today's statistics. Reports on business activity in the service sector and in the manufacturing sector will be received from Europe and the United States. You can find information about the release time and forecasts for this and other data in the economic calendar. Now about the technical picture that develops for the main currency pair of the Forex market. Daily
Yesterday's trading did not differ in a clear direction. Nevertheless, the support at 1.0636 once again showed its strength and did not let the quote go lower. Yesterday's EUR/USD strengthening started from this mark. Despite the fact that the candle for March 23 formed a small bullish body, and the previous maximum values were not updated, today at the time of writing, the euro/dollar shows strong growth. However, there is still enough time before the end of today's trading and anything can happen. Now the pair is trading above the broken support of 1.0777, and the closing price of daily trading relative to this level, as well as the significant mark of 1.0800, will be very important. Apparently, the pair is positive and will try to continue strengthening. In this case, the next target will be the area of 1.0960-1.0980, where the lower border of the Ichimoku indicator cloud passes, and the highs of March 19 are also marked. Of course, this is far from the current prices, but this is the target area on the daily chart. In addition, there is a 38.2 Fibo level from the fall of 1.1494-1.0636, as well as the Tenkan line of the Ichimoku indicator. In my opinion, the selected price area is very good for opening short positions. The question is whether the pair will be able to rise to the designated values. H4
On the 4-hour chart, the price zone of 1.0960-1.0980 indicated above also looks technically reasonable for opening short positions. As you can see, there are 50 simple and 89 exponential moving averages. Above, at 1.1015, there is a 200 exponential, for which a protective stop-loss order should be issued when opening sales. H1
If you go to the hourly timeframe, then the nearest sales look from 1.0916, where the 200 EMA passes. In general, I would like to remind you that 1.0900 is a fairly strong technical level, which has had a direct impact on the price dynamics of the euro/dollar more than once or twice. I believe that the main trading idea for EUR/USD is clear - it is sales after corrective pullbacks to the prices highlighted in this review. Regarding purchases, I believe that time has already been lost. Since the growth at this stage is of a corrective nature, it is better to skip purchases and open positions on the downward trend. Success and profits! The material has been provided by InstaForex Company - www.instaforex.com |
| You are subscribed to email updates from Forex analysis review. To stop receiving these emails, you may unsubscribe now. | Email delivery powered by Google |
| Google, 1600 Amphitheatre Parkway, Mountain View, CA 94043, United States | |


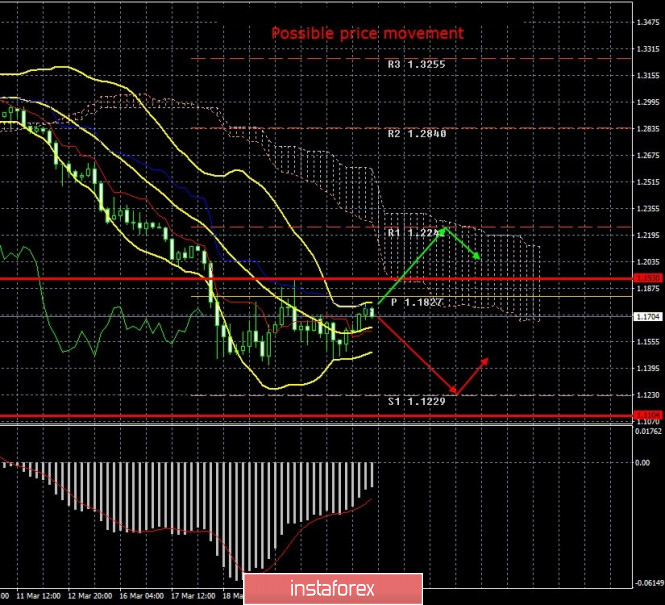
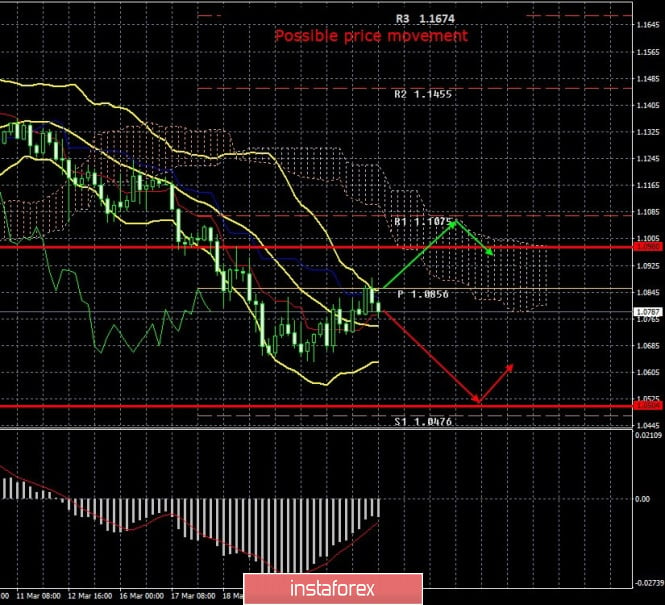

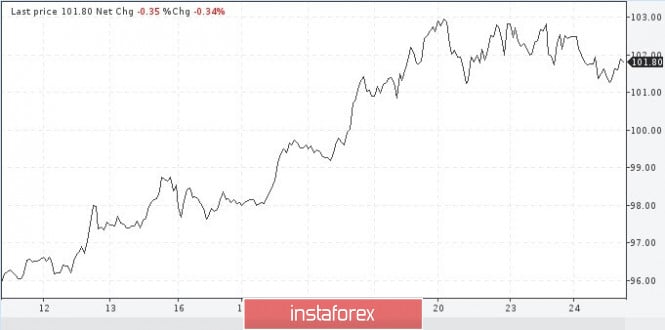

 However, the US dollar continues to remain under pressure against the euro and the pound, after the Federal Reserve said yesterday that it is launching an unprecedented campaign to distribute funds and pump the economy with liquidity. In yesterday's statement, the committee said that the Fed will now buy Treasury bonds and mortgage-backed securities in unlimited amounts. Already this week, it is planned to purchase Treasury bonds for $375 billion, and the volume of purchases of mortgage-backed securities will amount to $250 billion.
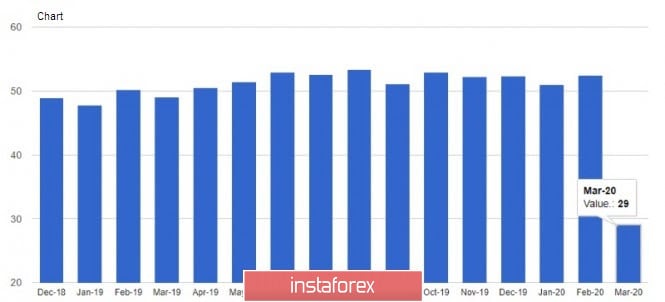
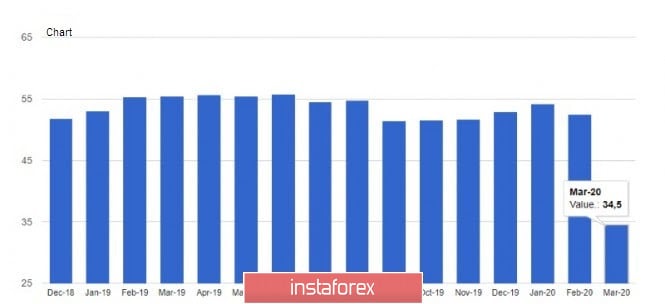
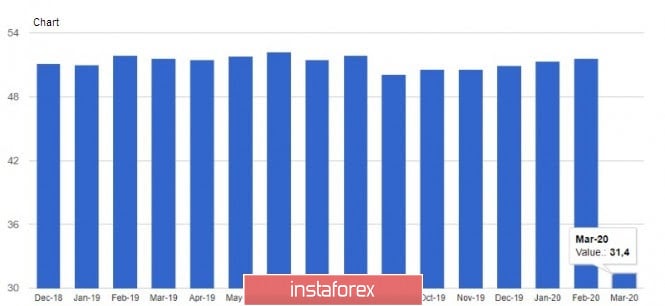
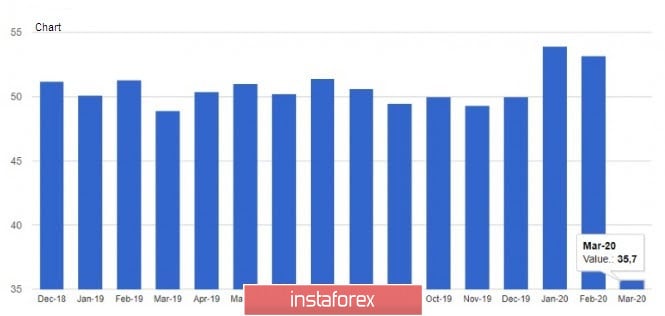
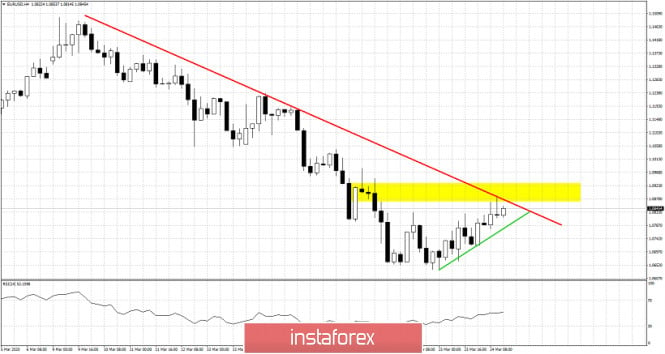
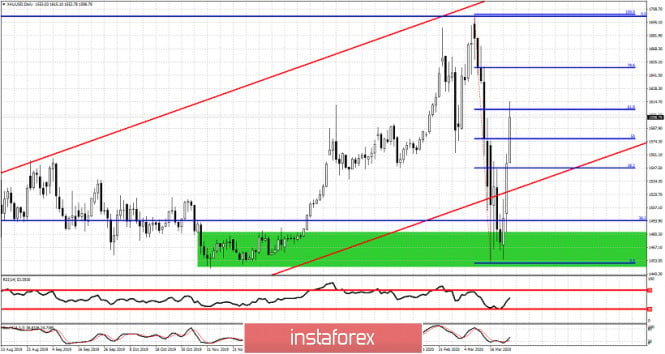
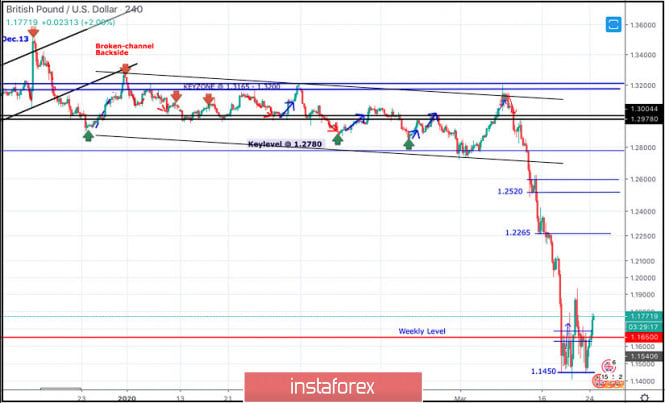

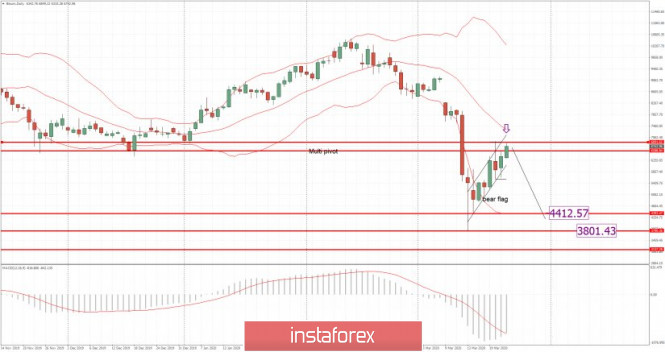


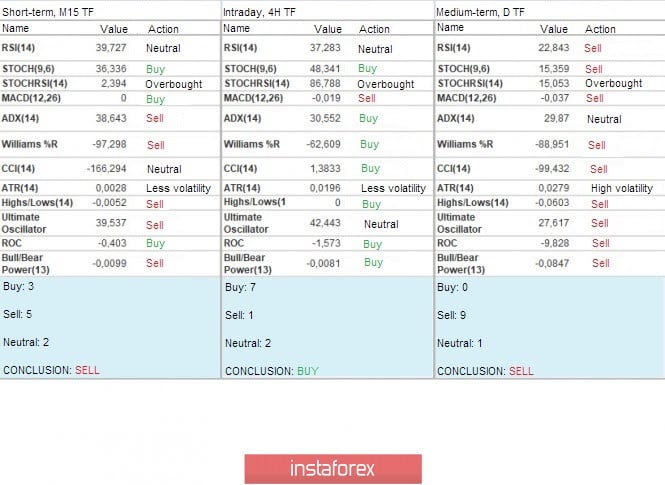
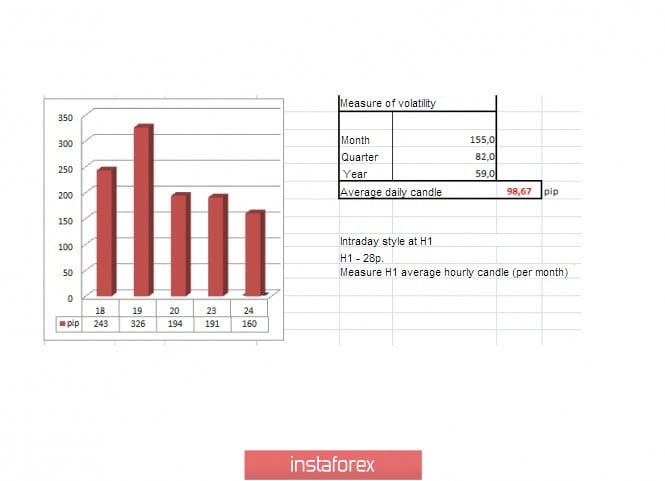
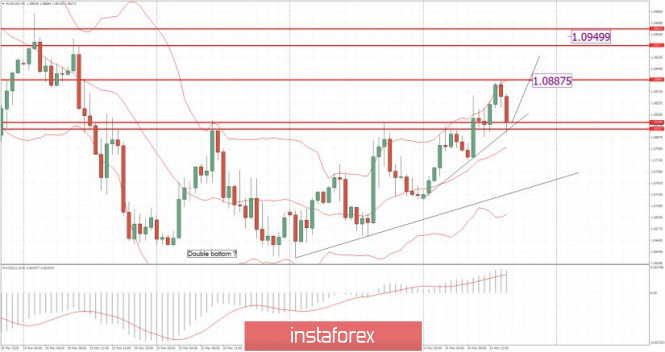
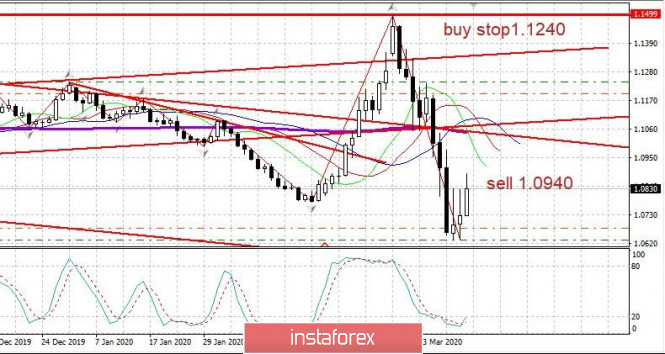
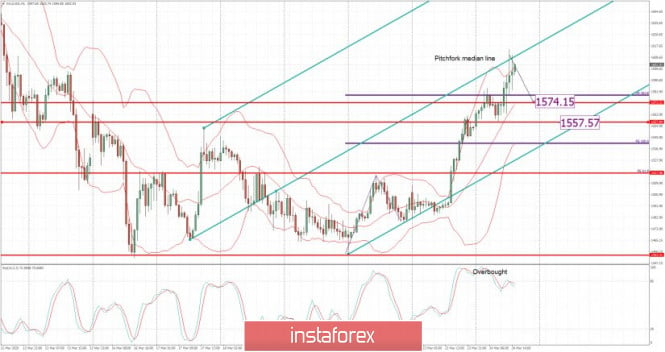
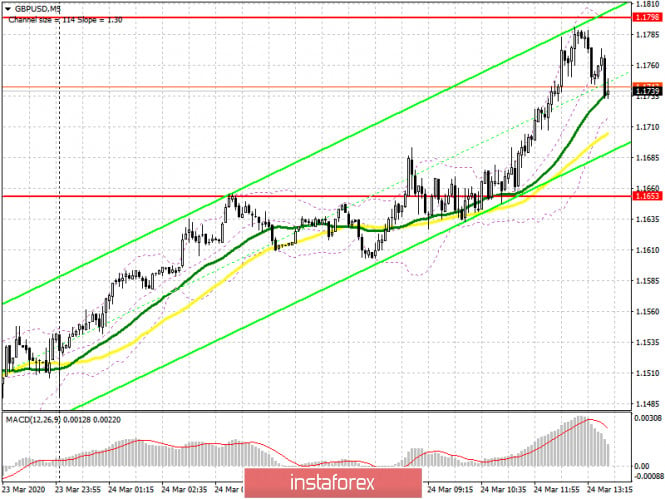
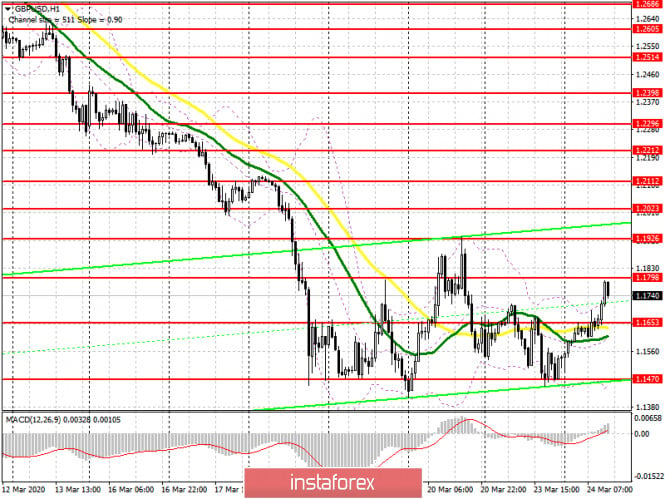
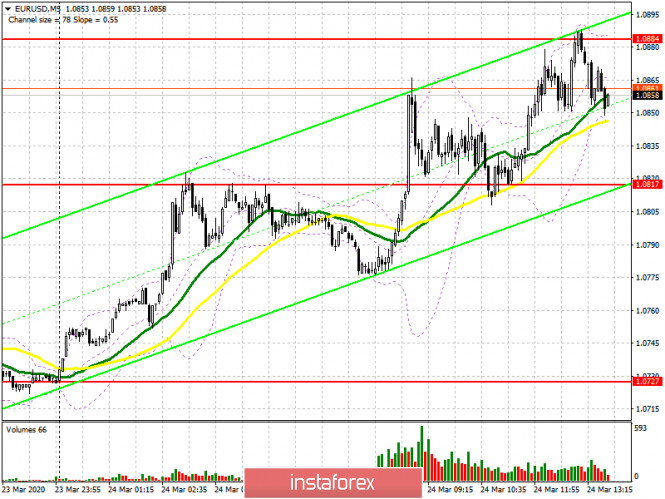
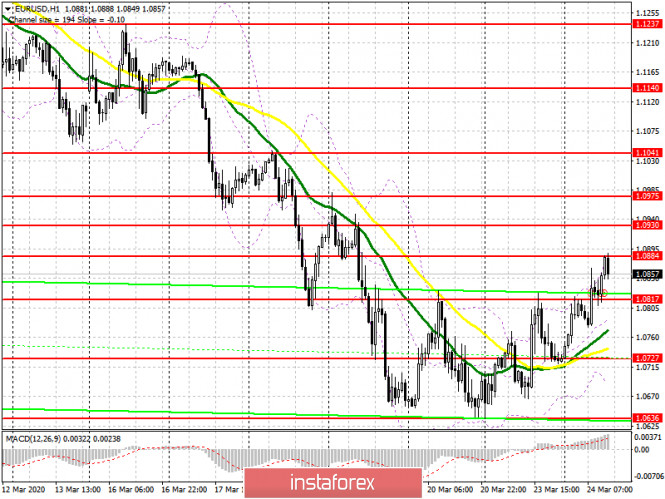
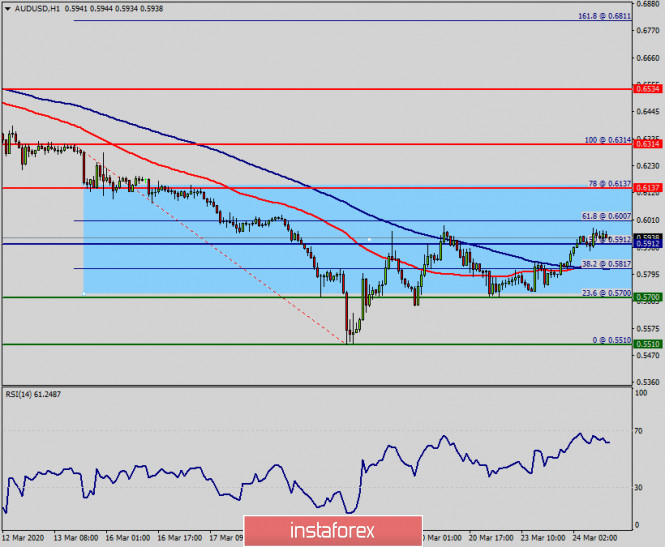
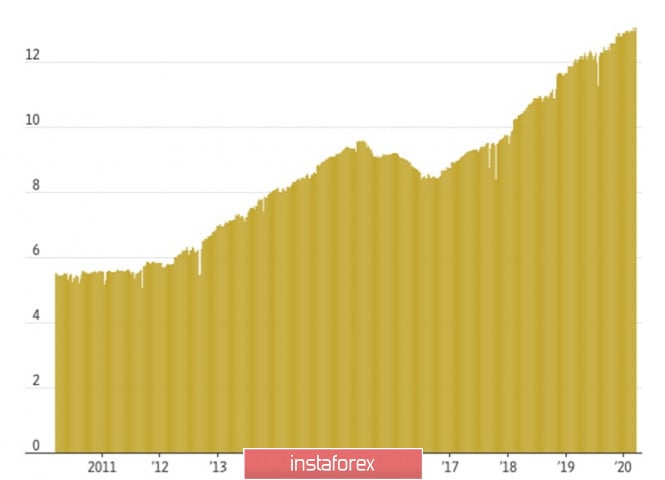
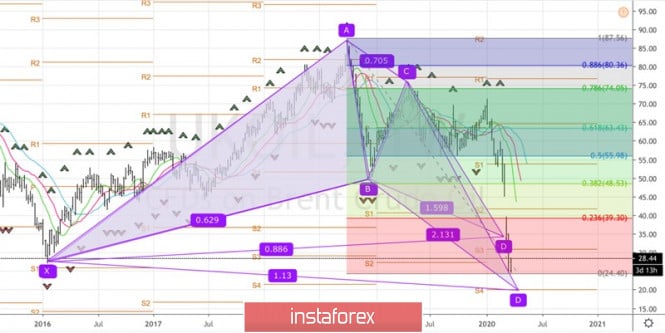
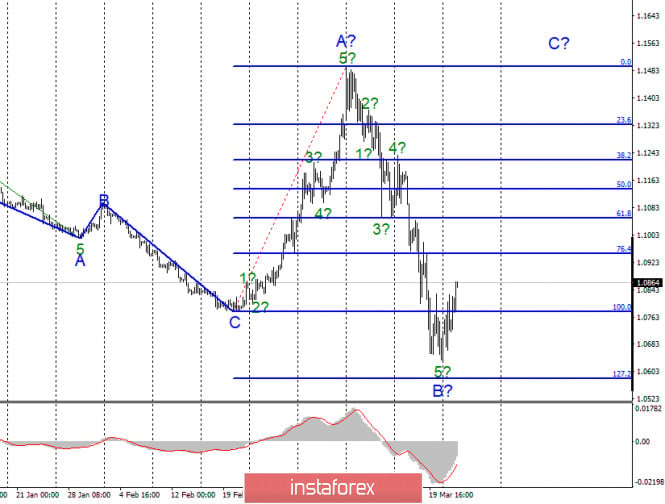
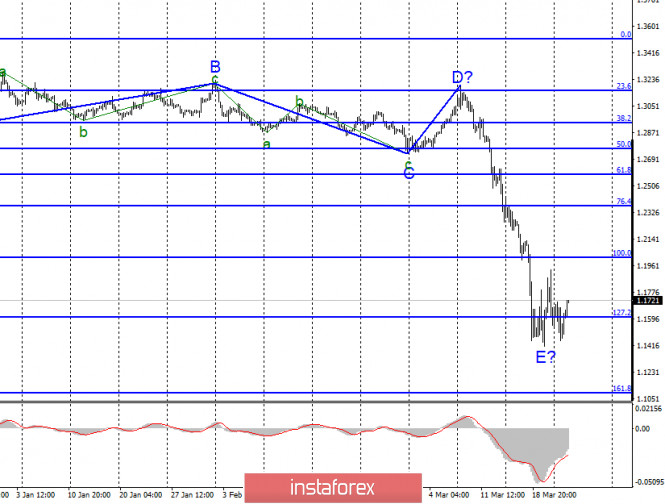



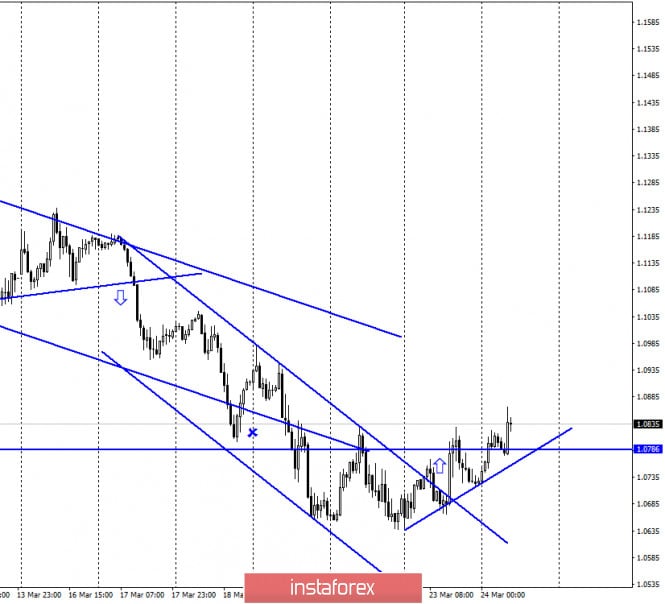
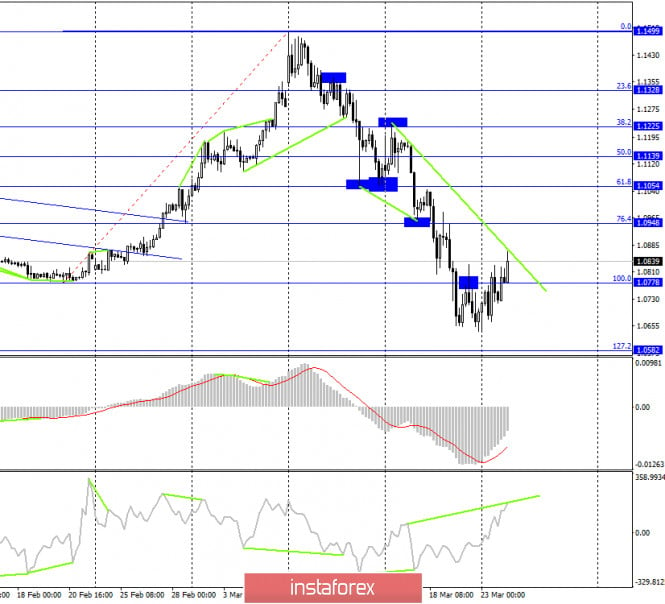
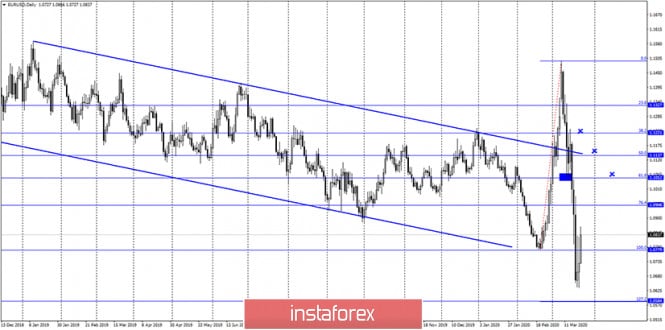
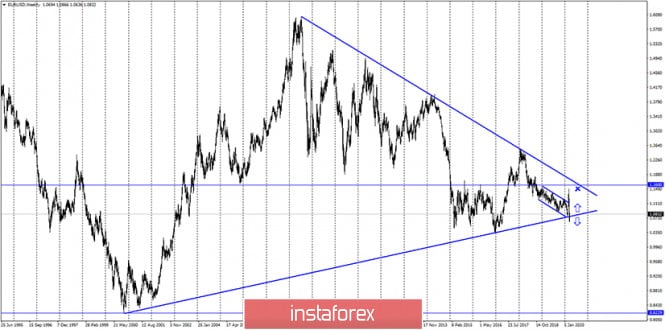
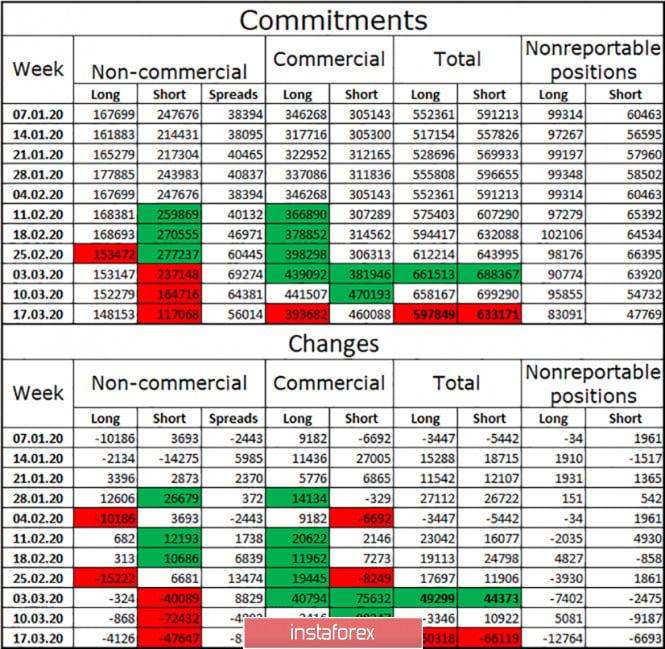
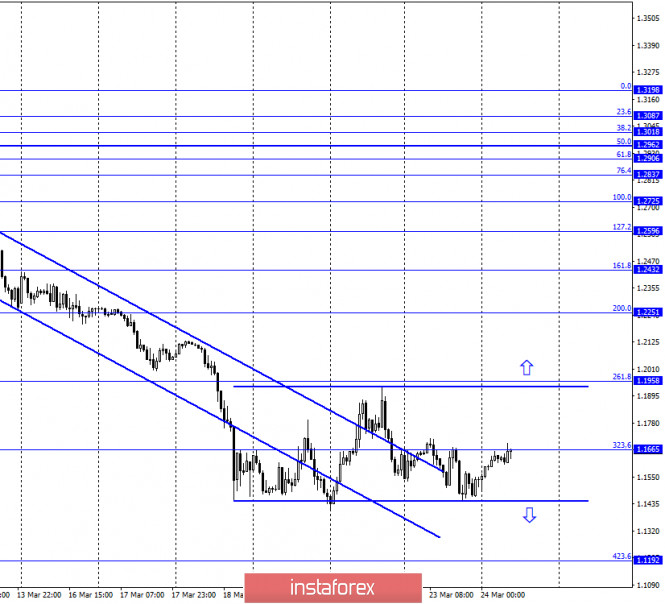
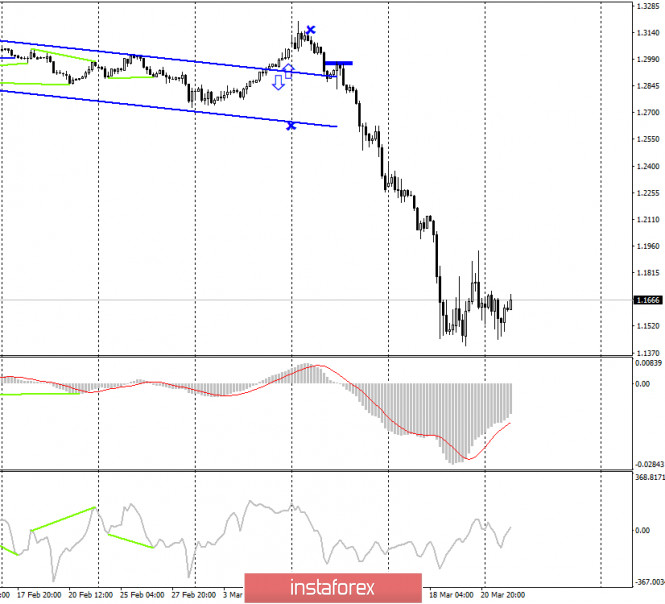
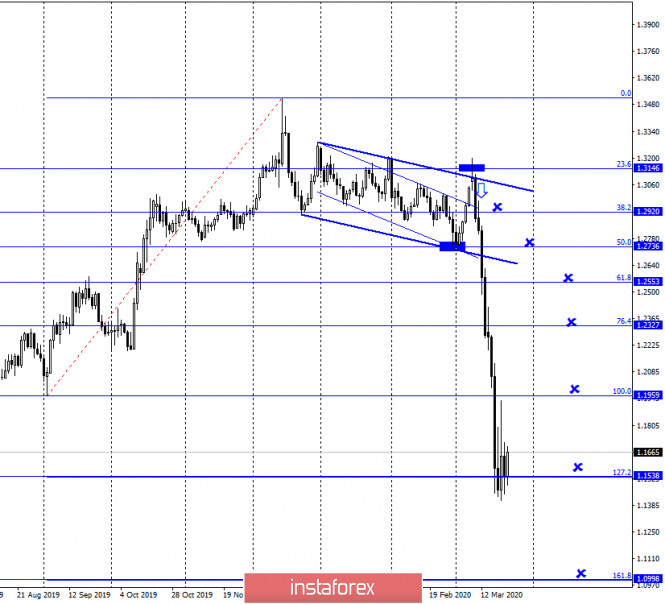
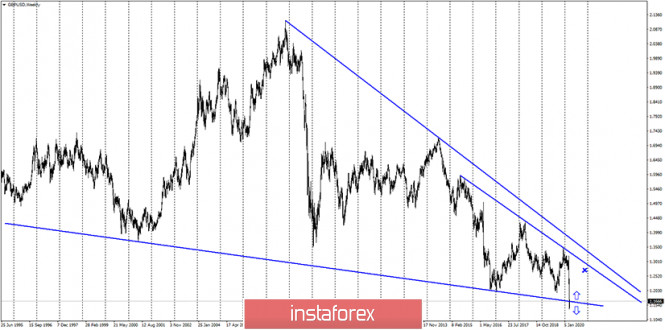
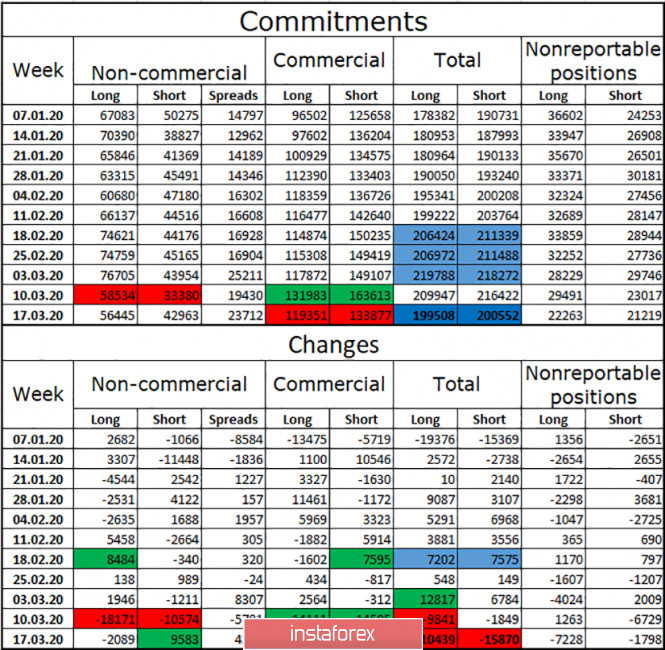


No comments:
Post a Comment