Forex analysis review |
- Comprehensive analysis of movement options of #USDX vs EUR/USD vs GBP/USD vs USD/JPY (H4) on April 01, 2020
- EUR/USD. Powell foiled the bears blitzkrieg
- EUR/USD and GBP/USD. March 31. Results of the day. German unemployment pleased, and EU inflation fell below 1%
- Short-term technical analysis of EURUSD
- Gold price turns lower
- GBP/USD review and forecast for March 31, 2020
- Trading plan for Silver for March 31, 2020
- Trading plan for US Dollar Index for March 31, 2020
- EURUSD: Weak eurozone inflation and German labor market resilience have started a series of reports on the state of the global
- March 31, 2020 : GBP/USD Intraday technical analysis and trade recommendations.
- Trading recommendations for EURUSD pair on March 31
- March 31, 2020 : EUR/USD Intraday technical analysis and trade recommendations.
- Trading plan for SPX500 for March 31, 2020
- Analysis and forecast for EUR/USD as of March 31, 2020
- EUR/USD and GBP/USD. The confrontation between Donald Trump and representatives of the healthcare sector. The confrontation
- GBP/USD: plan for the US session on March 31. The pound continues to stay in one place, and the bulls are actively protecting
- EUR/USD: plan for the US session on March 31. Bears continue to control the market and try to gain a foothold below the support
- BTC analysis for 03.31.2020 - I expect further drop on BTC towards the levels at $4.400 and $3.800. The gap breakout of the
- Technical analysis of GBP/USD for March 31, 2020
- Analysis for Gold 03.31.2020 - Watch for the prrice action around the our main pivot at the price of $1.588 to confirm further
- EUR/USD: future outlooks
- Trading plan for Dow Jones for March 31, 2020
- Three reasons to buy Brent
- GBP/USD analysis for 03.31.2020 - Completion of the ABC downward correction ? Potential forr new upside swing towarrds the
- Evening review 03/31/2020. Investor question: Stocks significantly fell. When and how to buy?
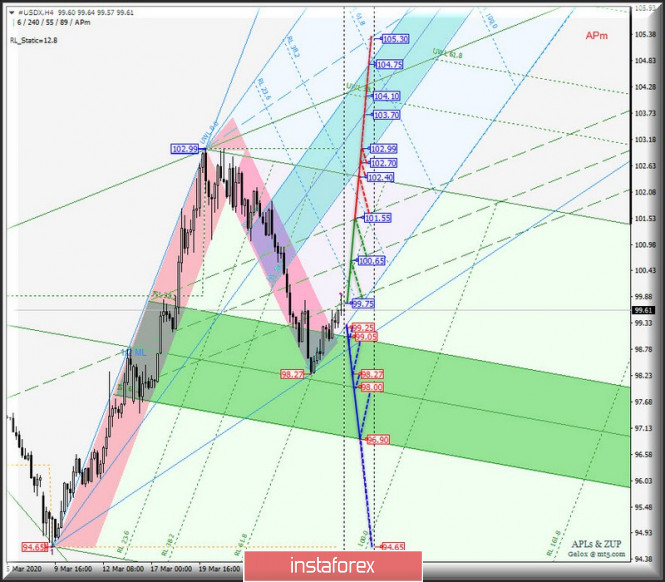
| Posted: 31 Mar 2020 06:50 PM PDT Minuette operational scale (H4) A day of laughter (April Fool's day) or fun continues in the markets. Here's the development options for the movement of the main currency instruments #USDX vs EUR / USD vs GBP / USD vs USD / JPY from April 1, 2020 in a comprehensive form ____________________ US dollar index The movement of the dollar index #USDX from April 1, 2020 will be due to the development and direction of the breakdown of the range:
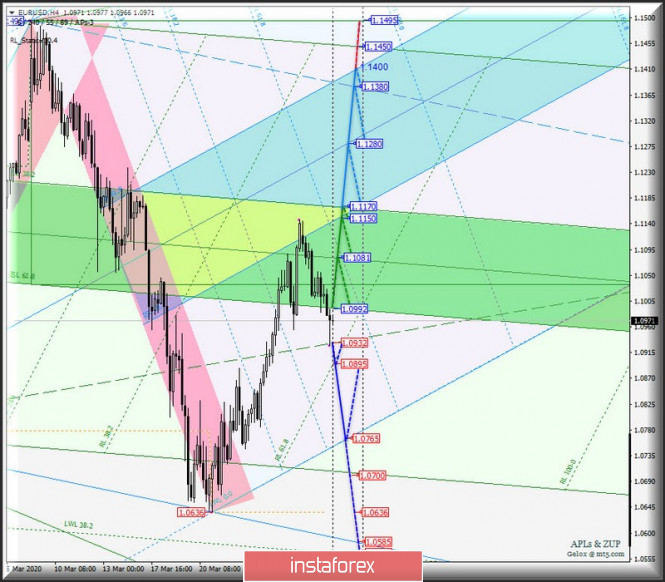
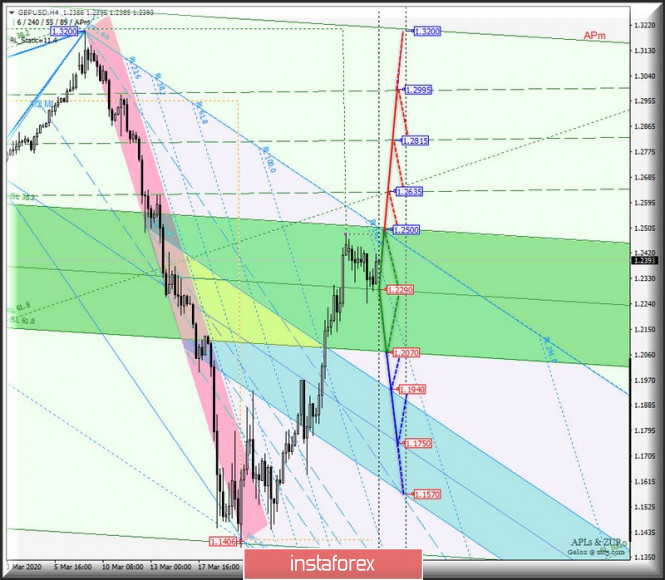
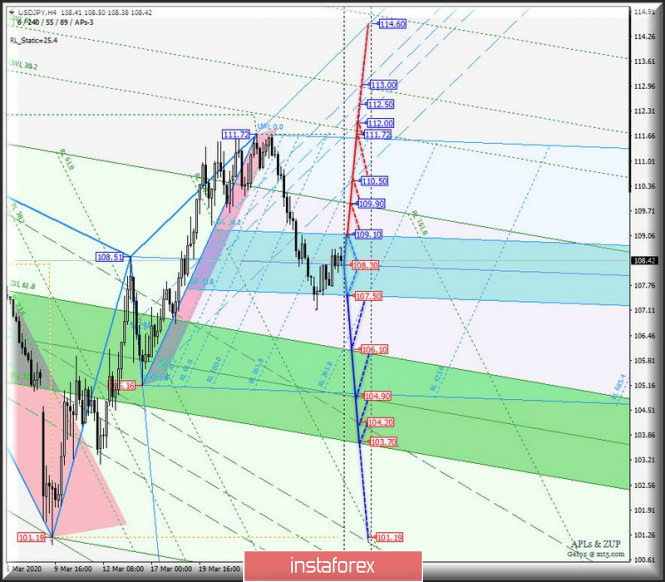
The breakdown of the resistance level of 99.75 is an option for the development of the movement of the dollar index in the 1/2 Median Line Minuette channel (99.75 - 100.65 - 101.55) with the prospect of reaching the SSL Minuette start line (102.40) and the equilibrium zone (102.70 - 104.10 - 104.75) of the Minuette operational scale. On the other hand, with a sequential breakdown of the resistance level of 99.25 on the initial SSL line of the Minuette operational scale forks and ISL38.2 Minuette (99.50), the movement #USDX will occur again in the equilibrium zone (99.05 - 98.00 - 96.90) of the Minuette operational scale forks. The details of marking the movement of the dollar index from April 1, 2020 are presented on the animated chart. ____________________ Euro vs US dollar From April 1, 2020, the development of the movement of the single European currency EUR / USD will continue depending on the development and the breakdown direction of the range:
The breakdown of the final Schiff Line (support level of 1.0932) Minuette will lead to an option to continue the downward movement of the single European currency to the goals: - reaction line RL61.8 (1.0895) of the Minuette operational scale forks; - SSL start line (1.0765) of the Minuette operational scale forks Alternatively, the breakdown of ISL61.8 (resistance level of 1.0992) Minuette will lead to the option of resuming the movement of EUR / USD in the equilibrium zone (1.0992 - 1.1081 - 1.1170) of the Minuette operational scale forks and during the breakdown of ISL38.2 Minuette (1.1170), the movement of this instrument will already begin to flow in the equilibrium zone (1.1150 - 1.1280 - 1.1400) of the Minuette operational scale forks. The details of the EUR / USD movement options is shown on the animated chart. ____________________ Great Britain pound vs US dollar Her Majesty's GBP / USD currency from April 1, 2020 will continue to develop its movement in the equilibrium zone (1.2070 - 1.2290 - 1.2500 of the Minuette operational scale forks. The details of working out the indicated levels are presented on the animated chart. The breakdown of the support level of 1.2070 on the lower boundary of ISL61.8 of the equilibrium zone of the Minuette operational scale forks is a continuation of the downward movement of Her Majesty's currency to the equilibrium zone (1.1940 - 1.1750 - 1.1570) of the Minuette operational scale forks. Meanwhile, in case of breakdown of the upper boundary of the ISL38.2 (resistance level of 1.2500) equilibrium zone of the of the Minuette operational scale forks, the upward movement of GBP / USD will continue to the boundaries of the 1/2 Median Line Line Minuette channel (1.2635 - 1.2815 - 1.2995). The details of the GBP / USD movement can be seen on the animated chart. ____________________ US dollar vs Japanese yen The currency of the "land of the rising sun" USD / JPY from April 1, 2020 will continue to develop its movement depending on the development and direction of breakdown of the boundaries of the equilibrium zone (107.50 - 108.30 - 109.10) of the Minuette operational scale forks. The details of the development of the mentioned levels are presented on the animated chart. The breakdown of the upper boundary of ISL38.2 (resistance level of 109.10) equilibrium zone of the Minuette operational scale fork will lead to the continuation of the development of the upward movement of USD / JPY to the goals: - final line FSL (109.90) of the Minuette operational scale forks; - ultimate Schiff Line Minuette (110.50); - 1/2 Median Line Minuette channel (112.00 - 112.50 - 113.00). On the contrary, the breakdown of the lower boundary of ISL61.8 (support level of 107.50) of the equilibrium zone of the Minuette operational scale forks will lead to the continuation of the downward movement of USD / JPY to the equilibrium zone (106.10 - 104.90 - 103.70) of the Minuette operational scale forks. We look at the details of the USD / JPY movement on the animated chart. ____________________ The review was compiled without taking into account the news background. Thus, the opening trading sessions of major financial centers does not serve as a guide to action (placing orders "sell" or "buy"). The formula for calculating the dollar index : USDX = 50.14348112 * USDEUR0.576 * USDJPY0.136 * USDGBP0.119 * USDCAD0.091 * USDSEK0.042 * USDCHF0.036. where the power coefficients correspond to the weights of the currencies in the basket: Euro - 57.6% ; Yen - 13.6% ; Pound Sterling - 11.9% ; Canadian dollar - 9.1%; Swedish krona - 4.2%; Swiss franc - 3.6%. The first coefficient in the formula leads the index to 100 at the starting date - March 1973, when the main currencies began to be freely quoted relative to each other. The material has been provided by InstaForex Company - www.instaforex.com |
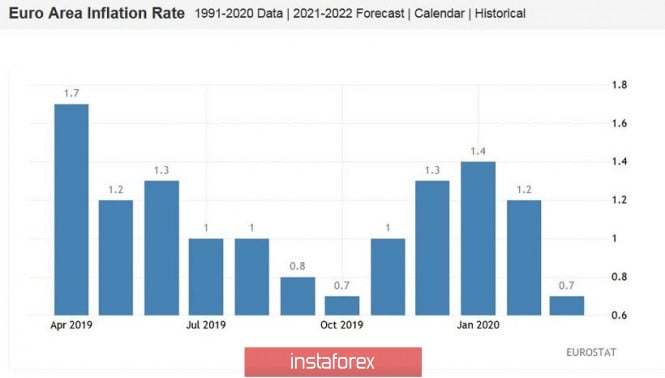
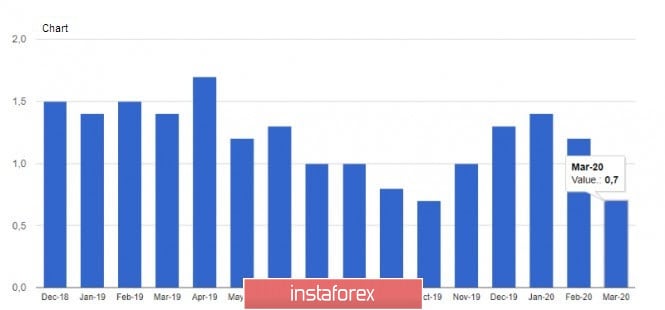
| EUR/USD. Powell foiled the bears blitzkrieg Posted: 31 Mar 2020 02:09 PM PDT Bears of the euro-dollar pair are trying to gain a foothold in the ninth figure today: sellers easily sorted out the support level of 1.1010 (the upper limit of the Kumo cloud on the daily chart) and went down to the middle of the ninth figure. However, this ended the blitzkrieg. A protracted positional struggle began against the background of a rather contradictory fundamental picture. From a technical point of view, the bears had an open path to the lower boundary of the above – mentioned cloud (1.0880) earlier in the day. If they had impulsively broken through the 1.0900 mark, the probability of overcoming this support level would have been almost one hundred percent. In this case, the downward trend would have continued. But the market, as well as history, does not tolerate the subjunctive mood. De facto, dollar bulls no longer demonstrate their former confidence in their abilities – if during the previous two weeks, sellers of EUR/USD literally swept away everything in their path (the pair collapsed by more than 500 points in ten trading days), now they have to win back literally every point. If we talk about the situation "inside the day", the sales were justified after the bears overcame the upper limit of the Kumo cloud on D1 (1,1010). Having conquered this price outpost, sellers were able to go down almost a hundred points - to the daily low of 1.0927. Here they met resistance from buyers and were unable to "give a fight" – the intraday fundamental background did not contribute to the unambiguous strengthening of the dollar, especially in the afternoon. Therefore, the EUR/USD bulls effortlessly took the initiative and returned the price back to the 10th figure. Such price somersaults were caused by the current news flow. In particular, the European inflation indicator for March came out today worse than forecasts. The overall consumer price index fell to 0.7% from the previous level of 1.2% (the forecast for a decline was 0.8%). Core inflation also showed a negative trend, falling from 1.2% to one percent. By and large, the slowdown in European inflation fits logically into the overall fundamental picture of European macro indicators in the context of the crisis. On the other hand, the published figures were still in the "red zone", even despite the rather weak forecast values. This fact put pressure on the Euro, after which the pair updated the daily low. Moreover, the pressure on the pair increased at the beginning of the US session – the US published an indicator of consumer confidence, which unexpectedly turned out to be better than expected. Although the indicator updated the multi-month low (120 points), it still exceeded the forecast level. According to most experts, the indicator should have shown a deeper decline – up to 115 points. We can not say that there is any reason for optimism, but the fact that the report was in the green zone cheered dollar bulls. In addition, the US currency was in some demand as a defensive asset, especially after the key wall street indexes opened in negative territory: the Dow Jones Industrial Average and S&P 500 fell by 0.55%, and the Nasdaq Composite – by 0.25%. But the EUR/USD bears could not take advantage of the situation. In contrast to their arguments, the pair's bulls received a more weighty argument of a fundamental nature. Today it became known that the Federal Reserve will launch a new credit program for foreign central banks starting April 6. In fact, the Fed is expanding access to dollars through a REPO agreement: foreign central banks will now be able to access US dollars (during the so-called coronavirus crisis) by exchanging their holdings of US Treasury securities for dollar loans overnight. The duration of this program is currently limited to six months ("at least six months"), but the US central bank has made it clear that if necessary, it will extend its operation. Let me remind you that the Fed has already launched several programs that provide dollar loans at a "close to zero" rate to foreign central banks. To provide dollar liquidity, the Fed also opened swap lines with five central banks (including the ECB, Bank of Japan, and Bank of Canada) and provided multibillion-dollar loans to regulators in nine other countries. In other words, the Fed just extinguished the short-term downward momentum for the EUR/USD pair. This factor saved the pair from falling into the eighth figure – in general, the fundamental background contributed to such a price movement – if not for the US regulator's intervention, sellers would have already tested the support level of 1.0880. But the fact is today's round is still a draw, and the situation looks extremely uncertain at the moment, especially in the run-up to tomorrow's key releases. The ADP report on changes in the number of employed in the United States will be released tomorrow. It is important first of all in the context of the upcoming Nonfarms, which will be published on Friday. Forecasts are disappointing – according to ADP specialists, the number of employed people in March decreased by 125,000. Such a result will be a long-term anti-record and will undoubtedly put pressure on the US currency. In addition, the ISM manufacturing index is expected to be published on April 1. There will also be a "no laughing matter" – according to general expectations, this indicator will again fall under the key 50-point mark and reach 46 points, which is a multi-year low. Thus, at the moment, it is advisable to take a wait-and-see position for the pair: selling looks risky until the bears have overcome the support level of 1.0880, while purchases look unreliable until the bulls have risen (and secured) above the target of 1.1060 (the average line of the Bollinger Bands indicator coincides with the Kijun-sen line on the daily chart). Given the importance of tomorrow's releases, there is a high probability that the EUR/USD pair will still choose the vector of its further movement by the end of the US session on Wednesday. The material has been provided by InstaForex Company - www.instaforex.com |
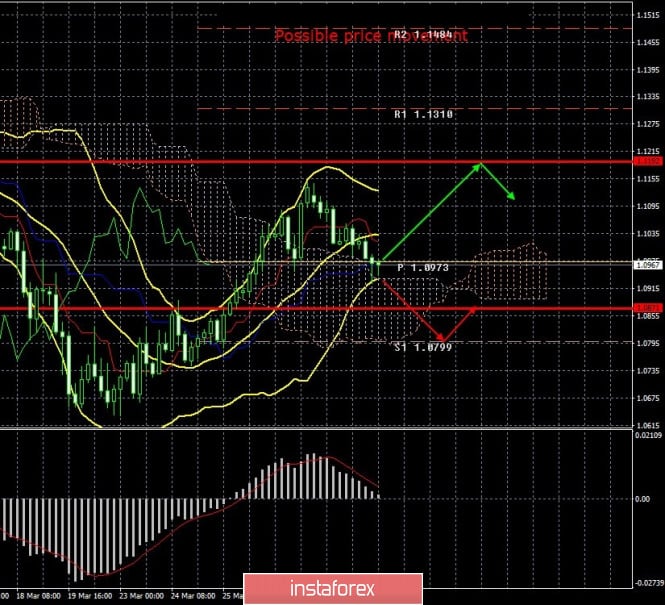
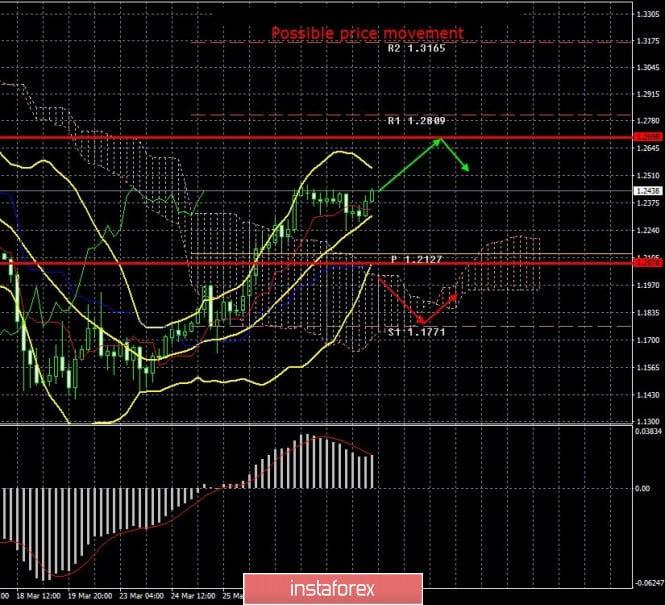
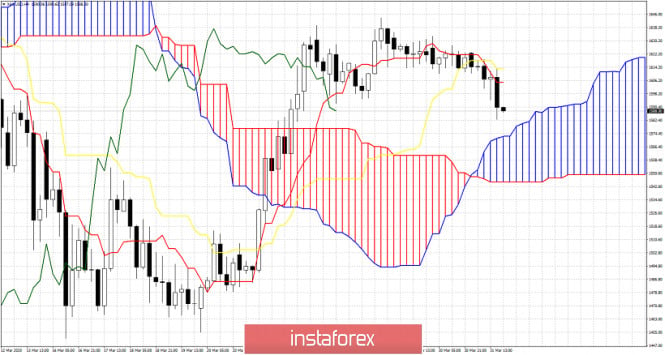
| Posted: 31 Mar 2020 02:09 PM PDT 4-hour timeframe Average volatility over the past five days: 160p (high). The EUR/USD pair ends the second trading day of the week with the continuation of the downward correction, which began the day before. At the moment, the pair has worked out the critical Kijun-sen line, so there are two possible scenarios for the near future. First: overcoming the Kijun-sen line and further pulling down the quotes of the euro/dollar pair. The second (more likely): a rebound from the Kijun-sen line, and at the same time from the stronger Senkou Span B line, which has also been worked out at the moment. The first scenario will make it possible to count on a new round of appreciation of the US currency, the second - on the resumption of an upward trend that has formed after March 20. It is not known which option is more likely from a fundamental point of view. We have repeatedly said that there are a huge number of fundamental factors that, in theory, can influence the behavior of traders. However, this huge amount, in fact, has the same significance as if none of the fundamental factors now affects the movement of the pair. When there are more than five factors and each one is constantly increasing, then weakening, it is impossible to predict which and when will provoke a new movement. Thus, as before, we recommend that close attention be paid to the technical picture - as the most neutral and informative at this time. Today, March 31, Germany published relatively important unemployment data for March. It turned out that the main unemployment rate at the end of March did not change compared to February and reached the same 5%. Also, we can say that the indicator of changes in the number of unemployed compared to the previous month, which showed an increase of only one thousand, instead of the predicted 30-35 thousand. However, as we can all see, the euro continued to lose positions against the US dollar during the day. So once again, we can conclude that macroeconomic statistics had almost no impact on the pair's movement at this time. In addition to unemployment in Germany, European Union inflation data for March was also published today. So far, preliminary data. The core consumer price index (excluding highly volatile commodity groups such as energy and food) slowed to 1.0%, while the main inflation indicator fell to 0.7% in annual terms. For the eurozone, this news is, of course, sad and disappointing, but what else could traders expect from the month of March, given all the events related to the epidemic in the world, and separately in Europe? We believe that all macroeconomic statistics in the United States and the EU will only get worse in the coming months. Question: how much will it deteriorate? So far, the indexes of business activity in the service sector have been really disappointing to a high degree. Both in the US and the EU. As well as applications for unemployment benefits in the United States. Other indicators are published at more or less decent levels. Meanwhile, the total number of cases of coronavirus in the world exceeded 800,000. In the United States, 165,000 cases of the COVID-2019 virus were recorded, while in Italy, the closest to it, there were 102,000 cases. As we can see, the total number of cases in the EU is much higher than overseas. The sum of the victims of four countries (Italy, Spain, Germany and France) is about 320,000. Almost twice as much as in much larger America. However, the epidemic is growing at the highest rate in the US. The highest death rate from the virus in Italy, with the virus taking about one in ten lives. For example,, the death rate from the virus is no more than 1% in Germany or Switzerland. US President Donald Trump once again announced that the rules of social distancing will be extended until the end of April, and may also be tightened. "Based on the simulation, we can conclude that the peak of the pandemic will not come in the next two weeks," Trump said. The US president also said that more than a million tests for coronavirus were conducted in the country. "The number of tests was incredible. Each of us has a role to play in defeating the epidemic," Trump said. 4-hour timeframe Average volatility over the past five days: 310p (high). The GBP/USD pair has been in a 200-point flat for two consecutive days and almost froze in one place. This, of course, is sarcasm, since the volatility of 200 points cannot be called being in one place, but, based on the illustration, this is the impression. The pound quotes slightly fell at the beginning of the day, and has slightly increased during the US session. On the whole, we cannot ascertain either the beginning of a downward correction or the resumption of an upward trend. Gross Domestic Product data for the fourth quarter was released in the UK, which, however, did not really interest anyone. As we have already said, statistics, especially for the period up to March 2020, do not particularly concern market participants. GDP was +1.1% in annual terms, and 0% in monthly terms. Commercial investments grew in the fourth quarter by 1.8% in annual terms and decreased by 0.5% in monthly terms. There are no important economic news from overseas today. One of the main stories of the day in the British media was the recovery of Prince Charles from the coronavirus. The prince was quarantined for seven days and had already left the limits of self-isolation in his mansion in Scotland. In total, in Great Britain at the moment 22.5 thousand inhabitants are considered infected, 1400 - deaths. Recommendations for EUR/USD: For long positions: The euro/dollar pair may complete the correction near the Kijun-sen line on the 4-hour timeframe. Thus, it is advised to buy the euro in case quotes rebound from the Kijun-sen line with the target of a volatility level of 1.1192. For short positions: It will be possible to sell the EUR/USD pair no earlier than consolidating the price below the important lines of Senkou Span B and Kijun-sen. The first goal is the support level of 1.0799. It is better to consider shorts in this case in small lots. Recommendations for GBP/USD: For long positions: The pound/dollar pair is currently trying to resume the upward movement. Thus, it is recommended to buy the British pound with the goal of a volatility level of 1.2698 after the MACD indicator turns up or, conversely, to remain in longs until a more eloquent correction signal. For short positions: It will be possible to sell the GBP/USD pair not earlier than when the bears overcome the critical line with the first goal - the support level of 1.1771 - and small lots, since the price will be inside the Ichimoku cloud at this time. The material has been provided by InstaForex Company - www.instaforex.com |
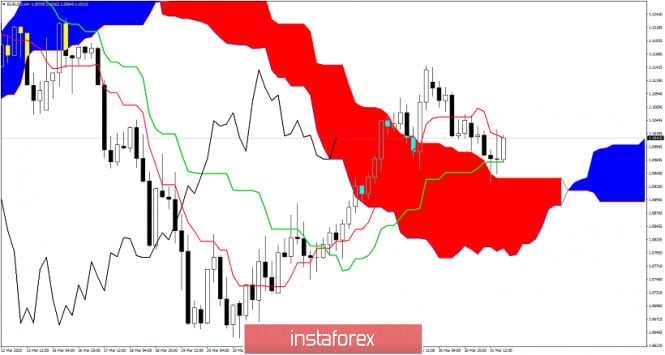
| Short-term technical analysis of EURUSD Posted: 31 Mar 2020 11:33 AM PDT Short-term support fails to hold in EURUSD and price action shows how vulnerable this pair is. The recent bounce from 1.0635 was most probably a relief bounce and price is making a reversal off the major Fibonacci retracement we mentioned in previous posts.
Although the new higher high with a new bearish RSI divergence did not come, EURUSD broke below short-term support at 1.0990. In Ichimoku cloud terms nothing is lost. On the contrary it is textbook price behavior to see price back test cloud support after breaking above the cloud. Bulls remain in control as long as price is above the cloud. Breaking below 1.0930 would confirm the important top at 1.1145 and will increase the chances of a move towards 1.06-1.07. Short-term support is at 1.0965. Failure to hold this level would be another bearish sign. I will turn bearish if we break below 1.0965. The material has been provided by InstaForex Company - www.instaforex.com |
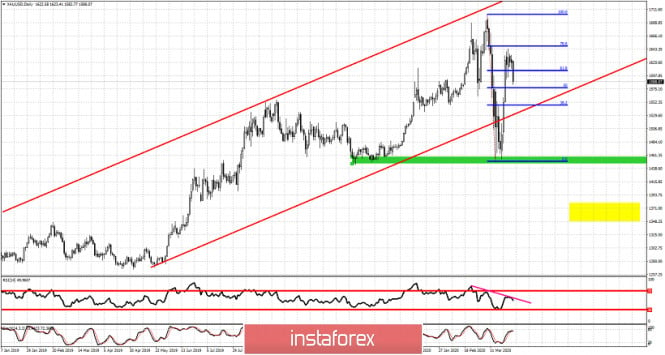
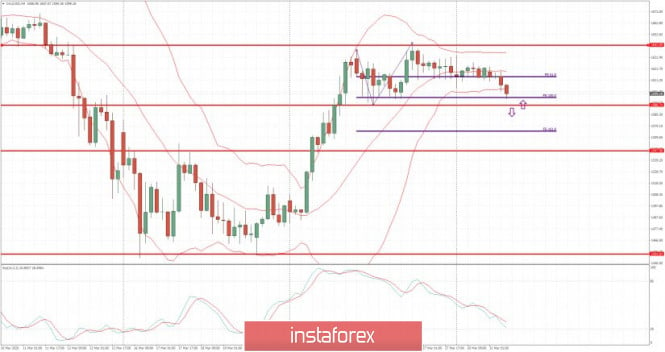
| Posted: 31 Mar 2020 11:22 AM PDT Gold price is trading below $1,590 and price is approaching our first short-term target of $1,570. Price has reversed as initially expected. The new higher high scenario with another bearish divergence did not come as price broke below short-term support.
Yellow line - target area if price breaks below green rectangle Red lines - bullish channel Pink line - RSI resistance Gold price is reversing below the 61.8% Fibonacci retracement. Again this Fibonacci area has proved an important turning point. Gold price is expected to move lower as we explained in previous posts towards $1,570 at least. Our second target is at $1,530. Breaking below $1,530 will increase the chances of moving below the green support area and approaching the yellow rectangle area. The material has been provided by InstaForex Company - www.instaforex.com |
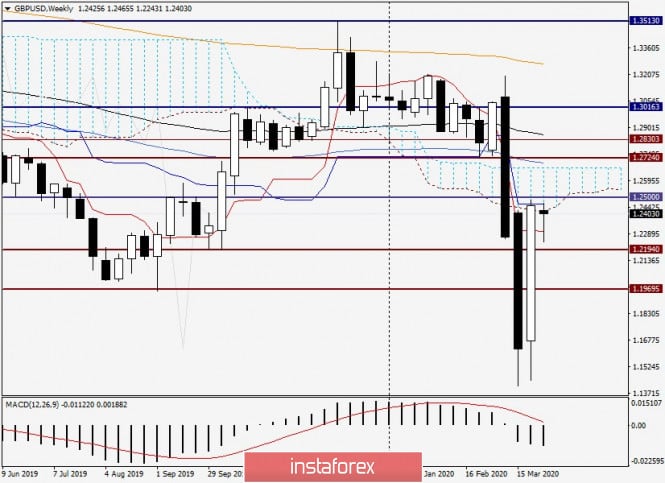
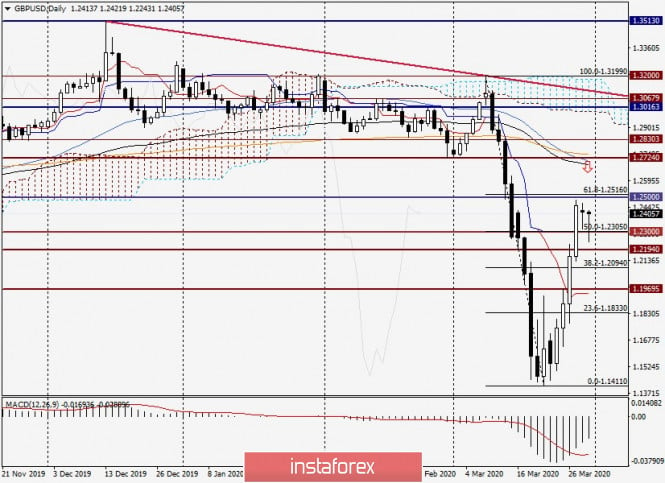
| GBP/USD review and forecast for March 31, 2020 Posted: 31 Mar 2020 07:55 AM PDT Good day, dear traders! Today's article on the GBP/USD pair again has to start with the sad events, which are the fault of the ill-fated COVID-19. As it became known at the end of last week, British Prime Minister Boris Johnson said in a tweet that he was infected with the coronavirus. This is not the only high-ranking person who was not spared by COVID-19. Earlier, a positive test was found in the Prince of Monaco Albert II, who is feeling well and is recovering from the coronavirus in his palace. As for the British prime minister, he is in self-isolation, but will continue to lead the Cabinet through video conferences. In general, as one publication reports, coronavirus has infected 800,050 people around the world. It should be noted that this figure cannot differ in accuracy, since it is constantly growing. A new type of coronavirus has been detected in the United Kingdom in just over 22,000 people. The number of fatalities from Covid-19 is approaching 1,500. The main focus, as it should be in such cases, is located in the largest and most populous city in the UK, London. By the way, according to statistics, the strongest outbreak of the epidemic is now in the United States, where 164,610 people are infected with the coronavirus. Then there are Italy, Spain and Germany. Spain beats all the anti-records. Over the past day, 849 people have become victims of the insidious epidemic! Okay, this topic is long and very difficult, let's go back to the pair, which, in fact, is the subject of this review. As it became known this morning, British GDP coincided with the forecasts of economists and showed fairly stable growth in the fourth quarter. I believe that this is a very good indicator in the context of the unresolved issue of the UK's exit from the European Union. Let me remind you that this was the final data, which recorded zero growth in the fourth quarter, and on an annual basis, GDP grew by 1.1%. But the data on changes in the volume of commercial investments and the balance of payments pleased investors and came out better than expected. At the end of the review, the US received data on the housing price index from S&P, which turned out to be worse than the forecast of 3.2% and reached the level of 3.1%. The US dollar is under slight pressure right now. However, I remind you that the main macroeconomic data from the United States today is the consumer confidence index. Well, it's time to move on to the charts of the GBP/USD pair, and since it's still the beginning of the week, let's start with the corresponding timeframe. Weekly Many have already buried the sterling and decided that it will continue to fall. To be honest, I had such thoughts, but knowing the speculative and volatile nature of the pound, I warned that everything can be expected from it. This is still a "fruit" that can survive even the most negative and critical situation for itself. What are the memories of the British currency's sell-off by Soros. So what? The pound recovered fairly quickly and began to strengthen. Even now, after a two-week sharp fall, the pound/dollar has already recouped almost half of the losses. And I believe that this is not the end of the appreciation of the British currency. Most likely, the pound will continue to grow this week, the targets of which may be the 1.2665-1.2695 price zones and possibly higher than 1.2700-1.2730. Judging by the weekly schedule, it is better to look at sales not before the quote is at the designated values. The technical picture of the cross EUR/GBP also speaks about the pound's growth, where, apparently, there was a turn downwards. We see that the GBP/USD pair has corrected to the level of 1.2243, after which it will liquidate the losses at a decent pace, approaching the opening price of 1.2425. In the week, we see that the lower boundary of the cloud and the Kijun line of the Ichimoku indicator actively inhibit attempts to resume growth. For bulls on this instrument, it will be extremely important to complete weekly trading within the cloud and above Kijun. This is at least. Daily This chart indicates the market's desire to move up. This is very eloquently shown by the long lower shadows of the last two candles. By the way, the zone for possible and earliest sales is confirmed at this time period of accumulations of used moving averages (50 MA, 89 EMA and 200 EMA) in the 1.2687-1.2747 price area. I assume that the pair will continue to go up, and I consider the main trading idea for GBP/USD to be purchases after declines in the area of 1.2200-1.2150, as well as in the area of 1.2240-1.2140. I would like to draw your attention to the fact that such declines should be very short-lived. If the pair is seriously and permanently consolidated under the important level of 1.2200, further growth prospects will be in question. Good luck in trading! The material has been provided by InstaForex Company - www.instaforex.com |
| Trading plan for Silver for March 31, 2020 Posted: 31 Mar 2020 06:35 AM PDT
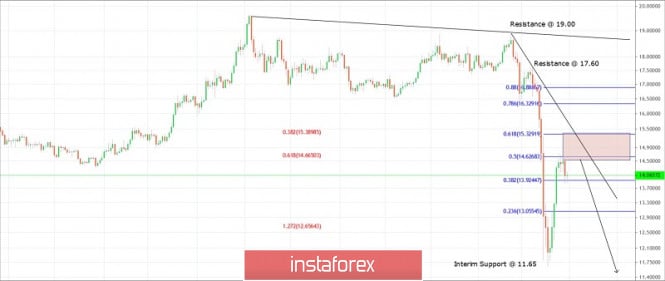
Technical outlook: Silver has retraced its recent drop up to fibonacci 50% around the $14.65 levels, which is expected to provide resistance. The rectangle mark is resistance zone that extends up to fibonacci 0.618 retracement towards $15.32 levels. If bulls are able to break above $14.65, the rally should extend through $15.30 levels before finding resistance and turning lower again. Please also note that immediate trend line resistance is also seen to be passing through $15.32 levels and a bearish bounce is expected if prices manage to reach there. Earlier, Silver had completed the drop that had begun from $19.65 levels. The fibonacci extensions were hit all the way towards $11.65 levels, before pulling back. The recent boundary that is being worked upon is between $17.60 and $11.65 respectively and it is retraced up to 50% until now. The overall structure remains bearish until prices stay below resistance at $17.60 levels. Trading point of view, short positions can be initiated between $14.00 and $15.30, with risk above $17.60 and targets below $11.65 respectively. Trading plan: Remain short from @14.00 and add more @ 15.30, stop at $17.60 and target below $11.65. Good luck! The material has been provided by InstaForex Company - www.instaforex.com |
| Trading plan for US Dollar Index for March 31, 2020 Posted: 31 Mar 2020 06:07 AM PDT
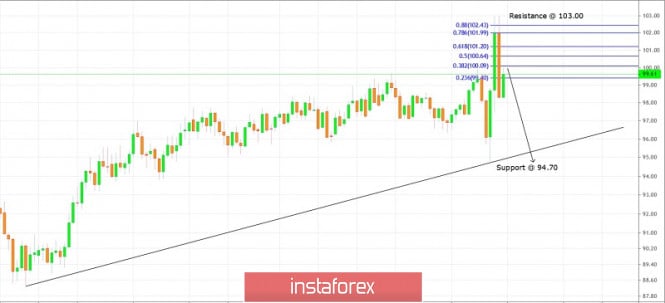
Technical outlook: US Dollar Index has produced an engulfing bearish candlestick pattern on the weekly chart, after hitting highs at 103.00 levels. The index is currently trading around 99.61 levels and is expected to resume its drop lower towards the 94.70 levels as indicated on the chart here. Immediate support is at 94.70, while resistance is seen towards 103.00 levels respectively. Please note that a break below 94.70 support would confirm that the trend has reversed for medium to long term. Also note that US Dollar Index has tested the fibonacci 0.382 retracement around 100.00 levels, which should act as resistance. Trading point of view, it is good to initiate short positions around 99.60/100.00 levels, with risk above 103.00 and targets below 94.70 levels in the short term. Also note that a 2 year support trend line would also break if the index manages to print below the 94.70 support. Trading plan: Sell @ 99.60/100.00, stop @ 103.00 target @ 94.70 Good luck! The material has been provided by InstaForex Company - www.instaforex.com |
| Posted: 31 Mar 2020 05:58 AM PDT Weak fundamental statistics for the economy of France, where there is a slowdown of inflation and consumer spending, together with slower growth of consumer prices in the eurozone, had a negative impact on the European currency during the European session on Tuesday, March 31. Only a report indicating a more or less stable situation in the German labor market in March of this year kept risk assets from falling more significantly. However, I would not count on this indicator very much, since it has recently become known about the suspension of work of a number of German factories, namely the automobile industry, and the threat of dismissal of employees, which will seriously affect the indicator and the economy as a whole. I think that the reasons why this is happening do not need to be named. As for consumer spending in France in February this year, it declined by 0.1% compared to March and fell by 0.6% compared to the same period in 2019. Although spending growth was forecast to be 0.7% and 0.5%, respectively. Such a sharp drop in the indicator can only signal that in March we can expect a larger reduction in consumer spending due to the strengthening of the coronavirus pandemic. As for inflation, according to the report, the preliminary consumer price index (CPI) in France in March 2020 remained unchanged compared to February and increased by only 0.6% year-on-year. The index was forecast at 0.3% and 0.9%, respectively. The preliminary harmonized consumer price index for EU standards rose by 0.7% per annum in March after rising by 1.6% in February. A sharp decline in inflationary pressure in France once again confirms the probability of deflation in the 2nd quarter of this year and a drop in GDP growth. In the euro area as a whole, inflation also weakened in March this year due to a sharp drop in energy prices caused by the coronavirus pandemic and a reduction in global demand. According to the EU Statistical Agency, the eurozone consumer price index rose by only 0.7% in March compared to the same period of the previous year, after rising by 1.2% in February. Energy prices fell immediately by 3.1% compared to February and 4.3% compared to the same period of the previous year. As for core inflation, which does not take this indicator into account, the index rose by 1% after increasing by 1.2% in February. Based even on this report, it is already possible to say that the European Central Bank is gradually moving away from its target level, set slightly below 2%. Expanding the volume of the bond purchase program with the provision of cheap long-term credit is a strong stimulus to the economy, but how these measures will respond to inflation remains a mystery. Most likely, the slowdown in further growth of the consumer price index in the coming months will continue. As mentioned above, there is no hope that the number of unemployed in Germany will remain at the same level in the future. Despite the fact that jobless growth in March was much lower than expected, this does not mean that Germany will be able to avoid the impact of the epidemic on the labor market in the future. According to a report from the Federal Employment Bureau, the number of applications for unemployment benefits in March 2020 rose by only 1,000 after a decline of 8,000 in February, while economists expected the number of applications to rise by 35,000 in March. The unemployment rate was 5.0%. The number of registered vacancies in March was 691,000. As for the technical picture of the EURUSD pair, the bears completely coped with the task and reached the level of 1.0950, which is now being actively fought by buyers of risky assets. In case of low demand for the euro even in this range, I recommend postponing long positions until the test of larger lows around 1.0870 and 1.0750. The material has been provided by InstaForex Company - www.instaforex.com |
| March 31, 2020 : GBP/USD Intraday technical analysis and trade recommendations. Posted: 31 Mar 2020 05:39 AM PDT
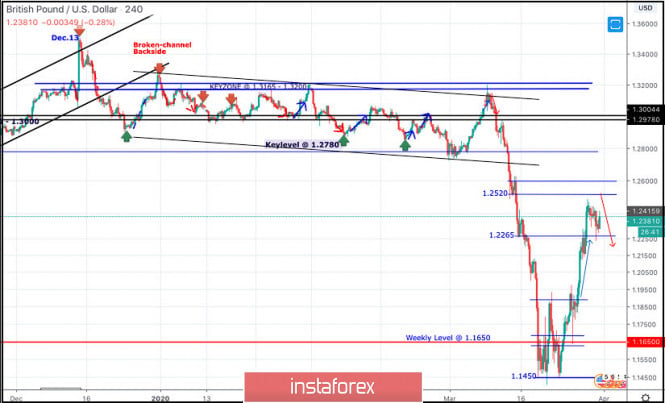
Since January 13, progressive bearish pressure has been built above the price level of 1.2780-1.2800 until March the 2nd when transient bearish consolidation below 1.2780 took place within the depicted wide-ranged slightly bearish channel. Shortly after, significant bullish rejection was demonstrated around 1.2780 on March 4. Hence, a quick bullish movement was expressed towards the price zone of 1.3165-1.3200 where significant bearish pressure brought the pair back below 1.2780, 1.2500 then 1.2260 via quick bearish engulfing H4 candlesticks. Recently, the GBPUSD has reached new LOW price levels around 1.1450, slightly below the historical low (1.1650) achieved in September 2016. Recently, the GBP/USD pair looked very OVERSOLD around the price levels of 1.1450 where a double-bottom reversal pattern was recently demonstrated. Technical outlook will probably remain bullish if bullish persistence is maintained above 1.1890-1.1900 (Double-Bottom Neckline) on the H4 Charts. Bullish breakout above 1.1900 (Latest Descending High) invalidated the bearish scenario temporarily & enabled a quick bullish movement to occur towards 1.2260. Next bullish targets around 1.2520 and 1.2680 are expected to be addressed if sufficient bullish momentum is maintained. On the other hand, H4 Candlestick re-closure below 1.2265 hinders further bullish advancement and enhances the bearish momentum on the short term. If so, Initial Bearish target would be located around 1.1900 provided that quick H4 bearish closure below 1.2265 is achieved. Trade recommendations : Conservative traders should be waiting either for more bullish advancement towards the price zone of 1.2520 - 1.2600 looking for signs of bearish rejection or early bearish closure below 1.2265 as a valid SELL signal. T/P level to be located around 1.2265 initially while S/L should remain above 1.2630. The material has been provided by InstaForex Company - www.instaforex.com |
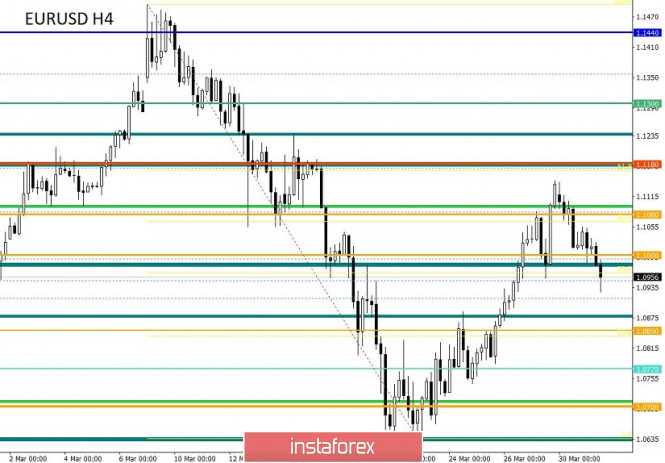
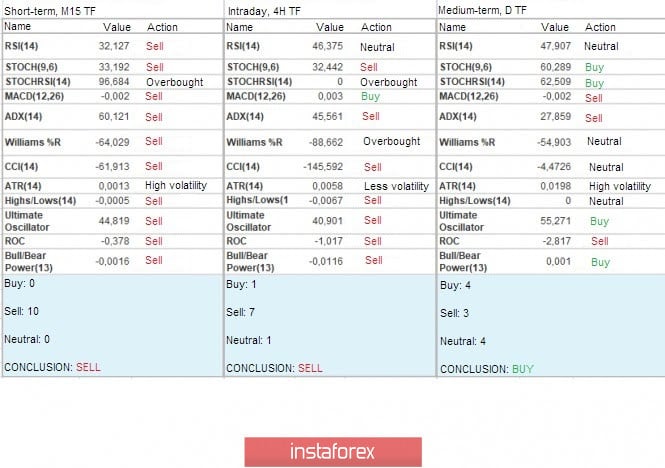
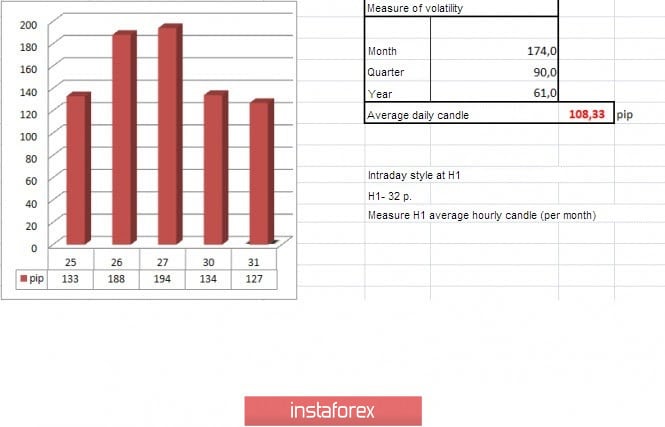
| Trading recommendations for EURUSD pair on March 31 Posted: 31 Mar 2020 05:35 AM PDT From a comprehensive analysis, we see a round of short positions that once again brought the quote within the control level. Now, about the details. The new week started with a downward move, where we can not say that there was an abnormal activity - the process was stable, the level of 1.1080 fell almost immediately, and the main level of 1.1000 was subsequently affected by the price. I assume that the upward move has come to an end since the price movement at this time has a local character due to a strong external background. Dollar positions have not disappeared. They remain with investors, and the current level may allow another overflow of assets. It turns out that the strategy of trading in local operations is still relevant for us, and it does not matter how much and how the single currency has recovered or whether the US dollar has gone deep. We look at the overall situation and price fluctuations over the past day. As you understand, this strategy is not considered long-term, but as long as there are panic and a significant external background, we have no choice, but at the same time, this is a great opportunity for large profits. In terms of volatility, we see a characteristic slowdown relative to the end of last week, but still, the indicator for Monday has a high level and exceeds the daily average by 24%. Volatility details: Monday-155 points; Tuesday-183 points; Wednesday-115 points; Thursday-278 points; Friday-166 points; Monday-151 points; Tuesday-234 points; Wednesday-243 points; Thursday-326 points; Friday-194 points; Monday-191 points; Tuesday-160 points; Wednesday-133 points; Thursday-188 points; Friday-194 points; Monday-134 points. The average daily indicator relative to the volatility dynamics is 108 points (see the volatility table at the end of the article). Analyzing the past day, we see that with the opening of trading, a downward move was set, which had a stepped character and lasted until the closing of the daily candle. As discussed in the previous review, traders considered the coordinates of 1.1050 and 1.1150 as reference points, that is, working on their breakdown, where they eventually obtained positions to sell in the profitable zone. Looking at the trading chart in general terms (the daily period), we see that from the beginning of 2020, the quote set the pace of inertial fluctuations, in the structure of which there were almost no corrections, and their very type was an integral structure. The news background of the past day included data on pending home sales in the United States, where instead of slowing to 1.7%, we saw an increase from 5.8 to 9.4%. In terms of the general information background, we see terrible anti-records of the COVID-19 virus, where the United States has already recorded more than 162,000 cases of infection, and Italy has passed the mark of 100,000, 11,600 of which are considered fatal. The panic is conquering not only the public but also the markets where Goldman Sachs analysts predict that global GDP will drop by 1% this year, more than a year after the global crisis of 2008. At the same time, the economic agency Prometeia published its assessment: the global economy will fall by 1.6%, the EU economy by 5.1% and international trade by 9.4%. Against this background, a member of the Board of Governors of the European Central Bank, Ignazio Visco, said that the regulator is ready to consider all possible options within its mandate to support the economy in the context of the coronavirus crisis. He also noted that the ECB is ready to increase the volume of asset purchases, change its composition and explore all possible options to support the economy in times of acute difficulties. In other words, we are talking about removing restrictions on the number of bonds that can be bought from any of the countries of the eurozone. Today, in terms of the economic calendar, we had data on inflation in the eurozone, where we recorded a slowdown as much as 0.7% to the lowest since October last year. This level of inflation once again indicates that there is a risk of reducing the ECB refinancing rate and it should not be excluded from the analysis. Against this background, the dollar moved to strengthen. Further development Analyzing the current trading chart, we see that after a slight stop within the level of 1.1000, the quote resumed its downward course, just on the basis of data on inflation in the eurozone. Now we have already passed the mark of 1.0950, and this indicates that the overflow of assets into dollars has a more significant scale. In fact, the tactics of following in local positions have already proven themselves, as in this course, it is not excluded that the downward movement will continue, despite the fact that there was a significant upward move to the left. This is the very principle of panic, where trends do not matter much, and fluctuations occur at the slightest change in mood and are local in nature. Detailing every minute of the available period, we see that the first conversion to dollars occurred during the Asian session, where there were sharp jumps in favor of the US dollar in the interval of 3:50-3:55. The subsequent fluctuation was expressed in a standstill along with the level of 1.1000, but at the start of the European session, the downward movement resumed. In turn, traders have already received income from short positions, making partial and full fixes at the level of 1.0950. We can assume that the downward move will still be able to manifest itself, but first, we need to fix below the level of 1.0900, where if confirmed, we will go to the side of 1.0850-1.0775. Based on the above information, we will output trading recommendations: - Buy positions are considered in the case of fixing higher than 1.0970, with the prospect of 1.1000 - Positions for sale are considered in terms of continuing the course, in the direction of 1.0900. If we do not have any deals, it makes sense to wait for the price to be fixed below 1.0900. Indicator analysis Analyzing different sectors of timeframes (TF), we see that due to the downward movement, the indicators of technical instruments in the minute and hour periods have moved to a sell signal. While the daily sections retain a buy signal due to an earlier upward move. Volatility for the week / Measurement of volatility: Month; Quarter; Year. Volatility measurement reflects the average daily fluctuation from the calculation for the Month / Quarter / Year. (March 31 was based on the time of publication of the article) The volatility of the current time is 127 points, which is already 17% higher than the daily average. It is likely to assume that there is still a chance of further acceleration, but everything will depend on how actively speculators continue to inject. Key levels Resistance zones: 1.1000***; 1.1080**; 1.1180; 1.1300; 1.1440; 1.1550; 1.1650*; 1.1720**; 1.1850**; 1.2100 Support zones: 1.0850**; 1.0775*; 1.0650 (1.0636); 1.0500***; 1.0350**; 1.0000***. * Periodic level ** Range level *** Psychological level The material has been provided by InstaForex Company - www.instaforex.com |
| March 31, 2020 : EUR/USD Intraday technical analysis and trade recommendations. Posted: 31 Mar 2020 05:26 AM PDT
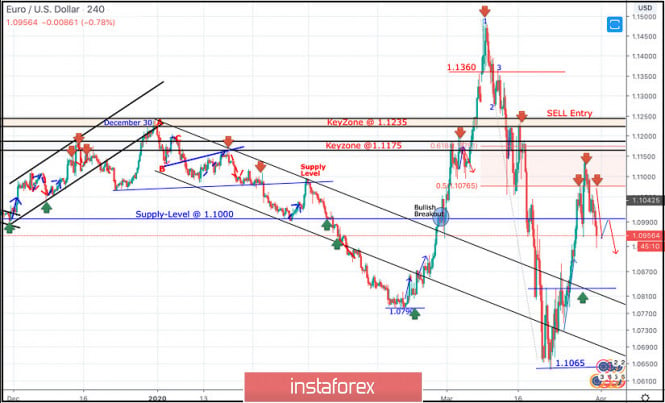
Since December 30, the EURUSD pair has trended-down within the depicted bearish channel until few weeks ago, when a new low around 1.0790 was recently established where the EUR/USD pair looked OVERSOLD after such extensive bearish decline. On February 20, recent signs of bullish recovery were demonstrated around 1.0790 leading to the recent steep bullish movement towards 1.1000, 1.1175, 1.1360 and finally 1.1480 where a (123) bearish reversal pattern was initiated around. This turned the short-term technical outlook for the EURUSD pair into bearish when bearish persistence below the Keyzone of 1.1235 was maintained on a daily basis. Moreover, the mentioned intermediate-term bearish Head & Shoulders pattern has achieved all of its projection target levels. Earlier last week, the EURUSD pair has expressed significant bullish recovery around 1.1065 The recent bullish engulfing H4 candlesticks as well as the recently-demonstrated ascending bottoms indicated a high probability bullish pullback at least towards 1.0980 and 1.1075 (Fibonacci Level 50%). Key Supply-Levels in confluence with significant Fibonacci levels are located around 1.1075 (50% Fibonacci) and 1.1175 (61.8% Fibonacci) where bearish rejection was highly-expected. Moreover, a Head & Shoulders reversal pattern is being demonstrated around current price levels. Of which, the pattern neckline exists near the current supply level around 1.1075. Trade recommendations : Intraday traders can wait for another Intradaily bullish pullback towards the mentioned supply-level around 1.1000 and look for any bearish rejection signs as a valid SELL signal for a short-term trade. S/L to be placed above 1.1090 while Initial T/P level to be located around 1.0860. The material has been provided by InstaForex Company - www.instaforex.com |
| Trading plan for SPX500 for March 31, 2020 Posted: 31 Mar 2020 05:10 AM PDT
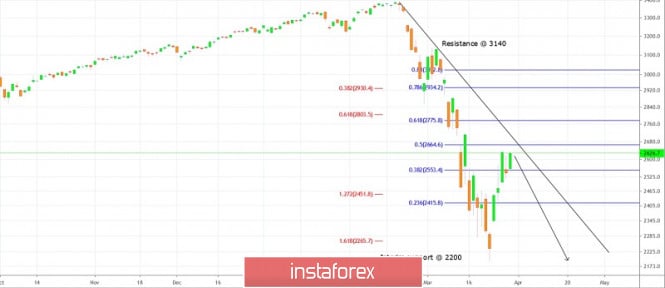
Technical outlook: SPX500 has dropped from around 3,400 levels in February 2020 to 2,200 levels in March 2020, a decline of nearly 40%, after the COVID-19 pandemic took its ugly spread in late January 2020. Still, the drop might not be over as most consider the recent rally to be the beginning of a trend. It would be mistaken to go long while we are still in the middle of a corrective rally and the trend might resume lower any time from current levels, 2,600/50. Please note that the counter trend rally has managed to retrace close to fibonacci 50% of the recent drop around 2,600/50, as most indices world wide. The down trend line has been passing through the same region as shown above and would offer enough resistance for the down trend to resume. Strong resistance is seen through 3,140 levels, while intermediary support remains at 2200 respectively. An aggressive trade setup would be to sell around current levels with risk around 2,950 and potential target below 2,000 levels. Trading plan: Sell @ 2,600/50, stop above 2,950, target below 2,000. Good luck! The material has been provided by InstaForex Company - www.instaforex.com |
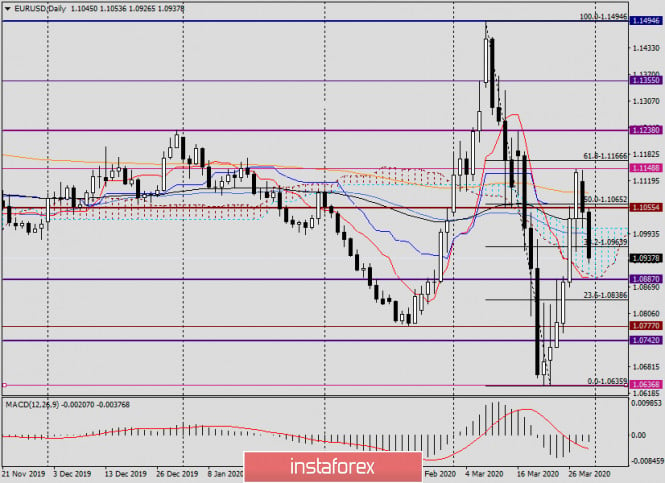
| Analysis and forecast for EUR/USD as of March 31, 2020 Posted: 31 Mar 2020 05:06 AM PDT Today's review of the main currency pair will start with the macroeconomic data that was published the day before. Naturally, the topic of COVID-19 has not disappeared and is still relevant to global financial platforms. I wish it would all end sooner, or at least go downhill. However, as most virologists assume, the peak of the coronavirus will be in April, which will begin tomorrow. Today is the last trading day for March. We will see the monthly chart tomorrow, after closing. Usually, the last day of the month is quite difficult for trading. The warring parties usually fight fiercely for the closing price of each month, resulting in sharp multidirectional movements in the market. This information is for those who are new to the market and do not yet know all the details or do not attach importance to them. In this regard, I can say that absolutely no one knows all the subtleties. Everyone makes mistakes. This is the essence of the market — some lose money, others earn it. If we go back to yesterday's statistics, the data from the eurozone came out ambiguous. The business sentiment index was worse than the forecast value. It would seem that in the current conditions of COVID-19 distribution around the world, this is not surprising. What else can be the mood in business circles when the vast majority of businesses are closed and quarantined? At the moment, the world economy is virtually paralyzed, but according to experts, the peak of the epidemic has not yet passed. But so far, in my opinion, these are only the first negative echoes of the coronavirus on statistics. This is indicated by data on economic sentiment, as well as the index of business optimism in the industry, which yesterday exceeded the forecast values and came out in the green zone. As for statistics from the US, the report on pending home sales significantly exceeded the expectations of economists. However, as some of them believe, housing began to enjoy increased demand even before the rampant pandemic in the United States. Regarding today's macroeconomic data, it is worth paying attention to the data on the German labor market, as well as the consumer price index in the euro area. From the US reports, we highlight the S&P housing price index, the Chicago purchasing managers' index, and another index on consumer confidence. In my opinion, it is the most important of today's American statistics. It's time to move on to the price charts, and let's start with the daily timeframe. Daily
The candle that appeared at the end of yesterday's trading is a reversal model of the "Harami" candle analysis. Moreover, this model is bearish, so it is not surprising that the pair is aimed at a decline today. Data on unemployment in the largest economy of the eurozone came out good, better than forecast values. Thus, the seasonally adjusted unemployment rate in Germany was 5%, although analysts' expectations were reduced to 5.1%. The change in the number of unemployed significantly exceeded expectations of 29 and in fact amounted to 1. But the consumer price index in the eurozone was worse than forecasts, even by 0.1%. It is important to understand that the CPI data for the currency block is preliminary. It's possible that the final numbers, given the COVID-19 epidemic, could be even worse. Perhaps it is the negative reports on consumer prices that have undermined the single currency today. Although technically everything is justified. The decrease is due to the development of the "Harami" reversal model. H1
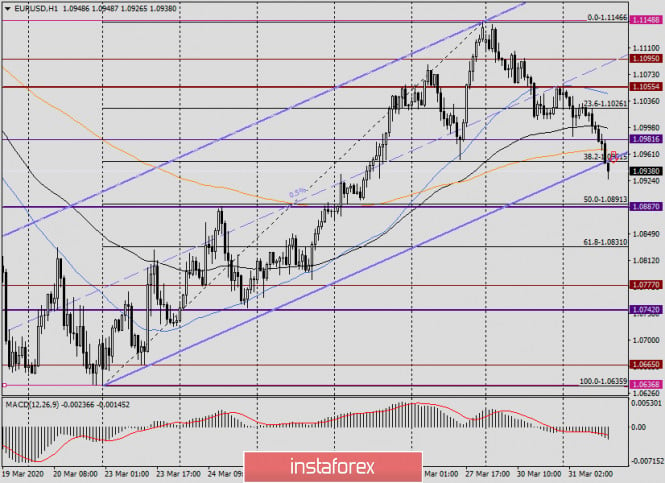
Let's go straight to the hourly chart because there are more interesting and significant events taking place there. As you can see, at the end of the review, the pair goes down from the ascending channel and breaks through its support line. However, it is too early to draw conclusions about the truth of the breakdown. In my opinion and long-term observations, the euro/dollar needs to be fixed under the lower border of the channel with three consecutive hourly candles. If this happens, the breakout with a high probability can be considered true and sell the euro/dollar on the rollback to the broken support line of the channel. This is the price zone of 1.0945-1.0970, where in addition to the lower border of the channel, there are 200 EMA and 38.2 Fibo level from the decline of 1.1146-1.0636. Along with truly broken support for the ascending channel, both the 38.2 Fibo and 200 exponential can provide serious resistance to growth attempts. At the moment, I consider sales to be the main trading idea for the EUR/USD pair. Although, if a bullish reversal candle or candles appear near 1.0890, you can try to buy, however, for now, it is better with small goals. The same applies to sales. The market situation and investor sentiment at this stage of time are subject to sharp changes. Good luck! The material has been provided by InstaForex Company - www.instaforex.com |
| Posted: 31 Mar 2020 04:58 AM PDT
Unfortunately, the main and almost the only topic for discussion now remains the "coronavirus" epidemic in the world. Scientists have recently been able to identify several patterns that can help in the fight against the virus. For example, it turned out that the mortality rate in countries where people are vaccinated against tuberculosis in childhood (Russia, Belarus, Ukraine) is much lower than in countries where they are not vaccinated (Spain, Italy). Perhaps this will somehow help in the fight against the virus, if not now, then at least in the future. In the meantime, the infection of the planet is in full swing. More than 800,000 cases and almost 39,000 deaths have been officially recorded worldwide. But the main attention of traders is focused on the United States and what is happening in this country. There are several explanations for this. At first, during the period when the dollar was actively growing against the euro and the pound, many analysts believed that the US currency is the safest during the next crisis in the eyes of traders and investors. Whether this is true or not, we will not find out now. The markets believed it, and the dollar rose. However, as it turned out a little later, when the US government and the Fed began to show signs of serious unrest due to a possible recession and depression of the economy, market participants stopped mindlessly buying the US currency, believing that the whole world would collapse, but the US economy would stand, and the dollar would preserve the value of their assets and savings. It turned out that the American economy, as one of the largest in the world, requires the same large injections and stimulus packages. It turned out that the stronger and larger the economy, the more difficult it is to keep it afloat and the lower it can potentially fall. For example, the current state of the US stock market is comparable to 2016, that is, the "pre-Trump era". The President of the United States has always taken the main credit for the country's economic growth and the growth of the stock market. However, now, in the run-up to the election in November this year, there are few trump cards in Trump's hands. After all, voters need to provide concrete achievements for 4 years of their rule. It is clear that the epidemic is a force majeure situation. But any electorate is interested in achievements, victories, not excuses and reasons why they failed to achieve their goals. Thus, the US President is beginning to get nervous about a possible defeat in the elections in November, although his political ratings have been rising recently, according to research by various agencies and periodicals. So far, Donald Trump has decided to extend the quarantine measures in America, but at the same time not to tighten them, for example, in the state of New York, which is the most affected by the epidemic and at the same time brings the largest GDP to the General Treasury of the United States. However, sooner or later, the issue of ending the quarantine will be put on the agenda again. The longer the economy stands because of the quarantine, the more it will decline. We all saw how many new applications for unemployment benefits were in the States last week. And it's only one week. What can we expect from the economy of a country that at one point lost about 3 million workers? Three million Americans lost (temporarily or permanently) jobs, stopped making profits, and stopped fueling GDP. And this is just the beginning. According to many virologists, microbiologists and epidemiologists, there is no reason to expect the end of the epidemic in a week or two. Even to expect a reduction in the growth rate of its distribution, no. However, some politicians also support doctors. For example, Vice President Mike Pence, who is leading the fight against the "coronavirus", believes that, according to some models, the pandemic may last 18 months or longer and consist of several waves. Doctors support this view and believe that the need for social distance is extremely great. However, Donald Trump and many of his supporters believe that the quarantine and its consequences will have irreversible consequences for the economy and, accordingly, will cause even more damage to Americans than the "coronavirus" outbreak itself. Thus, we are confident that in the near future the issue of ending quarantine measures will again arise in the States, and the US President will once again try to restart the economy to the detriment of the health of the American nation. But will this move harm his political future? How many Americans at risk of health will agree to voluntarily go to work? The material has been provided by InstaForex Company - www.instaforex.com |
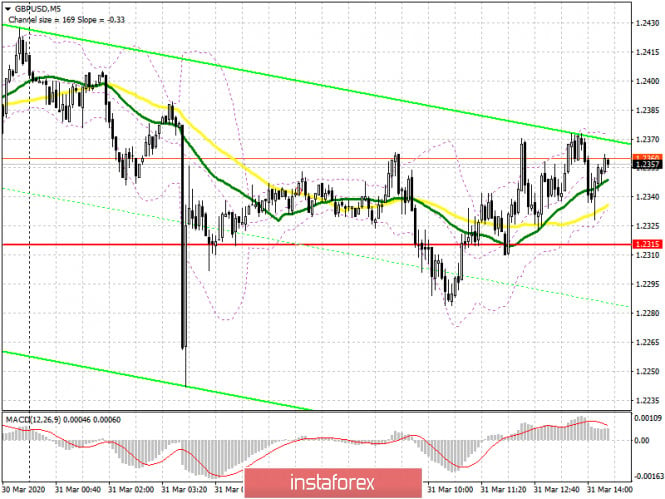
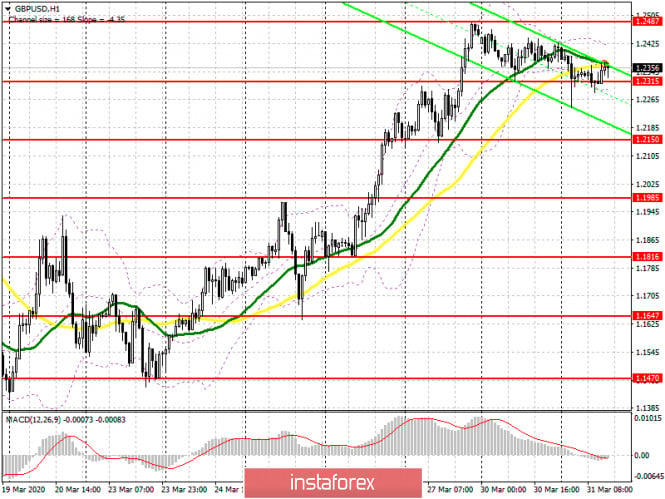
| Posted: 31 Mar 2020 04:54 AM PDT To open long positions on GBPUSD, you need: Data on UK GDP for the 4th quarter of 2019 did not lead to a significant change in the market situation as it fully coincided with the forecasts of economists. The economy did not show any growth, which further complicates the situation in the 1st quarter of this year. Bears tried to break below the support of 1.2315, which is clearly visible on the 5-minute chart, but support from major players, as it was in the Asian session, was not received again, which only strengthened the position of buyers. At the moment, while trading is conducted above the area of 1.2315, we can expect continued growth of GBP/USD in the resistance area of 1.2487, the breakout of which will provide a direct path to the highs of 1.2605 and 1.2686, where I recommend fixing the profits. In the scenario of a correction of the pound to the level of 1.2315, you do not need to rush to open long positions. It is best to wait for the support test of 1.2150 or buy immediately for a rebound from the minimum of 1.1985.
To open short positions on GBPUSD, you need: Sellers of the pound need to try to return the market under their control and to do this, it is necessary to consolidate below the support of 1.2315. The second attempt to do this at the European session was again unsuccessful. The 5-minute chart clearly shows how the bulls managed to form a false breakout at this level, which I paid attention to in my morning forecast. Only a break in the area of 1.2315 will lead to a larger sale of GBP/USD to the area of the lows of 1.2150 and 1.1985, where I recommend fixing the profits. The support test of 1.1985 will also indicate the resumption of the bear market. In the scenario of an attempt by the bulls to regain the upward trend, only the formation of a false breakout in the resistance area of 1.2487 will act as the first signal to open short positions. Otherwise, it is best to sell the pound on a rebound from the highs of 1.2605 and 1.2686.
Signals of indicators: Moving averages Trading is conducted in the area of 30 and 50 daily averages, which indicates the uncertainty of the market with further direction but retains the advantage on the side of buyers. Note: The period and prices of moving averages are considered by the author on the hourly chart H1 and differ from the general definition of the classic daily moving averages on the daily chart D1. Bollinger Bands A break in the lower border of the indicator around 1.2300 will increase the pressure on the pound and lead to its larger decline. Growth may be limited by the upper level of the indicator around 1.2415. Description of indicators
|
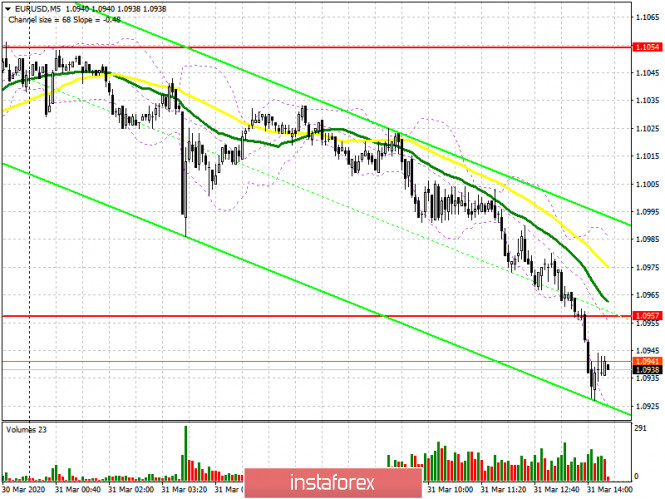
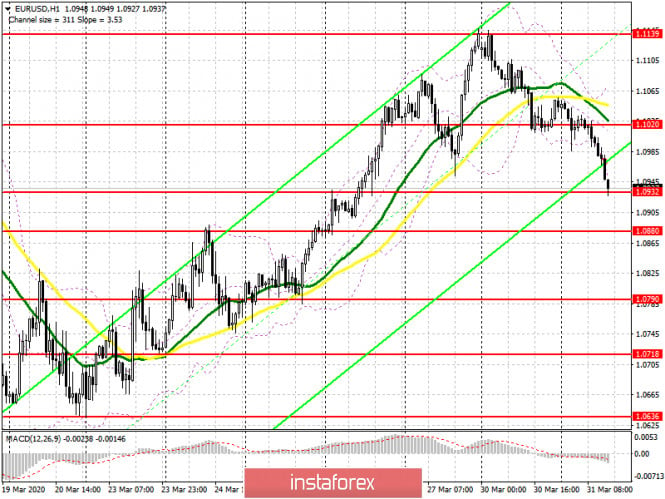
| Posted: 31 Mar 2020 04:52 AM PDT To open long positions on EURUSD, you need: The 5-minute chart clearly shows how the bears did not experience any problems at the level of 1.0957, and easily broke through it from the second time, taking advantage of a weak report on the growth of eurozone inflation, which was even worse than the forecasts of economists. Although the data on the German labor market managed to please traders, euro buyers did not take them seriously. At the moment, the next support level is located in the area of 1.0932, but you can only count on this level seriously if a false breakout is formed there in the second half of the day. However, it is best to postpone purchases until the test of the larger lows of 1.0880 and 1.0790. An important task for euro buyers is also to return to the resistance level of 1.1020, just above which the moving averages pass. Fixing above this range will quickly return the euro to weekly highs. However, it is unlikely to be possible to count on such a quick comeback, given the statistics that await us this week.
To open short positions on EURUSD, you need: Sellers coped with the task of reducing the pair to the support of 1.1054 and managed to easily break through it, which indicates that there are no buyers at this level. Apparently, the support has shifted slightly lower, to the area of 1.0932, where you can watch a surge in volume and the first profit-taking on short positions. An important task for the bears will be to consolidate below this range, which will only increase pressure on the pair and lead to an update of the lows of 1.0880 and 1.0790. The support test of 1.0880 will be a turning point in the upward trend that has been observed since the 20th of March. In the scenario of EUR/USD growth in the second half of the day after weak reports on the US economy, it is best to consider short positions after updating the resistance of 1.1020 or sell immediately on a rebound from the larger maximum of 1.139.
Signals of indicators: Moving averages The 30-day average crossed the 50-day average from top to bottom, which indicates the formation of a bearish trend in the short term. Note: The period and prices of moving averages are considered by the author on the hourly chart H1 and differ from the general definition of the classic daily moving averages on the daily chart D1. Bollinger Bands In the case of an upward correction in the second half of the day, the average border in the area of 1.1020 and the upper border of the indicator in the area of 1.1065 will act as a resistance. Description of indicators
|
| Posted: 31 Mar 2020 04:49 AM PDT BTC news:
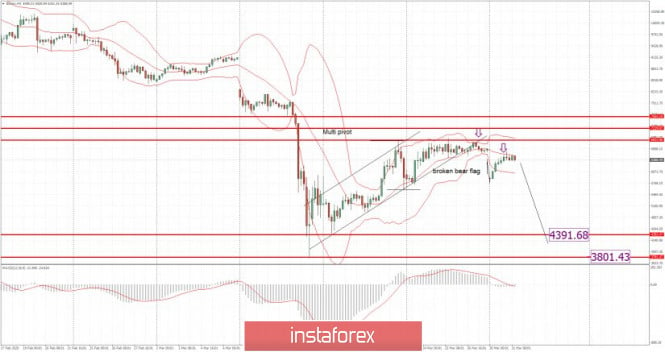
Egypt Limits Cash Withdrawals On Sunday, Egypt's central bank instructed all banks to limit daily withdrawals. According to the decree, the daily limit for individuals will be 10,000 Egyptian pounds ($640) and 50,000 pounds for companies. [The National] There will be exemptions for companies if the money is being used to pay employees.ATMs in the entire country will also be limited. Going forward, users can only withdraw and deposit 5,000 Egyptian pounds ($316) at ATMs. All bank fees will also be canceled in the country. Thus far, Egypt has around 576 corona-virus infections and 36 deaths. The closures in the country currently in place will be extended "indefinitely."Technical analysis: BTC has been trading sideways at the price of $6.370. My bearish analysis from yesterday is still active In the background,here is the gap down tought the bearish flag pattern, which is strong sign of the sellers. My advice is still to watch for selling opportunities. The level at the $6.367 looks like a great sell zone... Downward targets are set at the price of $4.390 and $3.800. MACD oscillator is showing decreasing momentum and the slow line turned to the downside, which is another confirmation for our bearish bias. Resistance levels are set at the price of $7.000 and $7.500 Support levels and downward targets are set at the price of $4.390 and $3.800 The material has been provided by InstaForex Company - www.instaforex.com |
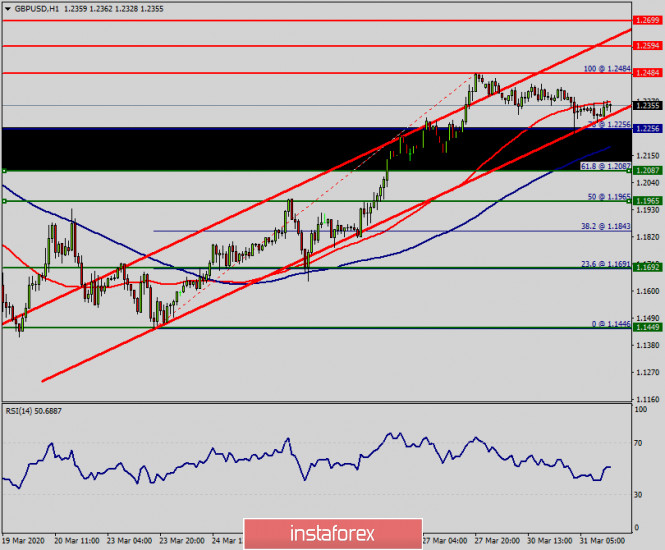
| Technical analysis of GBP/USD for March 31, 2020 Posted: 31 Mar 2020 04:41 AM PDT Overview: The GBP/USD pair vs Coronavirus (COVID-19. The GBP/USD pair started recovering until it reaches the top point of 1.2484. Amid the previous events, the price is still moving between the levels of 1.2256 and 1.2484. Resistance and support are seen at the levels of 1.2484 (also, the double top is already set at the point of 1.2484) and 1.2256 respectively. Therefore, it is recommended to be cautious while placing orders in this area. So, we need to wait until the sideways channel has completed. The current price is seen at 1.2338 which represents a key level today. The level of 1.2484 will act as the first resistance today. Hence, if the pair fails to pass through the level of 1.2484, the market will indicate a bearish opportunity below the strong resistance level of 1.2484. Sell deals are recommended below the level of 1.2484 with the first target at 1.2256. The level of 1.2256 represents the daily pivot point. If the trend breaks the support level of 1.2256, the pair is likely to move downwards continuing the development of a bearish trend to the level 1.2087. Comment: - The weekly pivot is seen at the level of 1.2256. - The market is still in a downtrend. We still prefer the bearish scenario in long term. - Stop loss should be placed above the last bullish wave around the spot of 1.2500. The material has been provided by InstaForex Company - www.instaforex.com |
| Posted: 31 Mar 2020 04:40 AM PDT Corona virus news:
US cases almost double China's as deaths top 3,000 The US has suffered its deadliest day so far during the coronavirus pandemic, with the death toll passing 3,000 and the number of confirmed cases almost double those in China, where the disease first emerged. New York is the centre of the country's outbreak, but governor Andrew Cuomo warned on Monday that his state's experience was only a harbinger of what was to come across the US. "There is no American that is immune," he said. Cruise ships. The US Navy hospital ship Comfort was welcomed in New York on Monday. But in Florida, governor Ron DeSantis has refused to admit two Covid-19-stricken cruise ships, carrying hundreds of vulnerable elderly passengers. Liberty University. One student has tested positive for the virus and almost a dozen are exhibiting symptoms after Jerry Falwell Jr, the president of Virginia's Christian, conservative Liberty University, defied the lockdown to reopen its campus.Technical analysis: Gold has been trading downwards. The price tested the level of $1.595. The level of $1.588 will be very important pivot level for the further development on the Gold.My recommendation will be to carefully watch the price action around $1.588. Eventual downside breakout of the $1.588 may confirm test of $1.565, $1.547 or even $1.454 The rejection of the area around $1.588 may confirm further upside continuation and eventual test of $1.642. Stochastic oscillator is showing negative bias with no fresh new bull cross. Resistance level is set at $1.642. Support levels are set at the price $1.565, $1.547 and $1.454 The material has been provided by InstaForex Company - www.instaforex.com |
| Posted: 31 Mar 2020 04:38 AM PDT
Unlike previous crises, the current is more like a hurricane that covers a certain territory and causes serious damage to its economy. Coronavirus has already hit globally, and the longer the pandemic lasts, the higher the chances that temporary difficulties can turn into long-running problems. The movement of the main currency pair in the last month can be compared with aerobatics, as the EUR / USD volatility remains very high. Amid falling US stock market, the euro rose against the US dollar from a minimum of $ 1.0784 to a maximum slightly below $ 1.15 in less than two weeks. Then the main currency pair passed the point of the local peak and fell sharply in the following days. In less than half a month, the euro lost all profits, dropping to a two-year low below $ 1.07 due to an increase in the number of coronavirus cases in Europe. However, a week ago the EUR / USD pair pushed off the bottom, eventually returning to the level of 1.11 amid the outbreak in America. On Monday, the pair broke off a six-day growth strip and went into the red zone. Technically, the inability of EUR / USD to gain a foothold over the 200-day moving average suggests that the recent rebound from multi-year lows has already lost momentum. However, before betting on the resumption of the previous bearish trend, it is worth waiting for a clean breakdown of the 1.0965 mark. In this case, the pair may accelerate in the direction of 1.0900 and further to 1.0840. The nearest resistance is located at 1.1065, then at 1.1095 and 1.1100. A pure breakdown of these levels can target the bulls to the area of 1.1145–1.11150, and its breakthrough will clear the way for the short-term growth of the pair. From here, the pair can head for 1.1200 and an important resistance at 1.1225. As for the long-term prospects, the dynamics of EUR / USD will depend on which region the pandemic will decline first, as well as on the degree of damage to the economy.
The European Commission predicts a decline in the European economy in 2020 at 1%, however, according to informed sources, it is also studying a pessimistic scenario, which provides for a decline of 2.5% of GDP and a strong surge in unemployment. At the same time, the same sources admit that even in the conditions of uncertainty regarding the terms of quarantine cancellation, even this scenario is no longer considered the most pessimistic one. The EC admits that the slowdown in the region's economy, triggered by the coronavirus pandemic, may be more severe than during the 2009 recession. "The economic consequences of coronavirus are no longer indirect (the effects of disrupted international supply chains) and now hit directly the economies of the European region, causing the suspension of various types of economic activity," the EC noted. Although, until the United States completely defeats the pandemic, possibly even before the moon, the US stock market begins to act as if the hurricane were a thing of the past. Investors believe that the recession in the US will be deep, but not for long. But what if this is not so? If events begin to develop along the lines of 2008, then the country's economy may take years to recover. According to former Chairman of the Federal Reserve Janet Yellen, excessive support for the US corporate sector is a mistake: local companies are already loaned and can use cheap money to buy back their own shares or pay dividends. As a result, the risks of defaults will increase, which will increase the time frame for the recovery of the national economy. The material has been provided by InstaForex Company - www.instaforex.com |
| Trading plan for Dow Jones for March 31, 2020 Posted: 31 Mar 2020 04:35 AM PDT
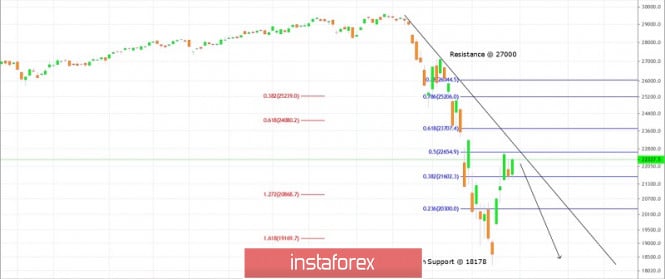
Technical outlook: Since the COVID-19 pandemic started spreading aggressively in January 2020, most World Indices has given in up to 40% from their respective highs. The US Stock indices Dow Jones, SPX500 and NASDAQ has been declining since mid February 2020. The above chart shows Dow Jones decline since 29600 highs from February 13, 2020 on wards. The indice has made lows around the 18200 levels on March 23, 2020 before producing the counter trend rally that was much awaited. It is too early to consider that the recent rally could exceed any further or push towards new highs. Rather the rally should be taken as an opportunity to initiate fresh short positions as most indices prepare to drop towards fresh lows. Also note that Dow Jones is facing resistance around the fibonacci 50% retracement of recent drop between 27,000 and 18,200 respectively. Furthermore, the declining resistance trend line resistance is also seen to be passing nearby (22,700 levels). Higher probability remains towards the downside from current levels and push below 18000 respectively. Immediate price resistance is seen towards 27,000 levels while interim support is seen towards the 18,200. Trading plan: Remain short @ 22,300/600, Stop @ 24,800, target below 18,000. Good luck! The material has been provided by InstaForex Company - www.instaforex.com |
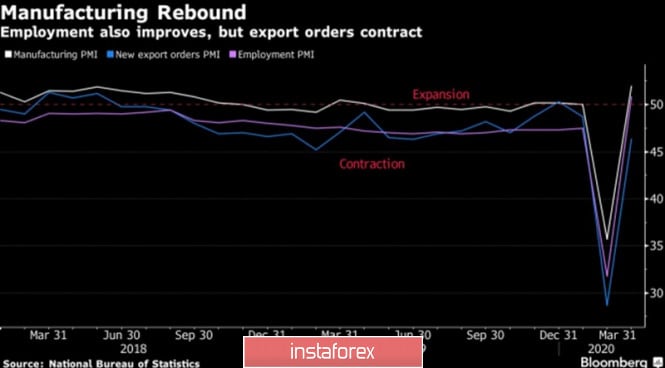
| Posted: 31 Mar 2020 04:29 AM PDT In theory, falling prices to multi-year lows should stimulate demand and increase the value of the asset, but if consumers are sitting at home because of the coronavirus and can not afford to increase consumption, then you can not dream of an increase in prices. The collapse of Brent and WTI to the 18-year bottom on the background of a huge reduction in global demand and the oil war between Saudi Arabia and Russia does not guarantee a quick rebound up. However, in the near future, the "bulls" may have new trump cards. The Texas variety marked the worst month and quarter in the history of accounting, and the collapse in prices to the lowest level since 2002 was facilitated by the statement of Donald Trump on the extension of strict measures of social isolation until the end of April. Because of the coronavirus, global demand has declined by about a quarter. The loss of 25 million b/d is equivalent to current OPEC oil production or the combined consumption of black gold by the United States and Canada. At the same time, the oil war between Saudi Arabia and Russia contributes to the fall in prices. Riyadh intends to increase production by 2.5 million b/d and export to 10.6 million b/d. Many black gold producing countries cannot afford such low prices and are forced to cut budget expenditures even at the expense of the fight against coronavirus. The projected global market surplus of 25 million b/d and WTI at $20 per barrel increases the risks of the bankruptcy of small and medium-sized companies in the United States. Large companies are forced to reduce investment in exploration and production, which will contribute to a gradual decline in American black gold production. It is not for nothing that Donald Trump is trying to establish contacts with Saudi Arabia and Russia. Washington's recent statement on the dialogue between the White House and the Kremlin on the stabilization of the situation in the oil market was one of the drivers of Brent and WTI growth at the auction on March 31. The second good news for the "bulls" came from China, where business activity in the manufacturing sector rose above the mark of 50, indicating recovery, and the people's bank once again eased monetary policy. Standing on the threshold of victory over the coronavirus, the Middle Kingdom can seriously change the rules of the game. It is the largest consumer of black gold in the world, and the recovery of the local economy will contribute to the growth of Brent and WTI. Dynamics of business activity in China
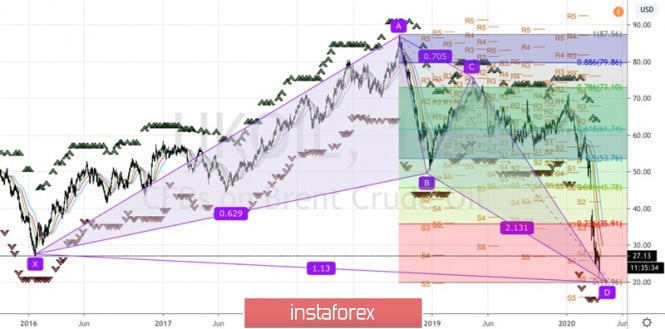
Let's not forget that the global surplus of 25 million b/d reveals another problem – the lack of storage capacity. Markit expects that due to lack of demand and infrastructure difficulties, global production will decrease by 10 million b/d. Thus, a possible truce between Russia and Saudi Arabia with the assistance of the United States, an increase in oil consumption in China and a reduction in global production due to infrastructure problems create the ground for a rebound in Brent quotes, which is confirmed by the technical picture. The quotes are in close proximity to the 113% target for the "Bat" pattern, which increases the risks of a pullback to 23.6%, 38.2% and 50% of the last downward wave. The reason for opening long positions may be a break in the resistance at $28 and $31.7 per barrel. Brent, the daily chart
|
| Posted: 31 Mar 2020 04:25 AM PDT Corona virus summary:
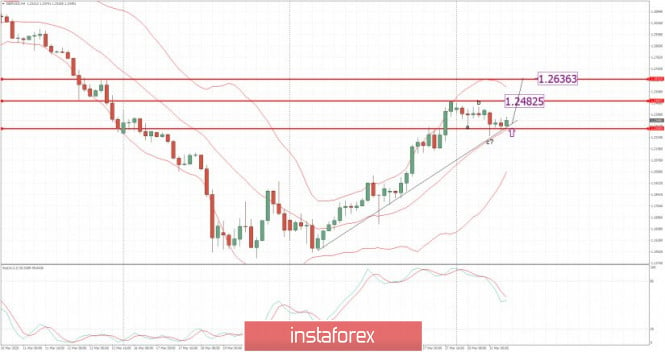
Spain reports record single-day death tollSpain has recorded a record new single-day coronavirus death toll after 849 people died from the virus between Monday and Tuesday. The country's total number of cases now stands at 94,417 – up from 85,195 on Monday – and its death toll at 8,189. Russia records biggest daily increase for seventh day runningThe number of coronavirus cases in Russia jumped to 2,337 on Tuesday, an increase of 500, as the country recorded its biggest daily rise for the seventh day in a row. In Russia, 18 people who contracted the coronavirus have died, while 121 people have recovered. Technical analysis: GBP has been trading sideways at the price of 1.2346. I found that there is potential completion of the downward correction (ABC), which is sign that we might see another uward swing towards the levels at 1.2482 and 1.2636. Stochastic oscillator is showing potential bull cross near the 50 level, which is good confirmation for our long bias... Resistance levels are set at the price of 1.2482 and 1.2636. Support levels are set at the price of 1.2292 and 1.2240 Watch for buying opportunities with the targets at 1.2482 and 1.2636 The material has been provided by InstaForex Company - www.instaforex.com |
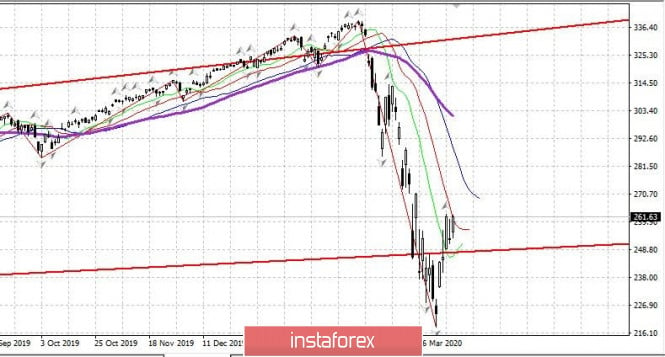
| Evening review 03/31/2020. Investor question: Stocks significantly fell. When and how to buy? Posted: 31 Mar 2020 03:59 AM PDT Above is a chart of the main US stock index - S&P 500. As you can see, current prices are approximately 25% lower than January highs. Stocks fell significantly - in the US and Europe. Investors who were quite competent before - and left the stock before the fall or at the beginning, as well as novice investors ask a reasonable question - Buy? When to buy? How to buy? Answers: 1. I expect a new wave of falling markets - when negativity is inevitable due to coronavirus and because of the forced stoppage of many businesses during quarantine in Europe and the US - when this negativity comes to the surface in the form of economic data - GDP decline, unemployment growth. Thus, conservatively, you can not buy anything until the S&P 500 index returns to the last lows that we see on the chart. You can buy more aggressively now - but a little, no more than 30-35% percent of your account. 2. Furthermore, if you fall by at least 25-30% of the current levels (not earlier!) - you can buy another 30% of the account - and the rest - when it falls very low. 3. If it doesn't fall very low - and strong growth begins - then it will be possible to buy more on growth - but only when the economy shows clear signals of recovery (the economy, not the markets!), The GDP goes up, and employment starts to grow. Then we will buy more. But this is not soon - no earlier than the end of 2020, I think. Good luck to all. Observe the quarantine. Do not be ill. The material has been provided by InstaForex Company - www.instaforex.com |
| You are subscribed to email updates from Forex analysis review. To stop receiving these emails, you may unsubscribe now. | Email delivery powered by Google |
| Google, 1600 Amphitheatre Parkway, Mountain View, CA 94043, United States | |





No comments:
Post a Comment