Forex analysis review |
- Overview of the GBP/USD pair. April 15. Donald Trump: OPEC+ members can reduce oil production by 20 million barrels per day.
- Overview of the EUR/USD pair. April 15. ECB Vice-President Luis de Guindos: the economic recovery will start in 2021, another
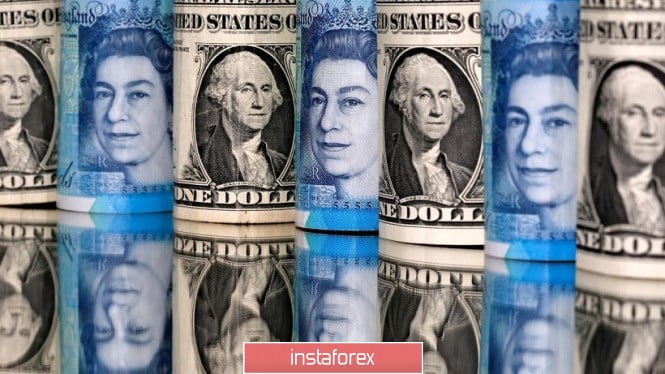
- GBP/USD. Coronavirus weakens grip: pound rises amid weakening dollar
- EUR/USD and GBP/USD. Results of April 14. Donald Trump is going to jeopardize the nation's health and quarantine to win the
- Oil falls again: Optimism from OPEC+ agreement has faded
- Comprehensive analysis of movement options for #USDX vs Gold and Silver (H4) on April 15, 2020
- USDCAD below key support of 1.3920 forming a bullish wedge
- Ichimoku cloud indicator provides another bullish sign for EURUSD in 4 hour chart
- April 14, 2020 : EUR/USD Intraday technical analysis and trade recommendations.
- COVID-19 in the US and Europe
- Trading recommendations for GBP/USD on April 14, 2020
- BTC analysis for 04.14.2020 - Potential drop on BTC is coming, the main objective is set at the price of $3.810
- Analysis for Gold 04.14.2020 - New momentum high and big demand for the Gold, I see further upside continuation on the Gold
- April 14, 2020 : GBP/USD Intraday technical analysis and trade recommendations.
- GBP/USD analysis for 04.14.2020 - Strong upside pressure and upward trend on the GBP/USD. Potential test of 1.2630
- Oil looks for traps and pitfalls
- GBP/USD: plan for the US session on April 14. Fewer people are willing to buy the pound at current highs. Bears expect to
- EUR/USD: plan for the US session on April 14. The euro remains in the side channel, and volatility continues to decline.
- Technical analysis of EUR/USD for April 14, 2020
- Technical analysis of EUR/USD for April 14, 2020
- EUR / USD: positive news for euro
- USDCAD holding below descending trendline resistance. Further drop expected!
- Market review. Trading ideas. Answers for questions
- EUR/USD: Euro rose. COVID-19 retreats from US
- Trading recommendations for EUR/USD pair on April 14
| Posted: 14 Apr 2020 05:05 PM PDT 4-hour timeframe
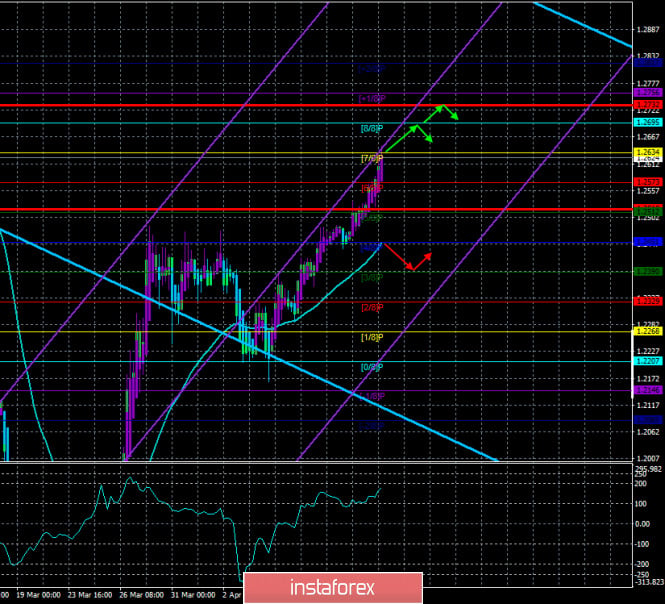
Technical details: Higher linear regression channel: direction - downward. Lower linear regression channel: direction - upward. Moving average (20; smoothed) - upward. CCI: 116.3347 The British pound continues its upward movement from the very beginning of the week. At the moment, the Murray level of "6/8"-1.2573 has been overcome and "7/8"-1.2634 has been worked out, and there is not a single sign of the beginning of a corrective movement. Market participants continue to buy the British pound even though there are no fundamental reasons for this now, and the panic can be considered a thing of the past. However, the pair continues to recover from the shocks that have been observed in the past month and a half. Thus, we may still be witnessing movements that are not fundamentally justified for some time. In the UK, no macroeconomic publications are scheduled for tomorrow. Thus, all traders' attention will be focused on macroeconomic statistics from overseas. As in the case of the euro currency, traders of the British pound do not react too strongly to the macroeconomic background now. To be more precise, they don't react at all. For example, yesterday, the pound dollar pair "plowed" more than 100 points up, without having any reason to do so. Of course, any event that occurred yesterday can be "linked" to this growth of the pair, "concluding" that because of it, the demand for risky assets has increased. However, we believe that if traders do not react to the actions of Central Banks, the US government, do not respond to the scale of the "coronavirus" pandemic, to specific macroeconomic reports, it is unlikely that they are closely watching, for example, the oil market or the OPEC meeting, so that they will rush to buy a riskier pound. Thus, almost the entire fundamental background is now interesting and noteworthy, but no more. It does not help in predicting the movement of the currency pair in any way. Returning to the OPEC+ meeting, we have already said that the world's largest oil producers managed to reach an agreement to reduce oil production by almost 10 million barrels per day in total. Black gold quotes did not react to these very optimistic results of the meeting. And even began to decline again. However, it should be noted that the agreement will enter into force only on May 1. In other words, it will take only three weeks to start reducing production, reducing supply on the oil market, and, accordingly, only three weeks to expect an increase in oil prices. Market participants, however, can also specifically lower the price of oil to buy it at the best possible price. We are talking primarily about speculators who do not use purchased oil futures but only resell them. Thus, until the end of April, there may even be a drop in quotes, but after May 1, there is a 90% probability that growth will begin. A currency like the Russian ruble has even started to grow in advance. And US President Donald Trump said that OPEC+ wants to achieve a double reduction in oil production, that is, up to 20 million barrels per day. The US President, as always, announced this via Twitter: "OPEC+ intends to reduce production by 20 million barrels per day, and not by 10 million, which is now reported." The American leader also thanked Russia and Saudi Arabia for their cooperation, saying that now the energy industry will recover much faster than previously expected. Meanwhile, the UK quarantine is being extended until May 7. This was stated by Foreign Minister Dominic Raab on April 14. Soon, Raab will hold talks with the Ministers of Northern Ireland, Wales, and Scotland and agree on all the details. Earlier, Dominic Raab said that the quarantine measures are bringing results and there are the first signs that the spread of the "coronavirus" in the country is being suspended. The government's actions are supported by the population of Great Britain. 74% of respondents believe that defeating the epidemic is now more important than restarting the economy. And according to calculations by the Center for Economic and Business Research in Britain, each day of quarantine costs the economy about 2.4 billion pounds. But, as in the case of the euro currency, traders now do not pay attention to such calculations. They do not pay attention to the number of infected people in the United States or the UK but continue to trade on pure "technology". And the technical picture is now quite simple. We have at our disposal an almost recoilless upward trend, which is eloquently signaled by the lower channel of linear regression. Only the highest channel of linear regression is directed downward from all trend indicators. The Heiken Ashi indicator, as the fastest, shows the direction of the intraday movement. And it does not differ from the global direction. The volatility of the pound/dollar pair is starting to grow again, but it does not differ much from the average indicators. As in the case of the euro currency, we believe that the British pound can return to the levels where a month and a half ago, the pair began to grow quite strongly, and then a collapse of 1,700 points. Thus, our target level is 1.2800. It was at this level that the pair was located on March 2-3. When this level is reached, which at the same time will equal approximately 76% of the correction from the last fall, the "correction against correction" may begin, in turn, and the pound may begin to fall with goals in the area of 1.19-1.20. As we see, the pair's potential for the coming weeks remains quite strong, and the macroeconomic background does not prevent market participants from trading, according to technical factors.
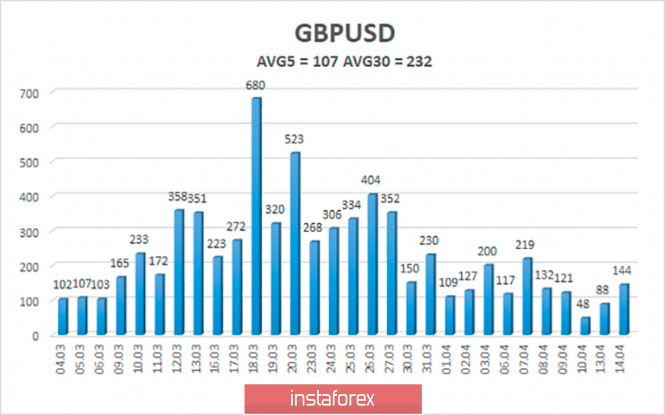
The average volatility of the pound/dollar pair continues to decline and currently stands at 107 points. Just like the euro/dollar pair, the pound is approaching levels of volatility characterized as "average" in strength. The activity of traders continues to fall and this can not but please. On Wednesday, April 15, we expect movement within the channel, limited by the levels of 1.2518 and 1.2732. The reversal of the Heiken Ashi indicator downwards signals a downward correction. Nearest support levels: S1 - 1.2573 S2 - 1.2512 S3 - 1.2451 Nearest resistance levels: R1 - 1.2634 R2 - 1.2695 R3 - 1.2756 Trading recommendations: The pound/dollar pair continues to trade with an upward bias on the 4-hour timeframe. Thus, it is now recommended to stay in the purchases of the pound with the goals of 1.2695 and 1.2732 until the reversal of the Heiken Ashi indicator down. It is recommended to open sell positions no earlier than when the bears overcome the moving average with the first goal at 1.2390, which is not expected soon since the price is now too far from the moving average. The material has been provided by InstaForex Company - www.instaforex.com |
| Posted: 14 Apr 2020 05:04 PM PDT 4-hour timeframe
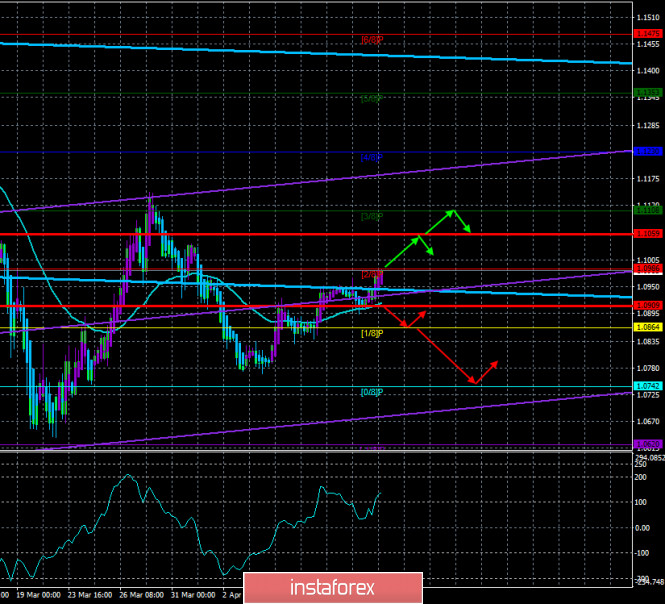
Technical details: Higher linear regression channel: direction - sideways. Lower linear regression channel: direction - upward. Moving average (20; smoothed) - upward. CCI: 135.6467 The EUR/USD currency pair starts the third trading day of the week with the continuation of the upward movement and testing the Murray level of "2/8"-1.0986. No important macroeconomic statistics were published the day before, and in principle, there were few important news. Thus, traders continue to trade the pair, relying mainly on the technical picture. Markets continue to calm down, which is reflected in the volatility indicator. Now the main thing is not to have any new outbursts of emotions and waves of panic. Then the trading mode will return to its usual course. Several macroeconomic publications are scheduled for Wednesday, April 15. All in the United States. We are talking about reports on retail sales for March, as well as derivatives of this indicator, as well as industrial production for the same period. We believe that these reports will be interesting in any case, but the reaction of market participants to them again is unlikely to follow. In these conditions, reports like inflation, retail sales, and industrial production have almost zero value for currency traders. However, it will be possible to draw certain conclusions about the real contraction of the US economy, and traders may still work out these data since volatility has decreased significantly in recent weeks and traders may already need certain impulses to move the pair. As for the conclusions about the state of the American economy, we already clearly understand the state of the labor market and the unemployment rate in the United States. Now it remains to deal with consumer spending during the epidemic, crisis, and quarantine. According to experts' forecasts, retail sales in monthly terms may decrease by 6.5-8.0%. This is a huge loss. Changes are usually plus or minus 1%. Retail sales excluding cars could lose between 3.0% and 4.8%. Industrial production is expected to fall from 3.8% to 4.0% monthly. Again, we would like to note that these are only forecast values. Recall that the forecasts for applications for unemployment benefits, NonFarm Payrolls, and inflation in the US were also much better than the actual values. Thus, today's reports may be much worse than the traders' expectations. Given such severe cuts in the country's economy, it is not surprising that Donald Trump wants to restart it as soon as possible. The problem, as we have already said, is the danger of the second wave of pandemics, new infections, new deaths. After all, sick people can't work. Thus, the removal of quarantine measures may lead to a spike in the incidence of diseases and an even greater drop in the country's macroeconomic indicators. However, while no concrete decisions have been made yet, it doesn't make much sense to talk about what might happen. Donald Trump himself believes that the epidemic has already been localized and slowed down. During a regular press conference at the White House, the head of state said: "Over the weekend, the number of new infections registered per day decreased throughout the country." Thus, Trump believes that the strategy of fighting the "coronavirus" works, and the Americans followed all the rules of quarantine. The US leader also thanked the medical staff and noted that "the situation is developing better now than previously imagined." In Italy and Spain, there is also a slowdown in the spread of "coronavirus" infection. Health Minister Salvador Illa made an official statement that the "peak" of the pandemic has passed and the number of new infections is decreasing. Approximately the same situation is observed in Italy. Since April 14, the country has partially lifted quarantine measures, allowing the operation of stationery stores, children's clothing, bookshops, and laundries. There was also a list of production operations that are out of the ban on work. At the same time, all retail outlets must comply with the rules of distancing and disinfection. At the same time, as the "coronavirus" slowly begins to loosen its grip on Europe, calculations begin to show how much the EU economy will decline, as well as when it can be expected to recover. Vice-President of the European Central Bank, Luis de Guindos, believes that Europe may experience a stronger economic downturn than the rest of the world. According to de Guindos, the French economy will decline only in the first quarter by 6%, Germany - by 10%. The recovery of economic activity, according to the Vice-President of the ECB, will begin no earlier than 2021. Also, Luis de Guindos noted that additional public spending on countering the epidemic could amount to 1.5 trillion euros. However, the European currency does not react in any way to the statements of the ECB Vice-President, who predict a strong economic downturn in the Eurozone. This is because there will be a strong economic downturn in the United States as well. Thus, at the moment, we have no reason to assume that the balance of power between the euro and the US dollar has changed in any way. Thus, to draw such conclusions and make long-term forecasts, we need macroeconomic reports from both the US and the European Union, and we have not yet received most of the figures for March. Thus, only by the end of April will it be possible to make more or less accurate conclusions about the scale of economic losses in Europe and abroad. And based on these data, it will be possible to conclude which economy is waiting for more serious cuts. And based on this conclusion, it will be possible to predict the further movement of the euro/dollar pair in the coming months. At the moment, the upward movement is not too strong, as evidenced by the purple bars of the Heiken Ashi indicator. Thus, the euro currency is steadily moving towards the area of the 1.1000 level, which we called the target, based on the "correction against correction" scenario. After working out this level, we expect a decline in the European currency quotes. Both linear regression channels have turned sideways in recent days, but the lower channel has already started to turn up, indicating the formation of an upward trend.
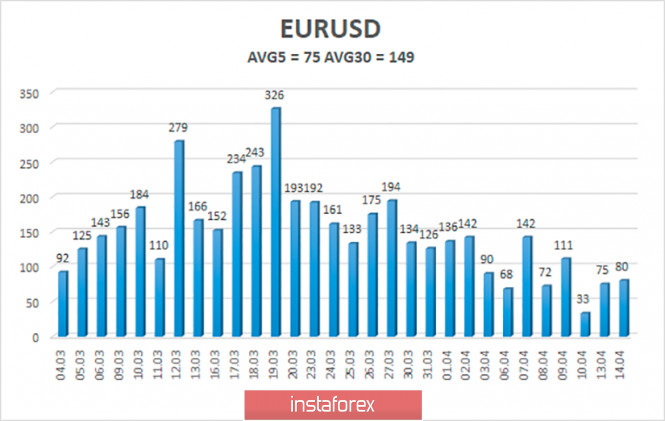
The volatility of the euro/dollar currency pair continues to decline and is already 75 points as of April 15. Thus, the markets continue to calm down and return to normal. The current value of volatility can no longer be called "strong". Today, another decrease in volatility is possible due to not very important macroeconomic statistics. We expect the price to move between the levels of 1.0909 and 1.1059 on April 15. Turning the Heiken Ashi indicator down will indicate a new round of downward correction. Nearest support levels: S1 - 1.0864 S2 - 1.0742 S3 - 1.0620 Nearest resistance levels: R1 - 1.0986 R2 - 1.1108 R3 - 1.1230 Trading recommendations: The euro/dollar pair resumed its upward movement. Thus, traders are now recommended to trade for an increase in the euro currency with the goals of the Murray level of "2/8"-1.0986 and the volatility level of 1.1059, before the reversal of the Heiken Ashi indicator down. It is recommended to sell the euro/dollar pair not before fixing the price below the moving average line with the goals of 1.0864 and 1.0742. The material has been provided by InstaForex Company - www.instaforex.com |
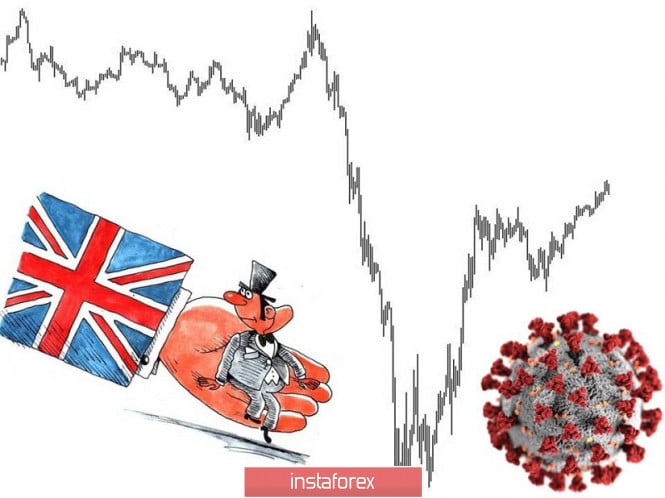
| GBP/USD. Coronavirus weakens grip: pound rises amid weakening dollar Posted: 14 Apr 2020 02:46 PM PDT The pound is slowly but surely recovering its positions. Less than a month ago – the GBP/USD pair reached a 35-year price low (1.1411) on March 20, but it remained at such lows for only a few days. After that, the British currency has been winning back point by point from the dollar for almost three weeks. With small pullbacks, the pair has passed more than a thousand points, and is now testing the 26th figure. In general, the first working day after the Easter holidays was clearly not in favor of the US currency. The dollar index did not stay within 99 points – there was no trace of the former confidence of dollar bulls against the background of a decline in anti-risk sentiment. In turn, the British dollar is gaining momentum for the same reasons – the first positive signals from different parts of Europe suggest that the epidemic will soon go down and countries will remove the strict restrictions that have actually strangled many areas of business and industry. Good news came from China, where the trade balance exceeded forecasts. All these factors, like small puzzles, have formed into one solid fundamental picture, which allows GBP/USD not only to hold the won points, but also claim the 26th figure. However, first things first. First of all, it should be noted that the situation with coronavirus remains difficult in the UK itself. More than 12,000 people died there from Covid-19, and the total number of infected people in the country is approaching 90,000. Today, it also became known that the number of deaths from the virus may be 15% higher due to the inclusion in statistics of new data on deaths in nursing homes. But even without these figures, the country is on the 5th place in the world in terms of the number of deaths, while in terms of the number of recoveries – on the 205th place. As you know, the head of government Boris Johnson survived, who spent three days in intensive care. However, in recent days, there are signs that the spread of the coronavirus in the country has slowed, after which the UK authorities began talking about the fact that strict restrictions may soon be lifted – however, not before May 7. The emerging "light at the end of the tunnel" provided significant support for the pound. In addition, similar news from Europe also encourages GBP/USD bulls. In particular, after a two-week quarantine in Spain, employees of factories, construction, security, telecommunications and customs were allowed to return to work. In Austria, small shops (up to 400 square meters), as well as specialized retail enterprises that produce and sell construction and gardening supplies, have resumed their work. In Italy, some stores have been allowed to operate – including stationery stores, bookstores and stores selling children's clothing. The list, of course, is small, but this is the first such relief for merchants after a long quarantine. In Germany, the current isolation measures expire on April 19. Tomorrow, the German government will hold consultations with leading experts from the Academy of Sciences, as well as with the heads of all federal states. As a result of these consultations, the fate of the quarantine will be decided – either it will be removed very gradually, or it will be extended for a certain period. A similar situation has developed in Denmark, however, they have already decided to open kindergartens there. The quarantine measures in the Czech Republic have also been slightly relaxed. The general situation was accurately described by the head of the Danish government, Mette Frederiksen. According to her, the heads of European states seem to be balancing on a tightrope - and you can't stop, and it's dangerous to act too quickly. At the same time, according to experts, the angle of inclination of the curves, which reflect new infections and the dynamics of deaths, began to decrease - both in the EU and in Britain. This circumstance provides quite strong support for the British currency (however, like the euro). But the US currency remained out of work: temporarily or for a long time - the question is open. But the fact remains: the decline in anti-risk sentiment is clearly playing against the dollar. Even in the United States, where Covid-19 is at its fastest pace, Donald Trump has voiced optimistic notes, saying the country is "not going to get the worst case scenario." China also contributed to a decrease in panic - China exports in March fell by 6.6% year on year, while experts expected the March figure to be much lower - at -14%. Imports fell by less than one percent, while analysts had expected a slowdown of almost 10%. Thus, the GBP/USD pair retains the potential for its further growth. When overcoming and consolidating the price above the "round" mark of 1.2600, one can consider long positions to the next resistance level of 1.2670 - this is the upper border of the Kumo cloud on the weekly chart. The material has been provided by InstaForex Company - www.instaforex.com |
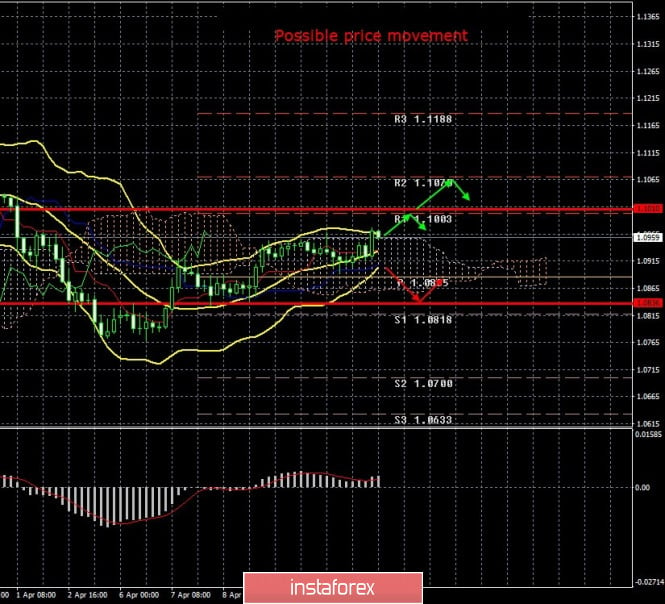
| Posted: 14 Apr 2020 02:46 PM PDT 4-hour timeframe Average volatility over the past five days: 87p (high). The EUR/USD currency pair resumed the upward movement on April 14 after a minimal correction as part of the upward trend. Everything is perfect from a technical point of view. The euro/dollar pair rebounded from the Senkou Span B line yesterday, which is a strong resistance, adjusted to the Kijun-sen line, which is a support for the current trend, rebounded from it and resumed the upward movement. In recent hours, traders also managed to overcome the upper border of the Ichimoku cloud, which also strengthened the current Golden Cross. Thus, the upward movement may continue, which is fully consistent with our "correction against correction" strategy, which we have already mentioned several times. At the moment, the pair is approaching the 1.10 level, which is a psychologically important mark.We expect that the strengthening of the euro will end in this level. In addition to the $1.10 level, the resistance and volatility levels of 1,1003 and 1,1010 are located nearby. Thus, formally we have three resistance at once, from which quotes of the pair can rebound. Further movement will depend on consolidation in the 1.09–1.10 area. We believe that it is in this area that the final part of the pair's movement will occur, after two months with maximum volatility. The pair could even be in an open flat for a while. However, one should always remember that other scenarios are possible. For example, the upward movement will continue above the $1.10 level. Therefore, trading should be on technical indicators. Moreover, the macroeconomic background is currently empty and insignificant. Traders have been ignoring almost all the news for almost two months, messages and data from the European Union and the United States. Last Friday was Good Friday, and it was Easter on Monday. Thus, no macroeconomic statistics were published on these days. A little bit of significant news will arrive tomorrow. So that market participants will not die of boredom, they can study new data on the coronavirus epidemic and read more and more comments and statements by US President Donald Trump, who is still the main news-maker in the world. In principle, it is quite possible to create a separate online publication specifically for Trump's interviews and statements. Because social networks can no longer cope with the influx of comments from the US president. According to the latest information, Trump still wants to lift at least some of the quarantine measures in May. Naturally, this idea implies a restart of the economy, and not a simple desire to end the quarantine. The presidential administration is finalizing a plan to ease the quarantine, as Trump announced today. "I have discussed this issue a lot with my team and leading experts. We are very close to completing the plan to open the country. Soon we will distribute important recommendations to the governors so that they can open their states. "The country will open and open with success," Trump said. The US leader also noted that it is the president who decides when to end the quarantine. Thus, Trump took full responsibility for what was happening. It doesn't matter if he understood this, but if suddenly the doctors are right and a second epidemic breaks out in the country due to the lifting of the quarantine, Trump will be blamed for sure. However, the president can, as usual, use his most favorite weapon and say anything to remove responsibility from himself. Immediately there will be "other guilty persons" who "advised Trump to open the country" or "misinformed him". In principle, Trump's rush is clear and understandable. The country is approaching the presidential election, and all the Trump campaign's have been killed by the coronavirus. If earlier the US president could say that the country's economy significantly grew under him, now he can only remember this. According to approximate calculations, the US economy has already contracted to "pre-Trump levels" in the two months of the epidemic. Thus, the US leader urgently needs to do something to prevent the economy from collapsing even more. So that by November it has somehow recovered. Unfortunately, it does not take into account the fact that if the quarantine measures are removed or relaxed, the growth rate of the spread of COVID-2019 infection may begin to grow again. Accordingly, these are potentially new cases, additional burden on the health sector, and new deaths. The United States remains in first place in the world in terms of the number of cases. Their number is already approaching 600,000. The number of deaths is almost 24,000. 4-hour timeframe Average volatility over the past five days: 122p (high). The GBP/USD pair continues to grow on April 14 as if nothing happened. The British currency continues to strengthen against the dollar, despite the fact that there are no special reasons for this and no reasons. Fundamental and macroeconomic backgrounds remain completely empty. No information is coming from the UK right now, just as it is from the US. We mean important economic information. Meanwhile, experts believe that Britain will become the most affected country from coronavirus. At the moment, the number of cases of infection in Great Britain is already 90,000 and around 11,000 recorded deaths. That is, the mortality rate in Britain is much higher than the average worldwide - 3-5%. They exceed 10%. And given the fact that the British are allowed to go outside and spend any time there (formally one hour, but no one checks the actual duration of each citizen's stay outside the house), the epidemic's growth rate is not slowing. Representatives of the health sector believe that the UK will have a second and third wave of a pandemic, and only mass vaccination can save the British population. However, the creation of the vaccine will take at least a year. How many more people can get sick during this time and how much will die is hard to imagine. Wellcome Trust fund director Jeremy Farrar, who finances the development of the vaccine, believes that creating a vaccine even in 12 months is "a very ambitious goal." In general, there is no positive news from the UK, and although the pound sterling is growing, it still does not give the impression of a strong currency that is growing for a reason. However, technical factors are now on the side of the British currency, so growth is worth bargaining for. Recommendations for EUR/USD: For short positions: The EUR/USD pair resumed its upward movement on the 4-hour timeframe. Thus, it is recommended to consider selling orders after consolidating the price below the Kijun-sen line with the first targets of 1.0836 and 1.0818. For long positions: At this time, traders are advised to stay with purchases of the euro/dollar pair with targets at 1,1003 and 1,1010, since the pair rebounded off the Kijun-sen line and then overcame Senkou Span B. Recommendations for GBP/USD: For short positions: The pound/dollar pair has left the side channel and continues the upward trend. Thus, it is advised to return to selling the pound before bears overcome the Kijun-sen line, small lots with the first goals of 1.2407 and Senkou Span B line For long positions: Now it is recommended to stay in purchases with goals 1.2651 and 1.2687, as there are no signs of the beginning of the correction. The MACD indicator may turn down from time to time, since the upward movement is rather weak. The material has been provided by InstaForex Company - www.instaforex.com |
| Oil falls again: Optimism from OPEC+ agreement has faded Posted: 14 Apr 2020 02:41 PM PDT Oil again began to fall, approaching the lows of March-April. Reason: The OPEC+ agreement reduces production by ten million barrels. Many experts spoke of an extra 20 million barrels per day in the market. Quarantine in Europe and the United States, the weakening of the quarantine regime will follow no earlier than May 1-15 in different countries. In particular, the heads of state governments in Germany opposed an early exit from quarantine. There is too much oil in the market. IMF forecast - the global economy will fall by 3% in 2020. Oil is falling, but do not rush to buy. Buy above recent highs, above $30. The material has been provided by InstaForex Company - www.instaforex.com |
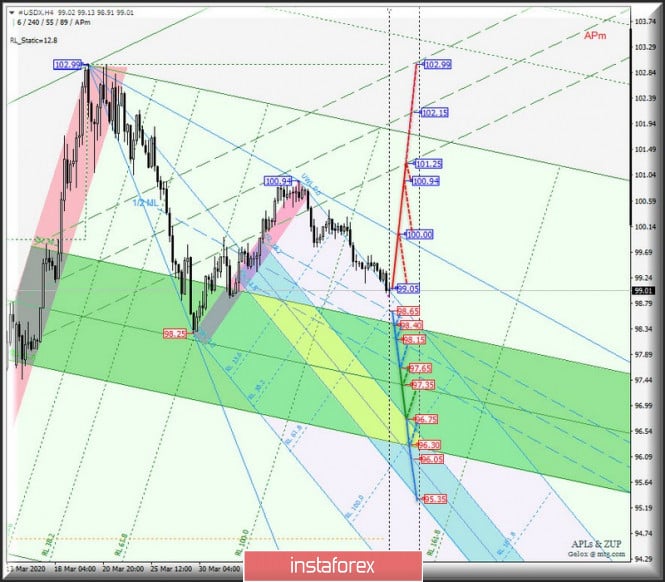
| Comprehensive analysis of movement options for #USDX vs Gold and Silver (H4) on April 15, 2020 Posted: 14 Apr 2020 10:48 AM PDT Minuette operational scale (H4) Precious metals gold and silver vs #USDX (dollar index) - who's who? Overview of the development of traffic movement from April 15, 2020 ____________________ US dollar index The movement of the dollar index #USDX from April 15, 2020 will be determined depending on the development and direction of the breakdown of the range:
A breakdown of the support level of 98.65 will make it relevant to develop the movement of the dollar index within the boundaries of the channel 1/2 Median Line Minuette (98.65-98.15- 97.65) and balance zones of the Minuette operational scale forks (98.40-97.35-96.30) and Minuette (96.75-96.05-95.35). If the resistance level of 99.5 on the starting line SSL of the Minuette operational scale forks - variant development of the upward movement #USDX to the line of control UTL Minuette (100.0) and a local maximum 100.94 of the achievement of the channel borders 1/2 Median Line (100.90-101.75-102.65) of the Minuette operational scale forks. The layout of the #USDX movement options from April 15, 2020 is shown on the animated chart.
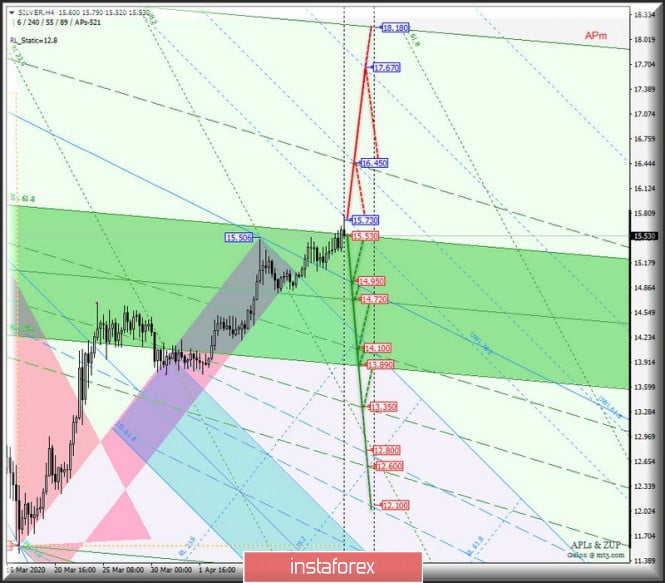
____________________ Spot Silver The direction of the breakout of the range:
And will determine the development of the Spot Silver movement from April 15, 2020. In case of a breakdown of the warning line UWL38. 2 of the Minuette operational scale forks - resistance level 15.730 - option to continue the upward movement of Spot Silver to the goals:
A breakdown of the support level of 15.530 ISL61.8 Minute will confirm that further development of the Spot Silver movement will continue in the equilibrium zone (15.530-14.720-13.890) of the Minuette operational scale forks. Details of the Spot Silver movement options from April 15, 2020 are shown in the animated chart.
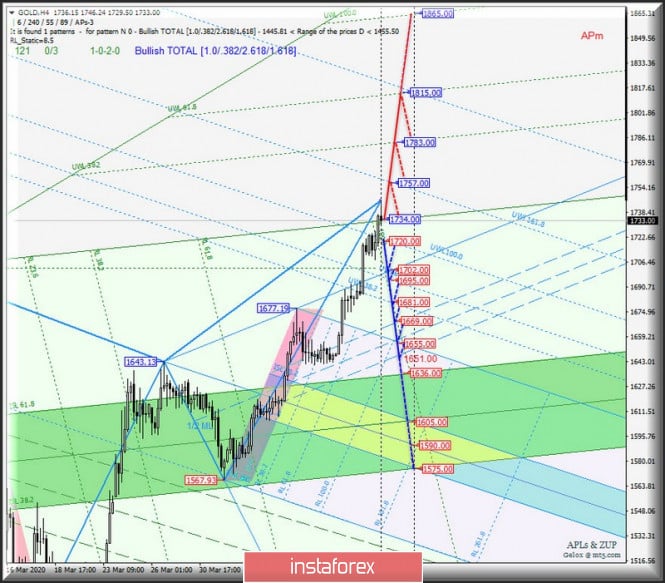
____________________ Spot Gold The development of the Spot Gold movement from April 15, 2020 will be determined by the development and direction of the breakdown of the range:
If the final FSL line of the operational scale forks is broken, the Minute - resistance level of 1734.00, the upward movement of Spot Gold can be continued to the targets:
If the breakdown of the warning line UWL100.0 of the Minuette operational scale forks takes place - support level 1720.00 - will make possible the development of the downward movement of Spot Gold towards the goals:
Details of the Spot Gold movement from April 15, 2020 can be seen on the animated chart.
____________________ The review is compiled without taking into account the news background, the opening of trading sessions of the main financial centers and is not a guide to action (placing "sell" or "buy" orders). The material has been provided by InstaForex Company - www.instaforex.com |
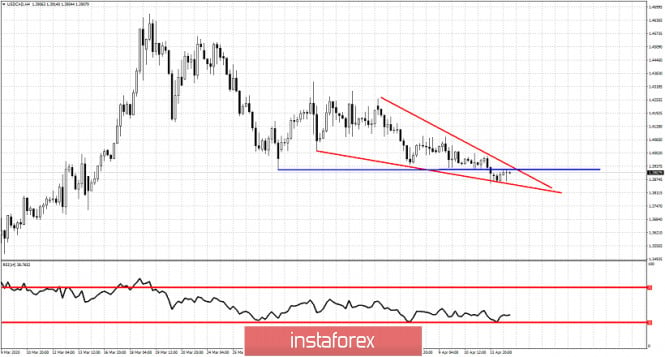
| USDCAD below key support of 1.3920 forming a bullish wedge Posted: 14 Apr 2020 10:40 AM PDT USDCAD continues to make lower lows and lower highs since the mid March top. Trend remains bearish. Price is now forming a downward sloping wedge pattern but has also broken below the horizontal support of 1.3920.
Blue line - horizontal support USDCAD has broken below the horizontal support and is now back testing it. A rejection at 1.3920 will open the way for a push lower towards 1.3850 at least. This is where we find the lower wedge boundary. This is short-term support. Resistance is at 1.3935-1.3930. A break above the upper wedge boundary resistance would be a bullish sign. So we have to take into consideration both the bullish potential if price breaks above the wedge and the bearish scenario if price gets rejected at 1.3920 and continues below 1.3845. The material has been provided by InstaForex Company - www.instaforex.com |
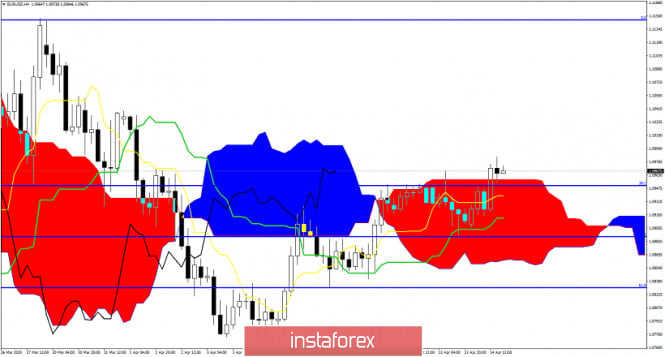
| Ichimoku cloud indicator provides another bullish sign for EURUSD in 4 hour chart Posted: 14 Apr 2020 10:35 AM PDT EURUSD is trading above the short-term cloud resistance at 1.0960. Price has broken above the 4hour Kumo and this is another bullish sign, following the weak bullish sign when the tenkan-sen crossed above the kijun-sen indicator.
|
| April 14, 2020 : EUR/USD Intraday technical analysis and trade recommendations. Posted: 14 Apr 2020 08:09 AM PDT
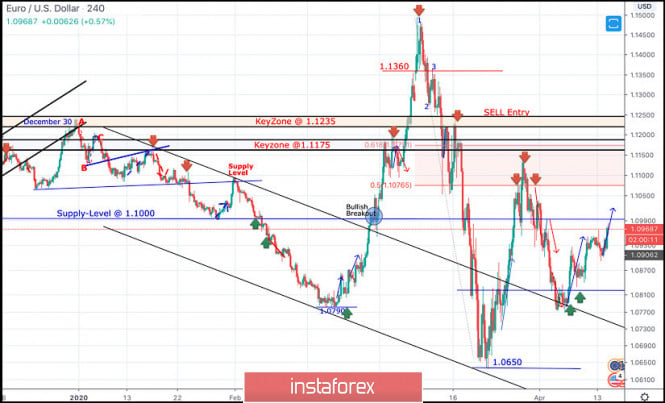
Since December 30, the EURUSD pair has trended-down within the depicted bearish channel until the depicted two successive Bottoms were established around 1.0790 then 1.0650 where the EUR/USD pair looked OVERSOLD after such extensive bearish decline. Few weeks ago, the EURUSD pair has expressed significant bullish recovery around the newly-established bottom around 1.0650. The following bullish engulfing H4 candlesticks as well as the recently-demonstrated ascending bottoms indicated a high probability bullish pullback at least towards 1.0980 and 1.1075 (Fibonacci Level 50%). Key Supply-Levels in confluence with significant Fibonacci levels are located around 1.1075 (50% Fibonacci) and 1.1175 (61.8% Fibonacci) where bearish rejection was highly-expected upon the latest bullish pullback that took place by the end of March. That was when the depicted Head & Shoulders pattern was demonstrated around the price levels of (1.1000 - 1.1075). Shortly after, further bearish decline was demonstrated towards 1.0800 where the nearest demand level to be considered was located near the backside of the broken channel (1.0800-1.0750). Early signs of Bullish rejection have been manifested around the price zone of (1.0800-1.0750) leading to the current bullish spike up to 1.0950. The short-term technical bullish outlook remains valid as long as bullish persistence is maintained above the recently-established ascending Bottom around 1.0830. Further bullish advancement is expected to pursue towards 1.1000, 1.1075 then 1.1175 where 61.8% Fibonacci Level is located. On the other hand, any bearish breakout below 1.0830 or 1.0770 (the recently established bottoms) invalidates the previously-mentioned bullish outlook. Trade recommendations : For those who caught the initial bullish trade just above 1.0800, Stop Loss should be elevated to 1.0870 to secure some profits. Intraday traders can wait for bullish breakout above 1.1000 for another short-term BUY signal. S/L to be placed below 1.0870 while Initial T/P levels to be located around 1.1075 and 1.1175. The material has been provided by InstaForex Company - www.instaforex.com |
| Posted: 14 Apr 2020 07:41 AM PDT Given the current state of the eurozone economy, a number of experts predict that the measures that finance ministers agreed at the end of last week will clearly not be enough to significantly affect the decline expected for the year.
Note that the eurozone allocated a total amount of 540 billion euro of package assistance in aiding and supporting its economy amid the coronavirus outbreak. However, most of the problems are still distributed to national governments and the ECB, and there are no general solutions to counter the economic recession. This means that all the countries under the eurozone remain to face the ordeal in their own terms and ways. It is expected that the gross domestic product of the eurozone in 2020 will fall immediately by 10%, while the budget deficit will jump above 10%. The balances of the eurozone member countries will be very different from each other since everyone will save the economy in their own terms, which is unlikely to meet the conditions necessary for the EU. Even though the crisis is probably short-term, the damage caused may be more extensive. The Bank of America gave its report today, which states that they expect a U-shaped recovery of the economy. More than 52% of the surveyed analysts agree with this. There is clearly no way to do without a period of stagnation, which depends entirely on how quickly activity begins to recover. Apparently, this is the reason why US President Donald Trump is trying to resume the full functioning of the economy in May this year, without waiting for the real decline of the coronavirus pandemic. However, about 22% of respondents expect a W-shaped recession. In this scenario, the economy will show a double failure, which is more typical for financial markets. Meanwhile, 15% of the survey participants suggest a V-shaped recovery of activity. This development of the situation is now indicated by the rapid growth in the US stock market, which is properly "pumped up with money" and which almost regained 30% of the minimum reached on March 23, in just three weeks.
Statements made by the Minister of Health of Spain, Salvador Ilya, who noted that the peak of the coronavirus has been passed and that the stage of "curve bending" is currently being observed added in the list of good news. If you would recall, Spain is third among countries when it comes to the growth of the number of victims brought by the COVID-19 pandemic (after the United States and Italy). Meanwhile, today, the World Health Organization noted that the observed outbreak of COVID-19 in the United States is the largest in the world since the number of confirmed cases already rose to almost 570,000 with a death toll of 23,000. It is necessary to look at the tendency for an increase in the incidence rate to be observed this week, since on Sunday, for the first time a decrease in the average number of cases was noted, which is the first signal that a peak in the spread of coronavirus has been reached. Considering the fact that fundamental statistics on the state of the economy of the eurozone and the USA are not published at the beginning of the week, there are no special changes in the market either. Moreover, the technical picture of the EUR/USD pair has not changed in any way as yesterday. The immediate goal of the bulls remains a maximum of 1.0970, the breakthrough of which once again failed. Only a steady increase above this range will help buyers of risky assets to abandon a trading instrument in the area of greater resistance at 1.1040, as well as get to a local maximum in the area of 1.1140. If pressure on risky assets returns, then the bulls will again try to protect the important support level of 1.0890. Lack of demand at this level can quickly push the euro to the lows of the week at 1.0830 and 1.0770. The British pound, on the other hand, continues to update monthly highs, gradually approaching the level of 1.2605, the breakdown of which will provide a direct path to the levels of 1.2690 and 1.2795. It is possible that the optimism of market participants is fueled by a decision by the Bank of England not to change the rules and maintain the pace of bond purchases this week in the amount of £ 4.5 billion per day. The material has been provided by InstaForex Company - www.instaforex.com |
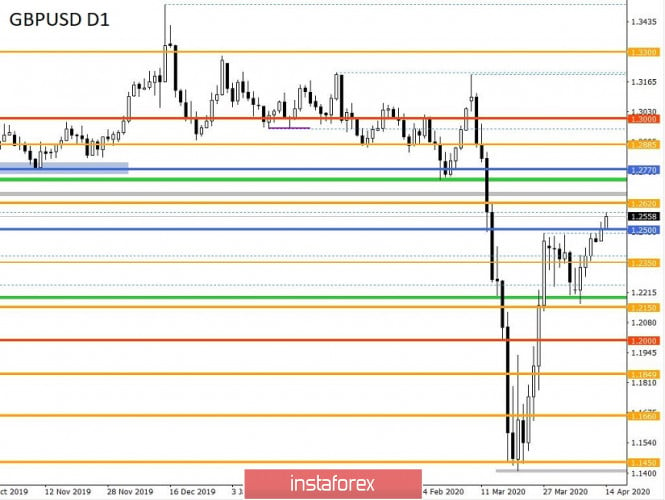
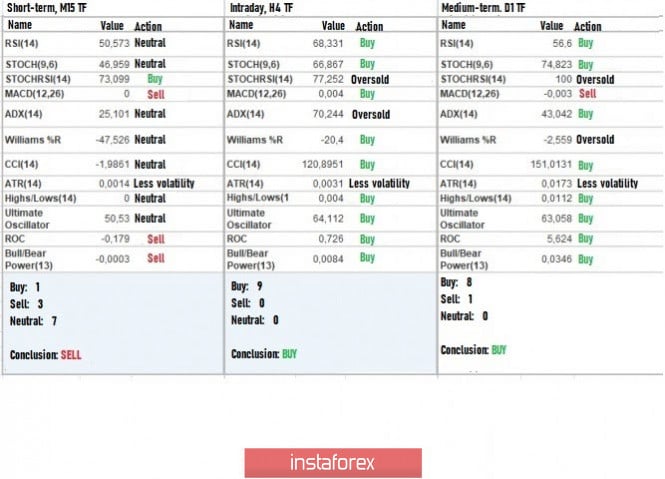
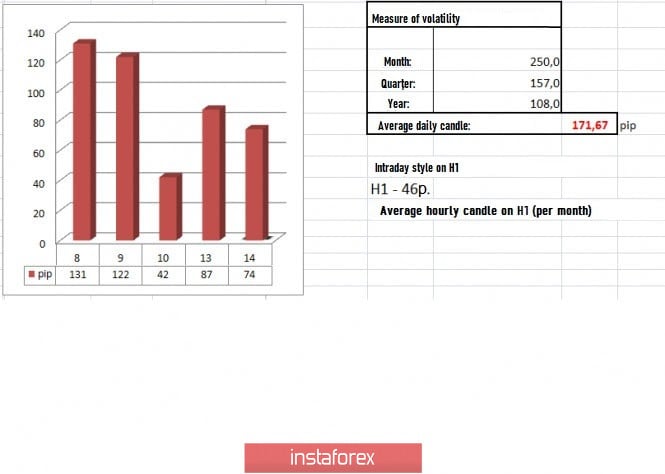
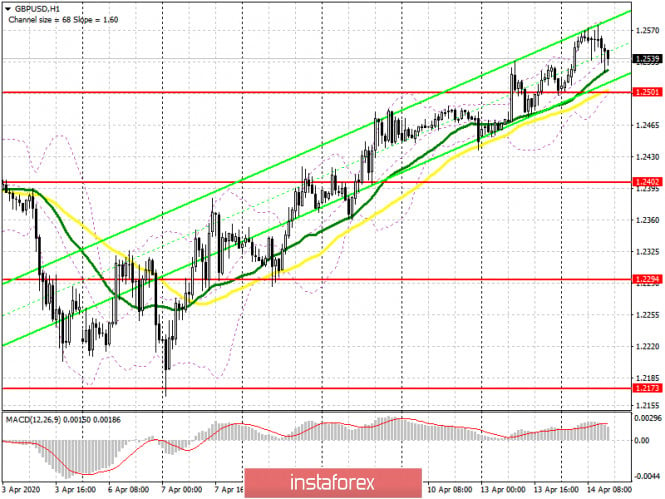
| Trading recommendations for GBP/USD on April 14, 2020 Posted: 14 Apr 2020 06:20 AM PDT Using integrated analysis, we can see that the price broke the level of 1.2500 and consolidated above it. This means that the stagnation last week [1.2440 / 1.2485] was not in vain, because acceleration occurred, and the quote formed an impulse of more than 60 points locally. Meanwhile, the speculative interest did not meet the expectations of the market, so the surge in the morning was almost immediately won back. Nevertheless, long positions still remained. Against this background, the quote gradually returned to the level of 1.2500, and the high during the morning surge is 1.2534. Drastic changes were recorded during the past two weeks. The quote updated the highs on March 27, and the side corridor of 1.2150/1.2500 is no longer considered the main movement. The upward movement from 1.2150 (it was April 7) also grew into something more. However, it's still quite early to assume the resumption of the upward trend because local fluctuations can still happen due to the persisting external background and the panic mood of the market. Meanwhile, analyzing the past trading day, it is worth noting that the activity of GBP/USD is quite similar to that of EUR/USD. The only difference is that the pound managed to maintain an upward trend towards the end of the day. In terms of volatility, there's a twofold acceleration relative to Friday. However, comparing it to the daily average, the slowdown is 50%. Details of volatility: Monday - 165 points; Tuesday - 245 points; Wednesday - 172 points; Thursday - 358 points; Friday - 359 points; Monday - 144 points; Tuesday - 271 points; Wednesday - 676 points; Thursday - 354 points; Friday - 522 points; Monday - 267 points; Tuesday - 296 points; Wednesday - 333 points; Thursday - 452 points; Friday - 352 points; Monday - 148 points; Tuesday - 227 points; Wednesday - 108 points; Thursday - 126 points; Friday - 198 points; Monday - 116 points; Tuesday - 217 points; Wednesday - 131 points; Thursday - 122 points; Friday - 42 points; Monday - 87 points. The average daily indicator relative to the dynamics of volatility is 171 points [see table of volatility at the end of the article]. Looking at the trading chart in general terms [the daily period], we see that the upward movement on March 20 received a new life, as the high has been updated, and there are 500 points left before the completion of the V-shaped model. Meanwhile, the coronavirus continues to set anti-records. The total number of cases all over the world is almost 2 million, so, since the number of cases increase by less than 100 thousand everyday, the bar may be passed today or tomorrow. Europe, represented by France, has already announced the extension of quarantine measures until May 11. Britain is also considering extending the quarantine to at least May 7. According to the Center for Economic and Business Research in UK, the quarantine costs the UK economy about £ 2.4 billion everyday. Therefore, the extension of quarantine does not have positive effects on countries' economies. We again don't have anything interesting in the economic calendar today. The only good news is that Europeans and Britons have returned to the market from a two-day weekend, thereby restoring trading volumes. Further development As we can see in the current trading chart, there are attempts to maintain the upward trend, so the quote managed to reach 1.2575. Such attempts may lead to a variable stagnation, possibly within 1.2500 / 1.2580. Meanwhile, with regards to the existing platform, it will soon become clear whether buyers will be able to maintain their positions. Moreover, the quotes may be able to move to the subsequent levels and develop a complete V-shaped model. Relative to the emotional component, a slight decrease in the coefficient of speculative activity is recorded. However, this is probably temporary. Analyzing the work schedule by the minute, we see an interesting picture, where an upward spiral took place in the Asian sessions. However, just before the European session started, a slowdown, expressed in consolidation of Doji candles, occurred. From trading practice, this formation can serve as a platform for further acceleration. Therefore, we can assume that the boundaries of 1.2500 / 1.2580 are the main scope of the acceleration. However, the consolidation in the morning could shift the boundaries of amplitude, so we may also consider the boundaries of 1.2520 / 1.2575. Work is based on the method of breaking down the established boundaries and catching the pulse. Based on the information above, we formulated these trading recommendations: - Open buy positions above 1.2575, targeting movement up to 1.2620. - Open sell positions below 1.2520, targeting movement up to 1.2490-1.2440. Indicator analysis Analyzing the different sector of timeframes (TF), we see that due to the new round of upward movement, the indicators on the hourly and daily periods show a buy signal. Minute intervals, on the other hand, show fluctuations, having a variable signal. Volatility per week / Measurement of volatility: Month; Quarter; Year The volatility measurement reflects the average daily fluctuation calculated by Month / Quarter / Year. (April 14 was built by taking into account the time of publication of the article) The current volatility is 74 points. This is 56% lower than the daily average. Therefore, we can assume that if the quote succeeds in overcoming the established boundaries, acceleration may give us additional 30-40% of the current fluctuation. Key levels Resistance Zones: 1.2620; 1.2725 *; 1.2770 **; 1.2885 *; 1.3000; 1.3170 **; 1.3300 **; 1.3600; 1.3850; 1.4000 ***; 1.4350 **. Support Areas: 1,2500; 1.2350 **; 1.2280 (1.2240); 1.2150 **; 1.2000 *** (1.1957); 1.1850; 1.1660; 1.1450 (1.1411); 1.1300; 1,1000; 1,0800; 1,0500; 1,0000. * Periodic level ** Range Level *** Psychological level **** The article is built based on the principle of conducting a transaction, with daily adjustments The material has been provided by InstaForex Company - www.instaforex.com |
| Posted: 14 Apr 2020 05:47 AM PDT BTC News :
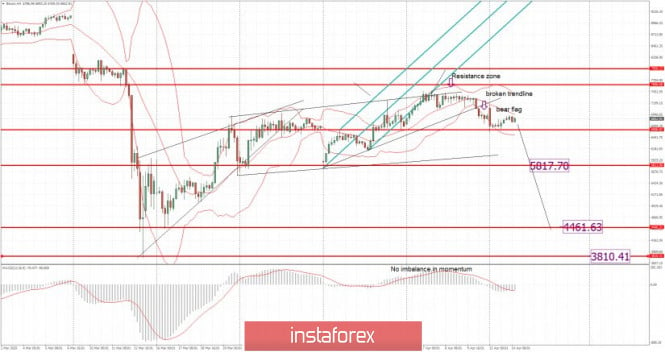
According to data from Skew markets, the put/call ratio for Bitcoin Options has been recording simmering selling pressure since 12 March. The Open Interest for the Options contracts with sell positions, by Options contracts with buy positions, has been steadily rising, despite the movement of the contracts' trading volume, which has been erratic, to say the least.Technical analysis: BTC has been trading sideways at the price of $6.855. I still expect furher downside movement and next downward targets on the test.Trading recommendation: Watch for selling opportunities on the rallies with the next downward targets set at the price of $5.817, $4.460 and $3.810. MACD oscillator is showing strong selling pressure from the background, which is strong sign of the bearish pressure. Resistance levels are set at the price of $7.150 and $7.400. Support levels and downward targets are set at the price of $5.817, $4.460 and $3.810. The material has been provided by InstaForex Company - www.instaforex.com |
| Posted: 14 Apr 2020 05:29 AM PDT Corona virus news:
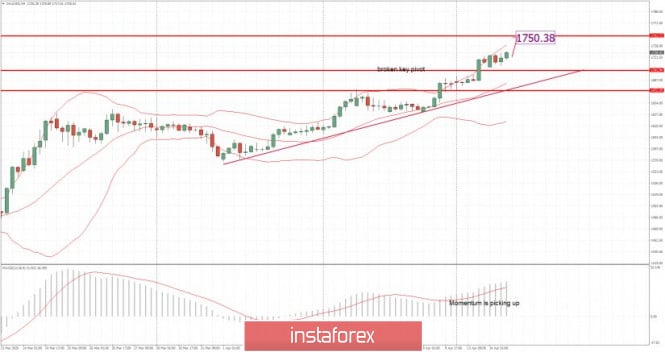
Maureen Zeman was a registered nurse for 29 years at a hospital in San Jose, California, before she was laid off with dozens of other nurses despite the coronavirus pandemic. Dozens of states across the US have issued orders to halt elective medical procedures as part of emergency shutdowns to curb the spread of Covid-19. As a result, hospitals and medical treatment clinics across the US are implementing layoffs, furloughs, and cuts to salaries and work schedules in response to declines in revenue. Technical analysis: Gold has been trading upwards as I expected. The upside pressure is very strong and In my opinion Gold is heading for the test of $1.750. Trading recommendation: Watch for buying opportunities on the dips using the hourly or 4h time-frame with the upward target at the price of $1.750. MACD oscillator is showing new momentum high, which is good indication for the further upside continuation. Resistance levels are set at the price of $1.750. Support pivot level is set at the price of $1.700. The material has been provided by InstaForex Company - www.instaforex.com |
| April 14, 2020 : GBP/USD Intraday technical analysis and trade recommendations. Posted: 14 Apr 2020 05:28 AM PDT
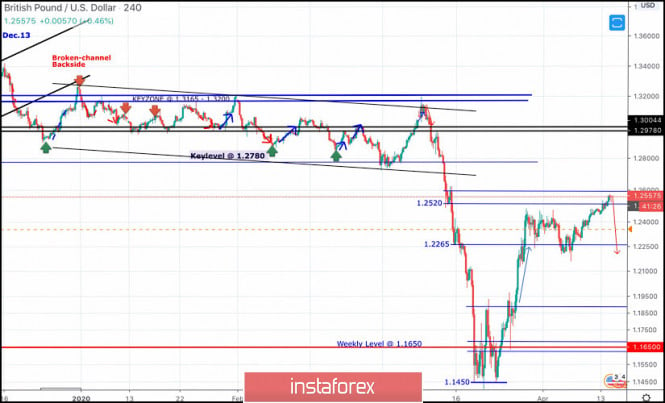
Recently, the GBPUSD has reached new LOW price levels around 1.1450, slightly below the historical low (1.1650) achieved in September 2016. That's when the pair looked very OVERSOLD around the price levels of 1.1450 where a double-bottom reversal pattern was recently demonstrated as depicted on the chart. Technical outlook will probably remain bullish if bullish persistence is maintained above 1.1890-1.1900 (Double-Bottom Neckline) on the H4 Charts. Bullish breakout above 1.1900 (Latest Descending High) invalidated the bearish scenario temporarily & enabled a quick bullish movement to occur towards 1.2260. Next bullish targets around 1.2520 and 1.2680 were expected to be addressed if sufficient bullish momentum was maintained. However, early bearish pressure signs have originated around 1.2470 leading to the previous bearish decline towards 1.2265. That's why, H4 Candlestick re-closure below 1.2265 was needed to hinder further bullish advancement and enhance the bearish momentum on the short term. On the other hand, the current bullish persistence above 1.2265 has enhanced another bullish pullback movement up to the price levels of 1.2500-1.2550 where bearish rejection should be expected. A double-top reversal pattern may be in progress with neckline located around 1.2250. That's why, early bearish breakdown below 1.2250 confirms this reversal pattern in the short-term. Trade recommendations : Conservative traders should be looking for signs of bearish rejection during the current bullish pullback towards 1.2550-1.2600 as a valid SELL signal. T/P level to be located around 1.2100 and 1.2000 while S/L should be placed above 1.2600. The material has been provided by InstaForex Company - www.instaforex.com |
| Posted: 14 Apr 2020 05:15 AM PDT Corona virus summary:
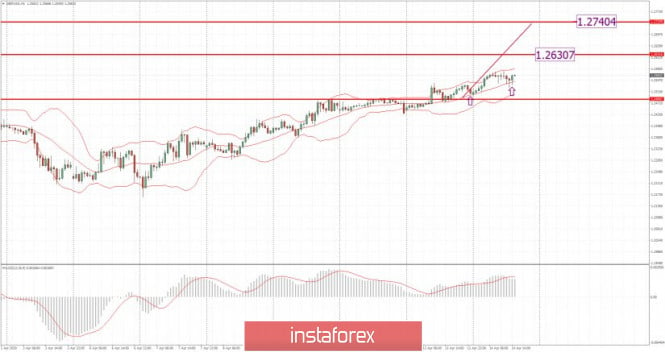
The World Health Organization has reported that the number of confirmed cases of the coronavirus in Africa has now passed 15,000. An emergency shipment of medical supplies for African nations' health systems departed Addis Ababa this morning. Although Covid-19 has yet to take hold across the continent, it is perhaps the most ill-equipped region of the world to tackle it. Last week the WHO's Africa office estimated there were about five intensive care beds per million people in Africa, compared with about 4,000 per million people in Europe..Technical analysis: GBPs been trading upwards as I expected. The price is heading towards my upward targets at the pice of 1.2630-1.2740. Based on the hourly time-frame, there is another rejection of the middle Bollinger band line and rising support trend line, which is sign of the strong upward trend. Trading recommendation: Watch for buying opportunities on the dips using the hourly or 4h time-frame with the upward targets at the price of 1.2630 and 1.2730. MACD oscillator is showing strong buying pressure from the background, which is strong sign of the upward trend. Resistance levels are set at the price of 1.2630 and 1.2740. Support pivot level is set at the price of 1.2535. The material has been provided by InstaForex Company - www.instaforex.com |
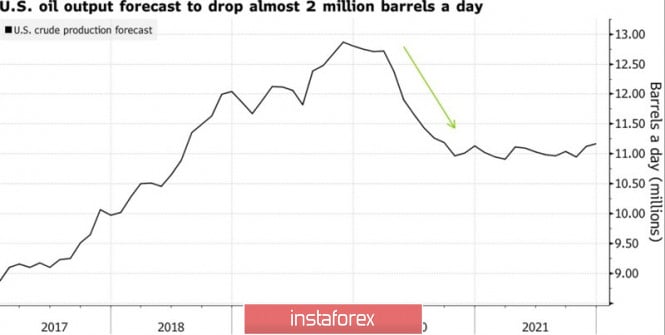
| Oil looks for traps and pitfalls Posted: 14 Apr 2020 04:47 AM PDT Wishful thinking is a distinctive feature of US President Donald Trump. However, investors are very good at counting. Moreover, they cannot find Trump's announcement on Twitter about the reduction of oil production by 20 million barrels per day. Meanwhile, OPEC+ agreed to cut output only by 10 million barrels per day while the US, Canada, Brazil and other countries will contribute another 5 million barrels as their production declines. Where to get the remaining 5 million barrels? It seems like a part of the output will go to replenish strategic reserves of the countries since only few are willing to buy crude under current circumstances, even despite very low prices. Saudi Arabia, Russia and other OPEC+ member countries agreed to cut output by 9.7 million barrels per day in May-June, which is equivalent to 10% of global demand. In July-December, the scope of obligations will decrease to 7.7 million barrels per day and to 5.8 million barrels in 2021. Meanwhile, the US, Canada, and Brazil are committed to reduce production by 3.7 million barrels per day and the rest of G20 countries - to 1.2 million barrels. Oil extraction in the US
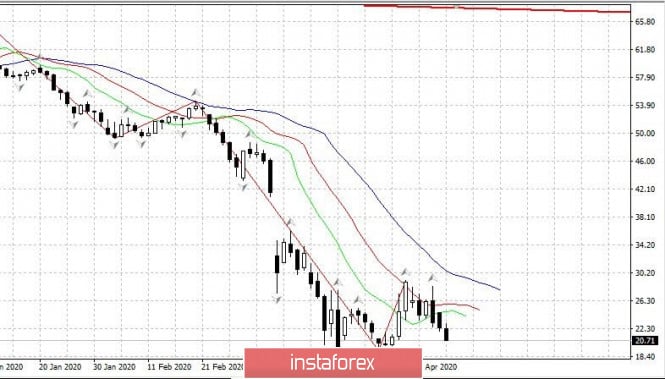
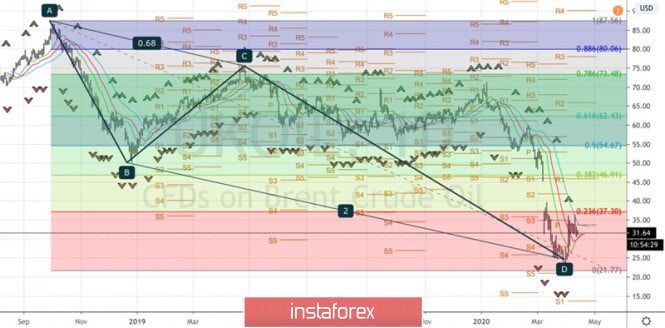
Oil prices grew amid rumors about the historic OPEC+ agreement. However, they fell later as uncertainty remained. Thus, oil buyers keep on taking profit. Firstly, global oil demand contracted by 23-30 million barrels per day. Secondly, there are rumors in the market that OPEC+ is likely to fail to reduce production by 9.7 million barrels per day. In the best case scenario, output cut is expected to reach only 7-8 million barrels per day. Thirdly, those who rely on the fast recovery of the Chinese economy and associate the growth of global oil demand with this even may actually be wrong. The Chinese government expects a V-shaped GDP growth in the third quarter. The country has almost defeated the coronavirus epidemic and is getting back to normal. Anyway, China lacks oil. According to Wood Mackenzie, China's national and commercial inventories are likely to grow to 1.15 billion barrels in 2020. China increased aggregate measures from 200 million barrels in 2014 to 900 million barrels in 2020. Apart from that, the country expanded imports of oil by 12% y/y in March, which is the best indicator that China's risk appetite is rising. It is better not to underestimate China. Cheap oil is only contributing to the V-shaped recovery of the largest economy in Asia. Meanwhile, Donald Trump is not pleased about Brent and WTI's unwillingness to grow. Moreover, US president will not miss the opportunity to remind investors about output cuts in the US and around the world. According to the daily chart, Brent crude reached the target by 200% on AB=CD pattern and kept rolling back in the direction of the correctional level of 23.6% and Fibonacci retracement of 38.2% from the last descending wave. It is better to hold and increase long positions which were formed at the breakthrough of $28 per barrel level at the end of March if the price breaks through the resistance at $34 and $35. Brent, daily chart
|
| Posted: 14 Apr 2020 04:36 AM PDT To open long positions on GBPUSD, you need: From a technical point of view, there were no changes in the market at all, since the pair did not touch any of the levels. Given that important fundamental statistics on the British pound are not expected today and in the afternoon, volatility will likely continue to decline, returning the pound to its normal state. The bulls are still aiming for a maximum of 1.2605, which test will keep the upward potential in the pair, which will open a direct path to the area of 1.2686, where I recommend fixing the profits. However, do not forget about the protection of the support of 1.2501, the return to which has already been outlined by the sellers of the pound in the second half of the day. Only the formation of a false breakout there will be a signal to open new long positions. It is best to buy the pound immediately on a rebound from a minimum of 1.2402. To open short positions on GBPUSD, you need: Sellers of the pound need to try to return the market under their control, and this can only be done after fixing below the support of 1.2501, to which the pair is gradually declining. A break in this area, just above which the moving averages pass, will increase the pressure on the pound, which will push it to the area of the minimum of 1.2402 and, quite possibly, to the larger area of 1.2294, where I recommend fixing the profits. It is worth noting that bears will not rush to enter the market at current levels and will wait for the update of the resistance of 1.2605, where the formation of a false breakout will be the first signal to open short positions in the pair. I recommend selling the pound/dollar pair immediately for a rebound only after testing the maximum of 1.2686, counting on a rebound of 40-50 points within the day.
Signals of indicators: Moving averages Trading is just above the 30 and 50 daily averages, which indicates that the advantage of buyers of the pound remains. Note: The period and prices of moving averages are considered by the author on the hourly chart H1 and differ from the general definition of the classic daily moving averages on the daily chart D1. Bollinger Bands A break in the lower border of the indicator around 1.2501 will increase the pressure on the pound, while a break in the upper border of the indicator around 1.2575 may lead to a larger increase. Description of indicators
|
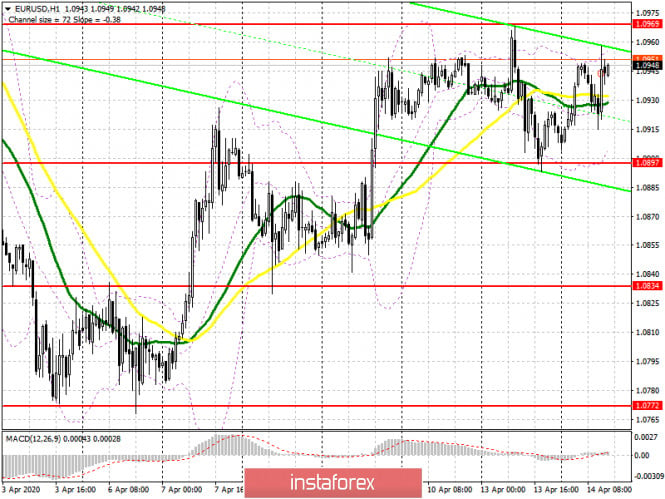
| Posted: 14 Apr 2020 04:31 AM PDT To open long positions on EURUSD, you need: In the first half of the day, there were no changes in the market, and the price did not touch any of the target levels. The lack of fundamental statistics leaves the pair in a narrow side channel. An important task for euro buyers is to protect the support of 1.0897, where the formation of a false breakout will be a signal to open long positions in the expectation of continuing growth to the highs of 1.0969, with the breakdown of which there were problems yesterday. Only a consolidation above this level will open a direct path to the area of 1.1033, and then lead to an update to the maximum of 1.139, where I recommend fixing the profits. In the scenario of a larger decline today, the euro is below the level of 1.0897, which is unlikely, since the economic calendar is almost empty and in the afternoon, long positions can be returned immediately to rebound from the minimum of 1.0834. To open short positions on EURUSD, you need: Like yesterday, the primary task of sellers of the euro is to form a false breakout in the resistance area of 1.0969, which will be a signal to open short positions in the expectation of a decline to the support of 1.0897, where today I recommend fixing the profits. Important reports on the state of the US economy in the second half of the day are published, in addition to performances of representatives of the Federal Reserve System, so the lack of demand for the euro in the area of 1.0897 may lead to a larger decline in the pair to the minimum of 1.0834, where I recommend taking the profits. If there are no active sales at the level of 1.0969, it is best to postpone short positions until the test of the maximum of 1.1033, from where you can expect a correction of 30-40 points within the day.
Signals of indicators: Moving averages Trading is conducted in the area of 30 and 50 daily moving averages, which indicates market uncertainty with the future direction. Note: The period and prices of moving averages are considered by the author on the hourly chart H1 and differ from the general definition of the classic daily moving averages on the daily chart D1. Bollinger Bands Breaking the upper limit of the indicator to the area of 1.0955 may lead to the new growth of the euro. Whereas a break of the lower border in the area of 1.0900 will increase pressure on the euro. Description of indicators
|
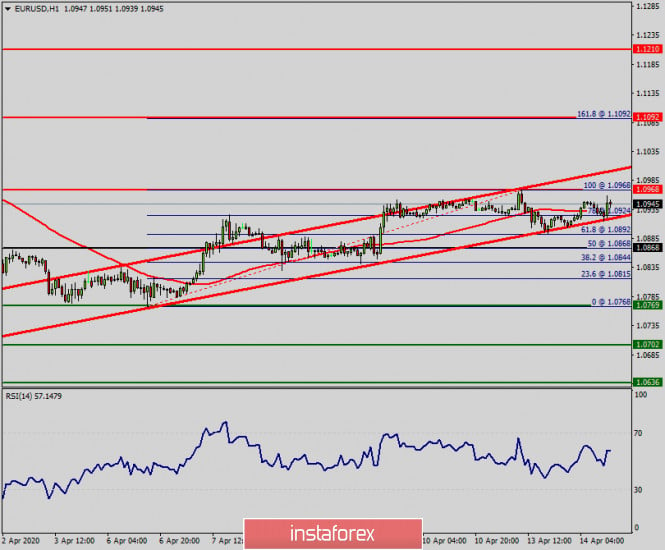
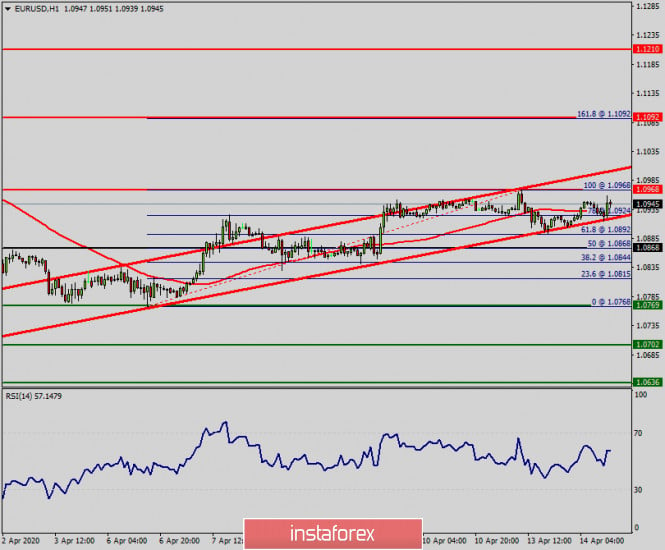
| Technical analysis of EUR/USD for April 14, 2020 Posted: 14 Apr 2020 03:50 AM PDT Overview: Statistical data seems to lag behind the fast-moving Coronavirus (Covid 19) which is wreaking havoc around the world. But the EUR/USD pair rose above the level of 1.0769 yesterday and is struggling to recover as Germany is warming up toward European-wide bonds. Probably a more comprehensive plan from the eurozone and a stop in additional lockdowns could help the euro settle. The EUR/USD pair continues to move in an uptrend from the level of 1.0769 since yesterday. So, major support is seen at 1.0769, while immediate resistance is found at 1.0968. Besides, it should be noted that the support coincides with the double bottom. Today, we guess that the pair will be traded higher in the early session and try to reach the first resistance at the level of 1.0968. The bias is neutral in the nearest term probably with a little bullish bias testing 1.0968 area which needs to be clearly broken to the upside to keep the bullish scenario strong. A clear break above that area (1.0968) could lead the price to the neutral zone in the nearest term testing 1.1092. Thus, we confirm the bullish scenario. On the downside, a clear break and daily close below 1.1000 could trigger further bearish pressure testing 1.0868 which represents a weekly pivot point. Consequently, the EUR/USD pair is able to close below the support of 1.0868 on the one-hour chart; the trend will continue its bearish momentum today. As a result, it is gainful to sell below the 1.1000 price with targets at 1.0868 and 1.0769. However, the bullish trend is still expected for the upcoming hours as long as the price is above 1.076 9level. The material has been provided by InstaForex Company - www.instaforex.com |
| Technical analysis of EUR/USD for April 14, 2020 Posted: 14 Apr 2020 03:48 AM PDT |
| EUR / USD: positive news for euro Posted: 14 Apr 2020 03:47 AM PDT
After the Fed's emergency monetary easing, the euro and the dollar went back to their usual roles: euro as a high-risk asset, and dollar as a safe-haven currency. Thus, in these current conditions of improving market sentiment, euro naturally looks to be in demand. Investors drew attention to the statistical data from China. In March, exports decreased by 6.6% in annual terms, while imports fell by 0.9%. Analysts expected the first indicator to decrease by 14%, and the second by 9.5%. Market participants continue to monitor the situation with the coronavirus. A number of European countries, including Italy and Spain, are preparing to remove some restrictive measures that were implemented. This is because the infection and mortality rate concerning the coronavirus has decreased already. US also received the first signs that the pandemic is now receding. Several state governors are now thinking about ways on how to mitigate the restrictive measures implemented. The White House is also close to completing the plan of opening the national economy. However, there is still the problem that leaving quarantine too early may cause another wave of the pandemic. According to experts at Goldman Sachs, the improvement in the situation is the result of the social distance policy. If people return to work, the situation can change quite quickly. Goldman Sachs also released a forecast that in the second quarter of 2020, GDP of developed countries will decrease by 35%. This is four times lower than the crisis in 2008. At the same time, Peterson Institute for International Economics estimates that in 2020, global runway will decrease by 3.4%, US by 8%, and EU by 12%. The recession in the eurozone may be deeper than in the United States. Nevertheless, ECB Vice President Luis de Guindos believes that EU GDP will grow in the third quarter of 2020, and the economy will fully recover by 2021. The faster growth rate of US GDP compared to EU is a "bearish" factor for EUR/USD. However, that is reserved for later. Right now, the dynamics of the pair is depending on the reaction of US stock indices against the situation with coronavirus, as well as in the results of the latest macroeconomic statistics. Thus, in this regard, the growth of the S&P 500 index, caused by the statements made by US President Donald Trump, the release of China's strong statistics, and Beijing's permission to test the coronavirus vaccine on humans, has dealt a blow to the dollar. As long as the US stock indices continue to grow, the dollar risks losing ground. Therefore, EUR / USD bulls are not giving up hope in overcoming the resistance level of 1.0965, and successfully entering the market. The material has been provided by InstaForex Company - www.instaforex.com |
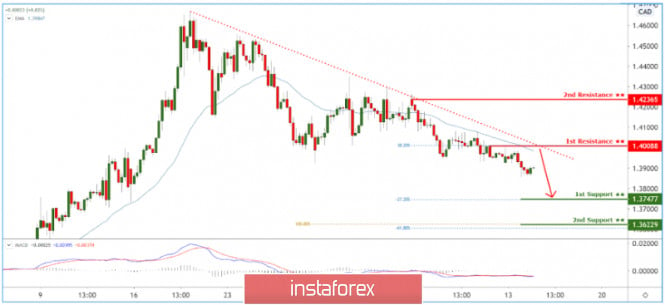
| USDCAD holding below descending trendline resistance. Further drop expected! Posted: 14 Apr 2020 03:37 AM PDT
Trading Recommendation Entry: 1.40088 Reason for Entry: 38.2% Fibonacci retracement, moving average and descending trendline resistance Take Profit : 1.37477 Reason for Take Profit: -27.2% Fibonacci extension Stop Loss: 1.42365 Reason for Stop loss: Graphical swing high The material has been provided by InstaForex Company - www.instaforex.com |
| Market review. Trading ideas. Answers for questions Posted: 14 Apr 2020 03:24 AM PDT Trading recommendations: AUD/NZD - grid of limit sales is above 1.05300 The material has been provided by InstaForex Company - www.instaforex.com |
| EUR/USD: Euro rose. COVID-19 retreats from US Posted: 14 Apr 2020 03:18 AM PDT The news that US President Donald Trump is about to cancel quarantine measures in May led to the strengthening of risky assets, as well as the growth of US stock indices. However, there are no strong proofs that COVID-19 is really slowing down in the US, and the number of confirmed cases reached 560,000 last Monday. In total, an average of about 31,000 become infected per day, however, last Sunday, this figure began to decrease to 29,000, which may have prompted Trump to make several tweets on this subject. The US president said that opening the country is his decision, and this issue is currently being worked out with local leaders.
Experts disagree to such decisions. Although the longer the quarantine is, the more it will affect the state of the economy, hasty removal of measures can lead to a new outbreak of the pandemic. Recall that the disease has already infected more than 2 million people all over the world, and has killed more than 114,000. Meanwhile, the President of France, Emmanuel Macron, announced that he would extend quarantine measures up to May 11 of this year only. He expects that as soon as it is lifted, economic activity will begin to gradually recover. Businesses, schools, and childcare facilities will open and resume immediately after May 11, but public places, including restaurants, hotels and movie theaters, will remain closed. The borders will also remain closed until further notice. Given the lack of important macroeconomic statistics earlier this week, any positive news related to the slow down of the pandemic will positively affect risky assets, including the European currency.
The data on the economic activity of the Federal Reserve Bank of New York indicates how much the crisis hit the economy. According to the report, the index of economic activity in New York for the week of March 29 to April 4 fell by 8.89%, after falling by 3.23% from March 15 to 21. The sharp decline is directly related to the deterioration in the labor market, as well as in the sharp increase in the number of applications for unemployment benefits. The index is relatively new and is aimed at identifying the economic damage caused by the coronavirus. Yesterday, the National Bureau of Economic Research also published a report about the problems that small businesses in the US are currently facing. According to the data, about 43% of small companies have suspended or ceased operations, and for those who are still afloat, staff was reduced by an average of 40%. Moreover, almost all companies expect to receive assistance from the government, in the form of additional loans as part of stimulus packages that were implemented by the Fed and the Congress last March and April. However, many business owners expect to face serious problems in applying for it because it requires confirmation of the reasons for obtaining it. Meanwhile, Richard Clarida, vice-chairman of the US Federal Reserve, said that the Fed's response was timely, ambitious, and completely appropriate. He is confident that when the economy recovers, the committee will be able to curtail lending programs, ensuring that the economy will not suffer. According to him, problems persist because of the low demand, which will certainly affect inflation. However, the Central Bank has many tools that could prevent this deflation. As for the technical picture of EUR/USD, the pair remained unchanged, and the immediate goal of the bulls is still the high of 1.0970. Breaking above the level would help buyers reach the resistance level of 1.1040, and get to the local high in the area of 1.1140. However, if pressure returns, the bulls will again protect the support level at 1.0890, as lack of demand at this level can quickly push the euro to the lows of the week at 1.0830 and 1.0770. The material has been provided by InstaForex Company - www.instaforex.com |
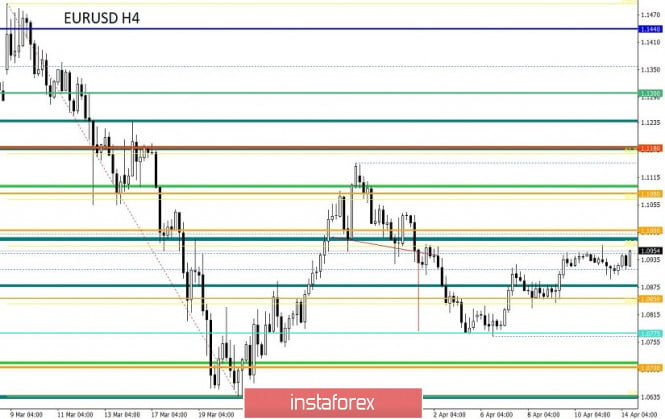
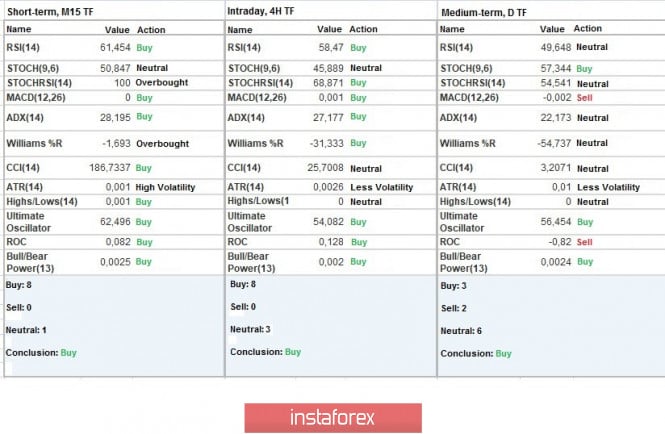
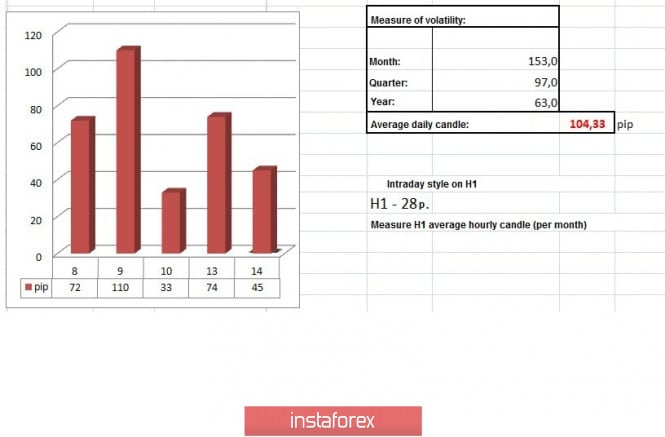
| Trading recommendations for EUR/USD pair on April 14 Posted: 14 Apr 2020 03:03 AM PDT From the point of view of complex analysis, we see local jumps of activity, but it has led to a new variable framework, and now let's talk about the details. The 38 hour stagnation of 1.0920 / 1.0950, which was set as early as last Friday, was still broken, but we only saw the so-called speculative traps and not the whole movement. So a surge of long positions was recorded in the first half of the day, which locally brought the quote to the area of 1.0967, but the speculators were not able to keep in the given course, and the breakdown turned out to be false. At this stage, short positions arise, which amid a false breakdown have a speed twice as high, which led not only to a breakdown of the boundary of 1.0920, but to a decline to the area of 1.0893. At this point, the trap closed, local acceleration subsided and everything returned to the framework of Friday's accumulation. What remains after the local jumps? The range of speculative activity is 1.0893/1.0967, which only changed the width of the stagnation amplitude, but not the general movement that many expected. As for the theory of development, all local operations are still in priority without any changes. What you should pay attention to is the volatility, which shows a slowdown for the second week in a row relatively, in excess of the active period of March. That is, the dynamics is decreasing, but it is returning to normal before the panic of market participants, which means that adaptation to the external background is underway, and medium-term target movements may resume over time. Details of volatility: Monday - 155 points; Tuesday - 183 points; Wednesday - 115 points; Thursday - 278 points; Friday - 166 points; Monday - 151 points; Tuesday - 234 points; Wednesday - 243 points; Thursday - 326 points; Friday - 194 points; Monday - 191 points; Tuesday - 160 points; Wednesday - 133 points; Thursday - 188 points; Friday - 194 points; Monday - 134 points; Tuesday - 127 points; Wednesday - 136 points; Thursday - 147 points; Friday - 91 points; Monday - 67 points; Tuesday - 142 points; Wednesday - 72 points; Thursday - 110 points; Friday - 33 points; Monday - 74 points. The average daily indicator, relative to the dynamics of volatility is 104 points [see table of volatility at the end of the article]. Analyzing the past trading day, we see two main turns actively, where the first one fell in the morning from 6:00 - 6:30 [UTC+00], while the second one which had a more detailed structure fell from 7:30-15:00 [UTC+00 time on the trading terminal]. As discussed in a previous review, traders viewed Friday's accumulation as a possible acceleration, where long positions were not entirely successful, but selling positions brought a small, but still income. Considering the trading chart in general terms [the day period], we see a completely different picture, since there is not much of a slowdown, but what immediately catches the eye is the recovery relative to the inertia of 30.03.20-06.04.20. At this time, the rebound from the 1.0775 level was more than 190 points. The news background of the past day did not have statistical data, and trading volumes were reduced due to the lack of Europeans on the market who celebrated Bright Monday. In terms of the general informational background, we see that a strange shock from the coronavirus still persists among market participants, where not only catastrophic anti-records by the number of people infected in the world are actively discussed, but the consequences for the economy that have already manifested, or will appear in the very near future. Therefore, experts from JPMorgan predict that the COVID-19 virus will cost the world economy $ 5.5 trillion in the next two years. Thus, the current recession risks turning into the most acute peacetime recession since the 1930s. It is worth considering that although the recession will turn out to be local, it will take more than one year for the economy to recover at the pre-crisis level. Breaking news has already been received today. French President Emmanuel Macron has extended the country's restrictive measures to counter the coronavirus for another four weeks, until May 11, and does not exclude the possibility of quarantine lasting even longer. However, this news does not carry positive news. The single currency is losing its position. Today, in terms of the economic calendar, we do not have any worthwhile statistics, but one of the advantages can be noted that Europeans returned from a two-day weekend, thus trading volumes stabilized. Further development Analyzing the current trading chart, we see that the price fluctuation is carried out within the past amplitude [1.0893 / 1.0967], but at the same time, not forgetting the framework of the Friday fluctuation 1.0920-1.0950. In fact, the theory of the new variable range is in some way confirmed and now the main question is, when do we expect acceleration? It is not so simple, the economic calendar is empty and the external background remains the same saturation as the day before. The technical component reflects lateral movement, but in the event of a breakdown of a certain boundary of 1.0893 / 1.0967, acceleration can theoretically occur. It can be assumed that the fluctuation within the past range of 1.0893 / 1.0967 will hold back the quote temporarily, but it is best to build the work precisely on the breakdown of the set boundaries. Based on the above information, we derive trading recommendations: - We consider buying positions higher than 1.0970, with the prospect of a movement to 1.1000-1.1020 - We consider selling positions lower than 1.0890, with the prospect of a movement to 1.0850 Indicator analysis Analyzing a different sector of time frames (TF), we see that the indicators of technical instruments give a buy signal, but it should be taken into account that the minute and hour periods are under the pressure of lateral movement, hence the indicators are variable. The daily period also varies, but the purchase is neutral within the framework of the signals. Volatility per week / Measurement of volatility: Month; Quarter; Year Measurement of volatility reflects the average daily fluctuation calculated from Month / Quarter / Year. (April 14 was built taking into account the time of publication of the article) The volatility of the current time is 45 points, which is 56% lower than the daily average. It can be assumed that activity will still increase, but within the scope of the previous day. Key levels Resistance zones: 1,1000 ***; 1.1080 **; 1.1180; 1.1300; 1.1440; 1.1550; 1.1650 *; 1.1720 **; 1.1850 **; 1.2100 Support areas: 1.0850 **; 1.0775 *; 1.0650 (1.0636); 1.0500 ***; 1.0350 **; 1.0000 ***. * Periodic level ** Range Level *** Psychological level The material has been provided by InstaForex Company - www.instaforex.com |
| You are subscribed to email updates from Forex analysis review. To stop receiving these emails, you may unsubscribe now. | Email delivery powered by Google |
| Google, 1600 Amphitheatre Parkway, Mountain View, CA 94043, United States | |








No comments:
Post a Comment