Forex analysis review |
- Weekly analysis of Gold
- Weekly analysis on EURUSD
- EUR/USD and GBP/USD. Results of April 24. Bulls cannot, bears do not want. Boris Johnson will return to work next Monday
- EUR/USD: "semi-failed" EU summit, monthly low and greenback vulnerability
- Gold bulls aim victory
- COVID-19: A number of fundamental statistics indicate the dire consequences of COVID-19. The euro and pound will remain under
- April 24, 2020 : EUR/USD Intraday technical analysis and trade recommendations.
- April 24, 2020 : GBP/USD Intraday technical analysis and trade recommendations.
- Euro pulled a blanket over itself
- Evening review for April 24, 2020. Market to wait until Monday for US coronavirus reports
- Trading plan for Gold for April 24, 2020
- Trading plan for EURUSD for April 24, 2020
- EUR/USD and GBP/USD analysis on April 24. Demand for USD falling in late Friday ahead of Durable Goods Orders report
- Analysis for Gold 04.24.2020 - Main upward target at the price of $1.737 has been reached. Next upward target is set at
- EUR/USD analysis for 04.24.2020 - Fake breakout of the 20-day low and strong rejection. Buying opportunities are prefearble
- BTC analysis for 04.24.2020 - Strong reistance at the price of $7.800 is on the test. Watch for potential downside rotation
- EUR/USD: plan for the US session on April 24. The bears take their profits and the bulls try to return to the market
- GBP/USD: plan for the US session on April 24. The pound stubbornly does not want to go down and ignores another bad data
- EUR/USD: Euro continues to suffer while EU leaders decide how to save the economy
- Trading recommendations on GBP/USD for April 24, 2020
- Technical analysis and trading recommendations for CAD/CHF on April 24, 2020
- GBP/USD. April 24. Bears are regaining the initiative and are aiming to capture the level of 1.2303, which will allow selling
- Extended Sideways Movement On USD/JPY
- Technical Analysis of AUD / USD for April 24, 2020
- Technical analysis recommendations for EUR/USD and GBP/USD on April 24
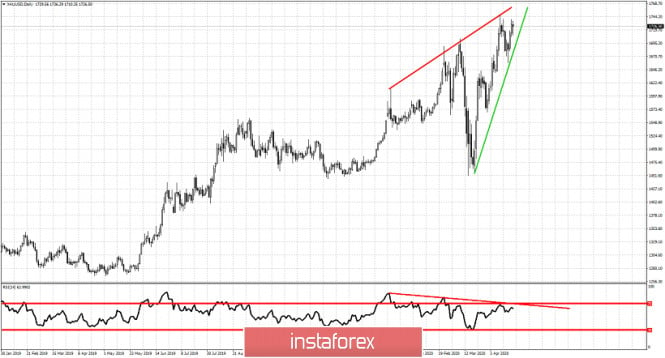
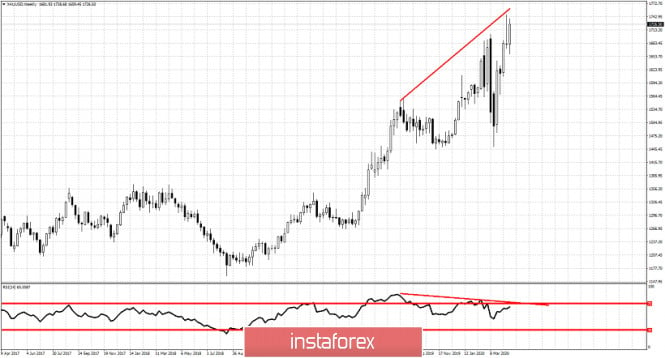
| Posted: 24 Apr 2020 02:46 PM PDT Gold price is near its 2020 highs. Trend remains bullish with no reversal signal. On the other hand, Gold is showing several important reversal warnings and that is why I prefer to be neutral if not bearish at current or higher levels as I expect the reversal to occur over the next weeks.
Green line - support Gold price remains in a bullish trend as long as it holds above the green trend line. Support is key at $1,690-$1,700. We also need to keep a close eye on the RSI. Another rejection at the red trend line would be a bearish reversal warning. Resistance is at $1.760.
|
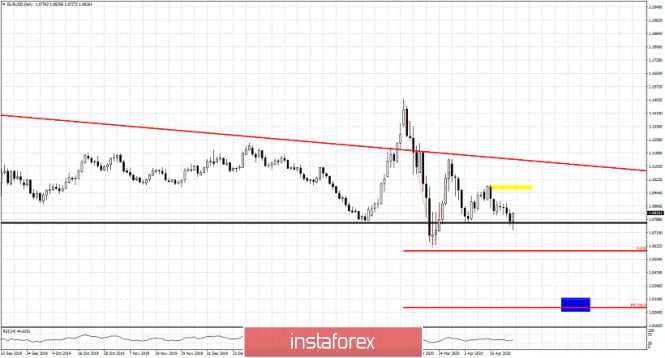
| Posted: 24 Apr 2020 02:38 PM PDT EURUSD had a negative week falling nearly half a percent relative to last week. During this week prices fell more than 1% below 1.08 towards lows 1.07 but on Friday prices bounced back up. Price has stopped the decline at crucial horizontal support.
Blue rectangle -target Yellow rectangle - resistance Red horizontal lines - Fibonacci expansions Black line - horizontal support EURUSD continues to make lower lows and lower highs. Trend remains bearish and I continue to expect price to move towards 1.06 if not lower. This past week price stopped right at the horizontal support at 1.0765. Bulls had a small victory since they managed to close price above this support level. Key resistance remains at 1.0980-1.0990. As long as price is below that level, the clear trend will remain bearish. The material has been provided by InstaForex Company - www.instaforex.com |
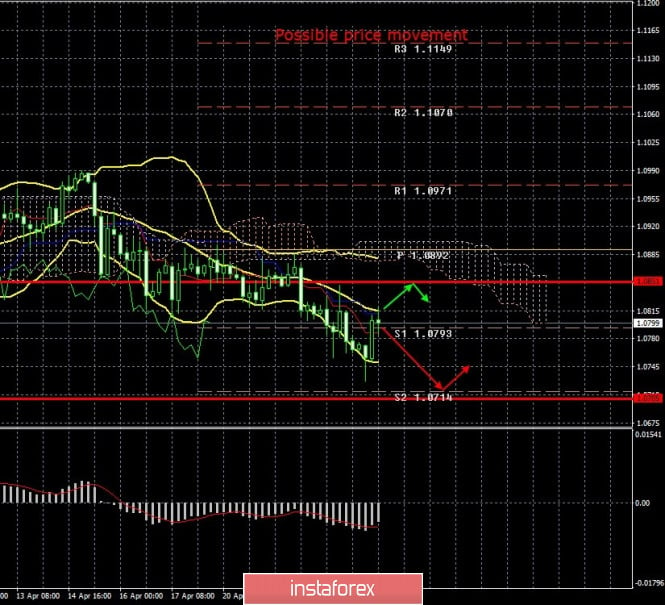
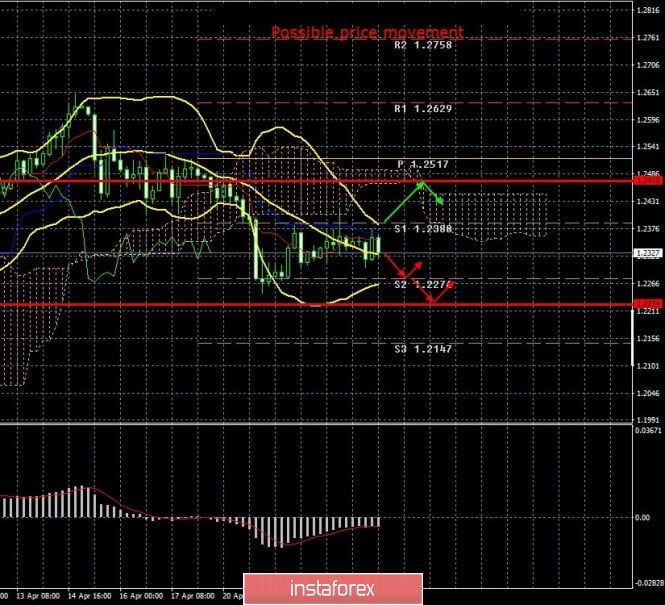
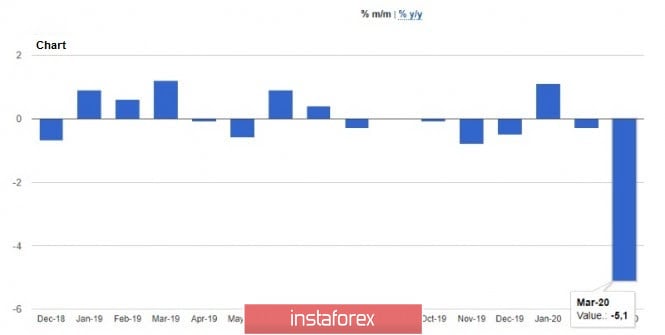
| Posted: 24 Apr 2020 12:24 PM PDT 4-hour timeframe Average volatility over the past five days: 73p (average). The EUR/USD pair spent the last trading day of the week in multidirectional trading. If the downward movement that had begun the day before had continued in the first half of the day, then a new round of upward correction began in the second. The downward trend persists for the euro/dollar pair. Trading is calm, therefore it is too early to talk about the second wave of panic. At the same time, it seems that the pair decided to implement the scenario with forming a downward trend, rather than a long consolidation in a narrow price range. The April 6 lows were updated today. At the moment, the quotes of the pair have grown to the critical line, a rebound from which can provoke a resumption of the downward movement. In principle, the movement against the trend is characteristic of the last day of the week; we wrote about this in previous reviews. It is explained by the desire of traders to take part of the profits before the weekend. However, there have been several important macroeconomic publications today, so should we understand why the correction began today? Market participants have finally begun to pay attention to macroeconomic statistics for purely technical factors. Judging by yesterday, traders continue to ignore any macroeconomic reports. The US dollar showed growth at the report on applications for unemployment benefits. This morning, IFO's insignificant and unnecessary reports on economic expectations, assessment of the current situation and business optimism in Germany were published. All three indicators were weaker than forecasts and previous values. However, traders did not expect this data on Friday, April 24. They were waiting for the US report on durable goods orders. This indicator has long been considered quite important for the US economy (it is not published in other countries). Durable goods are goods with a service life of at least three years. That is, household appliances, cars, machine tools, equipment and so on. Obviously, these products are quite expensive, therefore they require serious investments for their production, and consumers need serious investments for their purchase. The main indicator, which includes all categories of goods, decreased by 14.4% in March with a forecast of -11.9%. Orders for goods excluding defense fell even more by 15.8%. But, for example, orders excluding transport decreased by only 0.2%, and excluding defense and aviation, they showed an increase of 0.1% at forecasted values of -6%. Thus, two of the four indicators were worse than what traders expected, and the other two were better. Accordingly, we cannot make an unambiguous conclusion that statistics from across the ocean are positive or, conversely, negative. Another consumer confidence index from the University of Michigan was published, which slightly exceeded the forecast and March values, amounting to 71.8. However, this report is not included in the category that is considered significant. Thus, in general, according to today's statistics, it cannot be concluded whether markets have begun to respond to the macroeconomic background. We are inclined to the option that we did not start. If so, then nothing has changed for the euro/dollar currency pair this week. We advise you to continue paying increased attention to technical factors, not trying to guess the pair's reversals, based on news or any fundamental events. The panic seems to have subsided, volatility is normal. However, markets are far from behaving logically. The main concerns relate to the uncontrolled rise in the US currency, based on the faith of investors in this currency alone. 4-hour timeframe Average volatility over the past five days: 124p (high). The GBP/USD pair was indistinctly trading on April 24. Corrective movement formally continued and the pound/dollar worked out the critical Kijun-sen line. However, the same has been observed twice already in the last two days. Thus, by and large, the British currency moved sideways, not up. Accordingly, the downward trend is still in the market, as the price is below the Kijun-sen line. Bollinger Bands are also directed downward so far. However, doubts arise about the ability of the bears to continue to move the pair down. UK macroeconomic data turned out to be as disastrous as it was the day before in business activity, as disastrous as in other countries. As we have already said, there is nothing surprising in the extremely low values of almost all indicators for March and, especially, for April. All statistics on the outcome will have to answer only one main question - which country's economy will suffer most from the coronavirus pandemic. And the answer to this question can be extremely important for predicting the further movement of any pair. Retail sales in Britain in March decreased by 5.8% in annual terms and 5.1% in monthly terms. The forecasts were slightly better, but also predicted a rather strong fall. Thus, the statistics did not surprise market participants. The pound within a few hours after the publication of these data went down by around 30 points, which with an average volatility of 124 points looks completely unconvincing. Thus, in the case of the GBP/USD pair, we believe that economic reports did not affect the preferences of traders. At the same time, it became known that Boris Johnson would return to his duties on Monday, April 27. It is reported that the prime minister completely recovered from the coronavirus and did not use the advice of doctors who required about a month of complete rest for the head of state. It is also reported that Johnson has been working all last week, and will start meeting with ministers next week. The situation with the coronavirus in the UK, judging by the numbers, remains the same, but Health Minister Matt Hancock said that "the country is at its peak" and "social distance works." So far, there is no question of any quarantine cancellation, since it is necessary to achieve a consistent and regular daily reduction in the number of deaths from the epidemic. As well as the number of new cases. Recommendations for EUR/USD: For short positions: The EUR/USD pair began a new round of corrective movement and worked out the Kijun-sen line again on the 4-hour timeframe. Thus, sell orders remain relevant now, but we recommend waiting for a rebound from the Kijun-sen line and selling the euro while aiming for the support level of 1.0714 (to be specified at the beginning of next week). For long positions: It is recommended to return to euro purchases only when the price has consolidated above the critical line by small lots with the first goal of the Senkou Span B line Recommendations for GBP/USD: For short positions: The pound/dollar continues the upward correction, which could end near the Kijun-sen line. Thus, traders are advised to sell the pound again with targets at 1.2276 and 1.2205 if a rebound occurs from the critical line with the MACD indicator turning down. For long positions: It is recommended to consider new purchases of the GBP/USD pair not before you consolidate the price above the Kijun-sen line in small lots with the first goal of a volatility level of 1.2472. The material has been provided by InstaForex Company - www.instaforex.com |
| EUR/USD: "semi-failed" EU summit, monthly low and greenback vulnerability Posted: 24 Apr 2020 12:24 PM PDT The bears of the EUR/USD pair completed the "minimum program" this week: firstly, after a two-week siege, it consolidated below 1.0850, and secondly, updated its four-week low at 1.0727 exactly a month ago, on March 24. Despite the general bearish mood for the pair, it was not easy for sellers to win each point. Buyers often take the initiative and buy back EUR/USD at lows, thus provoking a corrective growth. The former excitement around the US currency is no longer on the market – the pair is falling mainly due to the euro's weakness. The dollar index this week did not leave the boundaries of the hundredth figure – that is, on the one hand, investors have not lost interest in this currency, but on the other hand, the dollar has recently been in high demand only when there are spikes in anti-risk sentiment. Therefore, the main culprit of the bearish celebration for the pair is the euro – while the dollar plays a secondary role here. Why is the European currency, against the background of the passivity of the dollar, unable to show character and organize large-scale correctional growth? There were several prerequisites for a similar price spurt this week, but they did not materialize. For example, fairly good reports from the ZEW Institute were published at the beginning of the week. Despite the pessimistic forecast, the indicators came out in the green zone. In particular, the mood index in the business environment, instead of falling to around -40 points, dropped to only 28. This result inspired the EUR/USD bulls and the pair to test the ninth figure. But this optimism was offset when the PMI indices were published on Thursday. The indicators turned out to be much worse than forecasted values, and they even recorded historical anti-records in the service sector. For example, the German indicator in this sector of the economy collapsed to 15.9 points in April, and the pan-European one to 11 points. Similar indices in France showed the same result - the business activity index in the services sector there also updated the anti-record, dropping to 10 points. However, the EUR/USD bears failed to consolidate their success yesterday, as German Chancellor Angela Merkel voiced an optimistic statement regarding the possible outcome of an online summit of EU leaders. As it turned out, this optimism was premature. The results of the above summit disappointed investors. On the one hand, European leaders have approved a program of assistance worth 540 billion euros. But, firstly, this fundamental factor was "played back" a week and a half ago, and secondly, traders expected more from this meeting. In addition, ECB President Christine Lagarde and French President Emmanuel Macron voiced quite pessimistic rhetoric, the essence of which is that Europe is too slow and insufficient to respond to the challenges of the epidemic. Actually, the results of yesterday's summit were an additional confirmation of these words: leaders of the EU countries could not agree on a long-term plan for economic recovery in the eurozone, the amount of assistance under which could reach from one to one and a half trillion euros. In fact, European leaders have put this question "on the back burner" - they instructed the European Commission to work out the details of the economic recovery plan for the next meeting of the Eurogroup, which will take place in a few weeks. According to experts, even if this plan is agreed, it will not be earlier than June. And although this time the meeting was held without emotional accusations of Italians against Berlin and Brussels, the problem itself remained unresolved. Germany and the neighboring countries of the north (the Netherlands, Finland, Estonia, and some others) propose the use of the European stabilization mechanism, while the countries of the south (primarily France, Italy and Spain) still require crown bonds to be issued. Italian politicians have repeatedly stated that they do not want to go the Greek way - "money in exchange for austerity measures." Against the background of such contradictions and rather indistinctive results of the summit, the euro-dollar pair not only returned to the seventh figure, but also updated the monthly low. Christine Lagarde added fuel to the fire by saying that the decline in the eurozone economy as a result of the pandemic could be up to 15% this year. This decline is an unprecedented indicator in the history of the European Union. The pair could not gain a foothold at the bottom of the seventh figure despite such a negative fundamental background for the euro. Having updated the low, the price returned to the borders of the eighth price level. Correctional growth was due to a general weakening of the US currency - the dollar index shows a negative mood in the second half of the day. All this suggests that not only do the bears need a weak euro, but also a strong dollar in order to continue the downward trend. However, as mentioned above, the US currency is in demand only when there is a surge in anti-risk sentiment, while US national statistics only put pressure on the greenback (for example, the volume of orders for durable goods collapsed immediately in March by 14%). Thus, the EUR/USD traders seem to have formed low at the bottom of the seventh figure this week. Bears need a very good news item to overcome the 1.0727 mark, or a general (and significant) increase in the anti-risk sentiment. A strong support level is the mark of 1.0700 (the lower line of the Bollinger Bands indicator on the weekly chart). As for trading decisions, when approaching the bottom of the seventh figure, one can consider long positions with a correctional target of 1.0890 (the middle line of the Bollinger Bands indicator, which coincides with the Kijun-sen line on D1). "Playing for a fall" is quite risky: bears within the seventh figure now feel a certain discomfort, while buyers are quite active on price downturns. The material has been provided by InstaForex Company - www.instaforex.com |
| Posted: 24 Apr 2020 08:11 AM PDT
An unprecedented spur from the White House and the Fed spawned a new bullish rally in the US stock market. The recent bearish phase lasted for only three weeks. However, a rise in gold to near all-time highs, along with declining treasuries and a collapse in oil prices, as well as the worst condition of the American labor market since the Great Depression, may signal a precipitate stock rally. In current conditions, gold is in demand due to lower opportunity cost, falling real rates in the United States, and the influx of investments in "gold" ETFs. Even temporary problems with the physical supply of precious metals are a short-term supporting factor. Moreover, the synchronous dynamics of gold and the US stock market should not be surprising. If in March investors actively sold precious metals amid the collapse of the S&P 500 index in order to maintain open positions in securities, then in April cautious optimism will return to the markets, caused by large-scale incentives from the Fed and the White House, as well as hopes for an early "opening" of the American economics. Investors buy stocks with the expectation that stock indices will recover faster than national GDP. At the same time, they do not forget about precious metals, the acquisition of which is an excellent opportunity to ensure financial risks arising from the current uncertainty. Last week, the gold exchange rate reached its highest level since 2012, rising above $ 1,780 per ounce. As a result of the correction that followed, a model for continuing the movement in the form of a falling flag was formed, that is, the market took a break and watches how new bulls pick up the banner from the initial buyers, who take profits. It is assumed that in the short term, due to the consolidation of US stock indexes, gold will find shelter in the trading range of $ 1,635–1,775 per ounce. As for the more distant prospects, the precious metal may well break the record of nine years ago (assuming that the scale of the Fed's monetary expansion is now significantly larger than in the aftermath of the 2008-2009 crisis). To do this, the bulls in gold will need to overcome two important milestones: $ 1,850 and $ 1,825 per ounce. The material has been provided by InstaForex Company - www.instaforex.com |
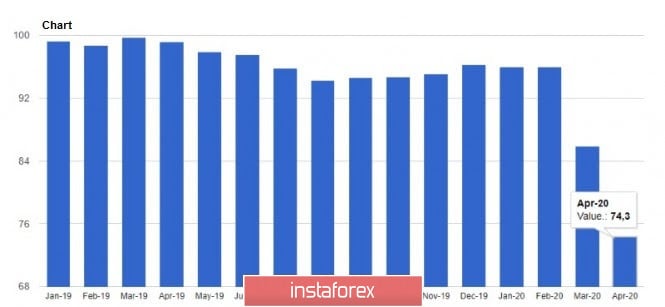
| Posted: 24 Apr 2020 08:07 AM PDT Despite a large reduction in the indicator of the German business environment in April this year, the euro managed to partially recover its position against the US dollar after the morning fall, which continued after yesterday's results of the EU summit. Let me remind you that the results of the meeting of EU leaders again failed to reach a common agreement on the need to create national bonds, which will help to attract more significant amounts necessary to save European countries from the crisis associated with the spread of coronavirus. Today's data on the Ifo index was another proof of the sad state of the German economy, which is gradually sliding down. The leading indicator of business sentiment in the Ifo in April fell much more strongly than economists had predicted, amounting to 74.3 points, which is a historical low. Economists have already calculated that such a sharp drop in the index indicates the probability of a 5% drop in German GDP in the 2nd quarter of this year. Another problem is the fact that no one can give at least a general forecast for the recovery of the index since the European economy remains paralyzed due to the quarantine, the weakening of which is not yet expected. Earlier removal of quarantine measures to revive the economy is fraught with a new outbreak of the pandemic, which may lead to the collapse of the entire financial system. Economists had expected the index to fall only to 80 points from 85.9 points in March this year. The index suffered the most because of a record fall in the current conditions indicator, which collapsed in April to 79.5 points from 92.9 points in March, while economists expected the indicator to be at 80.8 points. The expectations index fell to 69.4 points from 79.5 points in March. It is worth noting that the indicator is calculated based on a survey of more than 9,000 German companies that are involved in the manufacturing sector, services, trade, and construction. Against this background, the measures taken by the European Commission, as well as the launch of a long-term stabilization aid fund, do not look so premature as, in fact, the release of coronabond funds, which will help finance economies that are on the verge of a crisis due to the spread of falls. Hence the increase in interest rates on government bonds of Italy, Spain, and other countries, as investors require a higher risk premium. The current yield on 10-year Italian government bonds is 2.076%, while the yield on German securities remains negative at -0.465%. Economists' forecasts for the growth rate of the Italian economy further push major players away from the debt market. For example, Citi expects that in 2020, the Italian economy will fall by more than 10.4%, and measures related to curbing the spread of the coronavirus will remain longer than expected. The measures taken by the authorities may inflate the Italian budget deficit to 8% of GDP, and the debt-to-GDP ratio will approach 160% from the current level of 135%. Against this background, the reaction of traders to the sale of the European currency is quite understandable, but the sharp intraday market reversal after the Ifo reports is rather associated with a speculative moment and is unlikely to be of serious significance in the medium term. GBPUSD The British pound, meanwhile, continues to remain under pressure in pair with the US dollar, but today's report on the collapse of retail sales was ignored by the market, as well as yesterday's indicators on activity in the service sector. This indicates that investors are ready for such data, and the further direction of the market will depend more on the monetary and fiscal policy of the government. Any help will have a positive impact on the British pound in the medium term, as it will help create earlier conditions for getting out of the crisis peak. The main thing, in this case, is not to overdo it. The report indicated that in March compared to February 2020, retail sales in the UK fell immediately by 5.1%, but economists had expected a worse scenario and a decline of more than 6.0%. However, given the quarantine measures and the economic freeze, this drop is only the tip of the iceberg. Based on expectations, retail sales will decrease by 20-30% in April. It is worth noting that the drop was recorded in all categories at once, except for food products. Based on these indicators, it is likely that in the 2nd quarter the economy may decline by 25% at once, in general, it is expected to decline by 9.3% over the year. However, much will depend on how long the regime of isolation and social distance continues. From a technical point of view, nothing has changed in the short term for the GBPUSD pair. Traders continue to trade the level of 1.2340, which will be the main push. And most likely, the downward movement will continue, since nothing good can be expected from macroeconomic statistics, and the end of the coronavirus epidemic is not yet expected. The nearest support levels are seen around 1.2250 and 1.2170. Growth will be limited by the large resistance of 1.2415, where the bears showed themselves in all their glory yesterday. However, even rise above this range will only allow the bulls to reach a maximum of 1.2480. The material has been provided by InstaForex Company - www.instaforex.com |
| April 24, 2020 : EUR/USD Intraday technical analysis and trade recommendations. Posted: 24 Apr 2020 08:05 AM PDT
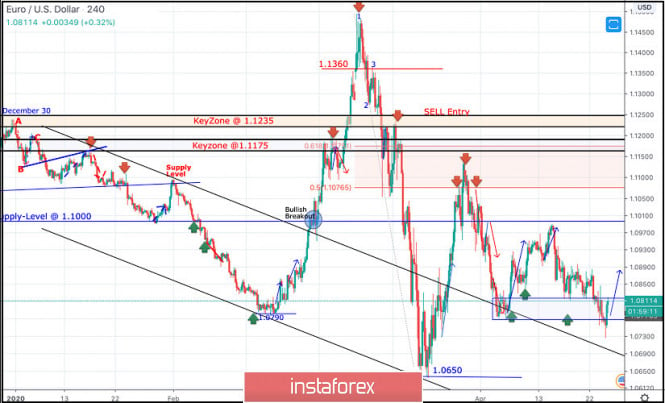
Since December 30, the EURUSD pair has trended-down within the depicted bearish channel until the depicted two successive Bottoms were established around 1.0790 then 1.0650 where the EUR/USD pair looked OVERSOLD after such extensive bearish decline. Few weeks ago, the EURUSD pair has expressed significant bullish recovery around the newly-established bottom around 1.0650. The following bullish engulfing H4 candlesticks as well as the recently-demonstrated ascending bottoms indicated a high probability bullish pullback at least towards 1.0980 and 1.1075 (Fibonacci Level 50%). Key Supply-Levels in confluence with significant Fibonacci levels are located around 1.1075 (50% Fibonacci) and 1.1175 (61.8% Fibonacci) where bearish rejection was highly-expected upon the latest bullish pullback that took place by the end of March. That was when the depicted Head & Shoulders pattern was demonstrated around the price levels of (1.1000 - 1.1075). Shortly after, further bearish decline was demonstrated towards 1.0800 where the nearest demand level to be considered was located near the backside of the broken channel (1.0800-1.0750). Early signs of Bullish rejection have been manifested around the price zone of (1.0800-1.0750) leading to the recent bullish spike up to 1.0990. The short-term technical bullish outlook remains valid as long as bullish persistence is maintained above the recently-established ascending Bottom around 1.0770. Further bullish advancement is expected to pursue towards 1.1000, 1.1075 then 1.1175 where 61.8% Fibonacci Level is located. Despite the recent bearish decline, the price zone of (1.0815 - 1.0775) stood as a prominent Demand Zone which has been providing bullish support for the pair. On the other hand, Please note that any bearish breakout below 1.0830 or 1.0770 (the recently established bottoms) invalidates the previously-mentioned bullish outlook. Trade recommendations : Intraday traders should be looking for valid short-term BUY trades around the price zone of 1.0815 - 1.0775. S/L to be placed below 1.0725 while T/P levels to be located around 1.0850, 1.0900 and 1.1075. The material has been provided by InstaForex Company - www.instaforex.com |
| April 24, 2020 : GBP/USD Intraday technical analysis and trade recommendations. Posted: 24 Apr 2020 07:16 AM PDT
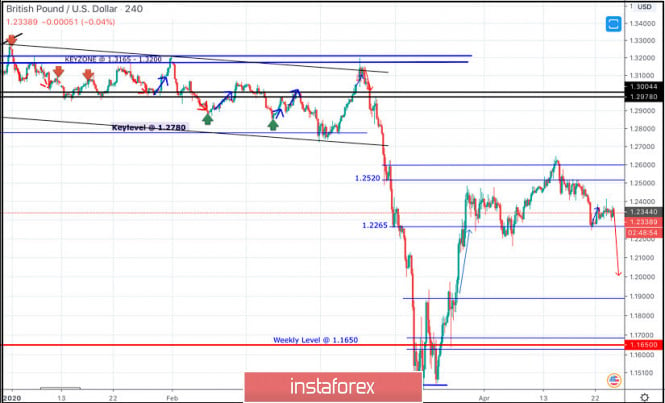
Recently, the GBPUSD has reached new LOW price levels around 1.1450, slightly below the historical low (1.1650) achieved in September 2016. That's when the pair looked very OVERSOLD around the price levels of 1.1450 where a double-bottom reversal pattern was recently demonstrated as depicted on the chart. Technical outlook will probably remain bullish if bullish persistence is maintained above 1.1890-1.1900 (Double-Bottom Neckline) on the H4 Charts. Bullish breakout above 1.1900 invalidated the bearish scenario temporarily & enabled a quick bullish movement to occur towards 1.2260. Next bullish targets around 1.2520 and 1.2680 were expected to be addressed if sufficient bullish momentum was maintained. However, early bearish pressure signs have originated around 1.2470 leading to the previous bearish decline towards 1.2265. That's why, H4 Candlestick re-closure below 1.2265 was needed to hinder further bullish advancement and enhance the bearish momentum on the short term. On the other hand, the recent bullish persistence above 1.2265 has enhanced another bullish pullback movement up to the price levels of 1.2520-1.2590 where early signs of bearish rejection were manifested. A Bearish Head & Shoulders reversal pattern may be in progress. That's why, the current bearish decline below 1.2520 is probably enhancing the bearish reversal scenario. Bearish persistence below 1.2265 (Reversal Pattern Neckline) is needed to enhance another bearish movement towards 1.2100, 1.2000 then 1.1920 where price action should be evaluated again. Trade recommendations : Conservative traders should be looking for bearish breakout below 1.2265 as a valid SELL entry. T/P level to be located around 1.2100, 1.2000 then 1.1920 while S/L should be placed above 1.2400. The material has been provided by InstaForex Company - www.instaforex.com |
| Euro pulled a blanket over itself Posted: 24 Apr 2020 07:02 AM PDT The oil was shocked by falling below zero after the US stock indices stopped growing. Meanwhile, Donald Trump began to praise the strong dollar instead of criticizing it. The "bears" for EUR/USD came out of hibernation. However, their forces were only enough to test support at 1.08-1.081, but this can already be considered a success against the background of increasing rumors about the long-term problems of the "American". The growth of the budget deficit to $3.8 trillion, the increase in the share of government debt in GDP to the highest levels since 1946, and the Federal reserve balance to $9-12 trillion create serious problems for fans of the USD index. However, the dollar feels confident. Although Donald Trump was often ignored when he spoke about the need to reduce the federal funds rate and weaken the US currency, nevertheless, his verbal interventions had the effect of a bombshell. Before the current owner of the White House, US presidents tried not to interfere in the life of forex, so the behavior of the 45th head of state surprised investors. Then they got used to it and ignored Trump's angry speeches. Nevertheless, the administration's return to the policy of a strong dollar could not go unnoticed. A fall in WTI below zero and a rise in the number of applications for unemployment benefits to more than 26 million over the past 5 weeks have returned interest in safe-haven assets. The "American", the yen and gold feel like fish in water in the face of uncertainty and a global recession. At the same time, the worse the situation in the sphere of international trade, the stronger will be the position of the US dollar. It is not difficult to assume that the tense epidemiological situation will not disappear quickly, which negatively affects external demand for goods and international trade. The fall in EUR/USD quotes was caused not only by increased demand for reliable assets but also by expectations of an expansion of the ECB's stimulus package at the April 30 meeting, as well as growing risks of Eurozone fragmentation. The meeting of the European Central Bank will be the key event of the week by May 1 on Forex. It is sure to eclipse the video conferences of the Fed and the Bank of Japan. Jerome Powell is unlikely to report anything new, and Haruhiko Kuroda's potential announcement of unlimited asset purchases will not surprise anyone. It will be formal in terms of targeting the yield curve. Another thing is Christine Lagarde. According to 27% of Bloomberg experts, the ECB will expand the scope of QE by at least €500 billion in April, although most experts expect it to be active by September. The emergency quantitative easing program is likely to run until March 2021. Technically, the exit of EUR/USD from the "Rhombus" pattern, as expected, led to a drop in quotes. If the April minimum is updated, the risks of continuing the peak to 1.065 and 1.05 will increase, which will allow holding the previously formed shorts. On the contrary, a return of the pair above 1.09 will return to the market the idea of implementing a 127.2% target on the AB=CD pattern (it is located near the 1.125 mark) and will become the basis for opening long positions. The material has been provided by InstaForex Company - www.instaforex.com |
| Evening review for April 24, 2020. Market to wait until Monday for US coronavirus reports Posted: 24 Apr 2020 06:23 AM PDT
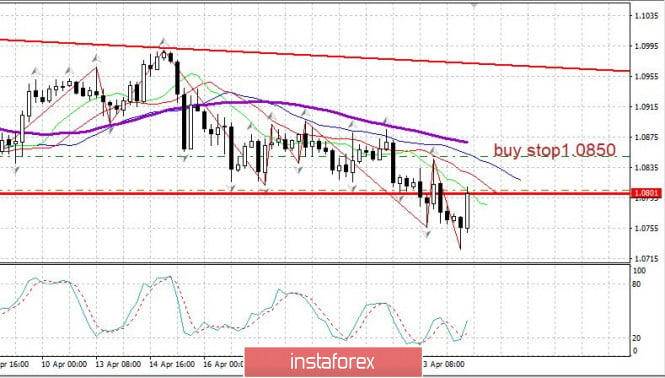
The euro slowly fell, making strong bounces up. A large package of support measures from the ECB is expected until next week. The market will not surprise investors with strong movements at the end of the week. Over the weekend, important data regarding the situation of the coronavirus in the US will be collected. This is to track if whether there is a decrease in the number of deaths per day, as well as the number of infected cases. At present, the measures taken seem to remain less effective, and slow, every day there are almost 3,2000 newly reported cases, while the death toll reaches at approximately 2,500. The total number of infected cases have already reached 900 thousand. The collected data on the virus will show the prospects of opening the economy in the United States. EURUSD: Be ready to buy from 1.0850. There is no level for sales yet. The material has been provided by InstaForex Company - www.instaforex.com |
| Trading plan for Gold for April 24, 2020 Posted: 24 Apr 2020 06:05 AM PDT
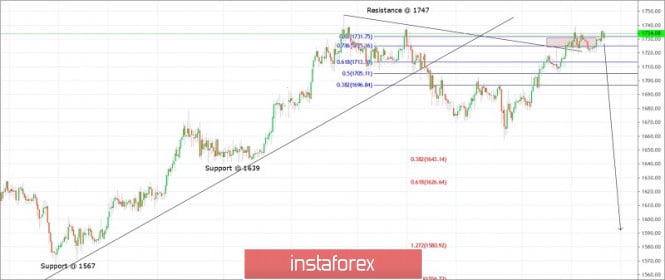
Technical outlook: Gold had reached up to $1,736.00 levels intraday, before pulling back lower again. The yellow metal is seen to be trading around $1,731.00 levels at this point in writing and is expected to continue dropping lower towards $1,626.00 and further. Please note the fibonacci 0.786 retracement of previous drop has been reached and a bearish reaction should be underway from current levels. Immediate resistance is seen at $1,747, while support comes in around $1,704 respectively. A break below $1704 and $1,680 levels would confirm a bearish reversal towards $1,625 and $1,580 as highlighted on the chart view here. On the flip side, if Gold prices manage to break above $1,747, it would nullify the recent bearish structure. But it should be noted that upside remains limited and one should avoid taking long positions. Trading plan: Remain short with stop above $1,747, target is $1,625 and lower. Good luck! The material has been provided by InstaForex Company - www.instaforex.com |
| Trading plan for EURUSD for April 24, 2020 Posted: 24 Apr 2020 05:43 AM PDT
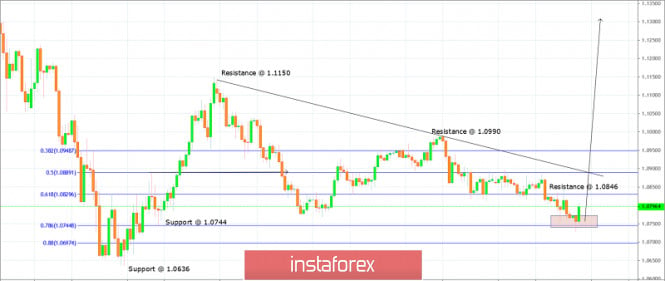
Technical outlook: EURUSD has dropped to 1.0727/30 levels today before reversing sharply. The pair moved up by almost 80 pips from today's low. It is trading around 1.0810 at this point in writing. Please note the rectangle box marked on the chart since yesterday; it is Fibonacci 0.786 retracement of the previous rally from 1.0636 lows through 1.1150 intermediary highs. The overall outlook still remains bullish with the price producing Morning Star candlestick pattern at this moment. The pair is expected to hold above 1.0636 support. Immediate resistance is seen at 1.0846 level, while support is around 1.0636 respectively. The pair may rise to 1.1500 level in the next few weeks time. Trading plan: Remain long with stop at 1.0636, target is 1.1500. Good luck! The material has been provided by InstaForex Company - www.instaforex.com |
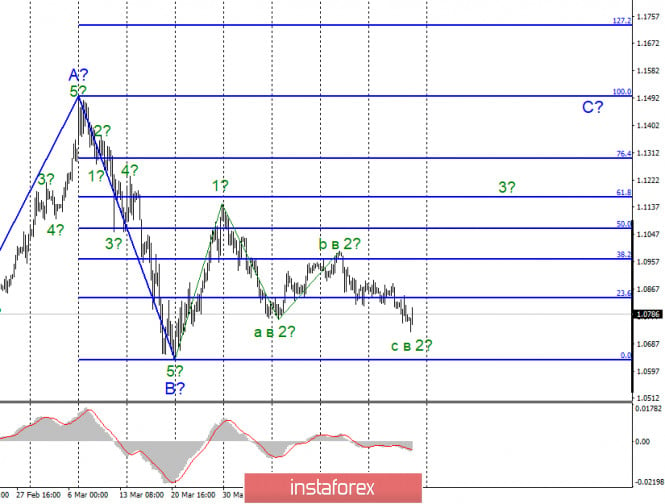
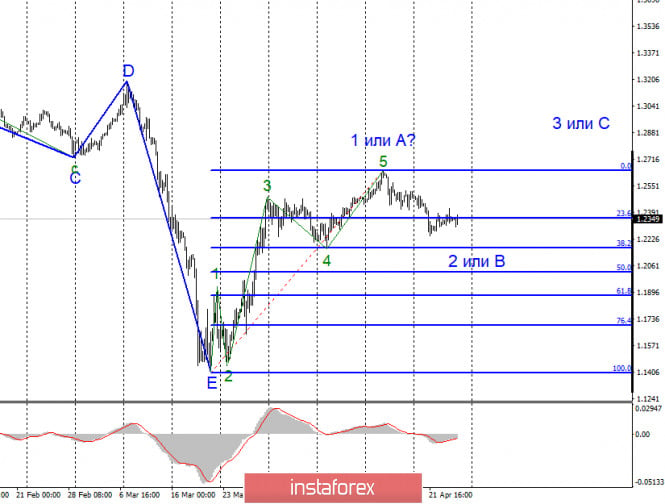
| Posted: 24 Apr 2020 05:41 AM PDT EUR/USD On April 23, the EUR/USD pair lost about 50 basis points. Today, it continues to form the complex wave 2 which later takes the form of three waves. If this assumption is correct, the quotes are expected to rise in the near future with the target at 11th figure within the wave 3. However, the reluctance of the market to start buying the euro is a little alarming. In case new background emerges or a new wave of panic hits the market, we will need to make some adjustments to the current wave pattern. Fundamental factors: The news background for the EUR/USD pair is quite controversial today. Yesterday, during the EU summit, its participants failed to reach an agreement on a new stimulus package aimed at supporting the economy. Thus, the demand for the European currency declined slightly in early Friday. But in general, the euro was not hit hard by this news. Now the markets are waiting for an important report on durable goods orders in the US which is likely to be rather disappointing. Markets may have lowered the demand for the American currency, anticipating the weak statistics. Reports on business activity in the services and production sectors in the EU and the US were also released yesterday. The reports were pessimistic and failed to provide any support both to the dollar and the euro. Another report on initial jobless claims was issued in the US showing that 4.4 million people applied for the unemployment benefits. According to the wave analysis, the euro/dollar pair is expected to rise in the short term. Besides, the greenback's rally is unlikely to continue amid the current background. The situation with the coronavirus in the EU and the US does not show any signs of improvement. Despite some statements that the epidemic is slowing down and the quarantine measures are eased, the overall number of cases and deaths from the pandemic continues to rise. Conclusion and recommendations: The euro/dollar pair continues to form the estimated upward wave C. Thus, now I recommend buying the instrument with a MACD buy signal with the targets at the levels of 1.1165 and 1.1295 which correspond to the 61.8% and 76.4% Fibonacci levels. I recommend placing Stop Loss orders under the low of the wave 2. The wave 2 has already formed its complex internal structure. GBP/USD On April 23, the GBP/USD pair gained just a few basis points. According to the current wave marking, the formation of the wave 2 or B continues with the targets at the 38.2% and 50.0% Fibonacci levels. This wave can take a distinguished three-wave form. After this pattern is completed, I expect the quotes to resume growth within the framework of wave 3 or C of the upward trend section. So far, there are no signs that the formation of the wave will be completed soon. Fundamental factors: The news background for the GBP/USD pair on April 23 was rather weak. The British reports on business activity were just as weak as the European and the American ones. This morning, the data on the UK retail sales in March was released. The results turned out to be much worse than in the previous month. The demand for the British pound is rather moderate now but not due to the news. On the other hand, the demand for the currency is even lower in the US. The pair should finally find a direction to move further. General conclusion and recommendations: The pound/dollar pair has probably completed the construction of the first wave of a new upward trend. I recommend selling the pound with the targets at 22 and 21 in order to form the correctional wave 2 or B. Otherwise, we can wait until the wave is formed and then open buy positions at the beginning of the upward wave 3 or C. The material has been provided by InstaForex Company - www.instaforex.com |
| Posted: 24 Apr 2020 04:55 AM PDT News:
As lunch approaches, Europe's stock markets are still slightly lower today.
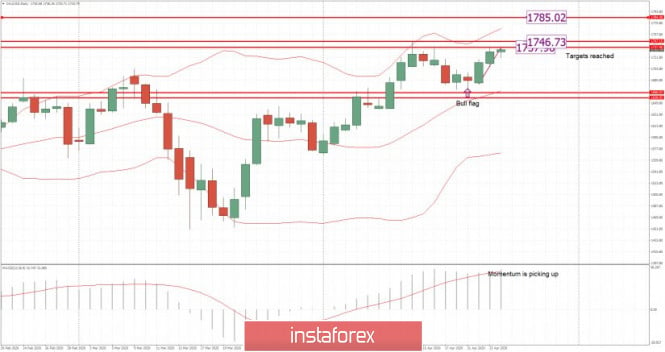
As things stand, through, the FTSE 100 is on track to end the week broadly unchanged. It fell sharply on Tuesday after oil prices buckled, but recovered on Wednesday. . Technical analysis: Technical analysis: Gold been trading upwards as I expected yesterday. The Gold reached our short-term upward target at the price of $1,737 and is heading to test our second target at the prrice of $1,746 The material has been provided by InstaForex Company - www.instaforex.com |
| Posted: 24 Apr 2020 04:48 AM PDT Corona virus news EU:
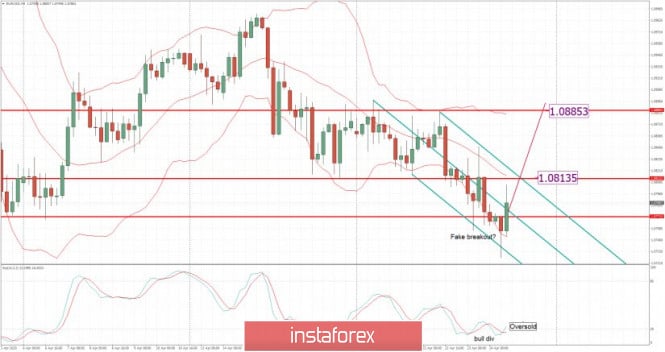
Officials had insisted until recent days that travel restrictions would remain for the foreseeable future, with the country's president, Milos Zeman, suggesting last weekend that frontiers should stay closed for the next year. Technical analysis: EUR has been trading sideways at the price of 1,0800. Most recently, the EUR did create fake breakout of the 20-day low at the price of 1,0770 and in my opinion opened the door for further upside movement. Trading recommendation: Watch for buying opportunities on the dips with the upper targets at the price of 1,0815 and 1,0885. Stochastic oscillator is showing bullish divergence and the oversold condition, which is another good sign for the further upside movement. Resistance levels are set at the price of 1,0815 and 1,0885. The material has been provided by InstaForex Company - www.instaforex.com |
| Posted: 24 Apr 2020 04:41 AM PDT Corona virus news US:
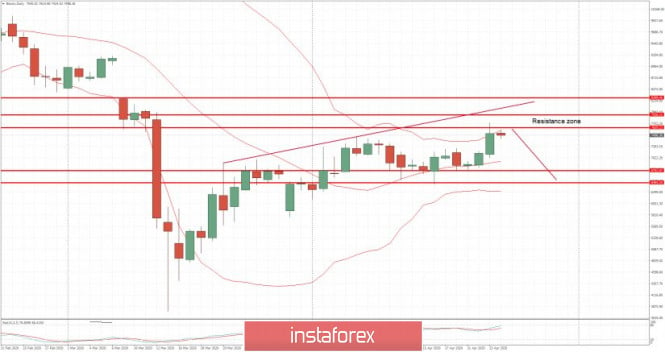
The House approved a $484bn coronavirus relief bill, which the president said he would sign into law. The package would boost a depleted loan program for Technical analysis: BTC has been trading upwards. The price is tested and rejected of the strong resistance at the level of $7,800. My advice is to watch for potential downside rotation towards the levels at $6,750 and $6,500. Trading recommendation: Watch for selling opportunities at the strong resistance zone around $8,000 mark. Any bear divergence or reversal pattern on the 60 minute time frame or 4H time-frame may confirm downside rotation. Downward targets are set at the price of $6,750 and $6,500. Resistance levels are set at the price of $7,800-$8,000 Support level is set at 6,750 and $6,500. The material has been provided by InstaForex Company - www.instaforex.com |
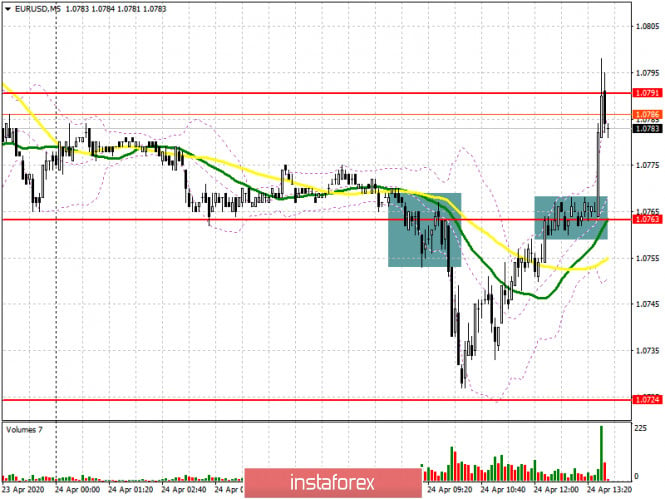
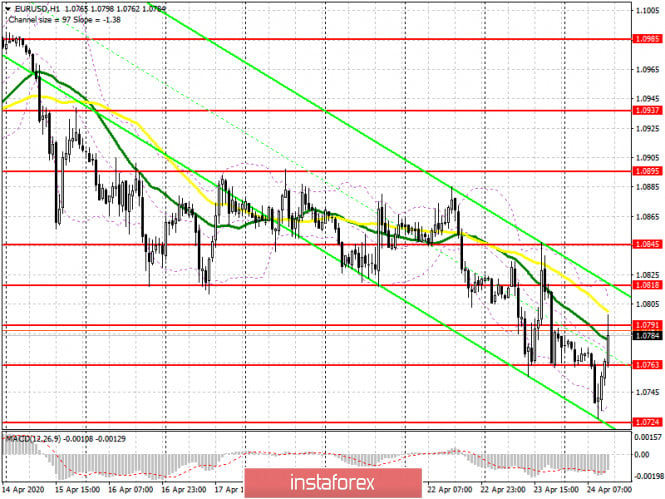
| Posted: 24 Apr 2020 04:13 AM PDT To open long positions on EURUSD, you need: A breakdown of the support of 1.0763 and consolidation below this range, which is clearly visible on the 5-minute chart, led to a decrease in the European currency, which I paid attention to in the morning forecast, and where I recommended opening short positions. Unfortunately, the bears did not reach their target around 1.0718 and left the market after a weak report on the state of the German economy, which continues to decline at a very rapid pace. The current growth of the euro can be attributed to profit-taking at the end of the week after the analysis of the final EU summit. At the moment, the bulls have returned to the level of 1.0763, from where purchases continued in larger volumes, which is also clearly visible on the 5-minute chart. The current task of the bulls will be a breakthrough and consolidation above the resistance of 1.0791, the first test that has already taken place, which will only increase demand for EUR/USD and will update the highs of 1.0818 and 1.0845, where I recommend taking the profit. Another false breakout formation in the support area of 1.0763 will also be a signal to open long positions. If there is no activity at this level, it is best to postpone long positions immediately to rebound from this week's low around 1.0725.
To open short positions on EURUSD, you need: Sellers coped well with the morning task and continued to fall the euro, which I discussed in detail in my review. However, the rapid market reversal has already led to a resistance test of 1.0791, where new active sales are visible. Before opening short positions from this level, it is best to wait for the formation of a false breakout. If there is no active downward movement from this resistance, I recommend waiting for the update of the larger levels of 1.0818 and 1.0845 and opening short positions from there immediately for a rebound in the expectation of an intraday correction of 30-40 points. An equally important task for sellers will be to return EUR/USD to the support of 1.0763, which will again increase pressure on the euro and lead to an update of the weekly low in the area of 1.0724, as well as maintain the downward trend.
Signals of indicators: Moving averages Trading is below the 30 and 50 daily moving averages, which indicates a further fall in the euro. Note: The period and prices of moving averages are considered by the author on the hourly chart H1 and differ from the general definition of the classic daily moving averages on the daily chart D1. Bollinger Bands In the case of an upward correction, the upper limit of the indicator around 1.0805 will act as a resistance. Description of indicators
|
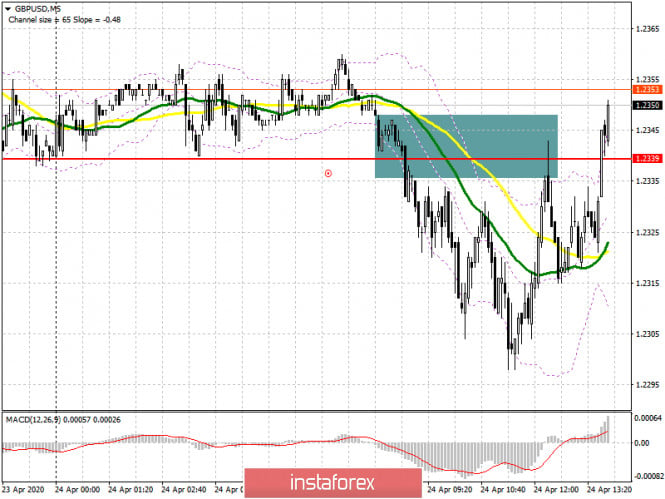
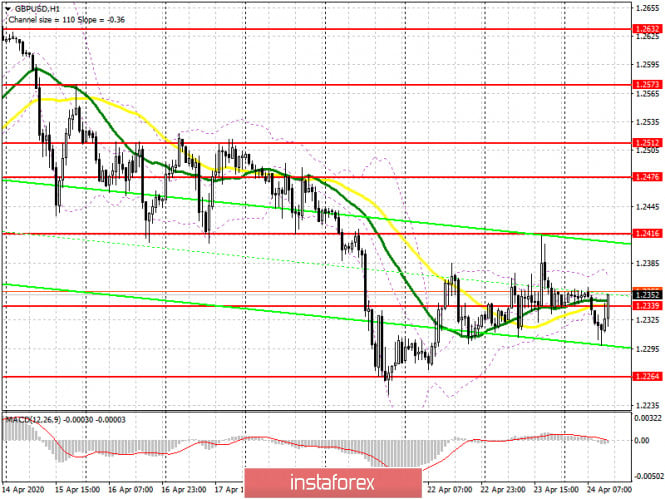
| Posted: 24 Apr 2020 04:12 AM PDT To open long positions on GBPUSD, you need: The report on retail sales in the UK was ignored by traders, although the bears tried to resume the downward trend, fixing below the level of 1.2339 in the first half of the day, which is clearly visible on the 5-minute chart. Even with the second test of this resistance from the bottom up, sellers acted actively, intending to update the minimum of 1.2264, but the market did not go below the lows of yesterday. At the moment, the bulls have regained the level of 1.2339, and while trading will be above this range, we can expect the upward correction to continue to the resistance area of 1.2416 and then test the maximum of 1.2476, where I recommend taking the prof. In the scenario of a repeated return of GBP/USD under the support of 1.2339, it is best to look at long positions only for a rebound from the weekly low in the area of 1.2264, and then, counting on the upward correction of 30-40 points within the day.
To open short positions on GBPUSD, you need: Sellers tried several times to resume the bearish trend below the level of 1.2339, taking advantage of a poor report on retail sales in the UK, which saw a decline of more than 5.0%. However, it was not possible to achieve a major fall in the pound again, which calls into question the strength of the bearish trend formed since mid-April this year. In the second half of the day, it is best to consider new short positions only after the bears once again push the pair under the support of 1.2339, and consolidate below it. Only then can we expect a repeated decline in GBP/USD to the area of the minimum of 1.2264 and a larger fall of the pair to the support of 1.2173, where I recommend fixing the profits. In the GBP/USD growth scenario, you can return to short positions after testing the maximum of 1.2416, or even higher, from the major resistance of 1.2476, counting on correction of 30-40 points within the day.
Signals of indicators: Moving averages Trading is conducted around 30 and 50 daily averages, which indicates market uncertainty with the future direction. Note: The period and prices of moving averages are considered by the author on the hourly chart H1 and differ from the general definition of the classic daily moving averages on the daily chart D1. Bollinger Bands A break in the lower border of the indicator around 1.2320 will increase the pressure on the pair. A break of the upper limit in the area of 1.2372 will lead to a larger upward correction. Description of indicators
|
| EUR/USD: Euro continues to suffer while EU leaders decide how to save the economy Posted: 24 Apr 2020 03:34 AM PDT According to some experts, the long-term prospects of the dollar are quite gloomy. Thus, they made the following arguments. First, a huge fiscal stimulus in the United States will increase the country's budget deficit and public debt, which will worsen its financial condition. Secondly, large-scale monetary expansion of the US Central Bank will contribute to the bloating of its balance sheet, and an excessive supply of money, as a rule, leads to a decrease in their value. Reality has repeatedly proved the fallacy of various theories. The same thing could happen this time. According to the updated forecast of the Committee on Responsible Federal Budget (CRFB), the US state budget deficit will reach $ 3.8 trillion this year, or 18.6% of GDP, and the country's public debt will increase to 107% of GDP in 2023, compared with a previous estimate of 86%. At the same time, expectations regarding the cost of debt servicing have not changed. This is a figure of 2% of GDP, which is associated with a reduction in rates on US Treasury bonds. The high demand of non-residents for treasuries makes it possible for the United States to have more debt. Meanwhile, decisions are made faster in America than in Europe. The day before, the US House of Representatives approved a $ 484 billion economic assistance package. The total amount of funds allocated for the fight against coronavirus infection in the country approached $ 3 trillion. During the EU summit held on Thursday, its participants seemed to agree on the creation of a € 1 trillion fund to save the region's economy, but no decision was made on who and how much would be contributed to this fund. The preparation of specific proposals was entrusted to the European Commission. The rise in the three-month LIBOR rate, which the Old World banks are relied to lend to each other, and the increase in its differential with swaps on overnight indices that track ECB's rates to a four-year maximum indicate an increase in the risks of fragmentation of the eurozone. Its member states bear different costs in the fight against coronavirus. Therefore, if a clear agreement is not reached on how to pay the bills, the chances of the collapse of the currency bloc will increase. According to ECB head Christine Lagarde, the Eurozone economy is likely to shrink by 15% due to the coronavirus pandemic, insufficient and belated measures by the authorities. The current recession in the EU promises to be deeper than in the United States, as evidenced by the decline in European business activity indices to record lows. The American composite index of purchasing managers in April slipped to 27.4 points, which was the lowest since October 2009, while the European ones dropped to 13.5 points, reaching the lowest level since the records began in 1998. If the growth of the Federal Reserve's balance sheet is unlikely to surprise anyone, then the ECB may well present a surprise in the form of expanding the program of quantitative easing by at least € 500 billion at the end of April. This opinion is inclined by 27% of experts recently surveyed by Bloomberg. Most of them expect to see an increase in the monetary stimulus in September, expecting that the emergency asset purchase program will not end before March 2021. As a result, the euro continues to be under pressure due to disagreements of European officials. If the EUR/USD pair cannot return above 1.0800 - 1.0810 in the next few days, then it risks heading towards the level of 1.0650. The material has been provided by InstaForex Company - www.instaforex.com |
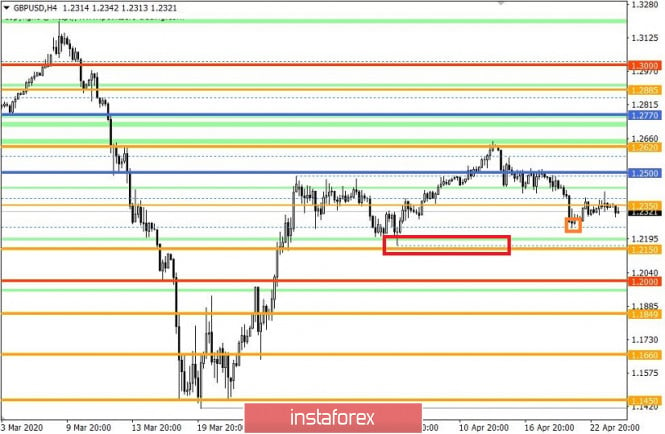
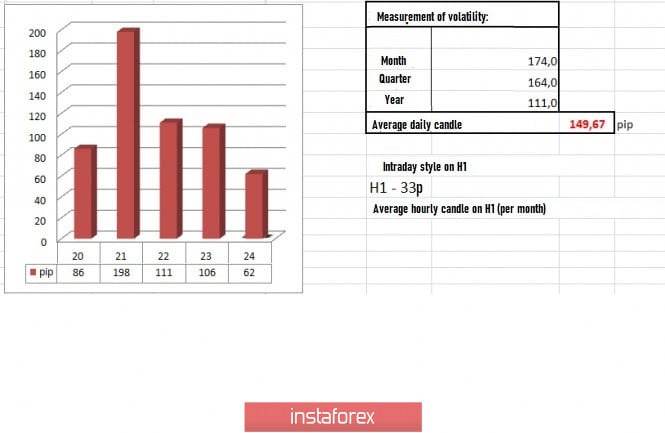
| Trading recommendations on GBP/USD for April 24, 2020 Posted: 24 Apr 2020 03:26 AM PDT An impressive slowdown, which accelerated the move, was observed. Market participants focusing on the mirror level of 1.2350 formed a variable range with an amplitude of about 30-40 points. Since the downward mood remained and trading forces were regrouped, the growth of new volumes was affected. The slowdown was an excellent conclusion of the technical correction from the value of 1.2250. The last step, updating April 21's low (1.2246), remains. n impressive slowdown, which accelerated the move, was observed. Market participants focusing on the mirror level of 1.2350 formed a variable range with an amplitude of about 30-40 points. Since the downward mood remained and trading forces were regrouped, the growth of new volumes was affected. The slowdown was an excellent conclusion of the technical correction from the value of 1.2250. The last step, updating April 21's low (1.2246), remains. Our analogy with the dynamics of the EUR / USD pair is gradually becoming apparent. The euro has already managed to update the local low, whereas the pound was still concentrating at the mirror level of 1.2350. Perhaps, it is time for the British currency to move now, by first pushing at the value of 1.2246, and then reaching the main level of 1.2150 during a wave of acceleration. In the prospects of the GBP / USD pair's development, quotes may return to the values relative to the upward trend during March 20 to April 14. Thus, for a more distinct signal, reaching the area of 1.2150 is necessary. Variable bursts of activity were observed yesterday. At the end of the daily candle, concentration at the mirror level became more significant, where the amplitude shrank to 20 points. In terms of volatility, the same dynamics were seen on the indicator, as movement still courses at the same mirror level. Speculative mood also has not gone away. Details of volatility: Monday - 165 points; Tuesday - 245 points; Wednesday - 172 points; Thursday - 358 points; Friday - 359 points; Monday - 144 points; Tuesday - 271 points; Wednesday - 676 points; Thursday - 354 points; Friday - 522 points; Monday - 267 points; Tuesday - 296 points; Wednesday - 333 points; Thursday - 452 points; Friday - 352 points; Monday - 148 points; Tuesday - 227 points; Wednesday - 108 points; Thursday - 126 points; Friday - 198 points; Monday - 116 points; Tuesday - 217 points; Wednesday - 131 points; Thursday - 122 points; Friday - 42 points; Monday - 87 points; Tuesday - 146 points; Wednesday - 193 points; Thursday - 119 points; Friday - 114 points; Monday - 86 points; Tuesday - 198 points; Wednesday - 111 points; Thursday - 106 points. The average daily indicator, relative to the dynamics of volatility, As discussed in the previous review, traders focused on the mirror level of 1.2350, where main positions were never opened. Traders are counting on the resumption of the downward move. Consolidation below 1.2300 will open the way to the values of 1.2250 and 1.2150. In the daily chart, the upward tact on March 20 to April 14 formed a significant slowdown, which can be described as a possible change in trading interest. In terms of macroeconomics, Britain's business activity indices came out much worse than forecasts. Business activity in the service sector fell from 34.5 to 12.3, and the production index fell from 47.8 to 32.9. As a result, the composite index fell from 36.0 to 12.9. Market reaction did not play out much. A similar PMI in the US came out in the afternoon. The service sector in the US recorded a decrease from 39.8 to 27.0, while the manufacturing sector recorded a decrease from 48.5 to 36.9. Applications for unemployment benefits also came out, which were much more terrible - new applications were 4,427,000, while repeated applications were 15,976,000. Market reaction at this time took hold of the US dollar, but only locally. Meanwhile, British Prime Minister Boris Johnson was reported to have recovered from the coronavirus and intends to return to work on Monday, April 27th. However, despite the captain's return, problems still remain. According to Bank of England representative Gertjan Vlieghe, Britain will face the biggest economic downturn in centuries due to the pandemic. "Judging by the early signs and experiences of other countries affected earlier than the UK, it seems that we are experiencing the strongest and fastest economic downturn in the last century, and possibly several centuries," said Vlieghe. Recovery process may be delayed and turn out to be U-shaped rather than V-shaped, Vlieghe also noted. Britain's retail sales in March decline by 5.8%, which inspired fear among investors. March's data on the volume of orders for durable goods in the US will be published in the afternoon, where an impressive decline of -11.9% is expected. The upcoming trading week awaits the meetings of the Fed and the ECB, as well as the preliminary data on US GDP. The most significant events are displayed below (Universal time): Tuesday, April 28 USA 14:00 - S&P / CS composite housing price index (YoY) (Feb) Wednesday, April 29 USA 13:30 - preliminary data on GDP (Q1) USA 19:00 - Fed meeting USA 19:30 - Fed press conference Thursday, April 30 EU 12:45 - ECB meeting USA 13:30 - Weekly report on applications for unemployment benefits Friday, May 1 Germany / France / Italy / Spain / Switzerland - day off (Labor Day) Great Britain 9:30 - Manufacturing PMI (Apr) USA 15:00 - ISM Manufacturing PMI Further development A local surge in activity caused by the concentration of trading forces at the mirror level of 1.2350 was observed during the Asian session. As a result, the level of 1.2300 was hit by shadows during the H1 period. Consolidation may not have happened but activity does not end there. Downward mood is still active, and the picture may soon change. Speculative positions also remain, relative to the market move. However, medium-term deals may soon emerge. Consolidation attempts at the value of 1.2300 were also present. Soon, we will be pulled towards 1.2250. Bearish mood will continue to persist. Local positions to be considered in case of a repeated break of 1.2300 down, with a prospect move to April 21's low - 1.2246. The next main move will be after the consolidation below 1.2240, where going towards the support of 1.2150 will be attempted. Based on the above information, we came up with these trading recommendations: - Open shorts below 1.2300, towards 1.2250. Consolidation will push the pair to the main level of 1.2150. - Alternatively, buy longs if the price consolidates above 1.2360, towards 1.2380. Indicator analysis The hourly and daily periods indicate a bearish mood, which reflects general interest. The same can be seen on the minute intervals. Volatility per week / Measurement of volatility: Month; Quarter year The volatility measurement reflects the average daily fluctuation, calculated by Month / Quarter / Year. (April 24 was built, taking into account the time of publication of the article) Current volatility is 67 points, which is 58% lower than the daily average. Acceleration may still occur even while maintaining a downward measure. Key levels Resistance zones: 1.2350 **; 1.2500; 1.2620; 1.2725 *; 1.2770 **; 1.2885 *; 1.3000; 1.3170 **; 1.3300 **; 1.3600; 1.3850; 1.4000 ***; 1.4350 **. Support Areas: 1.2250; 1.2150 **; 1.2000 *** (1.1957); 1.1850; 1.1660; 1.1450 (1.1411); 1.1300; 1,1000; 1,0800; 1,0500; 1,0000. * Periodic level ** Range Level *** Psychological level **** The article is built based on the principle of conducting a transaction, with daily adjustment The material has been provided by InstaForex Company - www.instaforex.com |
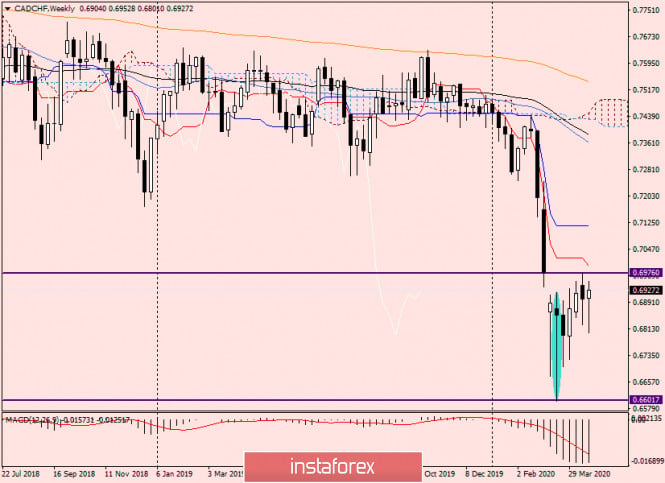
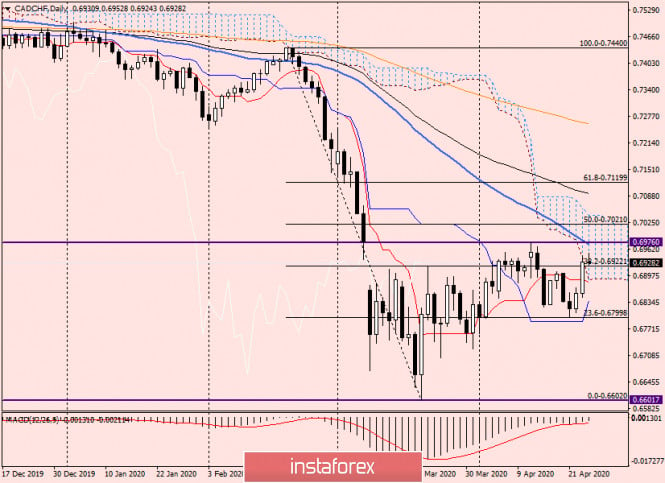
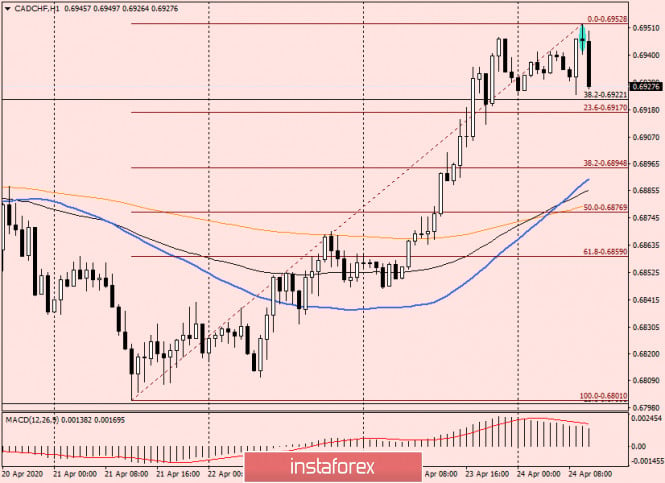
| Technical analysis and trading recommendations for CAD/CHF on April 24, 2020 Posted: 24 Apr 2020 02:38 AM PDT Good day, dear traders! Another cross-rate that we would like to consider today is CAD/CHF. Since no macroeconomic statistics from Canada and Switzerland are expected today, we will immediately proceed to the technical analysis of this currency pair. To complete the picture, let's start with the weekly timeframe. Weekly
After a fairly strong fall, the pair found support near the important technical and psychological level of 0.6600. As you can see, there was a strong rebound up from here and a highlighted candle with a very long lower shadow was formed, which can be considered a reversal with good reason. Indeed, the subsequent attempts of the bears on CAD/CHF to continue the pressure were not successful. It was not possible to approach the landmark level of 0.6600 again to test it for a breakdown. However, attempts to grow are still held back by the level of 0.6976, where there is strong resistance from sellers. Given that the Tenkan line of the Ichimoku indicator passes directly under another important level of 0.7000, the resistance zone can be designated as 0.6970-0.7000. I believe that only the breakdown of the Tenkan line and the closing of weekly trading above the psychological level of 0.7000 will indicate the ability to move further north. At this stage, the rebound and rise of CAD/CHF can be considered a correction to the previous quite strong decline. However, looking at the last few weekly candles, which have quite long lower shadows, we can not exclude that this is a reversal of the pair. Apparently, the market does not want to continue the decline and will move up. Daily
On the daily chart, the picture takes clearer shape. Today, the pair is already trading within the cloud of the Ichimoku indicator, but this is not a signal for further growth. First, you still need to stay within the cloud and not fall out of it down. Second, much more importantly, for further growth, it is necessary to break through the resistance of sellers at 0.6976. And here I would like to draw your attention to the fact that the 50 simple moving average has fallen directly on this level, which is able to provide additional and very strong resistance to attempts to raise the quote. A break of 50 MA and the resistance of 0.6976, with a close above, signals good prospects to continue the upward trend. A decline that results in the pair coming down from the Ichimoku cloud and closing trading under the Tenkan line will indicate a continuation or resumption of the bearish scenario. H1
After rising to 0.6953, the pair met strong resistance. The signal for a pullback from this level was the highlighted Doji "Rickshaw" candle. In my personal opinion, there is a high probability of continuing the rise after the rollbacks to 0.6920, 0.6900, and 0.6885, where there are 50 MA and 89 EMA. Given the technical picture on the weekly and daily charts, I recommend trying to buy the CAD/CHF pair's rate after the pullbacks to the selected prices. I wish you success and a good weekend! The material has been provided by InstaForex Company - www.instaforex.com |
| Posted: 24 Apr 2020 02:37 AM PDT GBP/USD – 1H.
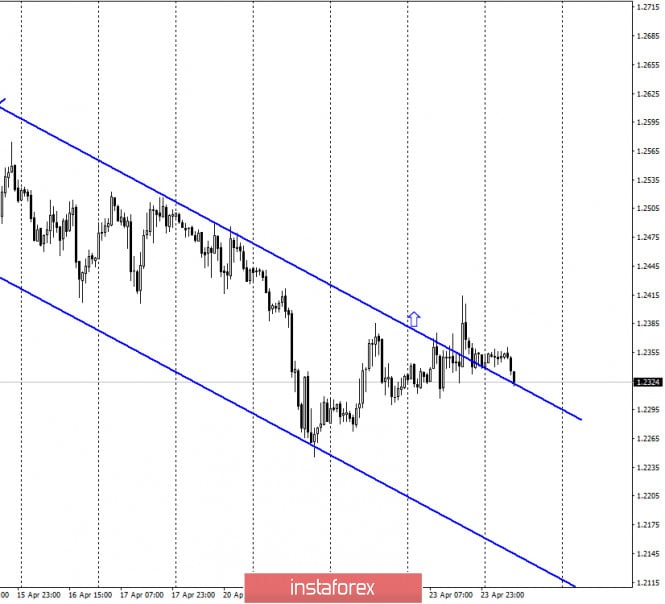
Hello, traders! According to the hourly chart, the pound/dollar pair performed a consolidation over the downward trend corridor. However, immediately after that, it performed a reversal in favor of the US currency and began falling. Thus, the situation on the hourly chart is twofold. On the one hand, the pair left the downward corridor, on the other hand, the 4-hour chart does not confirm the intention of traders to start buying the pair. Thus, now you should observe what is happening a little and understand which of the formed signals is false. No important information has been received from the UK in recent days. According to the latest data, Prime Minister Boris Johnson is returning to his duties after a coronavirus illness. Britain remains one of the most infected European countries, approaching Germany and France, where growth is slowing slightly. The country's death rate remains one of the highest in the world. GBP/USD – 4H.
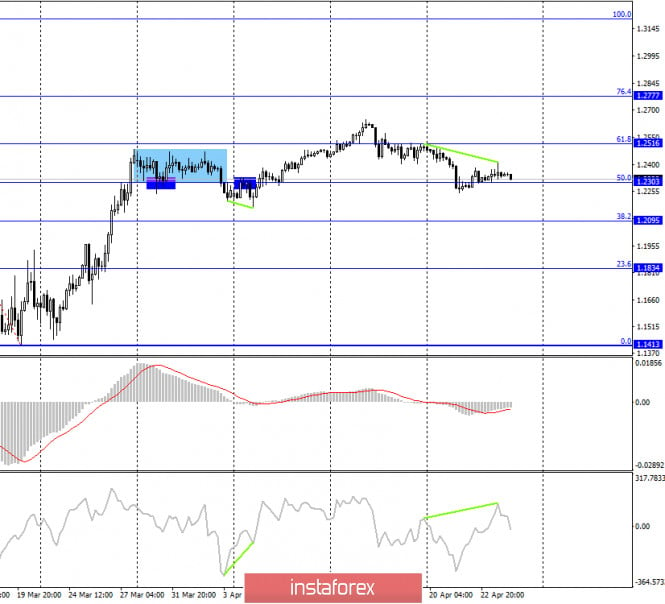
As seen on the 4-hour chart, the pound/dollar pair continues to trade above the corrective level of 50.0% (1.2303). Thus, certain chances of continued growth remain. However, yesterday a bearish divergence was formed in the CCI indicator, which allows traders to count on a reversal in favor of the US currency and the beginning of the process of falling quotes. However, given some ambiguities in the hourly chart, I recommend waiting for the closing of the pound/dollar pair under the Fibo level of 50.0% (1.2303), which will significantly increase the probability of continuing the decline of the British pound. GBP/USD – Daily.
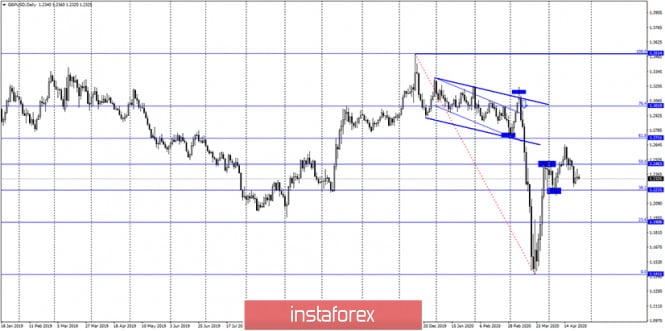
On the daily chart, the pair's quotes performed a reversal in favor of the US currency and secured under the corrective level of 50.0% (1.2463). Thus, the pair can resume the process of falling quotes in the direction of the next corrective level of 38.2% (1.2215). GBP/USD – Weekly.
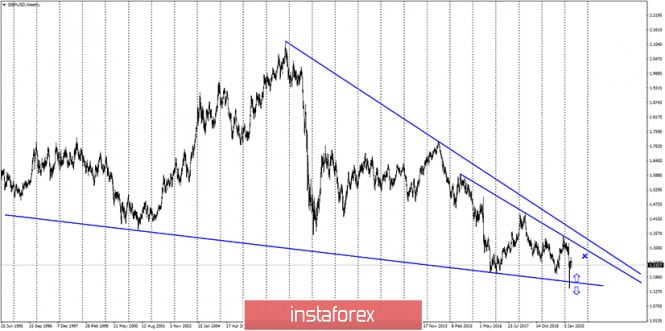
On the weekly chart, the pound/dollar pair performed a false break of the lower trend line. Thus, before the pair's quotes are fixed under this line, there is a high probability of growth in the direction of the two upper trend lines, but in the long term. Overview of fundamentals: On Thursday, the UK also released reports on business activity in the services and manufacturing sectors, which, as well as in all of Europe, were extremely weak. News calendar for the US and UK: UK - change in retail trade volume with and without fuel costs (08:00 GMT). US - change in the volume of orders for long-term goods (14:30 GMT). Today, April 24, the first report of the day has already been released - British retail sales, which, of course, decreased compared to February by 5.8% and 4.1%, respectively. In the second half of the day - comparable with the first report on the importance of the durable goods orders report for use in the United States. COT (Commitments of Traders) report:
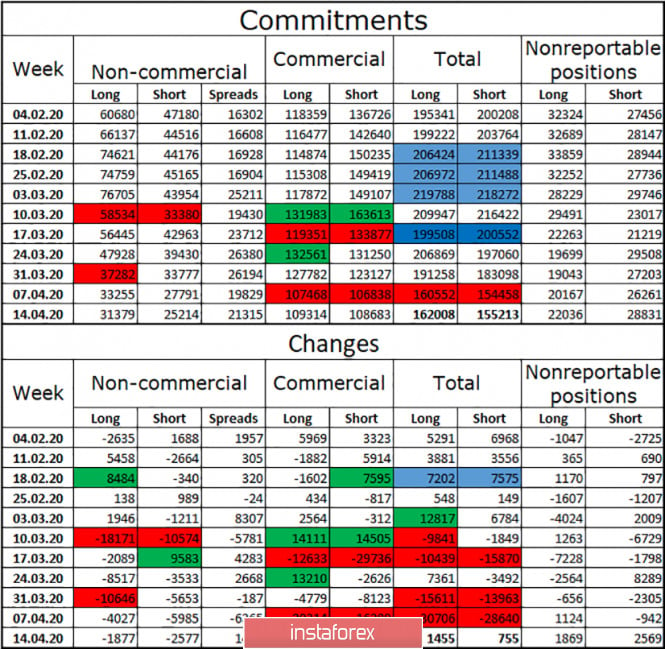
The latest COT report was released on Friday and showed a minimal increase in interest among major market players in the British currency. However, this growth is so minimal that it is impossible to draw a conclusion about the growth of interest in general. The total increase was only about 3,000 contracts for both groups - short and long. Thus, I believe that the pound remains an extremely unattractive currency for major market players. For example, speculators have now concentrated in their hands the minimum number of contracts for a long time - only about 80,000. And the total number of contracts is now about 320,000. For comparison, the total number of euro contracts is more than a million. There were no major changes during the reporting week. For all categories of traders, changes are minimal - plus or minus 2-3 thousand. The minimum advantage remains on the side of the bulls, as the total number of long contracts exceeds short by 7,000. Forecast for GBP/USD and recommendations to traders: I believe that today we should sell the pound with a target of 1.2095 if we close under the corrective level of 61.8% on the 4-hour chart. I do not recommend buying the pound yet, as the last signal turned out to be false. Terms: "Non-commercial" - major market players: banks, hedge funds, investment funds, private, large investors. "Commercial" - commercial enterprises, firms, banks, corporations, companies that buy currency, not for speculative profit, but to ensure current activities or export-import operations. "Non-reportable positions" - small traders who do not have a significant impact on the price. The material has been provided by InstaForex Company - www.instaforex.com |
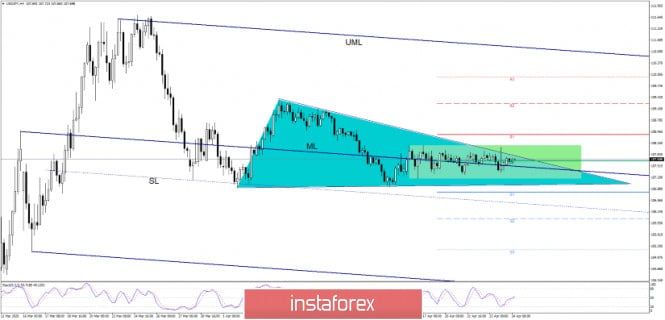
| Extended Sideways Movement On USD/JPY Posted: 24 Apr 2020 02:21 AM PDT It is hard to predict the trajectory of USD/JPY in the short term. The pair is trapped within an extended sideways movement. However, I am awaiting fresh signals and a clear direction soon because the price cannot move like this forever. The pair has developed a triangle. So, a valid breakout from this pattern will give us a trading opportunity, a USDX, and JP225 further increase will signal an upside breakout and a bullish movement. Maybe you should stay away for now and wait for a valid breakout before you take action. A false breakout will signal a valid breakout in the opposite direction. I've said in the previous analysis that the pair seemed oversold and it could increase again after the failure to reach and retest the inside sliding parallel line (SL) of the descending pitchfork. USD/JPY moves sideways around the weekly Pivot Point (107.65) level and now is approaching the triangle's resistance. I believe that a valid breakout from the triangle and an increase above the 108.03 high will validate a further increase, while a selling opportunity could appear if the price will register a downside breakout and below the S1 (106.78) level.
USD/JPY could increase towards the upper median line (UML) of the descending pitchfork if the price will make a valid breakout from the chart pattern and above the 108.08 high. The pair is trapped within a triangle and within a minor range. So, a valid breakout from these patterns will bring a great trading opportunity. The R1 (108.38), R2 (109.25) and the R3 (109.98) could be used as near-term upside targets if the price resumes bullish momentum. A larger drop will be confirmed only after a valid breakdown below the inside sliding line (SL) of the descending pitchfork, so only a downside breakout from the chart pattern will not be enough. USD/JPY could decrease if the USDX and the Nikkei drop in the short term. A false breakout above the triangle's resistance will validate a potential drop. Technically, if USD/JPY stabilizes above the median line (ML), it could come back towards the upper median line (UML). The material has been provided by InstaForex Company - www.instaforex.com |
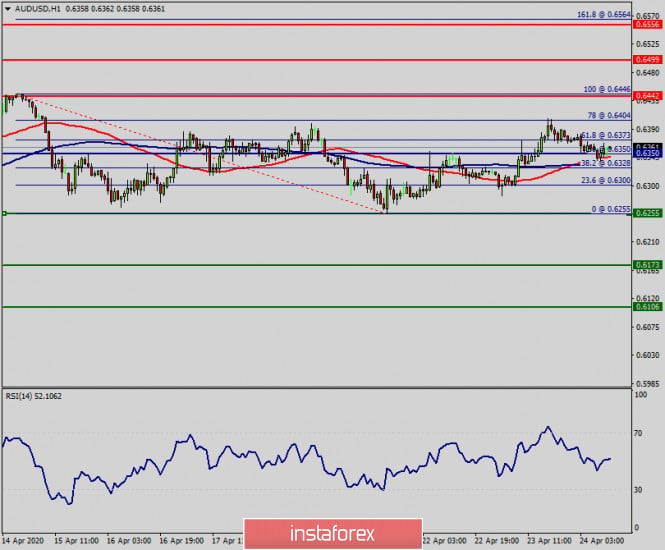
| Technical Analysis of AUD / USD for April 24, 2020 Posted: 24 Apr 2020 02:18 AM PDT Overview: Pair: AUD/USD. Trend: Sideways. Coronavirus disease (COVID-19) perhaps leading to fresh falls, despite of we have a sideway tend at the moment. The trend of AUD/USD pair movement was controversial as it took place in a narrow sideways channel, the market showed signs of instability. Amid the previous events, the price is still moving between the levels of 0.6255 and 0.6442. Also, the daily resistance and support are seen at the levels of 0.6255 and 0.6442 respectively. Therefore, it is recommended to be cautious while placing orders in this area. So, we need to wait until the sideways channel has completed. Yesterday, the market moved from its bottom at 0.6255 and continued to rise towards the top of 0.6400. Today, in the one-hour chart, the current rise will remain within a framework of correction. However, if the pair fails to pass through the level of 0.6424, the market will indicate a bearish opportunity below the strong resistance level of 0.6442 (the level of 0.6442 coincides with the double top too). Since there is nothing new in this market, it is not bullish yet. Sell deals are recommended below the level of 0.6442 with the first target at 0.6300 . If the trend breaks the support level of 0.6300, the pair is likely to move downwards continuing the development of a bearish trend to the level 0.6255 in order to test the daily support 1 (horizontal green line). Comment: The weekly pivot is seen at the level of 0.6355. The market is still in a sideways. But we still prefer the bearish scenario. The material has been provided by InstaForex Company - www.instaforex.com |
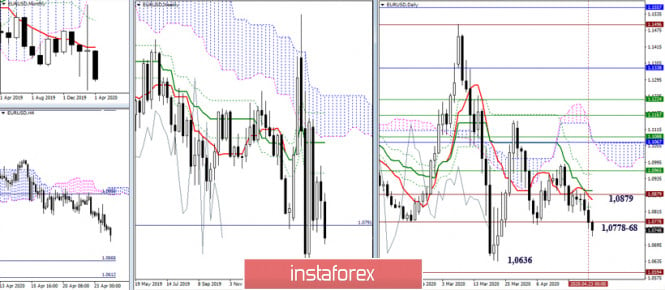
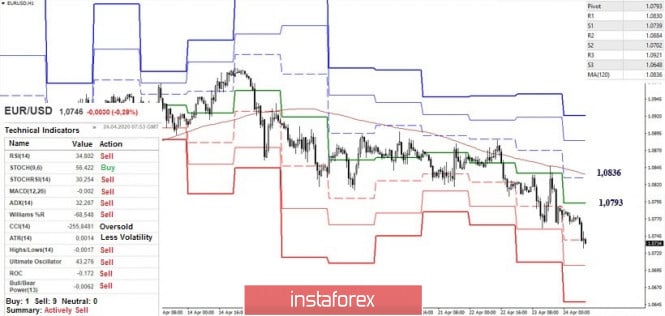
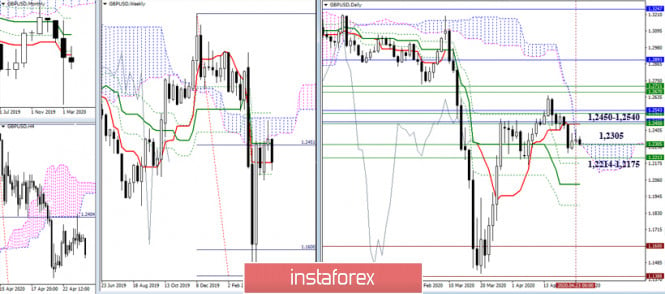
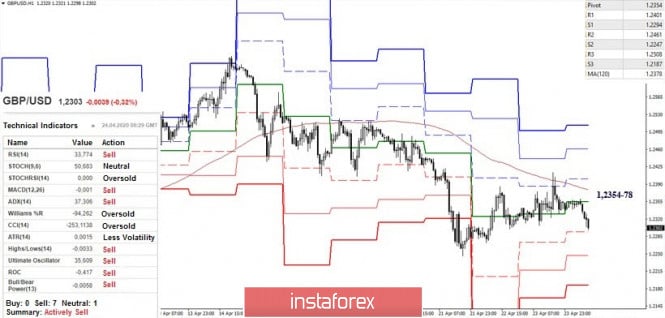
| Technical analysis recommendations for EUR/USD and GBP/USD on April 24 Posted: 24 Apr 2020 02:00 AM PDT Economic calendar (Universal time) We can note data on basic orders for durable goods in the USA (12:30) among the expected indicators in the afternoon. EUR / USD As expected, the pair continued to decline after updating the low of last week. As a result, yesterday's day was closed in the support area of 1.0778-68 (historical level + minimum extremum). Today, the issue of the breakdown of the level is being resolved. The breakdown and closing of the week below the supported supports will give it to the next landmarks - the minimum March extreme (1.0636) and the target for the breakdown of the Ichimoku cloud on H4 (1.0666-12). The closure of the current week above the found support may serve as the basis for the formation of rebound. Over the previous day, the pair managed a lot - to define a new low and test the key resistance for strength. Today, on H1, players to decline continue the downward trend. Now, there is a slowdown in the first support of the classic Pivot levels (1.0739), further reference points are S2 (1.0702) and S3 (1.0648). In the case of the development of an upward correction among the resistances, 1.0793 (central Pivot level) and 1.0836 (weekly long-term trend) will be of primary importance today. Consolidating above these resistances will change the current balance of power in the lower halves and create conditions for possible changes in the higher halves. GBP / USD The slowdown continues. A daily cloud was added to the efforts of the weekly short-term trend (1.2305). As a result, the current slowdown may be delayed, and the closing of the week above the weekly short-term, in the bullish zone relative to the daily cloud, may serve to further restore bullish positions. The breakdown of the support met by 1.2305 and the subsequent 1.2214-1.2175, as well as the closing of the week below these levels will be an increase in bearish sentiment, which will most likely lead to a continued decline. Yesterday, the resistance to the weekly long-term trend, tested for strength, coped with the task and defended the interests of players on the downside. At the moment, the pair is working under the key resistance of the lower halves again, which hold the defense today at 1.2354-78 (central Pivot level + weekly long-term trend), while the bears retain support for most of the analyzed technical indicators. Moreover, updating the low (1.2246) will restore the downward trend. It should be noted that the support for the classic Pivot levels today is located at 1.2294 (S1) - 1.2247 (S2) - 1.2187 (S3). Ichimoku Kinko Hyo (9.26.52), Pivot Points (classic), Moving Average (120) The material has been provided by InstaForex Company - www.instaforex.com |
| You are subscribed to email updates from Forex analysis review. To stop receiving these emails, you may unsubscribe now. | Email delivery powered by Google |
| Google, 1600 Amphitheatre Parkway, Mountain View, CA 94043, United States | |





 Europe to close its borders on 16 March.


No comments:
Post a Comment