Forex analysis review |
- Forecast for EUR/USD on April 30, 2020
- Forecast for AUD/USD on April 30, 2020
- Forecast for USD/JPY on April 30, 2020
- Hot forecast and trading signals for the GBP/USD pair on April 30
- Hot forecast and trading signals for the EUR/USD pair on April 30
- Overview of the GBP/USD pair. April 30. Donald Trump is losing the political fight to Joe Biden. The US economy is at risk
- Overview of the EUR/USD pair. April 30. The US economy is at risk of declining in the first quarter more than the European
- EUR/USD and GBP/USD. US GDP fell 4.8% in Q1 and could lose 20-30% in Q2. Traders await Fed's communique on the state of the
- GBP/USD. US economy disappointed, but the pound is busy with its problems
- Comprehensive analysis of movement options for #USDX vs EUR/USD, GBP/USD, and USD/JPY (H4) on April 30, 2020
- April 29, 2020 : GBP/USD Intraday technical analysis and trade recommendations.
- April 29, 2020 : EUR/USD Intraday technical analysis and trade recommendations.
- Market review. Trading ideas. Answers for questions
- Evening review for April 29, 2020. EURUSD. Euro failed to overcome 15-day average on the way up
- EURUSD and GBPUSD: Federal Reserve meeting. Pound continues to decline
- BTC analysis for 04.29.2020 - Strong resistance on the test at the price of $8.400
- Gold continues its sideways movement
- EUR/USD: plan for the US session on April 29 (analysis of transactions). Euro buyers are again making an unsuccessful attempt
- GBP/USD: plan for the US session on April 29 (analysis of transactions). Bears hurt the ego of Asian buyers of the pound
- EURUSD remains in bearish short-term mode as long as price is below 1.09
- Gold – anti-crisis currency
- Analysis for Gold 04.29.2020 - Broken resistance supply trendline in the background, Watc for buying opportunities towards
- USD/JPY analysis for 04.29.2020 - Strong downside momentum and potential for bigger drop towards the 105.30
- Technical Analysis of AUD/USD for April 29, 2020
- Trading recommendations on GBP/USD for April 29, 2020
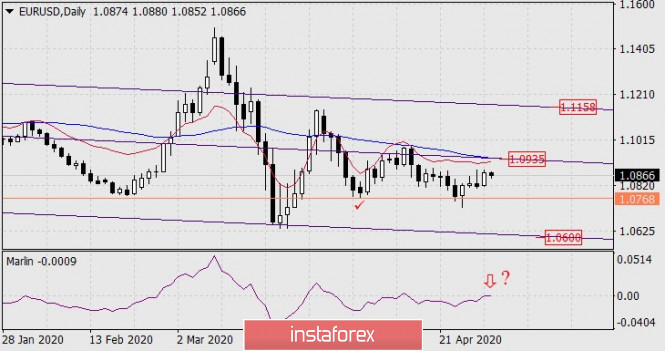
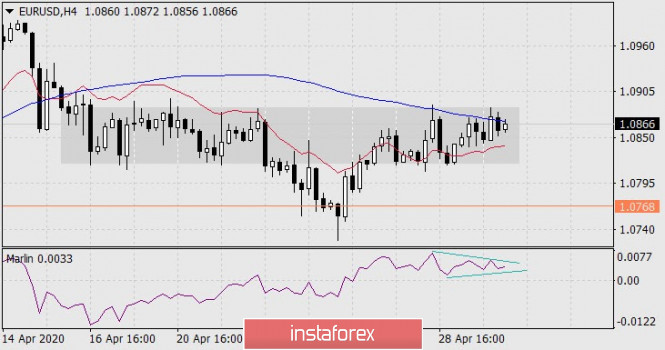
| Forecast for EUR/USD on April 30, 2020 Posted: 29 Apr 2020 08:05 PM PDT EUR/USD The euro almost imperceptibly reacted to the Fed's neutral monetary policy decision on Wednesday. Tuesday's high was not overcome, but the euro is declining this morning. The signal line of the Marlin oscillator touched the boundary of the growth territory and showed a downward turn from it on the daily chart. The magnetic point formed by the intersection of the MACD line and the price channel of 1.0935 may not be reached. The condition for starting the euro's medium-term decline will be for the price to go below the April 6 low (1.0768). The price once again failed to overcome the resistance of the MACD line on the four-hour chart, staying in the accumulation band of the second half of April. The signal line of the Marlin oscillator formed a small triangle, going down from it will strengthen the fall of the indicator and price. So, our expectation remains the same - with the price going below the signal level of 1.0768, the prospect of moving to the nearest target along the line of the price channel of 1.0600 opens up. The material has been provided by InstaForex Company - www.instaforex.com |
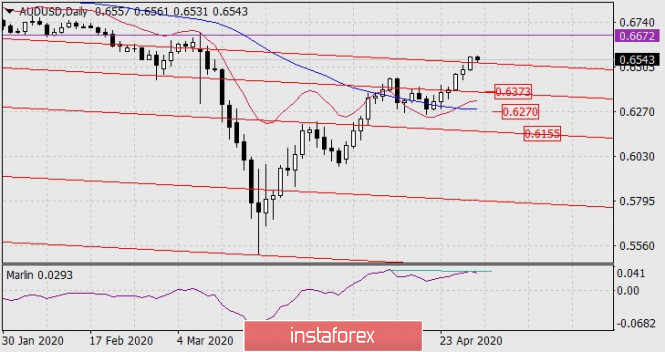
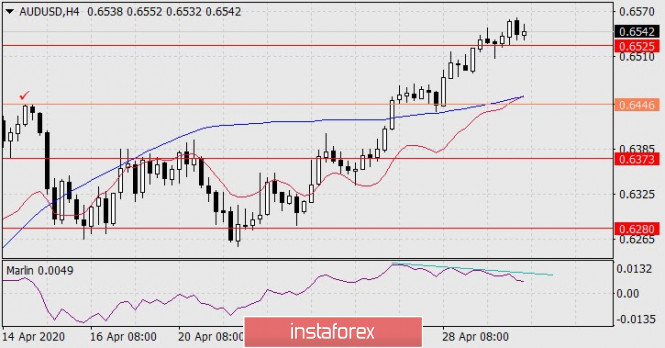
| Forecast for AUD/USD on April 30, 2020 Posted: 29 Apr 2020 08:05 PM PDT AUD/USD The Australian dollar added more than 60 points on Wednesday and went above one of the lines of the price channel on the daily chart. At first glance, the price is ready to go higher and work out the target level of 1.6672 (the low of October and August 2019), but convergence is forming on the Marlin oscillator, because of which even the price exit above the trend line could turn out to be false. Consolidating the price under it (0.6525) will be the first sign of an upcoming reversal. Leaving the price under the signal level 0.6446 (April 14 high) will allow the price to work out the first bearish target 0.6373. Further, it is possible to decline to the MACD line at around 0.6270, then 0.6155. The divergence according to Marlin is expressed more clearly and unambiguously on the four-hour chart, moreover, it is threefold. A price reversal down and consolidation below 0.6525 may occur today. The signal level for opening short positions of 0.6446 is very close to the MACD line, which increases the significance of this level. We are waiting for the development of events. The material has been provided by InstaForex Company - www.instaforex.com |
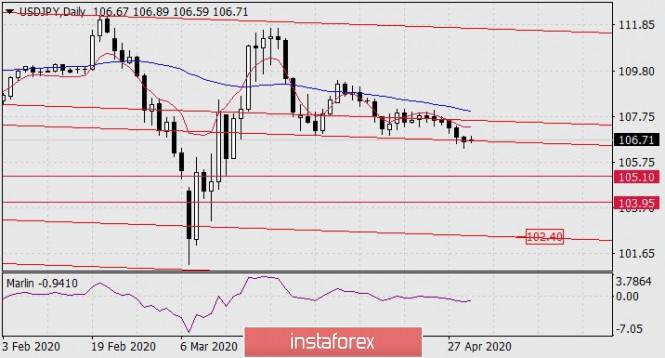
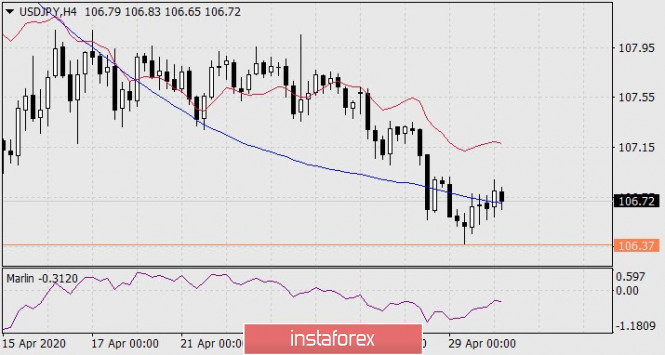
| Forecast for USD/JPY on April 30, 2020 Posted: 29 Apr 2020 08:05 PM PDT USD/JPY The Japanese yen did not gain a foothold under the trend line on its first attempt, opening the way to a decline to 102.40. The second attempt may occur by overcoming yesterday's low of 106.37. Specifications for the past day have not changed, the pair is under pressure. The price develops in the range of the MACD line on the four-hour chart, without deviating far from it. The Marlin oscillator does not leave the negative trend zone, it only unloaded before the expected decline. So, with the price overcoming the new signal level 106.37, it is possible to open short positions with a strategic aim at 102.40. The strongest intermediate target levels are 105.10 and 103.95. The material has been provided by InstaForex Company - www.instaforex.com |
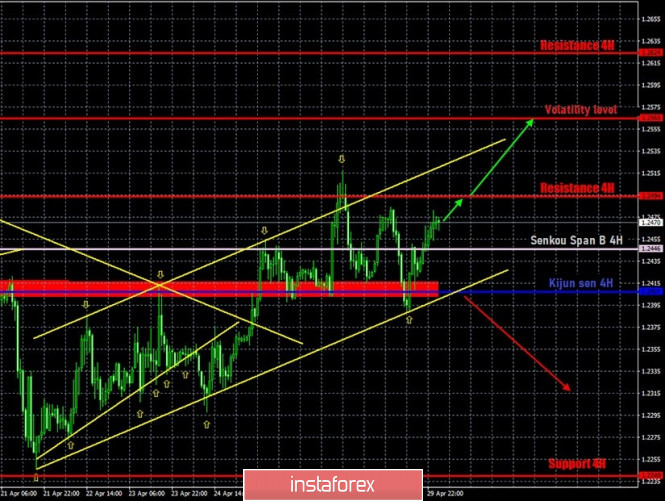
| Hot forecast and trading signals for the GBP/USD pair on April 30 Posted: 29 Apr 2020 05:39 PM PDT GBP/USD 1H The picture became somewhat clearer on the hourly chart for the pound/dollar pair. The Federal Reserve meeting did not affect the course of trading, but the pair plunged to the support area of 1.2403 - 1.2416, as well as to the Kijun-sen line for the 4-hour timeframe. In addition, the price touched the lower border of the upward channel and rebounded off these three supports, resuming the upward movement. Thus, from the point of view of technical analysis, we got an almost ideal entry point into the market with long positions. In the current situation, and according to the current technical picture, we can only assume a continuation of the upward movement until the GBP/USD pair leaves the upward channel. No macroeconomic publications in the UK are scheduled for Thursday. Therefore, the macroeconomic background for the pair will be reduced to the report on applications for unemployment benefits in the US (primary and secondary). We believe that the next and an additional several million unemployed in the United States could create additional pressure on the position of the US dollar. However, we should not forget that traders are ignoring almost all the data that comes to their disposal. Thus, we don't expect a strong movement in one direction today. Most likely, the movement will continue with frequent corrections and pullbacks, which will be characterized as a weak trend. In general, do not forget that the UK continues to be dominated by Brexit and its consequences. Only now the negative for the British economy associated with this event will be multiplied by the consequences of the pandemic, which, according to most experts, the British government failed to cope properly. Thus, on April 30, we have two main options for the development of the event: 1) The initiative for the pound/dollar pair is still in the hands of buyers, since the price continues to be located inside the rising channel. The quotes rebounded from the strong support area of 1.2403-1.2416, so now it is advised to trade higher with the goal of the resistance level for the 4-hour 1.2494 chart. In this case, Take Profit can be about 40 points. If the first target is overcome, then the longs can be left open with a target level of volatility of 1.2565. In this case, Take Profit will be about 100 points. 2) Sellers will be able to trade down again only after quotes exit the upward channel and overcome the support area of 1.2403-1.2416 along with the Kijun-sen line. Thus, consolidating is required for 1.2400 (approximately), and after this condition is met, it will be possible to open sell orders with a rather distant target of 1.2240 (support level for the 4-hour timeframe). In this case, Take Profit can be up to 150 points. The intermediate target is 1.2369 - the lower level of volatility on April 30. The material has been provided by InstaForex Company - www.instaforex.com |
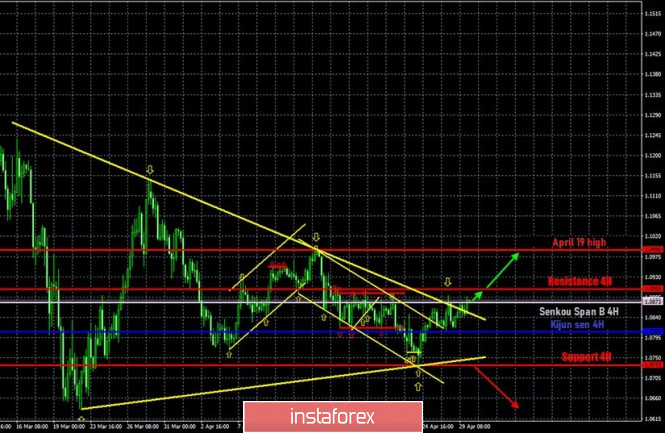
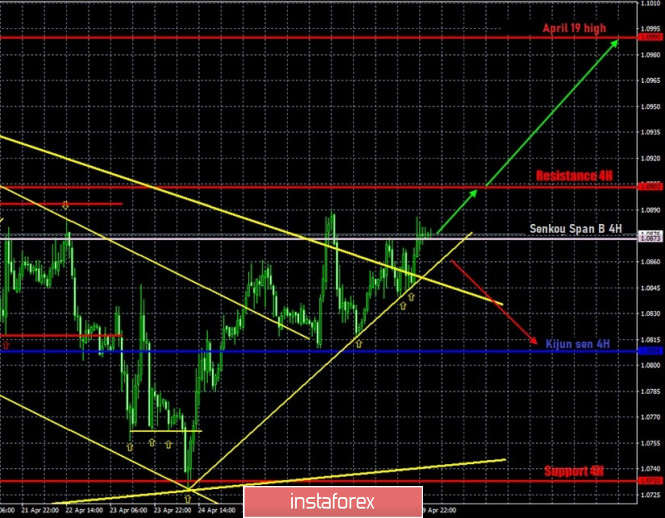
| Hot forecast and trading signals for the EUR/USD pair on April 30 Posted: 29 Apr 2020 05:27 PM PDT EUR/USD 4H The euro/dollar pair overcame a long-term downward trend on the 4-hour timeframe on April 30. Overcoming it gave traders the opportunity to trade for a more confident increase. We hoped that a strong macroeconomic background of the environment would contribute to strong movement. However, in practice it turned out that the level of volatility did not change at all. And indeed, few have changed. Thus, we believe that an upward trend has now formed on the euro/dollar pair. EUR/USD 1H In addition to overcoming the long-term downward trend, a new ascending trend line is formed, with four support points on the hourly timeframe. Traders also managed to gain a foothold above the Senkou Span B line, although consolidating is uncertain. Thus, in the short term, the upward trend is confirmed by technical analysis. As we have already said in fundamental reviews, a rather large number of various reports and events are set for the European Union and the United States today. However, only some of them can attract attention. First of all, the data on the Eurozone GDP for the first quarter and the summary of the ECB meeting. Secondly, the report on applications for unemployment benefits in the United States. However, looking at the reaction of market participants to yesterday's, no less important, events, it becomes clear that traders are going to ignore the fundamental background today. The US currency may continue to be under moderate market pressure due to the fact that more disappointing macroeconomic statistics are coming in from across the ocean. Consequently, there is more reason to suppose a serious contraction in the US economy. However, the situation is no better in the European Union, and today we can verify this. Also, one should not forget about the factor of "market confidence in the dollar", which at almost any moment can lead to new strong purchases of US currency. Thus, first of all, you should still pay attention to technical factors, and not to the "foundation". Based on all of the above we have two trading ideas for April 30: 1) The first condition for continuing the upward movement is met. The downward trend line was overcome. Thus, we advise you to trade for an increase by aiming for the April 19 high at 1.0990. We believe that the pair can go down from the current positions, as it has already rebounded several times from the resistance area of 1.0890-.0900. Thus, another condition for opening long positions is to secure quotes above the resistance level of 1.0903. The potential to Take Profit in this case is 85 points. 2) The second option - bearish - involves overcoming a new upward trend line and in this case we recommend selling the euro with the first goal being the Kijun-sen line of the Ichimoku indicator at 1.0808. A rebound from the 1.0890-1.0990 area can also be identified, which will also be a signal to sell. The potential to Take Profit in this scenario will be 45 points. The material has been provided by InstaForex Company - www.instaforex.com |
| Posted: 29 Apr 2020 05:24 PM PDT 4-hour timeframe
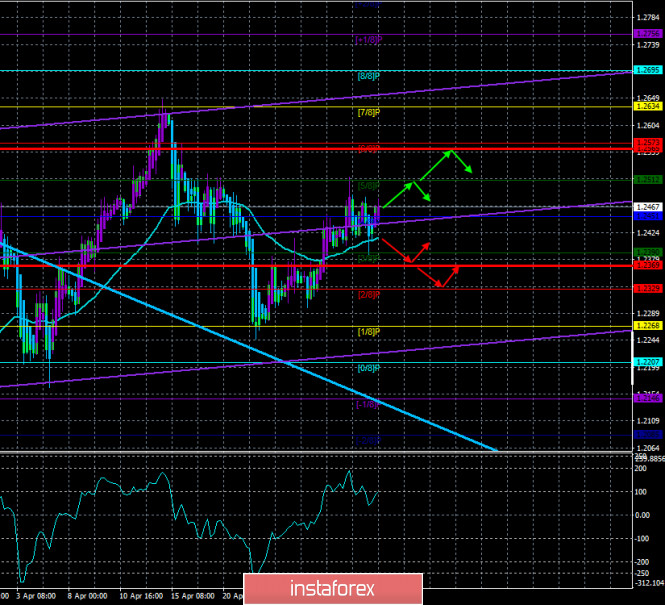
Technical details: Higher linear regression channel: direction - downward. Lower linear regression channel: direction - upward. Moving average (20; smoothed) - up. CCI: 100.1954 On April 30, the British pound begins the same moderate upward movement that has been observed in recent days. Thus, the past day, as well as for the euro/dollar pair, did not change the balance of forces in the confrontation between the pound and the US dollar. The technical picture did not change, and the Fed meeting did not affect the movement of the pair and the preferences of traders and their activity. If a month ago we complained about ultra-high volatility and not without reason, now we can complain about quite weak volatility. For the pound, this indicator has fallen in recent weeks to a value of "less than 100 points per day". The Heiken Ashi indicator turns the bars purple again, which signals a short-term upward trend. The flow of fundamental information from the UK is now zero. From time to time, information is received on the spread of "coronavirus" or on the lifting of certain quarantine measures, but all this information has long ceased to concern traders. It concerns ordinary people, citizens, residents of every country, and people who are ill, may get sick, may lose relatives, and have to be quarantined, but not currency traders. Only one macroeconomic report is scheduled for this week in the UK, and even then it is not the most significant. And then on Friday. And even then it will be ignored with a 99% probability. Thus, we can only pay attention to the news that is available to us. And they come mainly from overseas. One of these topics is the upcoming US presidential election in November 2020. We have covered this topic several times already. In short, its essence is as follows. Donald Trump wants to be re-elected for a second term and, as a true businessman, is ready to go to any measures to win. But suddenly, at the beginning of this year, he was tripped up by an epidemic of "coronavirus", which simply killed all the economic progress of the world's largest economy in recent years. Moreover, experts, representatives of the Federal Reserve, as well as various rating agencies and banking conglomerates believe that the US economy will lose much more in the second quarter than 4.8% in the first. Thus, in the month of November, Trump simply will not have any trumps left on his hands to declare them to the electorate. Even now, the American President is trying to blame the epidemic in the United States on China, WHO, and the country's chief epidemiologist. In general, on anyone, just to protect themselves. However, as practice shows, it is unlikely that such measures will convince the American electorate of the need to elect Donald Trump as President for a second time. The slowdown in the US economy began one and a half to two years ago when the US leader decided that China was "treating America unfairly" and urgently needed to review trade conditions. Because of this, the world economy lost several percents of GDP, and the parties fought two years of trade battles, called negotiations. This factor alone makes us wonder whether the country needs a conflicted president who kills all the progress that the country is making while he is in power. Under Trump, the US economy grew strongly, but thanks to him, it also began to slow down. And in 2020, it risks losing trillions of GDP. At the same time, the Democrats, in particular Joe Biden, who is the main contender for the presidency, do not need to do anything. It is only necessary to point out mistakes and gaps in the actions of the current government, of which there were plenty. Starting with the same trade war with China, ending with the story of impeachment and the failure of the fight against the "coronavirus" pandemic. According to the latest sociological research, Joe Biden is ahead of Donald Trump in political ratings by 6-10%. The study shows that more than 50% of voters are ready to vote for Joe Biden, and no more than 40% for Trump if there were only two contenders. If there were more candidates, 38% would vote for Trump and 44% for Biden. And there is not a single study or poll where Trump won. Moreover, many political analysts believe that at this time, Trump is deprived of his main weapon – propaganda. Now, because of the epidemic, it is forbidden to hold rallies and any other events at which Trump could speak to the public and assure that "America has a bright future". In addition, many well-known politicians, such as Hillary Clinton and Barack Obama support the candidacy of Joe Biden. Thus, the probability of Trump's victory in the upcoming elections is falling. The main headache of the American President remains the COVID-2019 epidemic. More than a million cases of the disease have been reported in the United States, but Trump still insists on opening economic borders and ending the quarantine. Yesterday, the US President was asked how he could comment on these figures, to which the US leader said that "eventually the number of cases will fall to zero." Journalists immediately recalled similar words of Trump in February of this year, when the number of officially registered patients in America was 15. Also, Trump did not miss the opportunity to once again boast of the success (in his opinion) in countering the "coronavirus". "You should understand that we (the United States) conduct much more testing than any other country in the world. Therefore, we find more cases, because we conduct many more tests," the American President said. However, experts in the field of sociology and medicine immediately calculated that the United States also has a much higher population than in many other countries. For example, in Italy, one test for "coronavirus" was performed for every 35 people, in Spain - for every 45, in Australia - for every 50 people, and in America - for every 60. Thus, in terms of the relative number of tests performed per capita, the United States is not in the first place in the world. But on the first in terms of the number of diseases and the number of deaths from the pandemic. It should also be added that many health experts, as well as politicians, believe that if the "lockdown" is completed, the United States may be overwhelmed by a new wave of diseases.
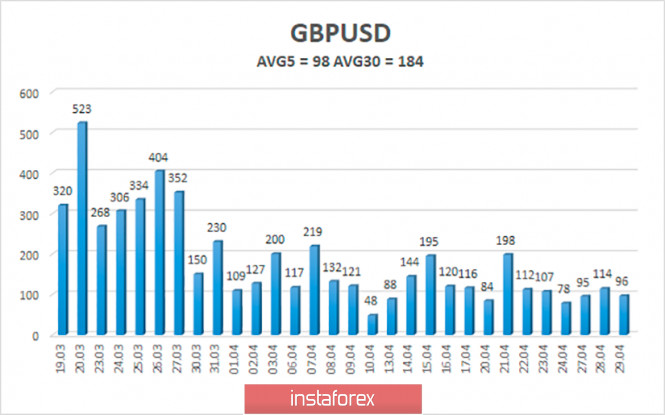
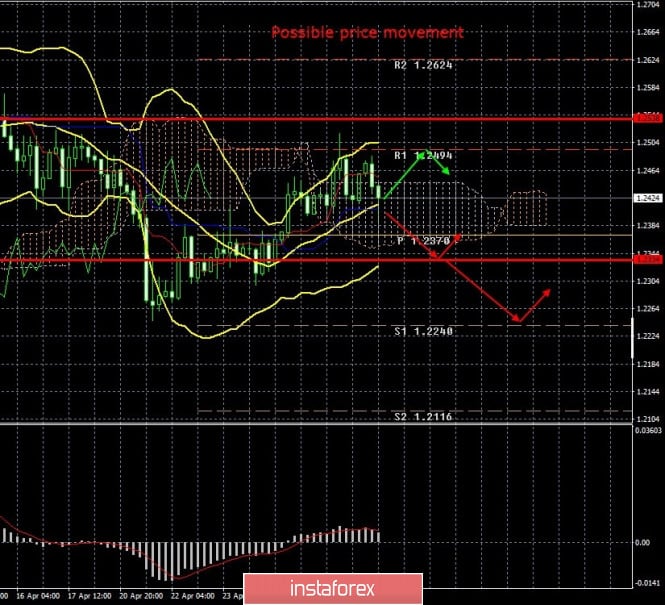
The average volatility of the GBP/USD pair is again decreasing and is now 98 points per day. In the last 20-25 trading days, the volatility indicators have been stable. And in the last 6 days, they do not exceed the value of 114 points. On Thursday, April 30, we expect movement within the channel, limited by the levels of 1.2369 and 1.2565. Turning the Heiken Ashi indicator down will indicate a new round of downward correction or even a possible resumption of downward movement. Nearest support levels: S1 – 1.2451 S2 – 1.2390 S3 – 1.2329 Nearest resistance levels: R1 – 1.2512 R2 – 1.2573 R3 – 1.2634 Trading recommendations: The GBP/USD pair resumed its upward movement on the 4-hour timeframe. Thus, traders are recommended to consider buying the pound today with the goals of 1.2512 and 1.2565, before the new reversal of the Heiken Ashi indicator down. It is recommended to sell the British currency no earlier than fixing the price below the moving average line with the first target Murray level of "2/8"-1.2329. The material has been provided by InstaForex Company - www.instaforex.com |
| Posted: 29 Apr 2020 05:24 PM PDT 4-hour timeframe
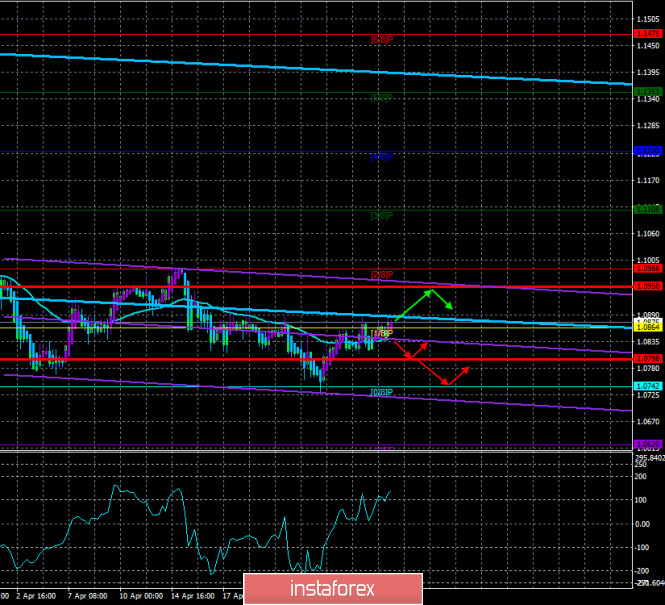
Technical details: Higher linear regression channel: direction - downward. Lower linear regression channel: direction - downward. Moving average (20; smoothed) - sideways. CCI: 136.2054 The EUR/USD currency pair has broken the moving average line and continues a very weak upward movement. Traders had some hopes that activity would increase yesterday, and there would be a reaction to all macroeconomic events. However, somewhere the events themselves did not impress, and somewhere there was nothing to react to. In general, according to the results of Wednesday, the situation on the currency market for the EUR/USD pair has not changed at all. The pair still has a chance to grow, and there are chances to fall, and the market mood can only be understood and tracked through technical analysis. The fourth trading day of the week promises to be no less interesting in terms of fundamental events than the third, and no less boring in terms of market movements. We expected clearly more from the day during which GDP was published in the United States, as well as the results of the Fed meeting were summed up. However, we are forced to state the fact that traders continue to ignore almost all the news, messages, and reports that come to their disposal. Even the "coronavirus" epidemic no longer causes a shock among traders, although the number of diseases in the world continues to grow, already exceeding 3 million. However, it should be noted that 1 million have already been cured of the disease, but do not forget that the "coronavirus" is not measles. If you get sick once, it doesn't mean that once you get cured, you won't get sick a second time. Thus, the world needs concrete signals about the end of the pandemic, about the invention of a vaccine, and not about reducing the incidence rate below 1 (if the ratio is below 1, it means that each infected person will infect less than one person). After all, it is clear to everyone that if we begin to weaken the quarantine measures, a second wave of the epidemic is not excluded, because there was no medicine or vaccine. Thus, we believe that many countries of the world that have declared their readiness to ease the quarantine are walking on a knife's edge and taking a very big risk. After all, a new outbreak of "coronavirus" will definitely lead to the need to re-launch the quarantine. On the fourth trading day of the week, more macroeconomic data is planned than on Wednesday. Important data will come from Germany, where the report on retail sales for March will be published (forecast of 1.5% in annual terms and -7.3% in monthly terms). The unemployment rate is also expected to increase in April from 5% to 5.2%-5.5%, and the number of applications for unemployment benefits should be from 76 to 120 thousand. The news is exciting, but it is unlikely to interest market participants. They will only have to note the actual values of these indicators and forget about them until the time when the markets start paying attention to the fundamental background again. Also on this day, GDP figures for France for the first quarter (forecast of -3.5% q/q), Spain (forecast of -4.4% q/q) and Italy (forecast of -5% q/q) will be published. These reports will help you find out how things are in individual EU countries. And a little later, the figures that may have an impact on the foreign exchange market will become known. First, it is inflation in the European Union, which should slow down to 0.1% in annual terms in April. Second, the unemployment rate, which experts predict will rise to 7.7% in March. Third, it is the Gross Domestic Product for the first quarter, which may lose 3.5% compared to the previous quarter. It is the latter indicator that is the most important and significant, as it will allow us to make the first comparisons between the losses of the American and European economies. If the forecast for Eurozone GDP is justified, then it will turn out that the European economy will decline by less than the American one. And this can provide some support for the euro currency in a pair with the dollar. Of course, we remind you once again that market participants now almost ignore any data; however, sooner or later, the market will return to normal and then all these figures will matter. An equally significant event will take place in the European Union a little later - the summing up of the ECB meeting. As with the Fed, market participants do not expect any major changes in monetary policy parameters. The key rate (credit) is already in the negative area, and the deposit rate is at zero. Thus, formally, the European regulator has the ability to lower rates even more, but it is unlikely to resort to this now if it did not want to take such a step at a time when all the world's central banks cut rates in an emergency order. Accordingly, we will talk at most about new programs to stimulate the economy and expand existing ones. At the ECB press conference, Christine Lagarde can share the regulator's vision for the current state of the economy, as well as share forecasts for key indicators and plans for the coming months. Well, no less significant event for the euro/dollar currency pair will be the publication of the next report in the US on applications for unemployment benefits, for the week of April 24. It is expected that there will be another 3.5 million new initial applications. Thus, the total number of initial applications for benefits in 6 weeks may reach 31 million. Recall that the economically active population in America is about 160 million. Some experts believe that the indicator of secondary applications for unemployment benefits is more important since it reflects applications for benefits from people who are already receiving it and are out of work. This figure for the week of April 17 (behind the indicator of initial applications for the week) may grow to 19.2 million. That is, it is not very far behind the indicator for initial applications. In any case, we state the fact that unemployment continues to grow, despite all the efforts of the government to lend and finance businesses in order to save jobs. According to this indicator, as well as GDP indicators, this week it will be possible to conclude that the European economy is suffering less from the pandemic than the American one. Or that the EU government has taken more effective measures to support the economy. The latest indicators of changes in personal income and spending of the American population for March are planned for today. These are absolutely secondary indicators that are unlikely to cause any reaction from traders. The technical picture implies an upward movement in the near future, although both channels of linear regression are directed downward.
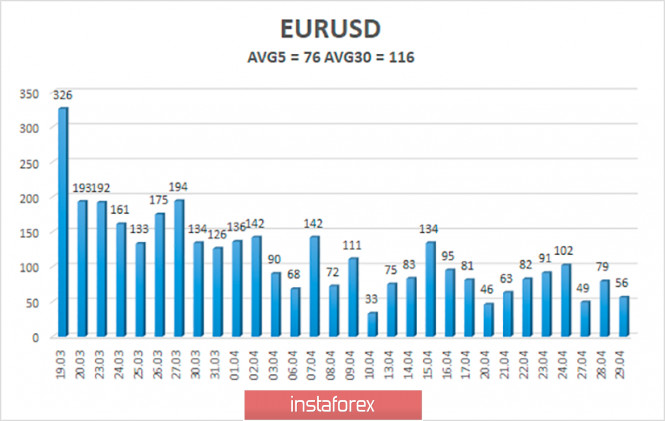
The volatility of the euro/dollar currency pair as of April 30 is 76 points. Volatility, therefore, remains average in strength, and there is no reason to expect a new wave of panic yet. Today, we expect the pair's quotes to move between the levels of 1.0798 and 1.0950. The reversal of the Heiken Ashi indicator downwards may signal the beginning of a downward correction. Nearest support levels: S1 – 1.0864 S2 – 1.0742 S3 – 1.0620 Nearest resistance levels: R1 – 1.0986 R2 – 1.1108 R3 – 1.1230 Trading recommendations: The EUR/USD pair has broken the moving average so the trend is already rising. Thus, traders are recommended to trade for an increase today with the goal of a volatility level of 1.0950 before the Heiken Ashi indicator turns down. It is recommended to consider selling the euro/dollar pair not before fixing the price below the moving average line with the goals of 1.0798 and 1.0742. The material has been provided by InstaForex Company - www.instaforex.com |
| Posted: 29 Apr 2020 12:09 PM PDT 4-hour timeframe Average volatility over the past five days: 81p (average). The EUR/USD pair was indistinctly trading on the third trading day of the week. The total volatility of the day at the moment is 56 points. And this is the day when the most important data on the state of the economy were to be published in the United States, and the results of the Fed meeting are scheduled for the evening. However, traders did not show any interest in active trading during the day. Moreover, there was still no reaction even when macroeconomic data began to come at the disposal of market participants. Thus, our fears from yesterday came true. Traders continue to simply ignore any macroeconomic data, even the most important. Consequently, the markets have not returned to normal, but only reduced their activity. But there is still no logic in the movement, except for the technical one. And even that, technical factors recently also do not particularly help in predicting the movement of the euro/dollar currency pair, since there is no pronounced trend now. As a result, we have a picture that is not too pleasant when quotes often change direction, but there is no such trend. Several minor indicators were published in the European Union this morning. However, looking ahead, traders ignored data on US GDP today, so there was no chance at all that they would respond by opening positions after the publication of data on the mood in the EU economy. Nevertheless, we cannot fail to note that the sentiment index in the EU economy fell from 94.5 to 67.0, the sentiment indicator in the services sector fell from -2.2 to -35, the level of consumer confidence remained unchanged at -22.7 , the business climate indicator fell from -0.28 to -1.81, while the business optimism index in industry fell from -10.8 to 30.4. Thus, 4 out of 5 indicators in April deteriorated and all five remain in the negative area. Consequently, the mood of managers, top managers and consumers remains extremely negative. Based on this, it follows that business, workers and consumers do not expect an improvement in the economic situation in the near future. Recall that the European Council has not yet adopted a 2-trillion-dollar program to help the economy, failing to agree on funding sources and the exact amount. Accordingly, you need to wait for the next EU video summit and hope that the necessary decisions are made at it. In addition, inflation for April was published in Germany today (preliminary value), which turned out to be slightly higher than forecasted values - 0.8% in annual terms and 0.3% in monthly terms. Meanwhile, a preliminary GDP indicator for the first quarter was published today in the United States. According to forecasts, this indicator was to lose from 4.0 to 5.0%. In reality, it turned out to be 4.8%. A stronger drop in US Gross Domestic Product over the past 25 years was observed only at the height of the mortgage crisis in 2008. Then the decline was about 8% relative to the previous quarter (not a total annual indicator). However, according to most experts and financiers, the first quarter is only the beginning of the coronavirus crisis. Recall that the epidemic, quarantine and crisis began only in March. This applies to both the European Union and the United States. Thus, the beginning of the year was not a crisis and in the first months there was an increase in many indicators. But the second quarter will be completely disastrous for both the American economy and the European one. Moreover, indicators like business activity in various fields are unlikely to continue to decline, since it is very difficult to continue to fall, and so from minimal levels. But indicators of retail sales, GDP, industrial production, orders for durable goods, unemployment, ADP and NonFarm Payrolls reports are likely to continue to be depressing. The same applies to the European economy and its indicators. And the most interesting thing is that now it's impossible to say how all these macroeconomic statistics will affect the rate of the euro/dollar pair. What, for example, are now the reasons for the euro's growth? Falling US GDP? This report, even in the short term, did not support the euro. In addition, the reduction is likely to be no less in the EU. Actions of central banks? Tonight we will find out what the Fed is going to do in the near future. However, most likely, there will be no serious adjustment of monetary policy parameters in April. The Fed has already sufficiently lowered the key rate, expanded the program of quantitative easing (QE) to almost unlimited volumes, and also poured trillions of dollars into the economy, so now we need to wait for the results of all these actions. But even if the Fed announces a new incentive program or additional funds to fight the pandemic, this is unlikely to change anything. Thus, with a high degree of probability one should not expect any serious price changes. Nevertheless, we recommend that you keep your finger on the pulse of the market, do not forget about Stop Loss orders, since you can never be completely sure how most traders (including large players who have their own logic) will react to such a high-profile event like the Fed meeting . 4 hour timeframe Average volatility over the past five days: 102p (high). The GBP/USD pair is trading as indistinctly as the EUR/USD pair on April 29. Quotes of the pair fell to the critical Kijun-sen line during the day, losing about 50 points, but it is impossible to connect this event with macroeconomic events, since the most important US report showed a strong decline (GDP). Thus, with such a contraction in the economy, it would be reasonable to see the dollar fall, rather than to strengthen. However, as we already found out in the first part of the article, traders continue to ignore all statistics. Thus, we believe that the reasons for the pair's fall today cannot be associated with reports. Accordingly, there was just a retreat, one of the upward trends, which began to form on April 21. Even the important Senkou Span B line, which always acts as a serious support/resistance, now has no effect on the pound/dollar pair. Formally, the upward trend persists, however, when growth resumes and on what grounds, it is now difficult to assume. Even the evening Fed meeting might not affect quotes. Based on this, we believe that the technique is still the most important factor in analyzing any pair in the Forex currency market at this time. A price rebound from the Kijun-sen line may provoke a resumption of the upward movement, and it should be considered as a specific signal for purchases. Recommendations for EUR/USD: For short positions: The EUR/USD continues an upward movement that is not too confident on the 4-hour timeframe. Thus, you can consider selling the euro but first you have to consolidate below the Kijun-sen line with the first targets of 1.0750 and 1.0733. For long positions: Long positions are formally relevant at this time, but we would recommend not to take risks until the Ichimoku cloud has been overcome and only then should you start trading for an increase with the targets of 1.0903, 1.0912 and 1.0985. Recommendations for GBP/USD: For short positions: The pound/dollar pair , after a rebound from the resistance level of 1.2494, continues to adjust as part of an upward trend. Thus, traders are advised to return to selling the British currency with the goal of a volatility level of 1.2334 not before you consolidate the pair below the Kijun-sen line. For long positions: Purchases of the GBP/USD pair are formally relevant now, since a rebound from the critical line has been made, but in general, all the upward movement is quite indistinct now. The material has been provided by InstaForex Company - www.instaforex.com |
| GBP/USD. US economy disappointed, but the pound is busy with its problems Posted: 29 Apr 2020 12:09 PM PDT Data on the growth of the US economy came out in the red zone, not reaching forecast values. US GDP fell by 4.8% (the strongest decline since 2009) in the first quarter, while preliminary forecasts were somewhat more optimistic - according to preliminary estimates, the indicator was supposed to fall by "only" four percent. All this suggests that the key indicator will also demonstrate a more significant decline in the second quarter - by 20-30% (according to some representatives of the Fed, the economy will slow down to 35%). The key component of GDP - consumer spending - collapsed by 7.6%, while this indicator was projected to decline by 3.5%. Exports fell by almost 9% and imports by 15%. But it is worth noting that some components of today's release were still better than predicted. In particular, the underlying RFE rose 1.8% in spite of growth forecasts to 1.7%. The price index of GDP was pleasantly surprised - it remained at the February level (1.3%), while analysts expected it to decline to one percent. However, a "spoon of honey in a barrel of tar" did not help the US currency - the dollar index again returned to the hundredth mark, reflecting a decrease in demand throughout the market. The greenback fell in almost all dollar pairs, although traders were in no hurry to open large positions ahead of the announcement of the results of the April meeting of the Federal Reserve. The dollar was under pressure - depressing numbers did not allow bulls to prove themselves. But not all currencies were able to take advantage of the US vulnerability - for example, the pound has become cheaper today even against the background of a weakened greenback. As you know, the British currency has been trading in its own coordinate system for a long time (to be more precise - since 2016), setting priorities for itself among many fundamental factors. The No. 1 topic for the pound has always been Brexit and any more or less significant news related to the "divorce proceedings". At the moment, Brussels and London have legally terminated their "relationship", but the question of a trade agreement has remained in the air. The first negotiations began in February, but the coronavirus prevented the parties from engaging in a full-fledged dialogue, after which the discussion on the deal was frozen. Now that COVID-19 is retreating, the members of the negotiating group have returned to the negotiating table (so far in video conferencing mode) and again reminded the traders about Brexit's problems. It is worth recalling that the February talks in the framework of the transition period began with harsh statements, both from the Europeans and the British. British Prime Minister Boris Johnson repeatedly threatened to leave the negotiation process, while Brussels promised Spain support in the matter of territorial claims regarding Gibraltar. The French also joined in a kind of "courtesy exchange": in particular, French Foreign Minister Jean-Yves Le Drian said that both sides are far apart on a number of issues. However, he warned the UK that it should expect a "bloody battle" in the upcoming talks. The French Foreign Minister also reiterated the position of the European Commission that it would be difficult for Britain to achieve the goal of concluding a free trade agreement before the end of the year. To date, the situation in the negotiations has not improved. Despite the forced pause, London refuses to extend the transition period to agree on a trade deal, although most European politicians (and even many British) even before the coronavirus epidemic stated that the parties would not have time to agree on all points of a future agreement before the end of this year. For example, an agreement on trade and economic cooperation between the EU and Canada was concluded in 2016 after seven years of negotiations, but similar negotiations between Brussels and Australia on a free trade agreement started back the year before last and still have not ended. Nevertheless, the Cabinet of Ministers of Boris Johnson continues his game: today, Foreign Minister Dominic Raab said that Britain would refuse to extend the Brexit transition period, even if the EU asks for a postponement. With this phrase, he answered the corresponding request of the leader of the Scottish nationalist faction, who called on the government to extend the transition period. According to him, the coronavirus pandemic and quarantine do not allow the parties to discuss in detail the agreement on the format of the future partnership. London's peremptory position put pressure on the GBP/USD pair: despite the general weakening of the dollar, the price stepped back from the boundaries of the 25th figure and drifted in the area of yesterday's lows in anticipation of the announcement of the results of the Fed meeting. Thus, the theme of coronavirus is gradually fading into the background, giving way to Brexit. With a high degree of probability, it can be assumed that at the re-launching stage, the parties to the negotiations will again converge in the clinch, putting forward mutual demands and ultimatums. Amid the recession of the British economy, such a news flow will put significant pressure on the pound. Therefore, short positions in the pair should be considered in the medium term, especially since upward momentums are dampened. The GBP/USD resistance level is at 1.2590 (the upper line of the BB indicator on the daily chart) - that is, with a weakening growth rate in the border area of the 26th figure, you can sell while aiming for a decline target at 1.2310 (the upper border of the cloud Kumo on the same timeframe). The material has been provided by InstaForex Company - www.instaforex.com |
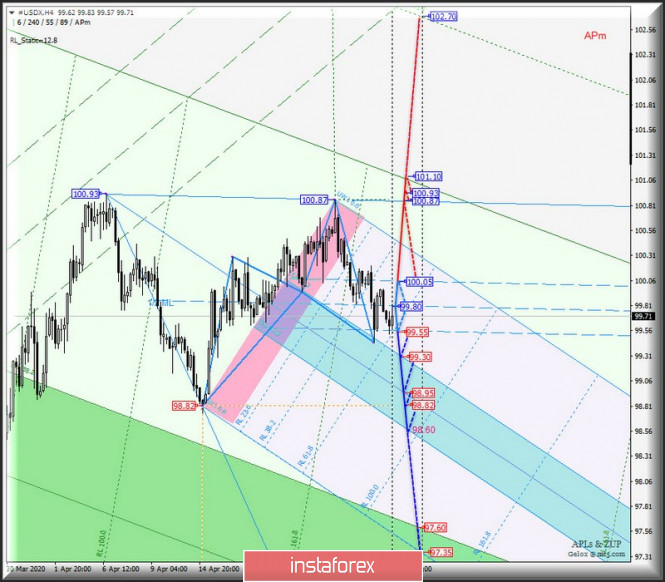
| Posted: 29 Apr 2020 10:11 AM PDT Minuette operational scale (H4) Continuation of the dollar's fall? Options for the development of the movement of major currency instruments #USDX vs EUR/USD, GBP/USD, and USD/JPY from April 30, 2020 in a complex form. ____________________ US dollar index The development of the movement of the dollar index #USDX from April 30, 2020 will be due to the development and direction of the breakdown of the boundaries of the 1/2 Median Line channel (99.55-99.80-100.05) of the Minuette operational scale - we look at the marking details on the animated chart. Breakdown of the lower border of the channel 1/2 Median Line Minuette - support level of 99.55 - a continuation of the downward movement of the dollar index to the equilibrium zone (99.30-98.95-98.60) of the Minuette operational scale fork. Breakdown of the upper border of the channel 1/2 Median Line Minuette - resistance level of 100.05 - development option of the upward movement #USDX to the targets:
Details of the dollar index movement markup from April 20, 2020 are shown on the animated chart.
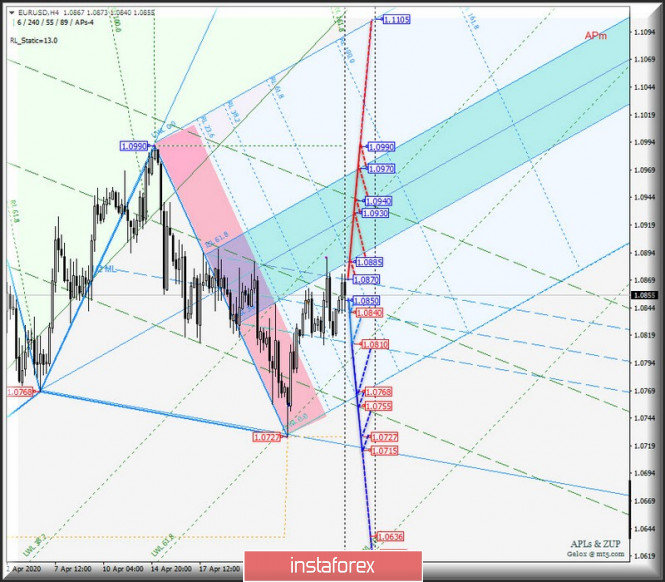
____________________ Euro vs US dollar The development of the movement of the single European currency EUR/USD from April 30, 2020 will be determined by the development and direction of the breakdown of the range:
In case of breakdown of the upper border of the channel 1/2 Median Line Minuette - resistance level of 1.0870 - an option to achieve a single European currency of the borders of the equilibrium zone (1.0885-1.0930-1.0970) of the Minuette operational scale forks with the prospect of updating the local maximum of 1.0990. With a joint breakdown of 1/2 Median Line Minute - the support level (B) 1.0850/B) - and 1/2 Median Line Minuette (1.0840), it will be possible to develop a downward movement of EUR/USD towards the goals:
Details of the EUR/USD movement options are shown on the animated chart.
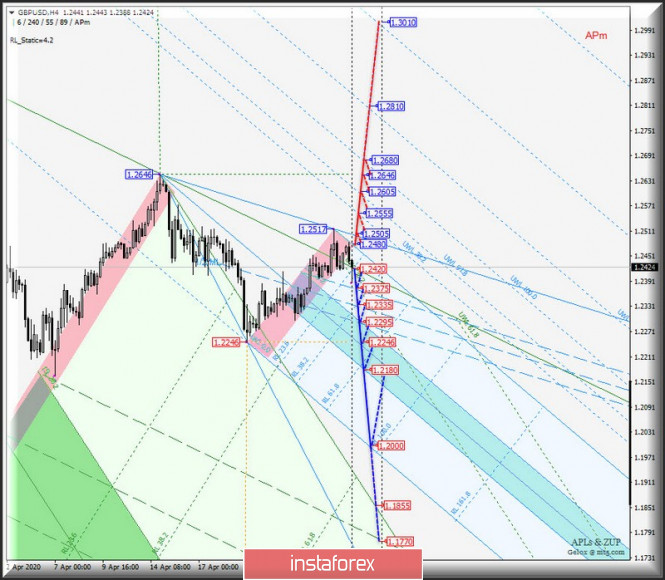
____________________ Great Britain pound vs US dollar The movement of the currency of Her Majesty GBP/USD from April 30, 2020, will also be due to the development and direction of the breakdown of the range:
The breakdown of the initial line SSL of the Minuette operational scale fork - resistance level of 1.2480 - together with the control line UTL Minuette (1.2505) make urgent continuation of the upward movement of the currency of Her Majesty for the purposes:
Breakdown of the control line LTL of the Minuette operational scale fork - support level of 1.2420 - an option to reach the GBP/USD borders of the channel 1/2 Median Line (1.2375-1.2335-1.2295) and the equilibrium zone (1.2295-1.2246-1.2180) of the Minuette operational scale fork. Details of the movement of GBP/USD can be seen on the animated chart.
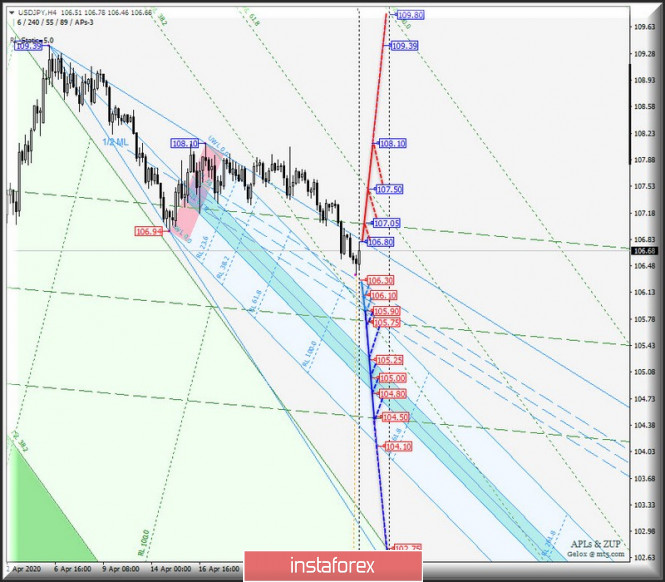
____________________ US dollar vs Japanese yen The currency movement of the "Land of the Rising Sun" USD/JPY from April 30, 2020 will also be determined by mining and the direction of the breakdown of the range:
In case of breakdown of the support level of 106.30, the development of the currency of the "Land of the Rising Sun" will continue in the 1/2 Median Line Minuette channel (106.30-106.10-105.90), and if you happen to have a joint breakdown of the lower border of the channel 1/2ML Minuette (105.90) and a 1/2 Median Line Minute (105.75), then the downward movement of this financial instrument can be continued to the zone equilibrium (105.25-105.00-104.80) of the Minuette operational scale fork. And if there is a breakdown of the UTL control line of the Minuette operational scale fork - the resistance level of 106.80 - then the development of the upward movement of USD/JPY can be continued to the goals:
Details of the movement of USD/JPY are shown on the animated chart.
____________________ The review is compiled without taking into account the news background, the opening of trading sessions of the main financial centers, and is not a guide to action (placing "sell" or "buy" orders). The formula for calculating the dollar index: USDX = 50.14348112 * USDEUR0.576 * USDJPY0.136 * USDGBP0.119 * USDCAD0.091 * USDSEK0.042 * USDCHF0. 036. Where the power coefficients correspond to the weights of currencies in the basket: Euro - 57.6 %; Yen - 13.6 %; Pound - 11.9 %; Canadian dollar - 9.1 %; Swedish Krona - 4.2 %; Swiss franc - 3.6 %. The first coefficient in the formula brings the index value to 100 on the starting date - March 1973 when the main currencies began to be freely quoted relative to each other. The material has been provided by InstaForex Company - www.instaforex.com |
| April 29, 2020 : GBP/USD Intraday technical analysis and trade recommendations. Posted: 29 Apr 2020 09:18 AM PDT
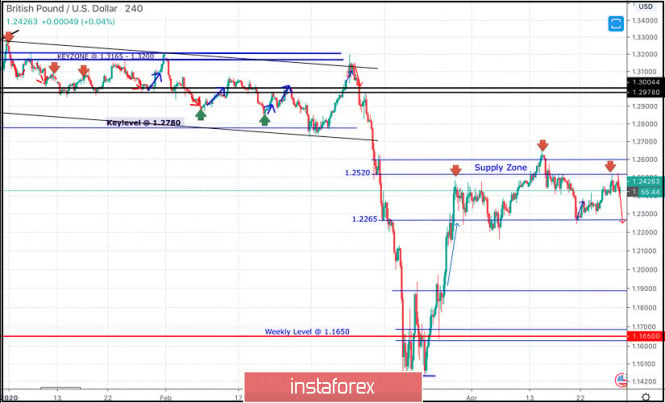
Recently, the GBPUSD has reached new LOW price levels around 1.1450, slightly below the historical low (1.1650) achieved in September 2016. That's when the pair looked very OVERSOLD around the price levels of 1.1450 where a double-bottom reversal pattern was recently demonstrated as depicted on the chart. Technical outlook will probably remain bullish if bullish persistence is maintained above 1.1890-1.1900 (Double-Bottom Neckline) on the H4 Charts. Bullish breakout above 1.1900 invalidated the bearish scenario temporarily & enabled a quick bullish movement to occur towards 1.2260. Next bullish targets around 1.2520 and 1.2680 were expected to be addressed if sufficient bullish momentum was maintained. However, early bearish pressure signs have originated around 1.2470 leading to the previous bearish decline towards 1.2265. That's why, H4 Candlestick re-closure below 1.2265 was needed to hinder further bullish advancement and resume the bearish momentum on the short term. On the other hand, the recent bullish persistence above 1.2265 has enhanced another bullish pullback movement up to the price levels of 1.2520-1.2590 where evident signs of bearish rejection were manifested. A Bearish Head & Shoulders reversal pattern may be in progress. The pair is currently demonstrating the right shoulder of the pattern. Hence, Bearish persistence below 1.2265 (Reversal Pattern Neckline) is needed to enhance another bearish movement towards 1.2100, 1.2000 then 1.1920 where price action should be evaluated again. On the other hand, any form of bullish breakout above 1.2600 brings bullish momentum into the market. Trade recommendations : Intraday traders should be looking for bearish rejection around the SupplyZone (1.1520-1.2600) as a valid SELL signal. However, conservative ones should wait for upcoming bearish breakout below 1.2265 as a valid SELL entry. T/P level to be located around 1.2270, 1.2100, 1.2000 then 1.1920 while S/L should be placed above 1.2600. The material has been provided by InstaForex Company - www.instaforex.com |
| April 29, 2020 : EUR/USD Intraday technical analysis and trade recommendations. Posted: 29 Apr 2020 09:13 AM PDT
Few weeks ago, the EURUSD pair has expressed significant bullish recovery around the newly-established bottom around 1.0650. The following bullish engulfing H4 candlesticks as well as the recently-demonstrated ascending bottoms indicated a high probability bullish pullback at least towards 1.0980 and 1.1075 (Fibonacci Level 50%). Key Supply-Levels in confluence with significant Fibonacci levels are located around 1.1075 (50% Fibonacci) and 1.1175 (61.8% Fibonacci) where bearish rejection was highly-expected upon the latest bullish pullback that took place by the end of March. Thus, the depicted Head & Shoulders pattern was demonstrated around the price levels of (1.1000 - 1.1075). Further bearish decline was demonstrated towards 1.0800 where the nearest demand level to be considered was located near the backside of the broken channel (1.0800-1.0750). Recent signs of Bullish rejection have been manifested around the price zone of (1.0800-1.0750) leading to the recent bullish spike up to 1.0990. The short-term technical bullish outlook remains valid as long as bullish persistence is maintained above the recently-established ascending Bottom around 1.0770. Further bullish advancement is expected to pursue towards 1.1000, 1.1075 then 1.1175 where 61.8% Fibonacci Level is located. Despite the recent bearish decline, the price zone of (1.0815 - 1.0775) stood as a prominent Demand Zone which has been providing bullish support for the pair. On the other hand, Please note that any bearish breakout below 1.0830 or 1.0770 (the recently established bottoms) invalidates the previously-mentioned bullish outlook. Trade recommendations : Intraday traders were advised to look for valid short-term BUY trades around the price zone of 1.0815 - 1.0775. S/L to be placed below 1.0725 while T/P levels to be located around 1.0850, 1.0900, 1.1000 and 1.1075. The material has been provided by InstaForex Company - www.instaforex.com |
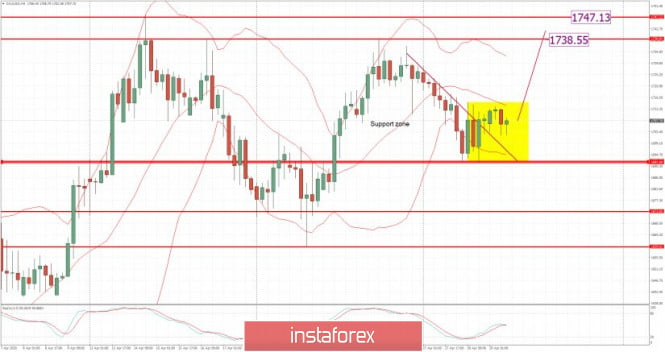
| Market review. Trading ideas. Answers for questions Posted: 29 Apr 2020 06:49 AM PDT Trading recommendations: Gold – open deals when the price breaks the levels of $1,714, $1,738, $1,747 The material has been provided by InstaForex Company - www.instaforex.com |
| Evening review for April 29, 2020. EURUSD. Euro failed to overcome 15-day average on the way up Posted: 29 Apr 2020 06:35 AM PDT
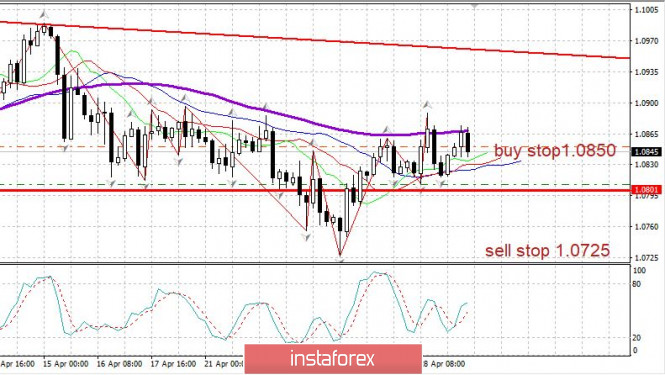
EURUSD: The graph clearly shows how the euro rests for the third time in a row and can not go above 100 average on H4 (presented through the thick blue average in the picture). This is approximately a 16-day average. The report on US GDP for the 1st quarter was released with a - 4.8%. It is hard to imagine how strong the fall will be in the next quarter since, in the 1st quarter, the crisis caught only 10 days in March. That being said, perhaps we can expect a drop in GDP by -20 to -30. Today the Fed's decision on the rates is expected at 18:00 UTC. You can keep purchases from 1.0850. In case of a turn and fall to 1.0808, consider selling from 1.0808. The material has been provided by InstaForex Company - www.instaforex.com |
| EURUSD and GBPUSD: Federal Reserve meeting. Pound continues to decline Posted: 29 Apr 2020 06:30 AM PDT Again, the euro made an unsuccessful attempt to grow against the US dollar during European trading after data that indicated a sharp increase in lending in the eurozone. However, traders are now more focused on the outcome of the meeting of the Federal Reserve System. Many expect the committee to leave rates unchanged but will announce new assistance programs, as well as expand the bond redemption program, which will support the country economy after the restart, which is now prolonged due to the coronavirus pandemic. Investors also expect Fed Chairman, Jerome Powell, to disclose information on what tools the central bank has prepared to withstand the economic downturn in the future, and what scenario will the regulator operate after the economy begins to gradually recover and bounce back. The coronavirus pandemic has significantly affected the US GDP and has already led to a noticeable contraction in the global economy. It is expected that the US regulator will not resort to negative interest rates, at least in the near future, until the extent of the damage from the pandemic becomes more or less clear. It is possible that traders will respond to forecasts that will be published by the economists of the Federal Reserve System about how fast the economy will recover. If the reports are reviewed for the worse, compared with the previous meeting, pressure on risky assets may resume, and the US dollar will begin to grow against the euro and the pound that of which it has been preparing all this week.If the data do not differ much from the previous indicators, and if Powell declares that the economy is ready for a complete reset, then the euro may significantly strengthen against the US dollar, as the demand for risky assets will increase significantly. Although today's data from the European Central Bank allowed the euro to regain its position a little, somehow this did not lead to a more powerful upward correction. The report indicates that the eurozone M3 monetary aggregate in March this year grew immediately by 7.5% compared to March 2019 with a forecast of 5.4%. The moving average of the monetary aggregate from January to March grew by 6.0%. As for the lending itself, the growth in March remained practical at the February level. The report indicates that lending to households in March increased by 3.4% compared to 3.7% in February, while lending to companies did increase immediately by 5.4% against 3.0% in February this year. This suggests that even then, many companies began to feel the problems associated with the spread of the coronavirus pandemic, and rushed to ask for access to cheap money. The technical picture of the EURUSD pair has not changed much compared to the morning forecast. The resumption of the growth of the trading instrument is expected at the support of 1.0810. If buyers are able to hold it, then we can expect a second wave of growth to the resistance of 1.0870 and its breakdown, which will open the way for bulls to the highs of 1.0910 and 1.0940. If pressure on the pair persists, then a breakthrough of 1.0810 will necessarily lead to a larger sale of risky assets with a test of lows 1.0785 and 1.0730. GBPUSD The British pound is experiencing growth problems today and has already returned to the lows of the week. However, it is not possible to break below yet. Forecasts for UK GDP growth from various economic agencies continue to enter the market. A report came out today, which indicates that, in the case of restrictive measures for more than three months, UK GDP without the proper intervention of the Bank of England and the government in 2020 could be reduced by 12%. Such a negative outlook is designed in case strict containment measures are maintained until the end of June. As for the technical picture of the GBPUSD pair , only a real breakthrough of the week's lows at 1.2350 will lead to the formation of a new downward trend. So far, all downward movements will be perceived by market participants as bargains at attractive prices. The first support levels are already visible around 1.2400. We can talk about the further implementation of the bullish scenario after breaking today's high at 1.2480, which will open a direct road to 1.2580 and 1.2640. The material has been provided by InstaForex Company - www.instaforex.com |
| BTC analysis for 04.29.2020 - Strong resistance on the test at the price of $8.400 Posted: 29 Apr 2020 06:10 AM PDT
Despite its nascency, central bank digital currencies and their offshoots have rapidly evolved into a serious alternative to typical bank accounts. A BTC has been trading upwards. The price reached the strong resistance zone at the level of $8,100. My advice is to be careful buying into the resistance. Resistance levels is set at the price of $8,400 Support levels are set at the price of $7,520 The material has been provided by InstaForex Company - www.instaforex.com |
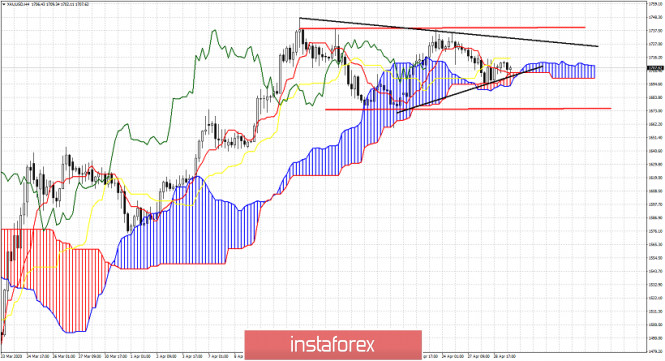
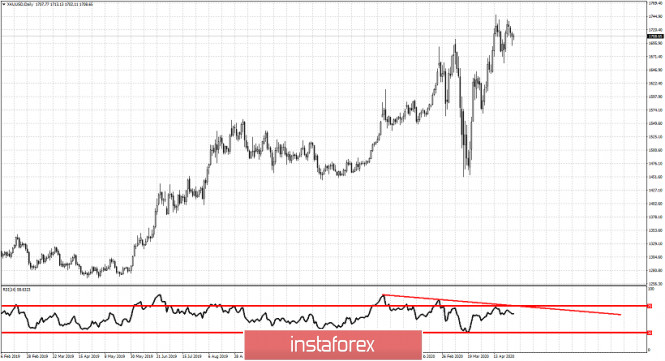
| Gold continues its sideways movement Posted: 29 Apr 2020 04:59 AM PDT Gold price continues to move inside the trading range of $1,750 and $1,670 since mid April. Price has no clear direction. We expect to get some signals if certain support or resistance levels break. Both bullish and bearish scenarios are still open. Medium-term trend remains bullish, but we lean more on the bearish scenario.
Black lines - triangle pattern Gold price is challenging the Ichimoku cloud support. So far this support has been respected. Breaking below $1,694 will be a bearish sign according to the Ichimoku indicator. At the same time price would have broken the lower triangle boundary. Another bearish sign. If price exits the trading range then we should expect more strength towards the same direction with the break out.
|
| Posted: 29 Apr 2020 04:57 AM PDT To open long positions on EURUSD, you need: In my morning forecast, I paid attention to the probability of a breakout of the level of 1.0855 and an attempt by euro buyers to build an upward trend from it to the area of new weekly highs. As we can see on the 5-minute chart, the bulls managed to break above 1.0855 and even tested this level from top to bottom on the volume, which was a signal to open long positions. However, the growth stalled before it started, and the bulls left the market gradually when the pair declined to the level of 1.0855. At the moment, new support of 1.0840 has been formed, which buyers need to protect. Only the formation of a false breakout on it will be a signal to open new long positions, which will lead to a repeat test of the resistance of 1.0872. However, it will be possible to talk about the resumption of the upward trend only after updating the maximum of 1.0905, where I recommend fixing the profits. The longer-term target will be the resistance of 1.0937. If there is no activity in the support area of 1.0840 in the second half of the day, and the US GDP data will be much worse than the forecasts of economists, I recommend postponing long positions in the euro until the update of the minimum of 1.0812, provided that a false breakout is formed there. It is best to buy EUR/USD for a rebound after testing the local lows of 1.0787 and 1.0755 in the expectation of correction of 30-40 points.
To open short positions on EURUSD, you need: Sellers failed to form a false breakout in the resistance area of 1.0855, but they also failed to update yesterday's highs, which keeps the market somewhat equal before the release of important fundamental data on the US, as well as before the Federal Reserve decided on interest rates. In the second half of the day, the bears' task will be to break through and consolidate below the support of 1.0840, which will increase pressure on EUR/USD and open a direct path to the lows of 1.0812 and 1.0787, where I recommend fixing the profits. The worse the US GDP data will be, the stronger will be the demand for the US dollar. If the bulls again try to take control of the market, then you can sell the euro from the level of 1.0872 only after the formation of a false breakout. Otherwise, I recommend looking at short positions only after updating the large local highs of 1.0905 and 1.0937, to rebound down by 30-40 points within the day.
Signals of indicators: Moving averages Trading is conducted in the area of 30 and 50 daily moving averages, which indicates temporary equality in the market. Note: The period and prices of moving averages are considered by the author on the hourly chart H1 and differ from the general definition of the classic daily moving averages on the daily chart D1. Bollinger Bands The upper limit of the indicator in the area of 1.0872 has already worked out today and now it is the lower limit in the area of 1.0820, which can also limit the downward movement in the pair. Description of indicators
|
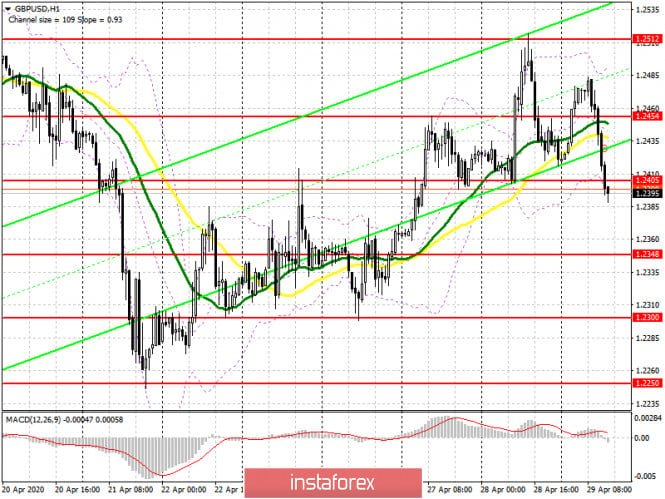
| Posted: 29 Apr 2020 04:56 AM PDT To open long positions on GBPUSD, you need: In my morning review, I recommended opening short positions after a breakout and consolidation below the level of 1.2454. If you look closely at the 5-minute chart, you will see how the bears broke through on the second attempt below this range, and then returned with a test of this level from the top down, which led to the formation of a sell signal, which was necessary to use. At the moment, buyers have an important task to keep the pair above the level of 1.2405, but they are not very good at this yet. Only a return and consolidation at this level in the second half of the day can lead to an upward correction to the resistance area of 1.2454. The longer-term goal will be the maximum of this week in the area of 1.2512, where I recommend fixing the profits. If the pressure on the pound continues, and we have US GDP data and the Federal Reserve's decision on interest rates ahead, then it is best to consider new long positions only after updating the support of 1.2348 or buy GBP/USD immediately on the rebound from the larger minimum of 1.2300 in the calculation of correction of 30-40 points within the day.
To open short positions on GBPUSD, you need: Sellers did a great job in the morning and broke below the level of 1.2454, which led to the demolition of several stop orders from Asian buyers of the pound and a larger sale to the area of weekly lows, where the downward movement slowed down. At the moment, the bears' task is to consolidate below the range of 1.2405, but it is unlikely to do without a small upward correction. If the bears do not release a pair above 1.2405, we will likely see tests of the lows of 1.2348 and 1.2300 in the North American session, where I recommend fixing the profits. If buyers are more persistent, it is best to return to short positions after forming a false breakout in the resistance area of 1.2454 or sell GBP/USD already on the rebound from the weekly high in the area of 1.2512.
Signals of indicators: Moving averages Trading is below the 30 and 50 daily averages, which indicates a return to the market of sellers of the pound. Note: The period and prices of moving averages are considered by the author on the hourly chart H1 and differ from the general definition of the classic daily moving averages on the daily chart D1. Bollinger Bands A break in the lower border of the indicator around 1.2405 will only increase the pressure on the pair. Description of indicators
|
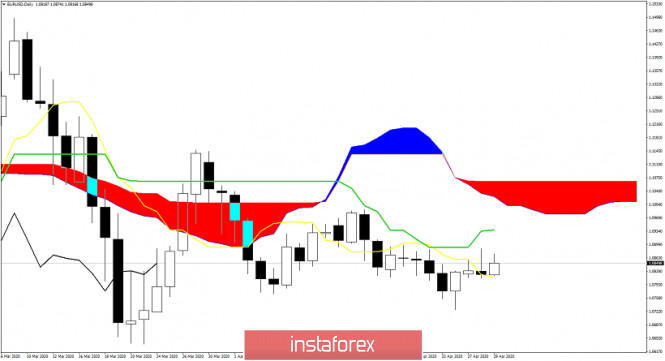
| EURUSD remains in bearish short-term mode as long as price is below 1.09 Posted: 29 Apr 2020 04:52 AM PDT EURUSD seemed ready for a bigger bounce yesterday towards 1.0930 or even 1.10 but bulls are not showing real signs of strength. Although price is above the tenkan-sen, the kijun-sen is still unreachable.
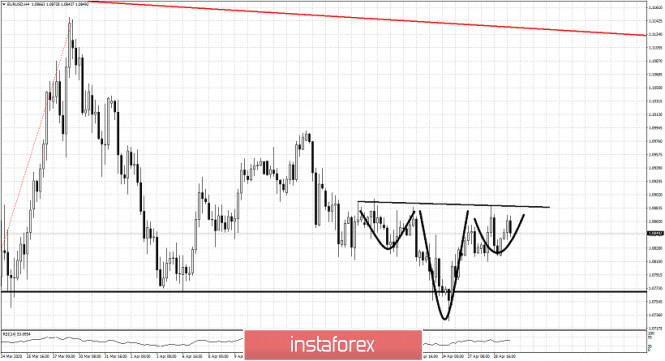
EURUSD as can be seen in the 4 hour chart above, is forming an inverted Head and Shoulders pattern. This pattern is activated on a break above 1.0890-1.09. A clear break above this level will open the way for a bigger bounce towards 1.1050. Support is at 1.0810. Therefore a failure to hold above 1.08 will confirm that bears are stepping back in and taking control of the trend. Target remains around 1.06 as we explained in previous posts. No trend change yet. The material has been provided by InstaForex Company - www.instaforex.com |
| Posted: 29 Apr 2020 04:45 AM PDT Information about the gradual opening of the American and several European economies allowed the world stock indices to continue the rally and clipped the wings of the "bulls" for XAU/USD. However, it should not be considered as a factor of the long-term weakness of gold. First, the global recession has not been canceled, which suggests further deterioration in macrostatistics and continued high demand for safe-haven assets. Second, investors have taken to buying both stocks and precious metals at the same time. The latter is used as a hedging tool against existing risks. In general, gold continues to function as a safe haven asset but is not used as a panic medicine like the US dollar. Fear in the US equity market has given way to greed. Investors are trying not to miss the S&P 500 train going North, but large-scale spending by governments and central banks to save economies will continue to increase. This circumstance allows gold to look to the future with confidence. Dynamics of monetary stimulus volumes
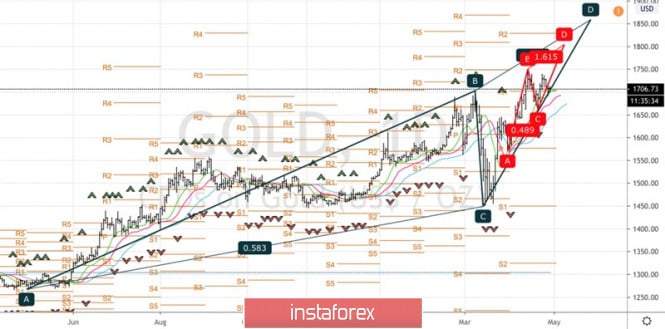
A significant increase in fiscal stimulus will lead to an increase in public debt relative to GDP by 10-15 percentage points. According to Moody's estimates, the US budget deficit in 2020 will expand from 4.6% to 15% of the size of the economy. The Fed's unlimited purchases of treasury and mortgage bonds indicate that the central bank is actively participating in the debt monetization process, which is good news for the XAU/USD bulls. At the same time, aggressive monetary expansion of the Federal Reserve, ECB, Bank of Japan, and other regulators contributes to the weakness of their issued monetary units, and gold, according to Commerzbank, remains in demand as the main anti-crisis currency. Its long-term prospects are painted in bright colors. It is also possible to update the historical maximum of $1921 per ounce. The fact that the precious metal flows from Asia to Europe and the United States also testifies to the preservation of the "bullish" momentum. Investment demand is high and the price increase leads to a consumption reduction in the field of jewelry in India and China. In the United States, American Gold Eagles coins are flying like hotcakes. The premiums on their purchase reach a record of $135 per ounce compared to spot market prices. Thus, there is no doubt about the strength of the long-term upward trend for XAU/USD. Another thing is that in the short term, the risks of a pullback gradually increase. The poor statistics on US GDP for the first quarter, Jerome Powell's doubts about the V-shaped recovery of the US economy and its slower opening than previously expected, may trigger the process of profit-taking on long positions on US stock indices and lend a helping hand to the dollar. As a result, gold risks falling to $1,665 and $1,635 per ounce, where it will be possible to start forming long-term longs. Technically, there are important Pivot levels at $1,665 and $1,635, and updating the April high activates the child pattern AB=CD with a target of 161.8%. It corresponds to the $1,800 per ounce mark. Gold, the daily chart
|
| Posted: 29 Apr 2020 04:41 AM PDT Corona virus summary:
68 people have already died at a veterans' home in Massachusetts Technical analysis: Gold has been tradingsideways at the price of . The prie re-tested the level of $1,694 but i rejected strongly from our support at the price of $1,695.I see potential for the upside movement and test of the $1,738-$1,746. Support level is set at the price of $1,691 The material has been provided by InstaForex Company - www.instaforex.com |
| Posted: 29 Apr 2020 04:32 AM PDT Corona virus summary:
China's parliament will start its annual meeting on 22 MayTechnical analysis: USD/JPY has been trading downwards. The USD/JPY did break 10-day balance to the downside and I do expect further drop towards the levels at 105,85 and 105,25. Trading recommendation: Resistance levels are set at the price of 106,90 and 107,95 Support levels are set at the price of 105,85 and 105,25. The material has been provided by InstaForex Company - www.instaforex.com |
| Technical Analysis of AUD/USD for April 29, 2020 Posted: 29 Apr 2020 03:51 AM PDT Overview: The AUD/USD pair will continue to rise from the level of 0.6443. The support is found at the level of 0.6443, which represents the 50% Fibonacci retracement level in the H1 time frame. The price is likely to form a double bottom. Today, the major support is seen at 0.6443, while immediate resistance is seen at 0.6548. Accordingly, the AUD/USD pair is showing signs of strength following a breakout of a high at 0.6443. So, buy above the level of 0.6500 with the first target at 0.6548 in order to test the daily resistance 1 and move further to 0.6614. Also, the level of 0.6614 is a good place to take profit because it will form second resistance. Amid the previous events, the pair is still in an uptrend; for that we expect the AUD/USD pair to climb from 0.6443 to 0.6614 today. At the same time, in case a reversal takes place and the AUD/USD pair breaks through the support level of 0.6443, a further decline to 0.6338 can occur, which would indicate a bearish market. The material has been provided by InstaForex Company - www.instaforex.com |
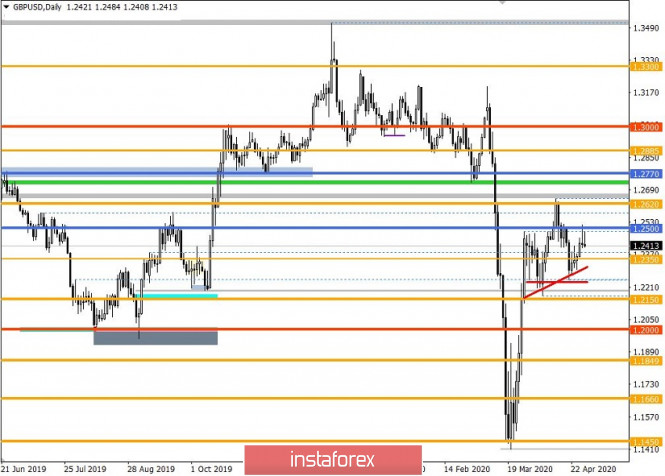
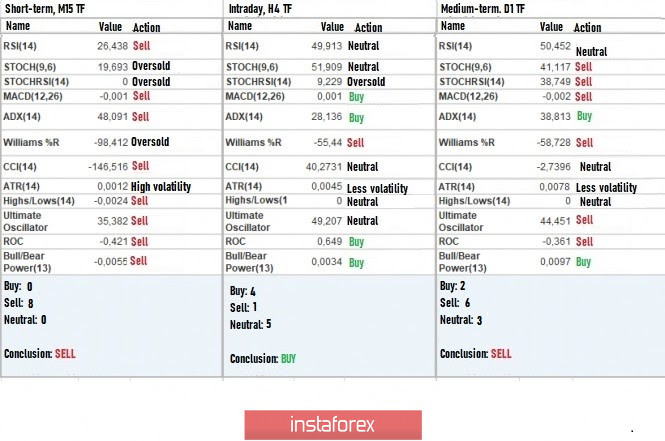
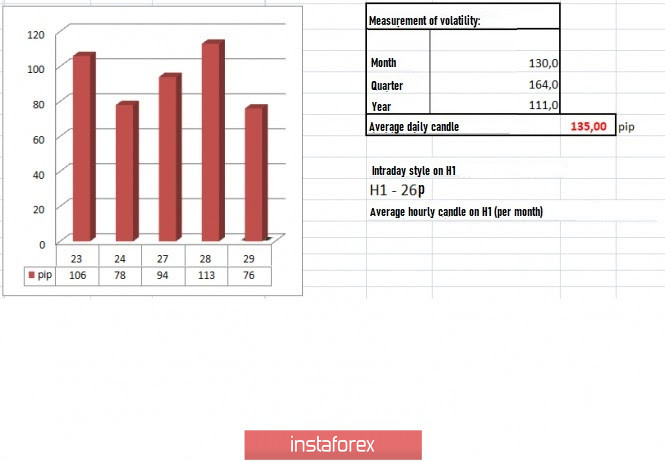
| Trading recommendations on GBP/USD for April 29, 2020 Posted: 29 Apr 2020 03:50 AM PDT Trading formed an inverted V-shaped formation, from which the level of 1.2500 was reached. The variable upward move from the pivot point of 1.2246 returned the quotes to 1.2500, but failed to maintain it, making it a lever for short positions. The inverted V-shaped formation is seen more clearly in the minutes charts, where the round of long positions had a time interval of 08: 00–12: 15 (London time), and the round of short positions came at the time of 12 : 30-21: 45 (London time). The fluctuation coincides up to an hour with the dynamics of the EUR / USD pair, which indicates that the engine was linked to the US dollar. Meanwhile, in the "Head and Shoulders" pattern, which we have been conducting for the second week on the daily chart, the right shoulder is at a conditional peak, where the level of 1.2500 plays the role of resistance, on which the left shoulder was concentrated in due time. Reversal of the movement conducted in March 23 to April 14 strengthens the prospects of a downward move, where the strongest signal is the price consolidation below 1.2150. Fluctuations in the time frames subtly hints the trend change. A trend reversal reflects the resumption of an upward tact, but in this case, needs the quotes to go through the 1.2620 / 1.2650 area. In terms of volatility, traders' activity for the past four days were the highest recorded, but is still below the average daily value. Nonetheless, the average figure is gradually recovering from the panic mood last month, which indicates that the 80-110 values will be considered as the norm soon, not a slowdown. Details of volatility: Monday - 165 points; Tuesday - 245 points; Wednesday - 172 points; Thursday - 358 points; Friday - 359 points; Monday - 144 points; Tuesday - 271 points; Wednesday - 676 points; Thursday - 354 points; Friday - 522 points; Monday - 267 points; Tuesday - 296 points; Wednesday - 333 points; Thursday - 452 points; Friday - 352 points; Monday - 148 points; Tuesday - 227 points; Wednesday - 108 points; Thursday - 126 points; Friday - 198 points; Monday - 116 points; Tuesday - 217 points; Wednesday - 131 points; Thursday - 122 points; Friday - 42 points; Monday - 87 points; Tuesday - 146 points; Wednesday - 193 points; Thursday - 119 points; Friday - 114 points; Monday - 86 points; Tuesday - 198 points; Wednesday - 111 points; Thursday - 106 points; Friday - 78 points; Monday - 94 points; Tuesday - 113 points. The previous review discussed local buy positions in the direction of the 1.2500 level, from which consolidations were made and reverse positions were put into effect. Price fluctuations were observed in the daily chart, in the variable frames of 1.2250, 1.2500, and 1.2620. The process has been going on for about a month. Yesterday's news, revealing a 1% decline in US wholesale stocks, surprised the market and favored the dollar, which strengthened during this period. Gradual improvement in the global coronavirus situation is observed, but the consequences of quarantine measures awaits ahead. Thus, Laura Gardiner, Research Director of Resolution Foundation, believes that UK unemployment may hit 1980's figure, and reckons that the duration of the outbreak will last up to two years, and may even produce re-outbreaks, which will shed more damage to the economy. Impacts will include significant economic contraction, debt crisis, and departure from globalization. With regards to Brexit, Europeans view existing negotiations as ineffective and deadlocked. "We are at an impasse, there are many minor technical details where we could find a solution, but on fundamental issues, each side is trying to achieve its goals, and the differences are huge. This cannot be solved without political impulse, but it is absent, "said one of the European diplomats. 1st quarter preliminary estimates on US GDP will come out today, where an economic decline of 4.6% is expected (consensus 4.0%). Consequences of the quarantine measures will be reflected in the second quarter. FOMC results will also come out today, where a rate change is not expected, but statements are still anticipated. Further development The current trading chart reflects the impressive activity of traders, from which quotes manage to make a V-shaped formation, although failing to reach the level of 1.2500. Concentration was at the variable basis of 1.2400 / 1.2415, which is an excellent sign for short positions, but sell signal will only come after price consolidation below the established area. Trend reversal to bearish will occur at a formation of "Head and Shoulders" pattern, from which quotes will move lower than 1.2150. Meanwhile, USD rally will be halted if today's preliminary US GDP data turns out to be weak. Nonetheless, investors continue trading the dollar due to the increased risk in the global economy. Downward move will resume at price consolidation below 1.2390. Otherwise, the course will continue to 1.2400 / 1.2500. Based on the above information, we derived these trading recommendations: - Selling positions lower than 1.2390, towards 1.2350–1.2300. - Buy positions from the value of 1.2445, towards 1.2500. Indicator analysis Hourly charts indicate bullish mood, while daily charts signal bearish. Minute time frames, meanwhile, reflect a V-shaped oscillation. Volatility per week / Measurement of volatility: Month; Quarter year Volatility measurement reflects the average daily fluctuation, calculated per Month / Quarter / Year. (April 29 was built, taking into account the time of publication of the article) Current volatility is 76 points, which is 43% below the daily average. Volatility may accelerate at the break of the 1.2400 / 1.2500 range. Key levels Resistance Zones: 1.2500; 1.2620; 1.2725 *; 1.2770 **; 1.2885 *; 1.3000; 1.3170 **; 1.3300 **; 1.3600; 1.3850; 1.4000 ***; 1.4350 **. Support areas: 1.2350 **; 1.2250; 1.2150 **; 1.2000 *** (1.1957); 1.1850; 1.1660; 1.1450 (1.1411); 1.1300; 1,1000; 1,0800; 1,0500; 1,0000. * Periodic level ** Range Level *** Psychological level **** The article is built based on the principle of conducting transactions, with daily adjustments The material has been provided by InstaForex Company - www.instaforex.com |
| You are subscribed to email updates from Forex analysis review. To stop receiving these emails, you may unsubscribe now. | Email delivery powered by Google |
| Google, 1600 Amphitheatre Parkway, Mountain View, CA 94043, United States | |













No comments:
Post a Comment