
Forex analysis review |
- Gold will face important challenges next week.
- The Dollar index trapped inside Fibonacci price range.
- Comprehensive analysis of movement options of AUD/USD, USD/CAD, and NZD/USD (daily) in April 2020. The analysis of the APLs
- April 3, 2020 : GBP/USD Intraday technical analysis and trade recommendations.
- EUR/USD evening review for April 03, 2020. Market stuck in the range, to wait for the US state on Monday
- GBP/USD: plan for the US session on April 3. Bears are counting on a major flight of the pound down. The support of 1.2315
- EUR/USD: plan for the US session on April 3. Bears continue to control the market and follow the set course to the lows of
- Trading plan for EUR/USD for April 03, 2020
- Will the dollar stop plan B?
- BTC analysis for 04.03.2020 - Major pivot resistance at the price of $7.000 is on the test, potential for downside rotation
- Analysis for Gold 04.03.2020 - Watch for the potential breakout of the channel to confirm downside. Gold is at the major
- Analysis of EUR/USD on April 3, 2020
- Trading recommendations for GBPUSD pair - prospects for further movement
- EUR/USD analysis for 04.03.2020 - Downside pressure on the EUR and potential for testing of ourr main target at 1.0640
- EUR/USD: the dollar is on a slippery path
- Analysis of EUR/USD and GBP/USD for April 3. Dollar leads despite possible failure of US statistics today
- Analysis of AUD/USD on April 3, 2020
- Technical analysis of EUR/USD for April 03, 2020
- Trading recommendations for EUR/USD pair on April 3
- InstaForex Daily Analysis - 3rd April 2020
- Trader's diary for April 03, 2020. EUR/USD, EU support on Italy, and coronavirus
- With faith in hope (EUR/USD and GBP/USD review on 04/03/2020)
- EUR/USD. April 3. 1 million cases of COVID-2019 virus in the world. The euro is preparing for a new fall. The trader is waiting
- GBP/USD. April 3. The pound goes to the "sideways". Traders are waiting for data on Nonfarm Payrolls and unemployment in
- EUR/USD: The bears of euro are ready to update the annual lows. The 10% unemployment rate in US is an expected reality,
| Gold will face important challenges next week. Posted: 03 Apr 2020 03:10 PM PDT Gold price remains in a bullish short-term trend as price continues to respect Kumo (cloud) support. Price is above the Ichimoku cloud and a big test is waiting for bulls this Monday. A major downward sloping trend line resistance will be the first obstacle next week.
Gold price is at a major resistance. Price is testing the trend line and the recent highs near $1,630. Support is at $1,610-$1,605 and next at $1,596. A 4 hour close below these levels will be a bearish sign for Gold. If this happens I expect Gold to pull back towards $1,553 which is the lower cloud boundary. Another indicator that confirms we are at important resistance is the Chikou span (light blue line indicator). The Chikou span is hitting the candlestick pattern from below. The Chikou span confirms we are now at important resistance area. Bulls need to break above it in order to hope for a move to $1,650 or higher. The material has been provided by InstaForex Company - www.instaforex.com |
| The Dollar index trapped inside Fibonacci price range. Posted: 03 Apr 2020 03:03 PM PDT The Dollar index had a strong week as price bounced off key Fibonacci support at 98.20 all the way to 100.85 where the rise stopped at another important Fibonacci resistance area. Longer-term trend remains bullish and as long as price is above 94.60 bulls remain in control.
Red rectangle - resistance The Dollar index has stopped its rise just above the 50% Fibonacci retracement of the recent decline from 103 to 98.29. Breaking above the red rectangle resistance would be an important bullish sign that will increase the chances of seeing a move above 103. Despite the bearish divergence in the RSI in the Daily chart, as long as price is above 98.20 the chances of making a higher high above 103 remain high. If price breaks below the orange rectangle the chances of approaching the 95-94 level will increase dramatically. If at the start of next week we see a rejection of price around the red rectangle then we should expect a pull back towards the orange support area. The material has been provided by InstaForex Company - www.instaforex.com |
| Posted: 03 Apr 2020 10:11 AM PDT Minor operational scale (daily time frame) In the second month of spring - what will happen with the "raw" currencies AUD/USD, USD/CAD, and NZD/USD? Overview of the development of the traffic movement from April 4, 2020. ____________________ Australian Dollar vs US Dollar Testing and direction of the range breakdown:
It will determine the development of the movement of the Australian dollar AUD/USD from April 4, 2020. Sequential breakdown of support levels:
Confirm the development of the movement of the Australian dollar in the channel 1/2 median line minute (0.6000 - 0.5860 - 0.5730) with the prospect of reaching the minimum price of 0.5510. When sharing the breakdown of the median lines (resistance of 0.6100) and median line minor (0.6130) - option of the movement AUD/USD to the upper limit of ISL61.8 (0.6240) zone equilibrium fork operational scale minute and channel borders 1/2 median line (0.6275 - 0.6380 - 0.6490) fork operational scale minor. The markup of the AUD/USD movement options from April 4, 2020, is shown on the animated chart.
____________________ US Dollar vs Canadian Dollar From April 4, 2020, the development of the movement of the Canadian dollar USD/CAD will be determined by the development and direction of the breakdown of the equilibrium zone (1.4000 - 1.4140 - 1.4300) operating scale pitchfork minute - markup for working out these levels is shown on the animated chart (opens in a separate tab). If the resistance level of 1.4300 is the upper bound ISL38.2 zone equilibrium fork operational scale minute - to achieve the Canadian dollar, the channel borders 1/2 median Line (1.4370 - 1.4490 - 1.4610) fork operational scale minute. A breakdown of the support level of 1.4000 - the lower limit of ISL61. 8 of the balance zone of the minute operating scale forks - will determine the development of the USD/CAD movement within the boundaries of the balance zone (1.4000 - 1.3840 - 1.3680) and channel 1/2 median line (1.3740 - 1.3610 - 1.3480) a fork of the minor operating scale. The markup of the USD/CAD movement options from April 4, 2020, is shown on the animated chart.
____________________ New Zealand Dollar vs US Dollar The development of the movement of the New Zealand dollar NZD/USD from April 4, 2020, will depend on the development and direction of the breakdown of the 1/2 median line channel (0.5750 - 0.5860 - 0.5970) operating scale pitchfork minute - details of working out the boundaries of the channel 1/2ML minute are shown on the animated chart. Breakdown of the support level 0.5970 - the lower border of the channel 1/2 median line in the operating scale of the minute - the continuation of the downward movement of the New Zealand dollar to the goals:
In the breakdown of the resistance level of 0.5970 - the upper border of the channel 1/2 median line fork operational scale minute - the movement of NZD/USD will be continued within the equilibrium zone (0.5925 - 0.6070 - 0.6210) fork operational scale minute and channel 1/2 median line (0.6180 - 0.6270 - 0.6360) fork operational scale minor. Marking options for the movement of NZD/USD from April 4, 2020, look at the animated chart.
____________________ The review is compiled without taking into account the news background, the opening of trading sessions of the main financial centers and is not a guide to action (placing "sell" or "buy" orders). The material has been provided by InstaForex Company - www.instaforex.com |
| April 3, 2020 : GBP/USD Intraday technical analysis and trade recommendations. Posted: 03 Apr 2020 07:53 AM PDT
Since January 13, progressive bearish pressure has been built above the price level of 1.2780-1.2800 until March the 2nd when transient bearish consolidation below 1.2780 took place within the depicted wide-ranged slightly bearish channel. Shortly after, significant bullish rejection was demonstrated around 1.2780 on March 4. Hence, a quick bullish movement was expressed towards the price zone of 1.3165-1.3200 where significant bearish pressure brought the pair back below 1.2780, 1.2500 then 1.2260 via quick bearish engulfing H4 candlesticks. Recently, the GBPUSD has reached new LOW price levels around 1.1450, slightly below the historical low (1.1650) achieved in September 2016. Recently, the GBP/USD pair looked very OVERSOLD around the price levels of 1.1450 where a double-bottom reversal pattern was recently demonstrated. Technical outlook will probably remain bullish if bullish persistence is maintained above 1.1890-1.1900 (Double-Bottom Neckline) on the H4 Charts. Bullish breakout above 1.1900 (Latest Descending High) invalidated the bearish scenario temporarily & enabled a quick bullish movement to occur towards 1.2260. Next bullish targets around 1.2520 and 1.2680 were expected to be addressed if sufficient bullish momentum was maintained. However, early bearish pressure signs have originated around 1.2470 leading to another bearish decline towards 1.2265. That's why, H4 Candlestick re-closure below 1.2265 is needed to hinder further bullish advancement and enhance the bearish momentum on the short term. If so, Initial Bearish target would be located around 1.1900 provided that quick H4 bearish closure below 1.2265 is achieved. Trade recommendations : Conservative traders should be waiting for early bearish closure below 1.2265 as a valid SELL signal. T/P level to be located around 1.2100 and 1.2000 while S/L should remain above 1.2450. The material has been provided by InstaForex Company - www.instaforex.com |
| Posted: 03 Apr 2020 07:01 AM PDT
Them US employment report for March was released which showed less than 700 thousand jobs and an increase in the unemployment rate from 3.8% to 4.5%. In the past years, Eureka would either soar up or drop-down, but now it stands still. The data from March serves as a recollection of the Tatar invasion. Over the past two weeks, the number of new unemployment benefits in the United States amounted to almost 10 million. The US administration pays huge sums of money to businesses and households in the midst of the pandemic, after all, there are almost 250,000 infected in the United States. In Moscow, Russia the number of infected cases is still at 3,500 which is so far an exponential increase, and the quarantine is still to last until April 30th. Amid this quarantine, the Russian authorities do not propose to pay people who find themselves in FORCED non-working condition. This was directly stated by Sobyanin, the mayor of Moscow, saying that, "The budget will not stand. We believe that the business has enough money to pay a month of vacation to employees." Germany, on the other hand, paid their forced "vacationers" employees at about 3 Salaries. That is without any inquiries, just on request and within a day. EURUSD: The market will be waiting for the pandemic update in Italy, Spain, and the US on Monday. Buy from 1.1040. Sell from 1.0635. The material has been provided by InstaForex Company - www.instaforex.com |
| Posted: 03 Apr 2020 05:43 AM PDT To open long positions on GBPUSD, you need: Bears managed to gain a foothold below the support of 1.2315 in the first half of the day after very poor data on activity in the UK services sector. This is clearly visible on the 5-minute chart. However, the continuation of the downward trend in the pound will depend on data on the state of the US labor market. In the second half of the day, the bulls urgently need to return a pair back to the level of 1.2315, since only in this scenario will it be possible to maintain the advantage. If the decline continues in GBP / USD, it is best to return to long positions only after the support test of 1.2150 or to rebound from the larger minimum of 1.1985, in the expectation of correction of 60-70 within the day. A breakout and consolidation above 1.2315 will push purchases to the maximum area of 1.2473, where I recommend fixing the profits.
To open short positions on GBPUSD, you need: The bears coped with the weekly task and broke below the support of 1.2315 from the 5th time. Sellers of the pound in the second half of the day need to achieve the formation of a false breakout in the resistance area of 1.2315, the pair's return to which may occur after the release of data on the state of the US labor market. Only this scenario will be an additional signal to open new short positions in the hope of continuing the decline of the pound in the short term to the area of lows 1.2150 and 1.1985, where I recommend fixing the profits. If the bears prefer to retreat again, already from the resistance of 1.2315, I recommend returning to short positions only for a rebound from the weekly maximum in the area of 1.2473.
Signals of indicators: Moving averages Trading is conducted below the 30 and 50 daily averages, which indicates the predominance of sellers in the market of the British pound. Note: The period and prices of moving averages are considered by the author on the hourly chart H1 and differ from the general definition of the classic daily moving averages on the daily chart D1. Bollinger bands If the pair grows in the second half of the day, the upper limit of the indicator around 1.2470 will act as a resistance. Description of indicators
|
| Posted: 03 Apr 2020 05:41 AM PDT To open long positions on EURUSD, you need: Another sale of the European currency after the publication of business activity indices for the services sector of the eurozone led the pair to the support of 1.0790. I paid attention to this in the morning forecast. The 5-minute chart clearly shows how the bulls try to form a false breakout, successfully making several bounces from this level, but each time they meet with larger sales. At the moment, the further movement of the euro down depends on the analysis of data on the labor market. It is unlikely that the bulls should expect the support of 1.0790, so it is best to return to long positions after updating the minimum of 1.0718, provided that a false breakout is formed there, or immediately to rebound from the annual support of 1.0626. In the scenario of the pair's growth in the second half of the day after the data on the state of the US economy, the bulls will try to regain the resistance of 1.0880, which will push EUR/USD even higher, to the maximum of 1.0955, where I recommend fixing the profits.
To open short positions on EURUSD, you need: Sellers continue to follow a clearly defined plan, keeping the pair in a downward trend throughout the week. Several unsuccessful attempts to bounce back from the support of 1.0790 only strengthened the presence of major players in the market, who are counting on a further fall in the euro after the report on the state of the US labor market. A breakout of 1.0790 will definitely lead the pair to the lows of 1.0718 and 1.0636, where I recommend fixing the profits. If the data is not as bad as many economists expect, it is possible that the euro will rebound up to the resistance area of 1.0880, from where I recommend opening short positions after forming a false breakout. You can sell EURUSD immediately on a rebound today from the maximum of 1.0955.
Signals of indicators: Moving averages Trading is below the 30 and 50 daily moving averages, which indicates a further decline in the euro in the short term. Note: The period and prices of moving averages are considered by the author on the hourly chart H1 and differ from the general definition of the classic daily moving averages on the daily chart D1. Bollinger Bands In the case of an upward correction in the second half of the day, the upper limit in the area of 1.0880 will act as a resistance. Description of indicators
|
| Trading plan for EUR/USD for April 03, 2020 Posted: 03 Apr 2020 05:27 AM PDT
Technical outlook: EUR/USD has dropped to 1.0782 lows today, and is seen to be trading around 1.0792 levels at this point in writing. Please note that the NFP figures are expected to be out in another 10 minutes and that might possibly trigger the rally that we have been waiting for in the EUR/USD pair. Technically, the single currency pair has dropped into the vicinity of fibonacci 0.618 support of the previous rally between 1.0636 and 1.1150 respectively. A bullish bounce remains high probability as long as prices stay above the 1.0636 support. Immediate resistance is seen around 1.0865, followed by 1.0975 respectively; and a push above those will be extremely encouraging for the bulls to continue further. Overall structure still remains bullish against 1.0636 levels and if this holds, EUR/USD should be staging a rally towards 1.1500 and 1.1900 levels in the next few weeks time. Trading point of view, it is good to remain long with risk at 1.0636 levels. Trading plan: Remain long, stop @ 1.0636 target above @1.1500 Good luck! The material has been provided by InstaForex Company - www.instaforex.com |
| Posted: 03 Apr 2020 05:20 AM PDT All attempts by the Fed to rein in the US dollar were futile. Neither a sharp reduction in the federal funds rate, nor the launch of unlimited purchases of Treasury and mortgage bonds under QE, nor the transfer of liquidity to foreign central banks using swaps and repos has dampened investors' interest in buying the USD index. If this continues, I am afraid that currency interventions will be necessary. According to BofA Merrill Lynch, this will happen when the EUR/USD pair falls to 1.05. In theory, this scale of dollar liquidity and the rapid expansion of the Fed's balance sheet should have knocked the "American" down. Nevertheless, the number of supporters of the "dollar smile" theory is growing rapidly. It assumes that at the first stage, the USD index is strengthened due to the strength of the US economy and the associated inflow of capital to the US securities market. When a recession begins, the dollar peaks as investors flee to safe-haven assets. Then, thanks to those who want to save stock indices from falling into the abyss with the help of aggressive monetary expansion, the Fed forms the bottom of the smile. After that, the dollar begins to grow again, as rumors increase in the market that the States will cope with the decline faster than all other countries. Currently, the USD index is moving to the third stage, so the potential for a downward movement on EUR/USD looks decent. In order to prevent a serious revaluation of the "American", we need an additional fiscal stimulus from the White House and, most likely, currency interventions. It should be noted that the reverse correlation of the S&P 500 and the dollar increases against the background of the recession. The latter is used as the primary safe-haven asset that makes actual purchase in case of return of the stock index to a downward trend. The Fed also contributed to strengthening the relationship. Its swap and repo operations have significantly reduced the cost of hedging purchases of securities issued in the United States. Now non-residents have an excellent opportunity to ensure the risks of investing in US stocks by selling futures on the USD index. Dynamics of the cost of hedging purchases of US assets
Thus, the White House, which probably does not like the strengthening of the dollar, has two main plans. Plan "A" involves using all possible tools for the growth of the American stock market, including additional fiscal stimulus. Plan "B" is a foreign exchange intervention. Donald Trump has already hinted at increasing infrastructure investment by $2 trillion, which will be funded by issuing bonds. Low, almost zero cost of borrowing, according to the US President, allows us to implement this program quickly and cheaply. In my opinion, without an improvement in the epidemiological situation in the States, which will allow us to start the process of economic recovery, we should not count on the S&P 500 rally. At best, the stock index will enter a state of consolidation, at worst, it will restore a downward trend. In this regard, sales of EUR/USD with a target of 1.05, prompted by the AB=CD pattern, look relevant. EUR/USD, the daily chart
|
| Posted: 03 Apr 2020 04:48 AM PDT BTC news:
With growing mobile money across the globe, Revolut has joined the list of growing bank challengers in the UK. The platform is offering an alternative to the central government-controlled fiat currency. With a fixed supply, Bitcoin is seen as the alternative to the fiat especially at a time when governments are printing more money through the quantitative easing program. Technical analysis: BTC has been trading upwards.The price tested and rejected of the very important pivot level at $7.000, which is sign that there is potential for downside rotation. The action around the critical level at $7.000 will be important fore the further direction. Yesterday's daily close was well off the high, which is another sign that there is potential for the downside. MACD oscillator is still showing reading below the zero but the slow line is going upwards. Major resistance is set at $7.000 and the next one is at $7.630. My recommendation is to watch for selling opportunities around the critical pivot at $7.000.Potential targets can be set at $6.131, $5.180 and even $3.877 The material has been provided by InstaForex Company - www.instaforex.com |
| Posted: 03 Apr 2020 04:34 AM PDT Corona virus news:
China seeks to lead amid talk of 10m potential global cases Residents of Wuhan, the Chinese city where the Covid-19 pandemic began, have been told to stay indoors and remain vigilant ahead of an easing of travel restrictions. Meanwhile, Beijing is stepping up a media campaign in the west to frame its handling of the disease as an example of global leadership. The country's Covid-19 statistics have been called into question, but on Thursday China recorded just 31 new cases, 29 of them in people arriving from other countries. Technical analysis: Gold has been trading upwards.The price tested and rejected of the very important pivot level at $1.619, which is sign that there is potential for downside rotation. I found the upward channel that is active and the eventual breakout to the downside may confirm further drop towards the levels at $1.566 and $1.515. Selling opportunities will be preferable in case of the downside break. If you see the breakout of $1.620 level, watch for buying opportunities on the dips with the target at $1.643. Stochastic oscillator is showing overbought condition and potential for the downside movement. Intraday resistance level is set at the price of $1.619 Support levels and downward targets are set at the price of $1.566 and $1.515. The material has been provided by InstaForex Company - www.instaforex.com |
| Analysis of EUR/USD on April 3, 2020 Posted: 03 Apr 2020 04:32 AM PDT Waiting for Nonfarm Payrolls Hello, dear colleagues! The main event of today and the whole week will be data on the US labor market, which will be published at 13:30 London time. Economists' forecasts are disappointing. It is expected that the unemployment rate will rise from 3.5% immediately to 3.8%, and the growth of the average hourly wage will be the usual 0.2%. As for the creation of new jobs in non-agricultural sectors of the American economy, this indicator may fall to minus 100 for the first time since the financial and economic crisis of 2008. In principle, market participants are well aware that in the context of the ongoing rampant COVID-19 around the world, strong data on the US labor market can not be expected. Interest is aroused by the actual figures and the reaction of investors to them. Has the coronavirus epidemic had such a significant impact on the economy of the United States of America, or will it be a little later? There will certainly be negative consequences for the world's leading economy. The question is when exactly to expect a peak? So far, it is in the United States that the most severe outbreak of a new type of coronavirus is observed. The total number of deaths from COVID-19 is already about 1,170 people, but the peak has not yet been passed! An alarming situation remains in a number of European countries. The number of people infected with the pandemic in Germany is growing very rapidly. To date, 84,794 people have been infected with coronavirus in Germany. By the way, this is more than it was at the height of the coronavirus in China! Against this background, the eurozone economy, despite the measures taken by the ECB, is already declining by 9-10%. According to many authoritative experts, this is not the limit. As for employment, of all the countries in the currency bloc, the strongest decline is observed in Spain. If you look at the charts of the EUR/USD currency pair, then after the growth showed a week earlier, the pair suffers significant losses at the current five-day trading session and is trading near 1.0810 at the time of writing. Daily
As you can see, following the results of yesterday's trading, the pair significantly declined and came down from the Ichimoku indicator cloud, breaking through the Tenkan line and the strong technical level of 1.0887. Today, at the moment of writing this article, the single European currency continues to be under pressure. Extremely negative data on the US labor market and the same negative reaction against the US currency of market participants can correct the situation for the euro bulls. If the labor statistics from the States turn out to be worse than the forecast values, the Euro/dollar will have strong arguments to reduce the losses that the pair is currently suffering. Closing today's and weekly trades below the landmark level of 1.0800 will indicate further bearish prospects for the instrument. If the euro bulls manage to take advantage of frankly bad statistics from the US and return the price to the limits of the Ichimoku cloud, it will be possible to stabilize the situation and suspend the current downward dynamics. Otherwise, EUR/USD risks falling to the area of 1.0635, where the minimum trading values of the previous month were shown. H1
The technical picture on the hourly chart suggests considering sales after a pullback to the broken level of 1.0887, just above which the 50 simple moving average is located. Above, the opening of short positions in the euro is worth looking at from the area of 1.0910-10940, where there are 89 and 200 exponential moving averages. I hope that I will post more specific and substantiated trading ideas on Monday, taking into account the factor of closing the current weekly trading. Yes, and I would not recommend moving open positions to Monday. If possible, it is better to close them and delete all pending orders from whom they are placed. Have a nice weekend! The material has been provided by InstaForex Company - www.instaforex.com |
| Trading recommendations for GBPUSD pair - prospects for further movement Posted: 03 Apr 2020 04:28 AM PDT From a comprehensive analysis, we see a flat formation that has come to a successful conclusion. Now about the details. More than 100 hours, or four trading days, it took so much time for the 1.2280//1.2380//1.2480 flat to be formed on the market, during which not only compression against the past week was revealed, but also a local slowdown in volatility. The phenomenon is extremely interesting, and if we make a comparison with a similar period of time, but for the EUR/USD currency pair, then we will see a lack of correlation, as well as a discrepancy in the activity. In other words, there was no activation of the dollar in this case, and many are inclined to believe that this is a kind of deferred move and we are still waiting ahead, but on a more impressive scale. We can agree with this judgment since, in comparison with the euro/dollar, the pound bounced from historical lows not by 500 points, but by the entire 1000 points. That is, we have a reserve of trading forces, as well as potential activity, and the existing slowdown (flat) can be a catalyst for trading forces. Regarding trading approaches, we remain followers of the method of local operations, since with such activity and the external background, the trend does not make much sense. In terms of volatility, we see that for the second day in a row, there was a slowdown relative to the daily average, and this is one of the best signals, paired with a flat for further acceleration. Details of volatility: Monday-165 points; Tuesday-245 points; Wednesday-172 points; Thursday-358 points; Friday-359 points; Monday-144 points; Tuesday-271 points; Wednesday-676 points; Thursday-354 points; Friday-522 points; Monday-267 points; Tuesday-296 points; Wednesday-333 points; Thursday-452 points; Friday-352 points; Monday-148 points; Tuesday-227 points; Wednesday-108 points; Thursday-126 points. The average daily indicator, relative to the dynamics of volatility is 175 points (see the table of volatility at the end of the article). As discussed in the previous review, traders considered the boundaries of 1.2280/1.2480 (1.2500) as the main positions in case of a breakout. The recommendation from Thursday partially coincided, having a small, but still profitable, we are waiting for further success. (We consider selling positions if the price is fixed below 1.2280 with the prospect of a move to 1.2245-1.2200. The second option considers working within the range, where the sell positions are located in the area of 1.2430, with a move towards 1.2350.) Looking at the trading chart in general terms (the daily period), we see a local slowdown in the inertia of the past week, that is, there were no changes for four trading days, and traders saw conditional doji candles. The news background of the past day had data on the labor market in the United States, where the number of applications for unemployment benefits again shocked market participants. So, the number of initial applications was 6,648,000 and repeated - 3,029,000, and these are echoes of the great depression, which experts like to compare so much. The market reaction to such stunning data was beyond the logic of fundamental analysis, the US dollar did not lose its position, but, on the contrary, began to strengthen, what is the reason? There is a theory that investors choose the lesser of two evils, that is, the data for the States is terrible due to the consequences of the COVID-19 virus, but the consequences will affect not only the United States, but also other countries, where the outcome may be even worse. Investors remain confused in the currency that is more stable, i.e. the US dollar. In terms of the general information background, we see the strongest impact on the world economy due to the actively spreading coronavirus, where more than one million cases of infection have already been recorded. The consequences are still ahead of us, but already countries are counting the damage from the virus, and investors are trying to save what they have. Today, in terms of the economic calendar, we have a report from the United States Department of Labor, where everything is expected to decline, but it may turn out to be even worse. From the preliminary estimate, unemployment is expected to increase from 3.5% to 4.0%, and the number of jobs outside of agriculture may decrease by 150 thousand. Once again, the consequences of the COVID-19 virus will affect all countries, which means that investors are not looking at one point. The upcoming trading week in terms of the economic calendar is not particularly full of statistical indicators, but this is not necessary when we have such an impressive external background, which creates enormous pressure on market participants. Among the most notable statistics are applications for unemployment benefits with staggering indicators, as well as inflation. The most interesting events are displayed below: On Tuesday, April 7 US 15:00 London time - number of open vacancies in the labor market JOLTS (Feb) On Wednesday, April 8 US 19:00 London time - minutes of the meeting of the Federal Open Market Committee of the US Federal Reserve On Thursday, April 9 UK 07:00 London time - industrial production (Feb) US 13:30 London time - applications for unemployment benefits On Friday, April 10 US/EU/Britain - Good Friday US 13:30 London time - inflation Further development Analyzing the current trading chart, we see that during the start of the European session, a round of descending positions appeared, which managed to put pressure on the lower border of the flat 1.2280//1.2380//1.2480. In fact, a breakout is already visible on the hourly periods (H1), but there are no fixations yet. The signal is good, but it is better to wait for a little and focus on the minimum of March 31 - 1.1244. We should not forget that the flat took place for more than 100 hours, and the slowdown in it signaled a clear accumulation, thus we will still be able to participate in the rally. In terms of the emotional background, we see a characteristic caution, but also panic among market participants, which is used by speculators. In turn, traders are particularly attentive to the behavior of the external background, as the report of the United States Department of Labor may put pressure on the dollar, but in this case, we should wait for a little and move to a shorter time period, where long positions may occur in the run-up to the announcement of the data. Based on the above information, we will output trading recommendations: - Buy positions are considered higher than 1.2300 with the prospect of a move to 1.2350. Closer to the report, you should switch to minute intervals, where the most attractive entry levels may appear. If the report will have any major impact on the dollar, in terms of attenuation, we examine the return rates in the source frame flat. - We consider selling positions if the price is fixed below 1.2240 with the prospect of a move to 1.2150-1.2000. Indicator analysis Analyzing different sectors of timeframes (TF), we see that the indicators of technical instruments began to gradually give out a sell signal, but the daily period still retains an upward interest, reflecting the past week. Volatility per week / Measurement of volatility: Month; Quarter; Year. Volatility measurement reflects the average daily fluctuation, calculated for the Month / Quarter / Year. (April 3 was based on the time of publication of the article) The volatility of the current time is 142 points, which is even less than the daily average, but in the case of a breakdown of the flat borders, we can see an acceleration. It is worth considering that the external background, as well as the report of the United States Department of Labor, may have a direct role in the upcoming acceleration of volatility. Key levels Resistance zones: 1.2350**; 1.2500; 1.2620; 1.2725*; 1.2770**; 1.2885*; 1.3000; 1.3170**; 1.3300**; 1.3600; 1.3850; 1.4000***; 1.4350**. Support zones: 1.2280 (1.2240); 1.2150**; 1.2000*** (1.1957); 1.1850; 1.1660; 1.1450 (1.1411); 1.1300; 1.1000; 1.0800; 1.0500; 1.0000. * Periodic level * * Range level *** Psychological level **** The article is based on the principle of conducting a transaction, with daily adjustments. The material has been provided by InstaForex Company - www.instaforex.com |
| Posted: 03 Apr 2020 04:22 AM PDT EU News:
Eurozone activity sees largest single month drop in March A combined reading of the Eurozone's manufacturing and services sectors shows the biggest ever single monthly fall in March.The composite PMI reading was the lowest ever recorded as part of the survey, at 29.7. That was not only down from February's 51.6, it was also weaker than the earlier flash estimate of 31.4. Technical analysis: EUR/USD has been trading downwards as I expected.The price is going towards our downward targets from yesterday at the price of 1.0742 and 1.0640. Watch for selling opportunities on the rallies today with the downward targets at 1.0742 and 1.0640. MACD oscillator is showing strong selling pressure from the background, which is strong sign that sellers are in control. Intraday resistance level is set at the price of 1.0820 Support levels and downward targets are set at the price of 1.0742 and 1.0640. The material has been provided by InstaForex Company - www.instaforex.com |
| EUR/USD: the dollar is on a slippery path Posted: 03 Apr 2020 04:14 AM PDT
According to the Asian Development Bank, the damage caused by the coronavirus pandemic to the world economy could reach up to $4.1 trillion, or almost 5% of global GDP. Thus, since the disease is spreading across the planet very rapidly, investors are beginning to question whether the liquidity provided by the Fed and other central banks will be enough to calm the financial markets. However, judging by the resumption of growth in the USD index, most investors must've seen the answer to this question as negative. Anyhow, the fears that the peak of the pandemic has not yet passed, an increase in the number of applications for unemployment benefits in the US, and disappointing data on business activity in the service sector in China has allowed the bears to push EUR/USD below the support of 1.0920. The rebound of US stock indexes, impressed by the statement of Donald trump that Russia and Saudi Arabia can reduce black gold production by 10-15 million barrels per day, did not even help the bulls in the rally. The number of applications for unemployment benefits in the US reached a record high of 6.6 million in just two weeks. The figure expanded by 10 million, which is equivalent to 6% of the entire labor force of the country. Regardless, investors are not particularly panicked about the report on the US labor market for the month of March. Bloomberg analysts expect employment in the US non-agricultural sector to decrease by 100 thousand, and unemployment to increase from 3.5% to 3.8%. The current report does not fully reflect the impact of COVID-19 on the US economy. The data for April may show 20 million job losses and rise of unemployment to a new historical high.
Markets grow or decline based on expectations. Thus, the S&P 500 index, which is under horrible US macro statistics, has little chance to grow sharply. The instability of the US equity market will most likely continue, which increases the risks of continuing the peak of EUR/USD. Some economists believe that the growing political tensions, as well as the disagreements within the European Union over the next 3 months, may lower the EUR/USD pair to 1.05. The question of whether the European leaders can resolve their differences over economic responses to the coronavirus pandemic remains to be on the agenda. However, despite the fact that the dollar is growing by leaps and bounds, not everyone agree that the "bulls" of euro has admitted defeat. Experts at Nordea Markets believe that the EUR / USD pair is more likely to go to the level of 1.2 than to fall to parity, making the following arguments that first, the balance of the US Central Bank is growing at a record pace. Second, the Fed's easing of monetary policy has reduced the cost of hedging investments in dollar assets, which is a bullish factor for the euro. Third, the lower the main currency pair falls, the more likely it is to see a coordinated intervention of the G7 countries in the forex market in order to weaken the position of the dollar. The material has been provided by InstaForex Company - www.instaforex.com |
| Posted: 03 Apr 2020 04:09 AM PDT EUR / USD On April 2, EUR / USD pair lost another 105 basis points, and thus, continued to build a prospective wave 2 as part of the future C. If this is correct, then we may begin raising the instrument within wave 3 in C in the coming days. However, a successful attempt to break through the 23.6% Fibonacci level indicates the readiness of traders for further sales. I also remind you that in the current state of the market, wave marking can become more complicated and require corrections and additions. Fundamental component: Yesterday was marked by the release of the second consecutive "crisis" report on applications for unemployment benefits in the United States. However, based on the movement chart of the euro-dollar instrument, it can be noted that the markets were not particularly scared by the total number of 6.5 million Americans who lost their jobs. The US dollar continued to be in demand at yesterday's trading. Today, the EUR / USD instrument continues to decline, which confirms the opinion that the markets are not paying attention to statistics now. Nevertheless, America has the most cases of COVID-2019 virus in the world, but this factor also does not scare the markets too much. Today, extremely important reports on unemployment, on Nonfarm, on wages, and also on business activity in the services sector will be released in America. Let me remind you that unemployment in March should already start to grow from the current 3.5%, Nonfarm should decline for the first time in a long time (like the ADP report), and business activity shows the largest decline in the services sector (and in both the EU and the US). So I don't expect any positive news from America today. But at the same time, despite the wave markup and, with a high probability, weak news from the US, markets continue to buy the dollar, just as they did a few weeks earlier. Thus, the amplitude of the instrument begins to grow again, and panic moods – to return to the markets. General conclusions and recommendations: The euro-dollar pair presumably continues to build the rising wave C, which can turn out to be very long. The internal wave structure of this wave can take a 5-wave form. I recommend buying the instrument again in order to build wave 3 inside C after receiving the MACD signal "up" with targets located near the levels of 1.1165 and 1.1295, which corresponds to 61.8% and 76.4% Fibonacci. GBP / USD On April 2, the GBP / USD pair gained about 25 basis points. The amplitude of the movement of the instrument decreased, but today, April 3, the markets come to their senses and begin to trade more actively again. The alleged wave 1 or A of the new upward trend section is supposedly completed. If this is true, then the decline in quotes will continue with targets located near the levels of 38.2% and 23.6% Fibonacci. Fundamental component: The news background for the GBP / USD pair on April 2 did not differ too much. The same jobless claims report that markets ignored. Today, Britain released the index of business activity in the services sector, which declined more than expected, 34.5 points in March compared with February (53.2). Thus, in a way, the decline of the pound in the first half of Friday is logical. Nevertheless, important data in America will come out in the coming hours, which can also be extremely weak. The only question is how weak. Now, wave marking suggests a decline in quotes. I believe that the news background will not interfere with this process. General conclusions and recommendations: The pound / dollar instrument supposedly completed the construction of the first rising wave. Thus, now, I recommend selling the pound with the expectation of building wave 2 or B with targets located near the calculated levels of 1.2093 and 1.1835, which corresponds to 38.2% and 23.6% Fibonacci. The material has been provided by InstaForex Company - www.instaforex.com |
| Analysis of AUD/USD on April 3, 2020 Posted: 03 Apr 2020 02:59 AM PDT Hello, dear traders! It's time to consider the AUD/USD currency pair, the technical picture of which is quite interesting. But more on that later. The Reserve Bank of Australia (RBA), along with other leading global central banks, announced the introduction of temporary swaps in the US currency in order to increase liquidity. In addition, the RBA together with the Australian government decided to allocate about 100 billion Australian dollars to support the Australian economy. Let's look at the technical picture for the AUD/USD currency pair, and since this tool is analyzed once a week, let's start with the corresponding timeframe. Weekly
After falling to the level of 0.5510, the pair began to adjust from the previous fairly strong and prolonged decline. Attempts to continue to recover losses in the current five-day trading failed at the level of 0.6215, from where the pair again turned in the south direction. In fairness, it should be noted that the results of weekly trading will be determined by data on the US labor market, which will be published at 13:30 (London time). Economists' forecasts are very pessimistic, and if the actual numbers turn out to be even worse than expected, the US currency risks falling under a wave of sales. The current resistance is provided by the Tenkan line of the Ichimoku indicator, above which it is still not possible to gain a foothold. However, even if the Tenkan goes up, the next resistance to the growth of AUD/USD can be provided by the Kijun line, which passes at 0.6271. In my personal opinion, only a breakdown and consolidation above Kijun will indicate further growth prospects, which at this stage is (or was) in the framework of correction. Daily
Despite the fact that three consecutive candles closed above the daily Kijun line, strong demand for the US currency turned the quote down. At the moment of writing the review, the "Aussie" is trading slightly below the important psychological level of 0.6000, where the Tenkan line also runs. Bulls on the pair need to close today's and weekly trades above 0.6100, and ideally above the level of 0.6215, where the maximum trading values were shown on March 31. I am more than confident that the results of today's and weekly trading will be directly influenced by labor reports from the United States. In this regard, the pair may fall significantly or strengthen significantly. Everything will depend on specific figures for today's American statistics. H4
And on this timeframe, the completion of the correctional rollback and the reversal of AUD/USD towards the main downward trend is visible. From the point of view of technical analysis, the main trading idea looks like selling the "Australian" currency. But I don't think we should rush to final conclusions. It is better to wait for data on the unemployment rate, the creation of new jobs in the non-agricultural sectors of the economy and the growth rate of average hourly wages in the United States. Let's see how market participants will react to the US releases and how the current week will close. In my opinion, only then will it be possible to consider the direction of the US dollar in relation to all major competitors. I assume two scenarios. If the COVID-19 epidemic has not yet had a strong negative impact on the American economy, the data will come out better than the forecast values. Otherwise, the US dollar will suffer significant losses across the entire spectrum of the market. I recommend that you refrain from opening new deals today and stay out of the market. I expect that after today's data on the US labor market, next week, there will be more understanding about the future direction of all dollar pairs. Have a nice day! The material has been provided by InstaForex Company - www.instaforex.com |
| Technical analysis of EUR/USD for April 03, 2020 Posted: 03 Apr 2020 02:52 AM PDT Overview: The euro area is under pressure once again as the coronavirus outbreak. So that it will impact on euro currency. The EUR/USD pair continues to move downwards from the level of 1.1035. Yesterday, the pair dropped from the level of 1.1035 to the bottom around 1.0801. But the pair has rebounded from the bottom of 1.0801 to close at 1.08031. Today, the first support level is seen at 1.0757, the price is moving in a bearish channel now. Furthermore, the price has been set below the strong resistance at the level of 1.1035, which coincides with the 78% Fibonacci retracement level. This resistance has been rejected several times confirming the veracity of a downtrend. Additionally, the RSI starts signaling a downward trend. As a result, if the EUR/USD pair is able to break out the first support at 1.0757, the market will decline further to 1.0636 in order to test the weekly support 2. Consequently, the market is likely to show signs of a bearish trend. So, it will be good to sell below the level of 1.0892 with the first target at 1.0757 and further to 1.0636. However, stop loss is to be placed above the level of 1.1075. The material has been provided by InstaForex Company - www.instaforex.com |
| Trading recommendations for EUR/USD pair on April 3 Posted: 03 Apr 2020 02:30 AM PDT From the point of view of a comprehensive analysis, we see the strengthening of the US dollar almost throughout the trading week, and now let's talk about the details. The sequence of inertia is amazing. We have recorded V-shaped oscillations literally from the beginning of January of this year, where there are already four models in total, the scope of which is stably high. Regarding the current week, we see that the dollar against the euro regains its position despite the logic of the fundamental aspect, but in terms of technical analysis, just V-shaped models. The restoration of more than half relative to early inertia is the basis of the existing formation. Considering the graphic model "Head and shoulders" [H1 graph], which was discussed in the review of April 1, we see that its execution has almost reached its end, which means that theories of local oscillations work. Let me remind you that back in that week, we decided on the tactics of working on local movements, contrary to all trends, referring to the fact that the market is highly susceptible to the external background, and the panic on it forms movements of considerable proportions. This time we received confirmation of this tactic again, where the upward inertia of the past week, which, at first glance, was stable, also quickly changed its mood, as it arose on the market. Regarding volatility, we see steadily high indicators that exceed the daily average. Market acceleration will exceed the two-month mark very soon. But now, we can safely say that the activity is many times higher than last year, and such stable stability in the form of acceleration has not been seen for a very long time. Against this background, speculators have intensified, who take this opportunity to take a solid profit from the market. Details of volatility: Monday - 155 points; Tuesday - 183 points; Wednesday - 115 points; Thursday - 278 points; Friday - 166 points; Monday - 151 points; Tuesday - 234 points; Wednesday - 243 points; Thursday - 326 points; Friday - 194 points; Monday - 191 points; Tuesday - 160 points; Wednesday - 133 points; Thursday - 188 points; Friday - 194 points; Monday - 134 points; Tuesday - 127 points; Wednesday - 136 points; Thursday - 147 points. The average daily indicator, relative to the dynamics of volatility is 108 points [see table of volatility at the end of the article]. Analyzing the past day, we see that the main round of short positions declined again at the start of the European session and lasted until 18:00 UTC+00. Subsequent oscillations occurred in amplitude motion along the level of 1.0850. As discussed in the previous review, traders considered the two coordinates of 1.0900 and 1.0970, regarding which they planned to start work. The recommendation from Thursday regarding fixing prices lower than 1.0900 coincided, having a profit at the first forecasted value. [We consider selling positions if prices are fixed lower than 1.0900, with the prospect of a movement to 1.0850 -1.0775.] Considering the trading chart in general terms [the daily period], we see the very inertial fluctuations in the structures of V-shaped models, which we wrote about at the beginning of the article. The news background of the past day contained data on producer prices in Europe, the pace of which, for the seventh month in a row, has been slowing down. This factor can play a further role in lowering inflation in the EU and, as a fact, put further pressure on the ECB, which will be forced to lower the refinancing rate. In the afternoon, market participants again faced a shock in terms of the labor market in the United States, where the number of applications for unemployment benefits repeated the story of the past week in the form of a multiple increase. So, the number of initial applications was 6,648,000, and repeated 3,029,000, and this is one of the most significant strikes since the Great Depression. The reaction of the market to such strong statistics was across the entire logic of fundamental analysis, the US dollar continued to strengthen. What is the reason for this resonance? Experts are inclined to believe that investors are uncertain due to the strong external background, where, in view of the possible consequences of the COVID-17 virus in other countries, staying in dollars is most attractive. In terms of the general informational background, we see that in accordance with the epidemiological situation and the spread of COVID-19 in the world, more than one million cases of infection have already been recorded, of which fatal 53 166. The initial assessment that there are signs of improvement in Europe has not been confirmed, so how the virus from the epicenter [Italy] pumped to Spain, Germany, France, where the indicators are terrifying and the consequences of the pandemic will keep you waiting. So it turns out that investors who see such significant blows to the US labor market immediately look at other countries where the blows can be even more significant, and thereby choose less risk from the overall risk. Today, in terms of the economic calendar, we have a key event of the week. A report by the United States Department of Labor, which already expects a recession of all that is, but it may turn out to be worse. From a preliminary estimate, unemployment is expected to increase from 3.5% to 4.0%, and the number of jobs outside agriculture can be reduced by 150 thousand. From the point of view of the logical meaning of fundamental analysis, the report should put pressure on the US dollar, unless, of course, investors continue to remain in the dollar as a relative "safe haven" due to the general risk. The upcoming trading week in terms of the economic calendar has a number of statistical indicators that are worth paying attention to, but the main impulse remains the external background, which puts enormous pressure on market participants. The most interesting events displayed below ---> Tuesday April 7th USA 14:00 Universal time - The number of open vacancies in the labor market JOLTS (Feb) Wednesday, April 8 USA 18:00 Universal time - minutes of the meeting of the US Federal Open Market Committee Thursday, April 9 USA 12:30 Universal time - Applications for unemployment benefits Friday April 10 USA / EU / Britain - Good Friday USA 12:30 Universal time - Inflation Further development Analyzing the current trading chart, we see that the compression of quotes during the Pacific and Asian trading sessions led to a splash of short positions, just at the start of the Europeans, which as a result, updated the lows of the week. In fact, we received confirmation once again that investors retain their dollar positions, but do not forget that our trading strategy should be built in terms of local positions, since now it is most attractive in the form of income. Thus, it is worth considering both positions at once now, the first one proceeds from the fact that the report of the United States Department of Labor will be even worse, where it is worth looking at the current fluctuation within a given time interval and trying to fly into a local upward move. While there is no report, we have a support level in the form of a value of 1.0775, where it makes sense to take a pause if we do not have positions. In terms of the emotional background, we see an initial panic, where market participants are very much exposed to the external background, and, as we see in practice, even logical fundamental indicators react in the market in a completely different way. Based on the above information, we derive trading recommendations: - We consider buying positions in two versions, the first technical, that is, a rebound from the level of 1.0775, the entrance is higher than 1.0815, with the prospect of a move to 1.0850. The second method is already considered closer to the publication of the report of the United States Department of Labor, analyzing the slowdown for shorter periods. - We consider selling positions already in the field of price fixing lower than 1.0775, with the prospect of a move to 1.0700-1.0650. Indicator analysis Analyzing a different sector of time frames (TF), we see that the indicators of technical instruments took the downward side relative to all the main periods due to the downward movement from the beginning of the trading week. Volatility per week / Measurement of volatility: Month; Quarter; Year Measurement of volatility reflects the average daily fluctuation calculated from Month / Quarter / Year. (April 3 was built taking into account the time of publication of the article) The volatility of the current time is 77 points, which is still considered a small indicator, but activity awaits us ahead. It can be assumed that the external background and the report of the United States Department of Labor will be an incentive to further accelerate volatility. Key levels Resistance zones: 1.0850 **; 1.1000 ***; 1.1080 **; 1,1180; 1.1300; 1.1440; 1.1550; 1.1650 *; 1.1720 **; 1.1850 **; 1,2100 Support Areas: 1.0775 *; 1.0650 (1.0636); 1.0500 ***; 1.0350 **; 1.0000 ***. * Periodic level ** Range Level *** Psychological level The material has been provided by InstaForex Company - www.instaforex.com |
| InstaForex Daily Analysis - 3rd April 2020 Posted: 03 Apr 2020 02:19 AM PDT Today we take a look at Gold and see how we are going to play the bounce! We use Fibonacci retracements, extensions, support/resistance, momentum and trend lines to identify trading opportunities in this exciting pair today! The material has been provided by InstaForex Company - www.instaforex.com |
| Trader's diary for April 03, 2020. EUR/USD, EU support on Italy, and coronavirus Posted: 03 Apr 2020 01:48 AM PDT
The coronavirus is not slowing down. According to official figures, there are already more than 1 million infected people in the world. To be honest, based on the number of deaths, more than 1,250,000 are already infected. In a new update, the mortality rate in Italy has slightly decreased, while Spain continues to record a high rate. United States, on the other hand, has already recorded 245,000 total number of infected cases, with an approximately 1,000 deaths per day. At this rate, hospitals are already at full load. In Russia, a slowdown in the growth of patients was recorded on April 3 with 600 new patients compared to the 800 new cases as of April 2. Yesterday, in Moscow alone there was 600 newly confirmed cases. However, conclusions cannot be drawn in just a day. According to my forecast that was published last March 30, the growth rate of patients in Moscow, Russia will be at 20% to 25% per day which means that by April 15, there will be a total of 15-30 thousand infected cases. After this, there will be a noticeable slowdown in the growth. The EU is discussing a plan to save the Italian economy, at the same time, the Spain will also be needing a large package of assistance. However, until the pandemic subsides, there is no clarity about how much money will be needed. So far, the main savior is the ECB. We are waiting for the US employment report today at 12:30 UTC. EURUSD: Prepare to sell from 1.0635. Buy from 1.1040 The material has been provided by InstaForex Company - www.instaforex.com |
| With faith in hope (EUR/USD and GBP/USD review on 04/03/2020) Posted: 03 Apr 2020 01:45 AM PDT It feels like common sense has long left this planet and people are guided only by emotions. More precisely, a hysteria. No one gives a thing about macroeconomic statistics that almost screams that a new Great Depression is coming. Markets simply ignore unemployment figures and so on. The markets are just ignoring some kind of unemployment numbers and so on. But information about the spread of the coronavirus epidemic is turned by global markets as they want. Almost all day, the quotes stood still, but as soon as it became known that Italy and Spain together surpassed the United States in the number of confirmed cases of coronavirus infection, as well as that Germany on this terrible indicator surpassed China, as soon as the single European currency went down. Moreover, it is noteworthy that the pound is the only one that remained in place. At the same time, a new record for the spread of the epidemic was set in the United States itself, and the number of confirmed cases of coronavirus infection increased by 30.1 thousand. And strangely enough, all this suggests that it only seems that common sense has left humanity. Just the opposite. After all, North America and Europe are the two largest markets in the world. BBut just as important, these are two of the world's largest financial centers of the global economy. Nowhere else in the world is there such a capacious financial market that can accommodate huge masses of capital. In addition, most of the investment capital in the world is controlled by investors from Europe and the United States. Thus, if there is complete confusion in the world and fear takes possession of people's minds, then capital runs to where it is safer and where it can be placed. Safer, of course, at home. Well, only two markets can accommodate this huge amount of money - American and European. But if the global panic does not stop, then these same investors begin to transfer capital from one side of the Atlantic to the other. Back and forth. Specifically, where they feel a little better right now. And the main criterion at this point in time is the coronavirus epidemic. At the same time, oddly enough, there is a certain logic in the market reaction to the data on the labor market in the United States. But first things first.
As already noted, the market repeatedly ignores macroeconomic statistics. However, with regard to British statistics, this is even justified, because the growth rate of the Nationwide issued data on housing prices with a delay of one week, accelerated from 2.3% to 3.0%. Although it seems like they should have slowed down to 2.1%. And not only have the data come out with a strong delay, they are also quite strange, since it is completely unclear why this suddenly in March recorded an acceleration in the growth rate of housing prices. People sit at home and do not go anywhere. And here you are - housing prices are rising. This is only possible if demand increases. But where does it come from now, especially on such an expensive thing as real estate? In other words, the data itself looks quite contradictory, and even considered for a long time. So there is no reaction. Nationwide Housing Price Index (UK):
European statistics were clearly negative. Another thing is that there is no market reaction again. The single European currency has already gone down noticeably after the US statistics. Nevertheless, the decline in producer prices increased from -0.7% to -1.3%. Moreover, the decline in producer prices has been going on for seven consecutive months. Thus, there is practically no upside potential for inflation. Rather, on the contrary, it will continue to show a downward trend. This means that the European Central Bank may seriously think about the need to reduce the refinancing rate to negative values. For investors, there is nothing good in this thought. In addition, there are signs that the European labor market will not be able to avoid the worst and the same thing will happen to it that happens to the American one. The first alarm bell came from Spain, where the number of unemployed increased by 302.3 thousand. An increase of 45 thousand was projected. In order to understand whether it is a lot or a little, given the difference in population, it is about the same as if in the United States, the number of unemployed increased by about 3 million. So this is a lot. Of course, this is not a record set at the beginning of the 2000s, during the so-called dotcom crisis, but it's still not pleasant enough. Moreover, this time in Spain there is already a high level of unemployment. Moreover, it can now drag on, and the number of unemployed will only continue to grow. Producer Prices (Europe):
However, all this is against the backdrop of American statistics, which also remained unattended. Okay, you can understand the total bewilderment and misunderstanding of what is happening when you see 3,283 thousand initial applications for unemployment benefits. This has never happened before at least the statistics did not record this. You do not believe your eyes and do not understand what to do and where to run. It is impossible to get rid of the thought that this is a new Great Depression and the like. In short, shock and trepidation, which hold you unconscious and prevent you from doing anything at all. But when you see another 6,648 thousand new applications for benefits in a week, you can completely lose your mind. They expected that there would be only 3,680 thousand. Also a record, and even more than last week. But the reality was so terrifying that it's really hard to understand how to behave in a similar situation. In any case, nearly 10 million Americans lost their jobs in just two weeks. But the latest data was on March 28th. The coronavirus epidemic at this time is raging with might and main. But after this date, the number of confirmed cases of infection only increases with greater speed. And before that, we see a massive increase in unemployment. Consequently, the assumptions that were made exactly a week ago are confirmed - there is a massive bankruptcy of small entrepreneurs in the United States. And this is at the very beginning of the epidemic. Given the sharp increase in the number of initial applications for unemployment benefits, apparently now, the turn has come to medium-sized businesses. The picture is really terrifying, and even much smaller than predicted. The number of repeated applications for unemployment benefits, of which there were 3,029 thousand instead of 4 920 thousand, does not greatly correct the situation. Data on repeated applications for March 21, when there was a sharp surge in the number of initial appeals, can safely bury the hope that the increase in unemployment will be short-term. This is serious and for a long time. And you can convince yourself as much as you like that the number of repeated applications is far from the record values achieved during the 2008-2009 crisis. Then there was no such crazy surge in the number of initial appeals. So, in theory, the dollar should have become cheaper at the speed of sound. But that did not happen. This is partly due to shock and a complete misunderstanding of what is happening. Let's just say that there is nothing like that in the memory of those living now, so no one understands how to behave and what to do. Let's just say that few people imagine what will happen next. At the same time, there is another logic in the fact that the dollar is not getting cheaper. The fact is that the US market is probably the largest in the world. Many countries simply live off exports to the United States. And while unemployment is rising sharply in the United States itself, aggregate demand will begin to decline. If demand decreases, then many manufacturers will be forced to cut jobs and reduce output. So, Donald Trump has long made it clear to everyone that he considers protectionism to be a great thing, and in order for American companies to suffer as little as possible, he can ban the import of goods from other countries. Like, let those Americans who still retain their jobs buy American products. Thanks to this, economic growth can be re-launched. But the trick is that the economic blow will fall on all the rest of the world. At least it will be no less than in the United States itself. Financial and investment capital, which themselves come from the United States, is well aware of this. Thus, it's better to run away in advance to where the consequences may not be so severe, so the trend to strengthen the dollar does not disappear. Well, you can also mention factory orders, which have not changed in a month, although they predicted their growth by 0.2%. As a result, industry in the United States is not in the best condition. Number of Initial Jobless Claims (United States):
Today, the final data on indexes of business activity in the service sector, as well as composite indices were published. But they will not have any impact on the markets, since everything has already been taken into account at the time of the publication of preliminary estimates. And even if the totals differ slightly from these estimates, the scale of the decline in the indices is so great that it will not do any weather. In principle, even retail sales in Europe, the growth rate of which may accelerate from 1.7% to 1.9%. But this is data for February, while in March, the world changed beyond recognition. In addition, similar data are published for France, where the growth rate of retail sales should accelerate from 2.1% to 2.6%. This, of course, is nice, but nothing changes. At least in the current environment. Similarly, data on industrial production in Spain where the decline slowed from -2.2% to -1.3%. The funny thing in this situation is that they predicted the completion of the recession and an increase of 2.5% year on year. However, it did not work out. Retail Sales (Europe):
In fact, the only thing that matters today is the content of the report of the United States Department of Labor. This is the report for the month of March. That is, it will reflect the most interesting things that have happened to the labor market during the rapid start of the spread of the coronavirus epidemic in North America. In fact, this very report should dismiss all doubts, hopes and fears, and confirm the fact that the US labor market is rolling into a complete catastrophe. Despite yesterday's data on applications for benefits, no one has revised forecasts, so real data may turn out to be even worse. Nevertheless, the numbers are simply terrifying even without this. The unemployment rate itself should rise from 3.5% to 4.0%. And of course, you can say as much as you like that this is an extremely low figure by world standards, especially in comparison with Europe. But what's scary here is the very scale of growth, which is extremely large and speaks of serious problems. In addition, for the first time since September 2010, in the column "the number of new jobs created outside agriculture" should be a figure with a negative This indicator should change by -150 thousand. The average working week is also not less significant, which can be reduced from 34.4 hours to 34.0 hours. With an equally impressive increase in the number of unemployed, a decrease in the length of the working week means that many of those who have so far kept their jobs have simply switched to part-time jobs. So, they are also at risk in terms of job loss and are about to lose it. In addition, the growth rate of average hourly wages should slow down from 3.0% to 2.9%. In short, it turns out that there is a complete set - rising unemployment, underemployment and lower wages. Just a doomsday party. The number of new jobs created outside agriculture (United States):
Here, the fun begins. On the one hand, one can understand the absence of a panic reaction to the data on applications for unemployment benefits. This is banal shock. Many refuse to believe what they see. So this is an unrealistic picture. The report of the Ministry of Labor should dispel all thoughts and confirm the worst. After that, the dollar will rapidly lose its position, and the single European currency can grow to 1.0900. Moreover, the content of the report is likely to be worse than forecasts. On the other hand, the principle described above may well work. That is, if everything is so bad in the United States, then it will soon become much worse in other parts of the world. Therefore, you need to save your capital as soon as possible and hide them away. And judging by the fact that the single European currency already demonstrates a desire to reduce, this scenario will most likely work. In this case, the direction opens in the direction of 1.0675.
Events for the pound will develop exactly in the same scenario. In the case of the development of the first scenario, the pound can increase to the level of 1.2525. If a stampede occurs, which is most likely, then the pound will decline in the direction of 1.2050.
|
| Posted: 03 Apr 2020 12:59 AM PDT EUR/USD – 1H.
Hello, traders! According to the hourly chart, everything goes according to plan. The new downward trend line clearly indicates the "bearish" mood of most traders. Thus, it will be possible to sell the pair until the quotes close above this very trend line. In general, the EUR/USD pair continues the process of falling on April 3. News coming from various parts of the world remains disappointing. The COVID-2019 virus continues to spread, and today the official number of infected people around the world has exceeded 1,000,000. Most of the sick citizens are in America, but this does not make any negative impression on the American currency. Also yesterday, traders were very happy to miss the important economic report from the US on unemployment... EUR/USD – 4H.
On the 4-hour chart, the EUR/USD pair performed a rebound from the corrective level of 38.2% (1.0964) and a reversal in favor of the US dollar with the resumption of falling quotes. As a result, at the moment, traders have worked out the Fibo level of 23.6% (1.0840) and now either there will be a rebound from this level or closure under it. In the first case, a reversal will be made in favor of the EU currency and the growth process will begin in the direction of the corrective level of 38.2% (1.0964). In the second case, the chances of a further fall in quotes will significantly increase, in the direction of the next Fibo level of 0.0% (1.0638). There are no pending divergences in any indicator today. EUR/USD – Daily.
On the daily chart, the EUR/USD pair fell to the next corrective level of 23.6% (1.0840). The graphic pattern is identical to the 4-hour chart. I recommend that you monitor the lower charts more closely, especially the hourly chart. EUR/USD – Weekly.
On the weekly chart, the pair has a high chance of continuing the growth process, since the breakdown of the lower border of the "narrowing triangle" turned out to be false. Thus, it can be considered a rebound, not a breakdown. In the future, the euro/dollar pair has the ability to perform growth to the level of 1.1600, that is, to the upper line of the triangle. Overview of fundamentals: On April 2, one report on the number of initial applications for unemployment benefits was released in America. And this report showed an overall increase in the number to 6.65 million from the previous 3.5 million. Thus (although it is not yet unemployment), more and more Americans are losing their jobs, although the US government is doing its best to support the US economy, business and ordinary citizens with cheap loans and gratuitous aid. We are waiting for other economic reports on the state of the American economy. News calendar for the United States and the European Union: Germany - the index of business activity in the services sector (09:55 GMT). EU-index of business activity in the service sector (10-00 GMT). US - unemployment rate (14:30 GMT). US - change in the number of people employed in the non-agricultural sector (14:30 GMT). US - change in average hourly earnings (14:30 GMT). US - ISM composite index for the non-manufacturing sector (16:00 GMT). On April 3, there will be many reports that will attract the attention of traders. Almost all of them are in America. The European report on business activity in service industries is unlikely to appeal to traders. But weak data on unemployment, Nonfarm Payrolls and business activity in the ISM services sector may suspend the growth of the US currency in pair with the European one. COT report (Commitments of Traders):
A new COT report will be released today. I believe that the graphic picture is now very eloquent, so the COT report can only help reveal the longer-term mood of the major market players. To show which contacts were interested in speculators and hedgers a week ago, and from what they were trying to get rid of. And how the overall ratio of short and long contracts has changed. At the moment, the advantage remains with short-term contracts, but since their total number has been decreasing in recent weeks, the euro currency has a chance to grow. If the new report finds that the number of short contracts has increased again, this will increase the probability of a further fall in the pair. Forecast for EUR/USD and recommendations for traders: Now I recommend selling the pair with the target of 1.0638 if the quotes close at the level of 23.6% on the 4-hour chart. As a signal to buy (and close sales), I recommend that you consider fixing quotes above the new trend line on the hourly chart. In this case, the goal is 1.1065. Terms: "Non-commercial" - major market players: banks, hedge funds, investment funds, private, large investors. "Commercial" - commercial enterprises, firms, banks, corporations, companies that buy currency to ensure current activities or export-import operations. "Non-reportable positions" - small traders who do not have a significant impact on the price. The material has been provided by InstaForex Company - www.instaforex.com |
| Posted: 03 Apr 2020 12:59 AM PDT GBP/USD – 1H.
Hello, traders! According to the hourly chart, the GBP/USD pair made a false attempt to break the upper line of the "narrowing triangle", as well as the corrective level of 161.8% (1.2432). After that, it performed a reversal in favor of the US currency and began the process of falling towards the corrective level of 200.0% (1.2251). However, along with the "triangle" that the pair's quotes left, I also built a trend corridor that now speaks in favor of a horizontal movement just below the level of 161.8%. At the moment, the pair is approaching the lower line of this corridor. In the event of a rebound from this line, I will assume that the theory with a sideways movement is justified. In this case, traders can expect a reversal in favor of the British dollar and some growth in the direction of the upper line of the corridor. If bear traders make a close under the corridor, the probability of a further fall in the British dollar's quotes will increase significantly. GBP/USD – 4H.
As seen on the 4-hour chart, the GBP/USD pair continues to move clearly between the corrective levels of 61.8% (1.2516) and 50.0% (1.2303), without approaching any of them. Thus, according to this chart, it can also be said that the British dollar is in a sideways movement, and the trading activity has significantly decreased in recent days. Rebounds of the pair's exchange rate from both levels indicated above can be used as signals for intraday trading. No indicator has any pending divergences today, but they are not important at the moment, since divergences practically do not work in the sidewall. GBP/USD – Daily.
On the daily chart, the picture remains the clearest. The GBP/USD pair closed above the Fibo level of 76.4% (1.2327). Thus, until the quotes are fixed below this level, the chances of the pair continuing to grow in the direction of the next corrective level of 61.8% (1.2553) remain high. The closure of the pound/dollar pair under the level 76.4% will allow traders to expect a reversal in favor of the US currency and a drop in prices towards the corrective level of 100.0% (1.1959). GBP/USD – Weekly.
On the weekly chart, the pound/dollar pair performed a false breakdown of the lower trend line. Thus, until the pair's quotes are fixed under this line, there is a high probability of growth in the direction of the two upper trend lines. Overview of fundamentals: On Thursday, only one economic report was released in the UK - business activity in the construction sector. However, neither it nor the report on initial applications for unemployment benefits in America could move the pair from its place. Traders are not responding to economic news or news about the epidemic right now. The economic calendar for the US and the UK: United Kingdom - PMI for services (10:30 GMT). US - unemployment rate (14:30 GMT). US - change in the number of people employed in the non-agricultural sector (14:30 GMT). US - change in average hourly earnings (14:30 GMT). US - ISM composite index for the non-manufacturing sector (16:00 GMT). As I said in the euro review, there will be a lot of news from America today, and all of it is important. I recommend that traders pay attention to each of the reports, even though the pound is currently "on vacation". However, such important data can make traders behave more actively. It doesn't make sense to predict what the final numbers will be. COT report (Commitments of Traders):
The latest COT report showed a decrease in the total number of short contracts and an increase in long contracts. However, in general, the figures for the ratio of these categories remain almost equal. From the new COT report, which will be released today, I expect even more balancing between short and long contracts and minimal changes, since neither bulls nor bears had the advantage this week. The pound/dollar pair remains the least popular among major market players. The total number of contracts for it is three times lower than for the euro/dollar pair. Forecast for GBP/USD and recommendations to traders: The pair's growth prospects remain high. To sell the pound, I recommended waiting for the quotes to be fixed under the "triangle" on the hourly chart with the target of 1.2251. If the pair closes today and under the side corridor, it will receive another signal to sell for the same purpose. But the rebound from the lower line of the corridor on the hourly chart will allow you to buy the British with an approximate goal of 1.2480. Terms: "Non-commercial" - major market players: banks, hedge funds, investment funds, private, large investors. "Commercial" - commercial enterprises, firms, banks, corporations, companies that buy currency to ensure current activities or export-import operations. "Non-reportable positions" - small traders who do not have a significant impact on the price. The material has been provided by InstaForex Company - www.instaforex.com |
| Posted: 03 Apr 2020 12:58 AM PDT The euro, in pair with the dollar, remains under pressure, due to a number of statistics that once again indicate the problems that many countries will face against the background of the spread of the coronavirus. Although a sharp jump in unemployment is fully expected, its growth rate will still significantly affect the global economy. Yesterday, the Bank of America forecasted the global GDP to reduce by 2.7% in 2020. The significant revision of the indicator is directly related to the ineffective measures that the governments implemented to curb the effects of the pandemic. It is possible that once the pandemic ends, growth may not be as rapid as previously expected, as consumer confidence indicators were much lower than the preliminary estimate. Meanwhile, the problems of the US labor market, which the scale of it will be clear today, will return the demand for dollar and increase pressure on the risky assets. The weekly report yesterday showed a sharp increase in applications for unemployment benefits, as the indicator jumped to the level of 6.6 million, indicating a sharp decline in the labor market. Two weeks ago, the number of applications jumped by 3.3 million due to the suspension of work in many sectors of the economy. However, it is worth noting that the sharp increase in applications may also be due to the fact that people who lost their jobs due to coronavirus are trying to count on temporary financial assistance, which was approved last week. This does not make it any easier though, because many experts predict that the US economy, during the coronavirus pandemic, may lose up to 20 million jobs, which has never happened in history. Moreover, if the market has not yet reacted strongly to these indicators, today's report on the number of people employed in the non-agricultural sector may bring down the stock market, which will lead to the strengthening of the dollar, as the currency is considered to be a safe haven asset. Anyhow, many still underestimate the scale of the problem that awaits the economies of developed countries, and the $ 2 trillion aid that was recently approved in US is clearly not enough to stop the destruction. Meanwhile, ISM's report on the index of current business conditions in New York fell from 39 points in February, to 12.9 points in March this year, which is the lowest value in the entire history of this index. The sub-index of expectations for the six months ahead was 37.9 points, and the employment sub-index fell to 50 points. The US manufacturing orders in February, on the other hand, remained unchanged. The foreign trade deficit for February, as reported by the Department of Commerce, fell by 12.2% and amounted to 39.93 billion dollars, due to a reduction in imports by 2.5%, and reduction in exports by 0.4% (to $ 207.54 billion). The two indicators were disregarded by market participants. The speech of Robert Kaplan, President of the Federal Reserve Bank of Dallas, mainly discussed forecasts of the economy. Kaplan expects the GBP to decline sharply in the second quarter of 2020, and grow weakly on the 3rd quarter of 2020. Unemployment, on the other hand, will rise to about 10% and will be about 8% by the end of the year, as the situation of consumers will worsen due to the crisis caused by the coronavirus. As for the work of the Fed, he drew attention to the need of taking a more responsible approach to lending, as only these efforts will help restore the markets. As for the technical picture of EUR/USD, it is unlikely that the demand for risky assets will increase significantly. The bears continue to control the market, so the current trend will most likely continue. The nearest target of sellers is the lows of 1.0780, where a break of which will quickly push the pair to the larger support of 1.0700, and then to the lows of the year at 1.0640. The break of the level will open a direct road to the area of 1.0200. However, if the bulls manage to regain position in the market, the pair will return to the resistance of 1.0890, and will jump to the highs of 1.1040 and 1.1140. The material has been provided by InstaForex Company - www.instaforex.com |
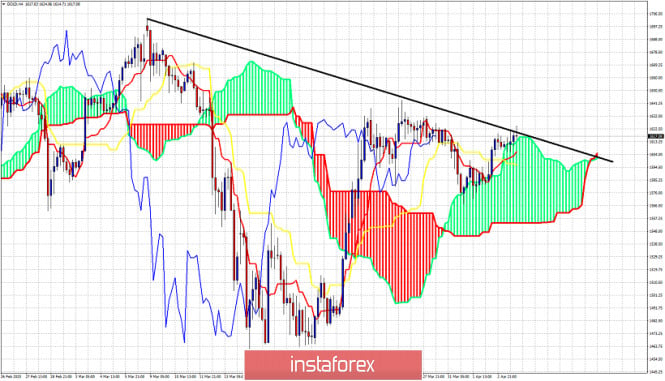
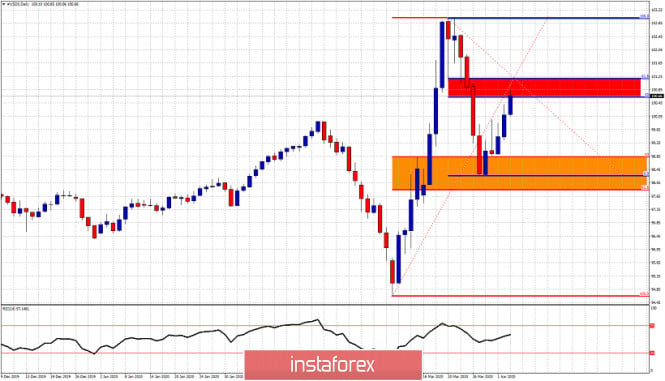
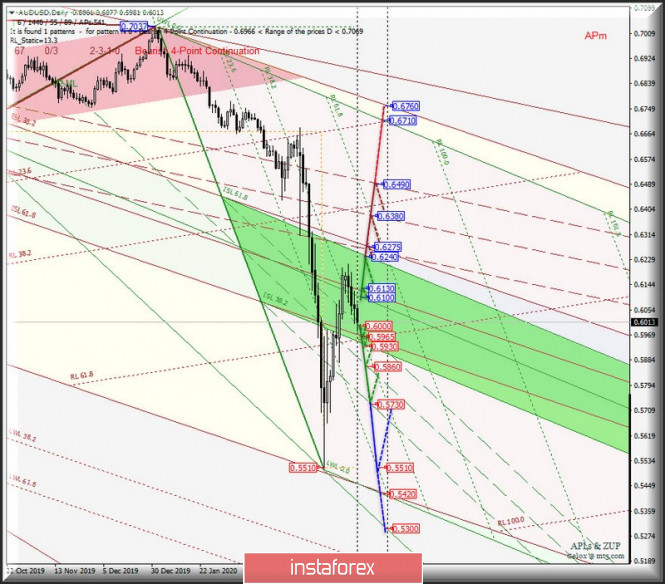
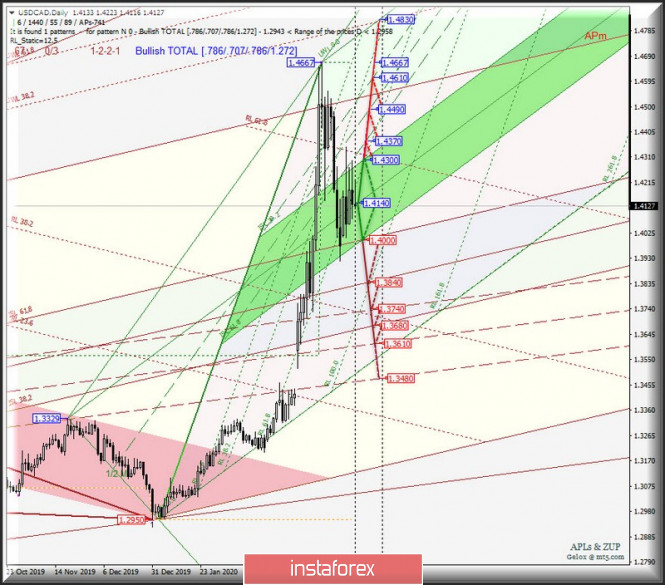
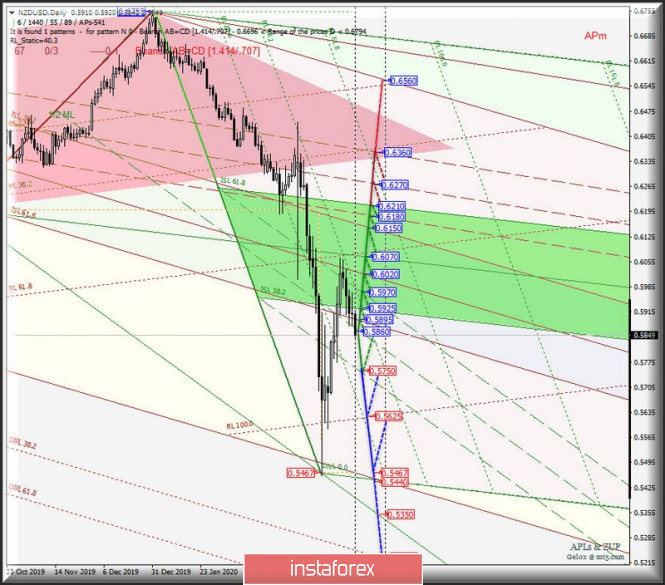
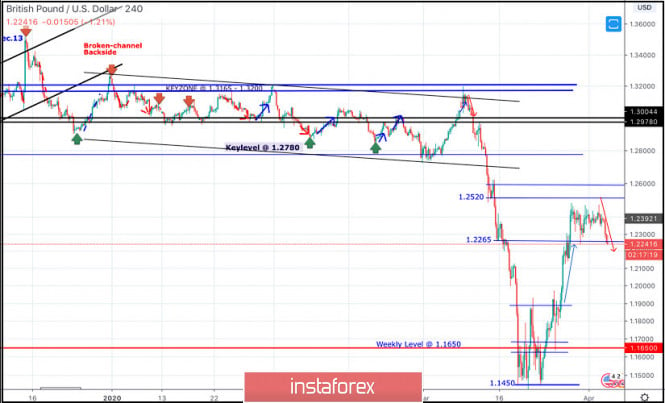
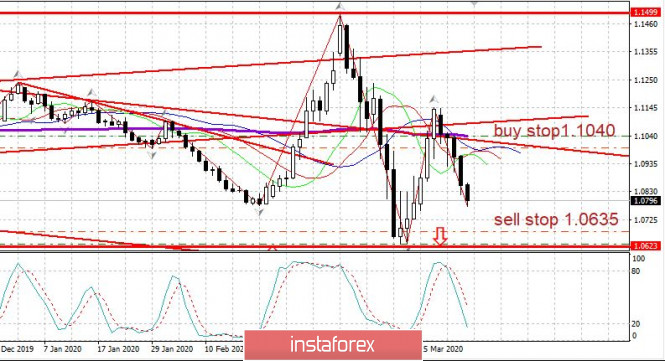
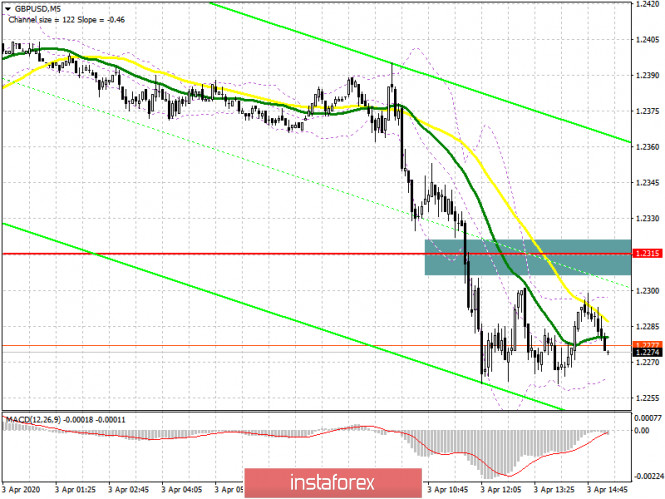
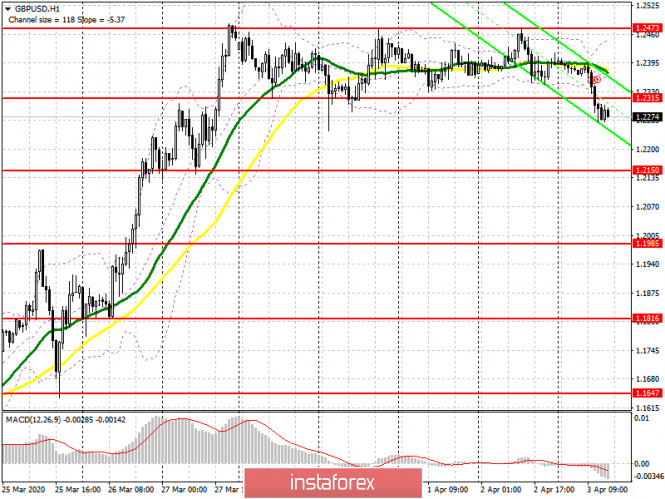
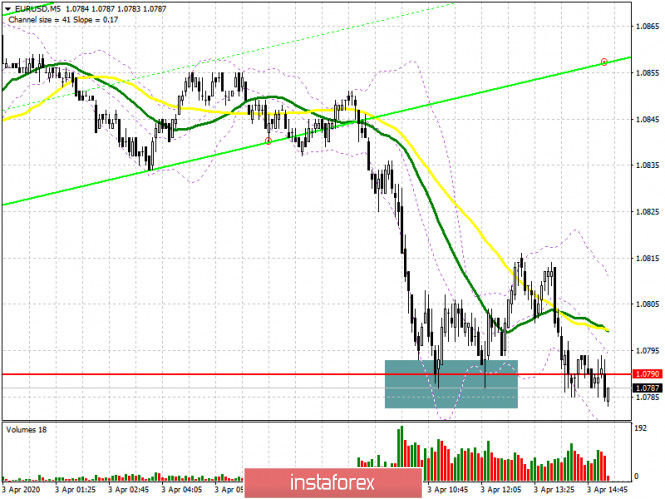
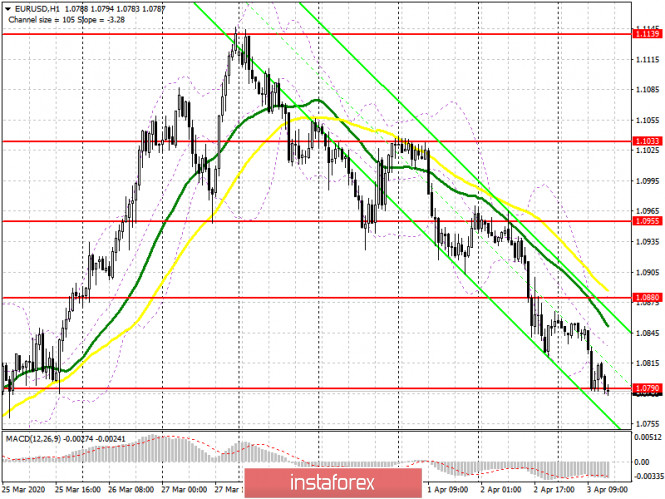
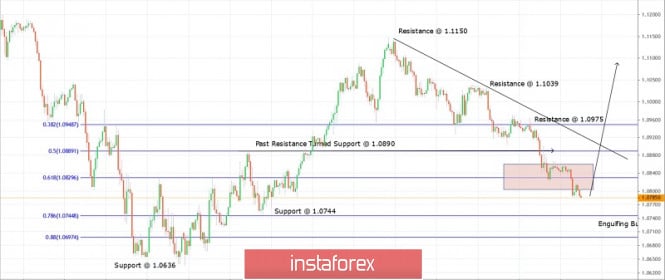
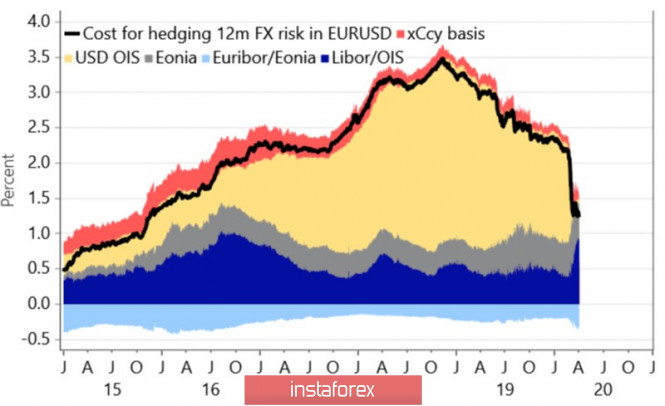
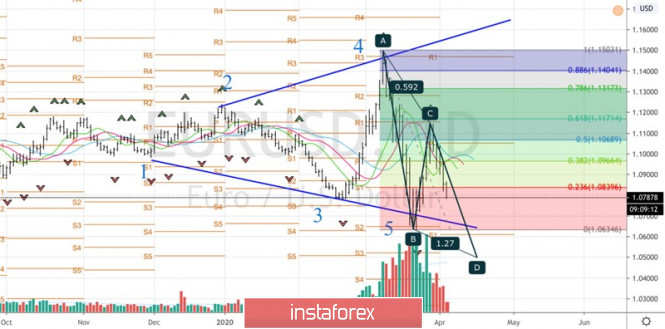
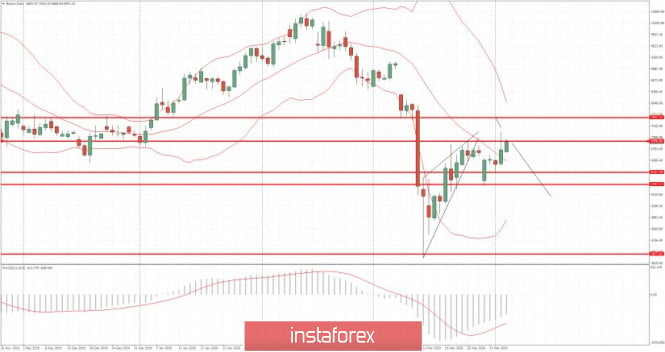
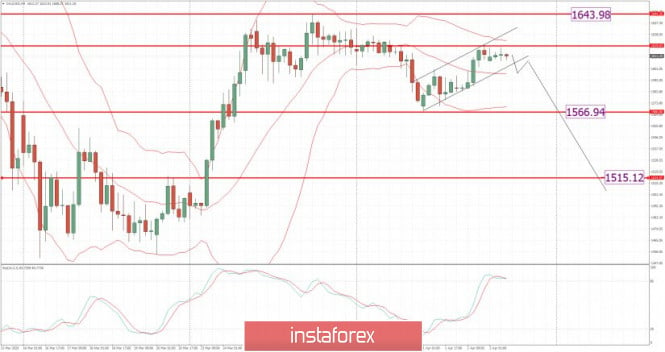
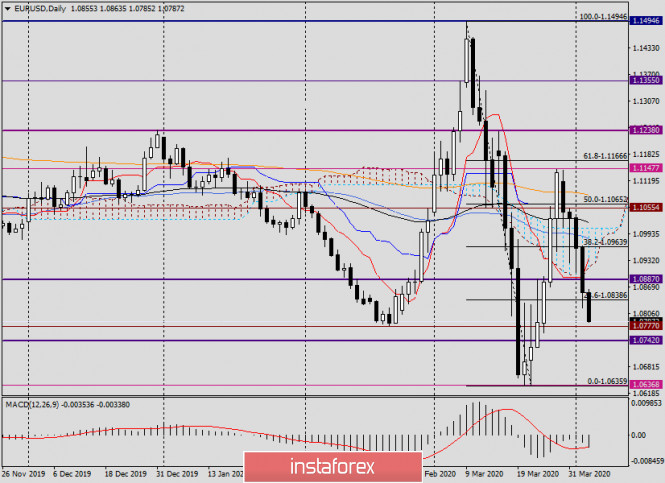
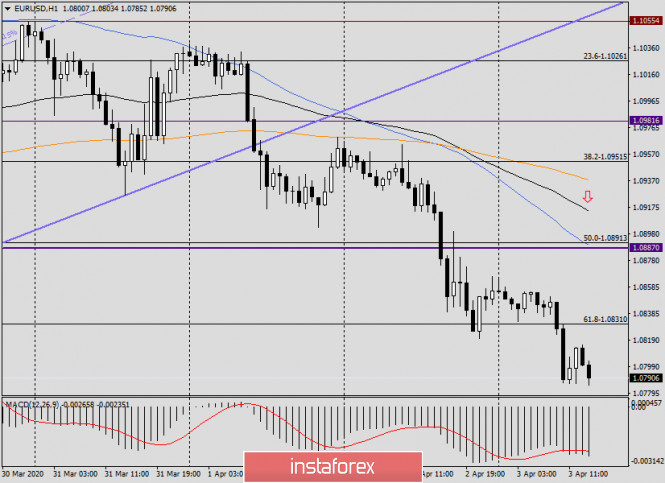
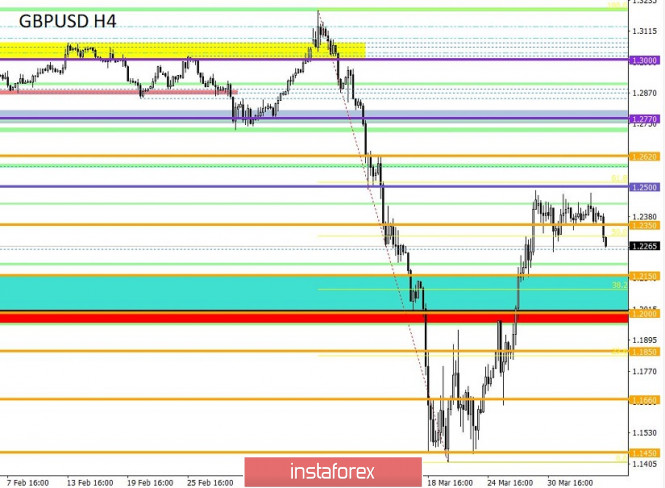
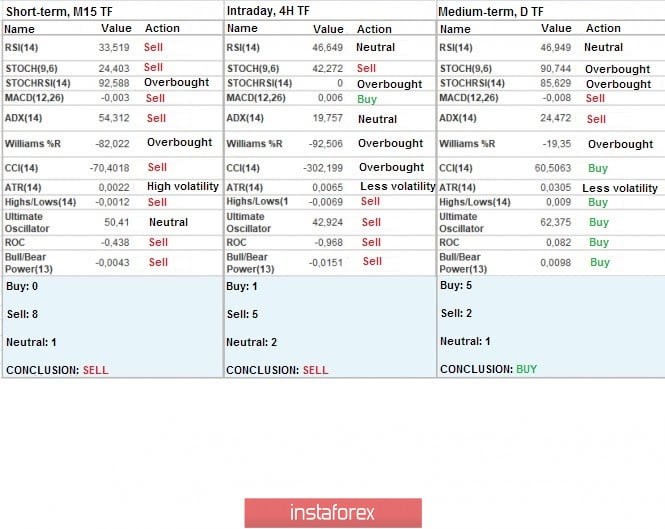
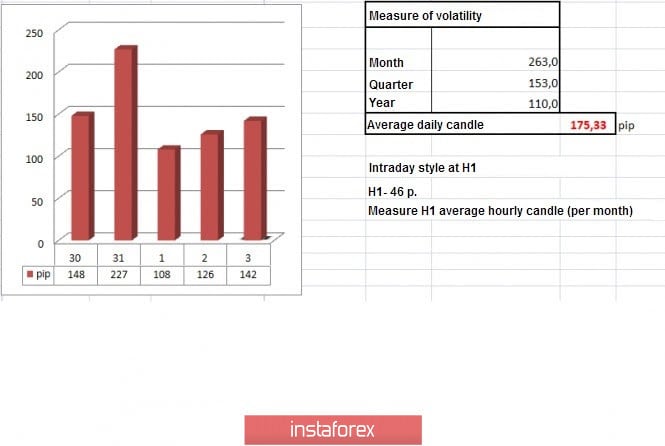
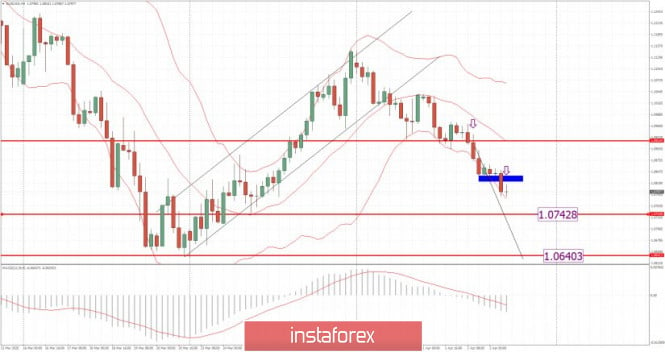


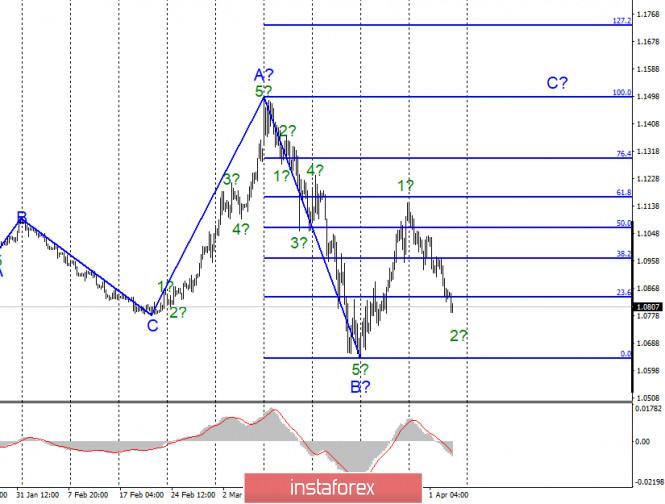
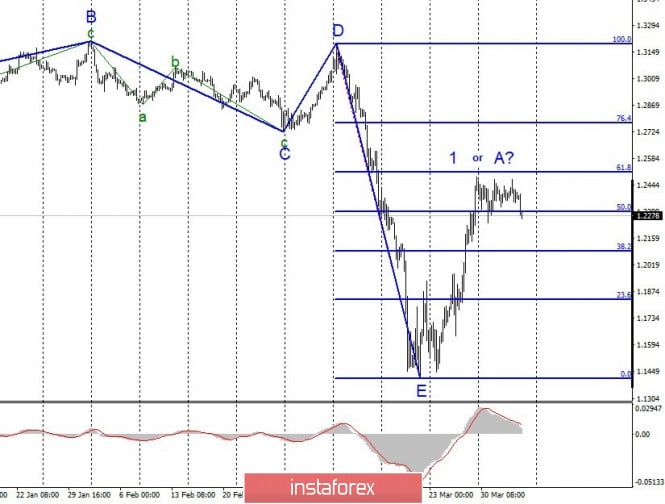
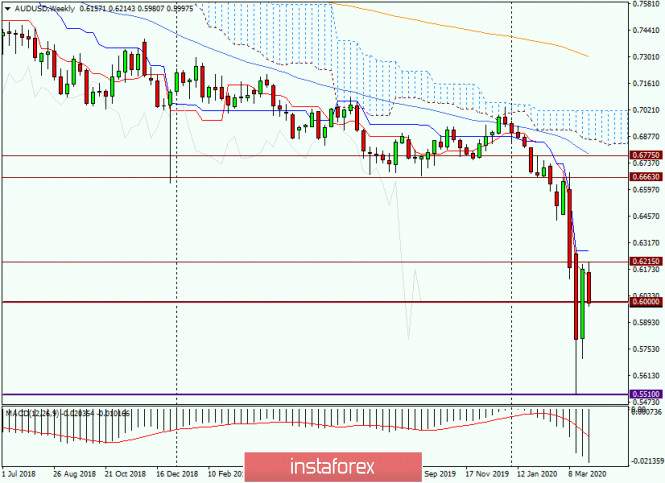
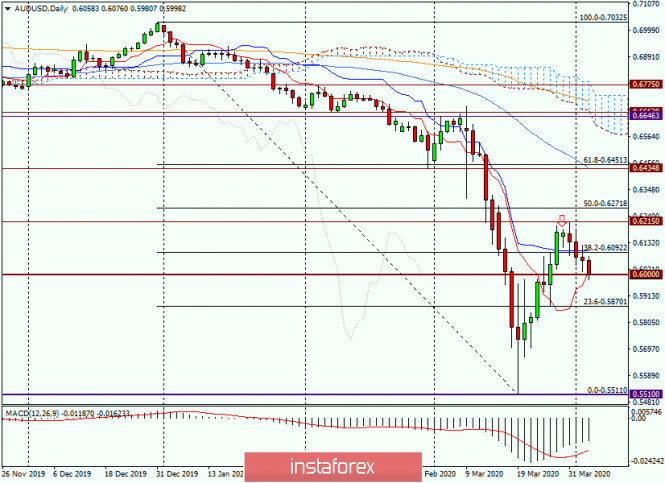
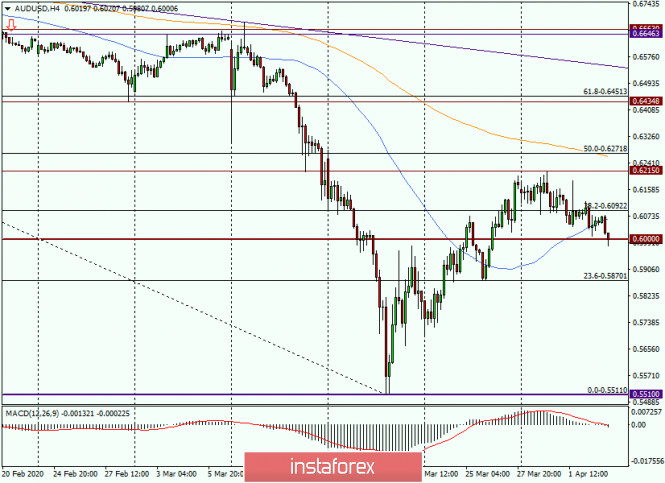
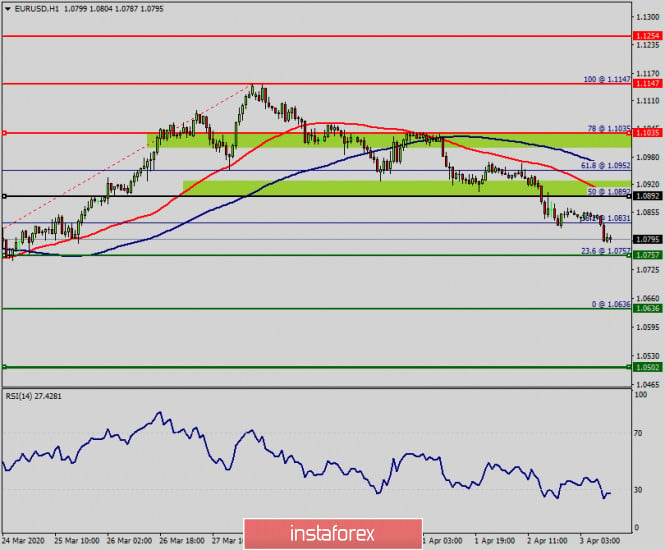
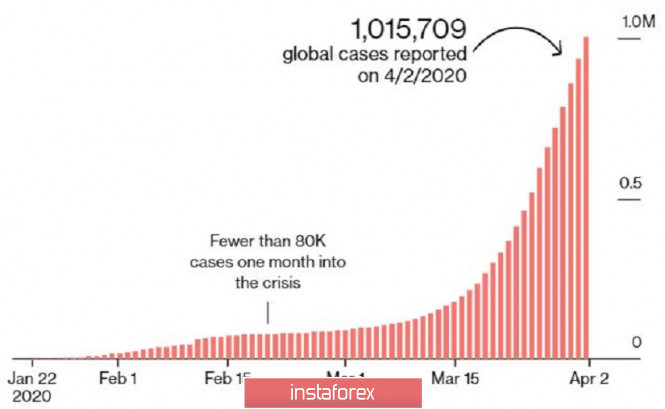
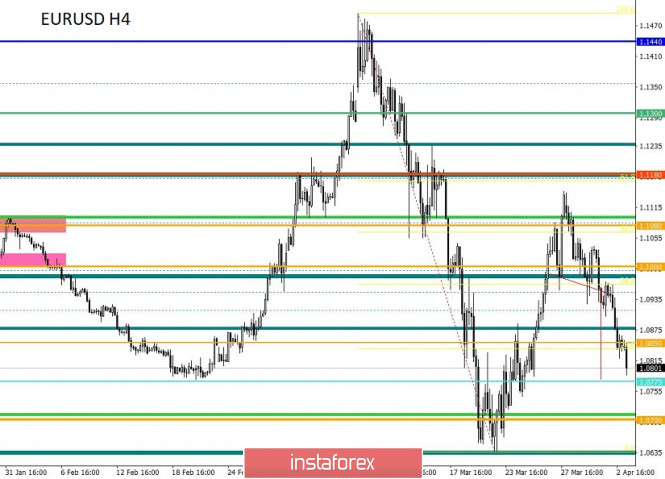
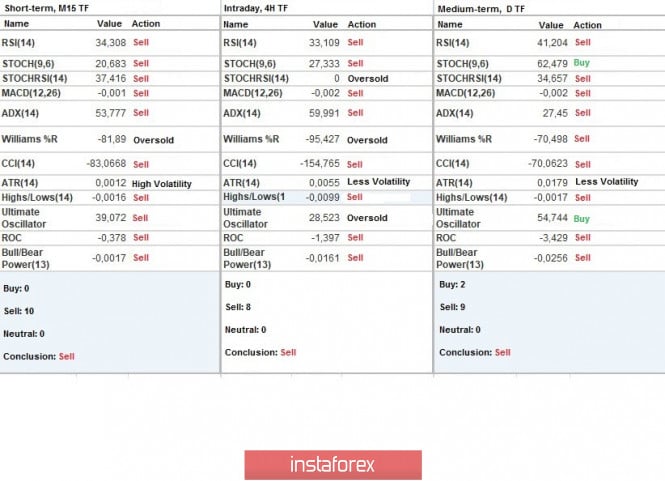
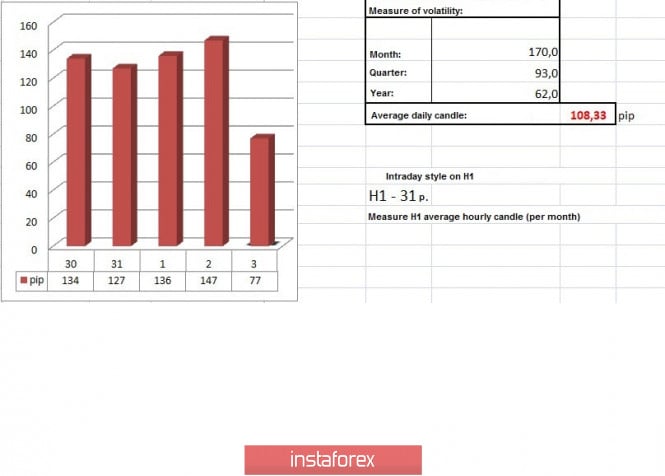
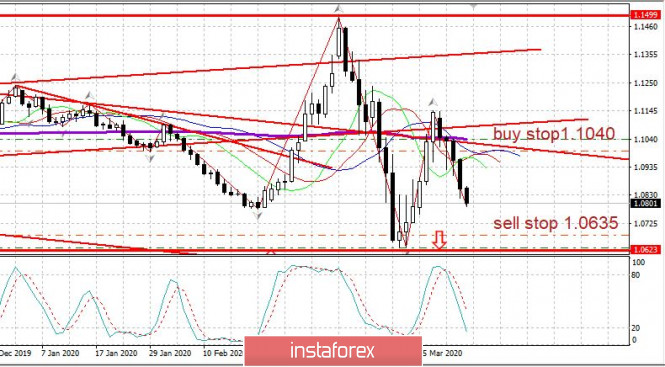

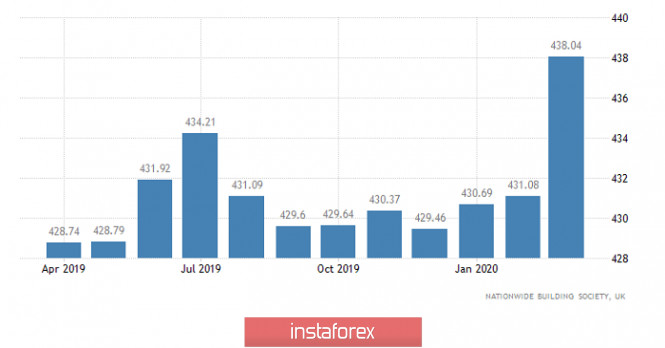
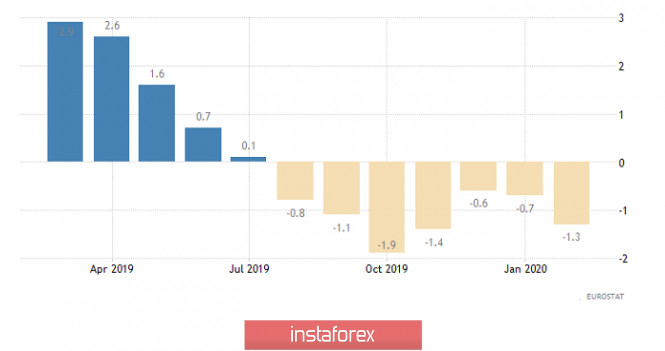
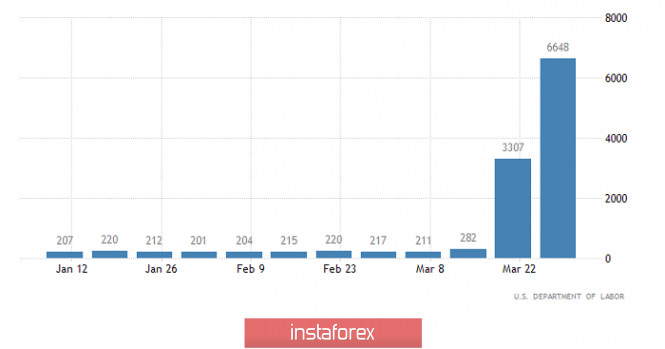
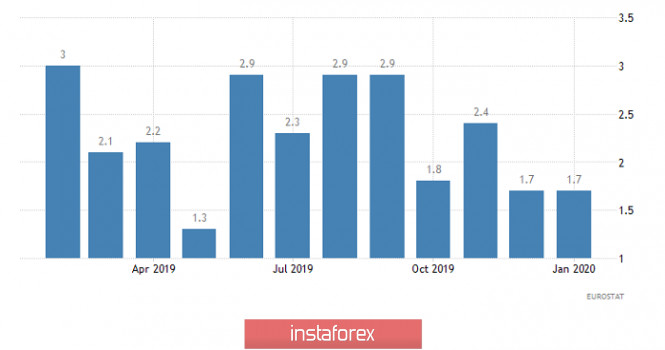
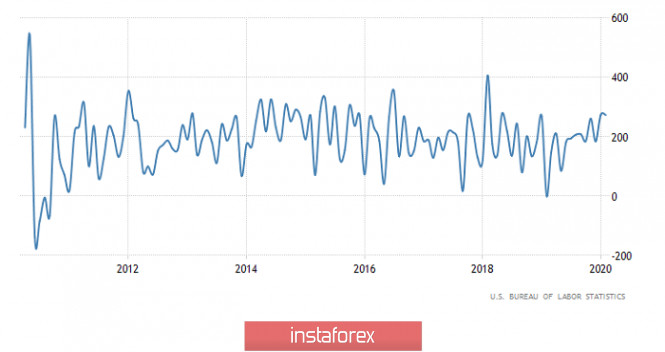
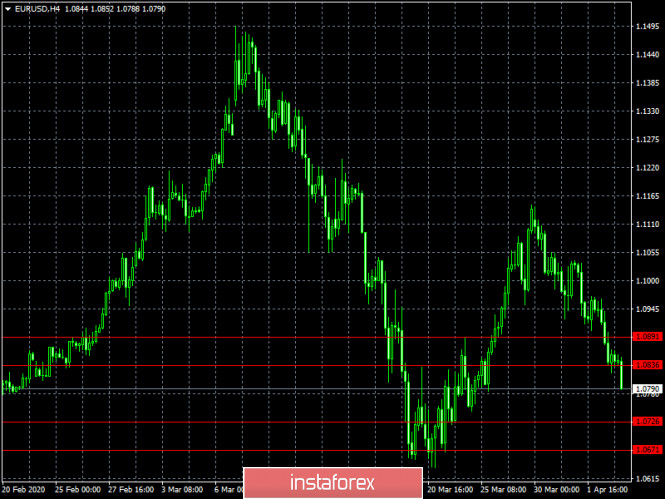
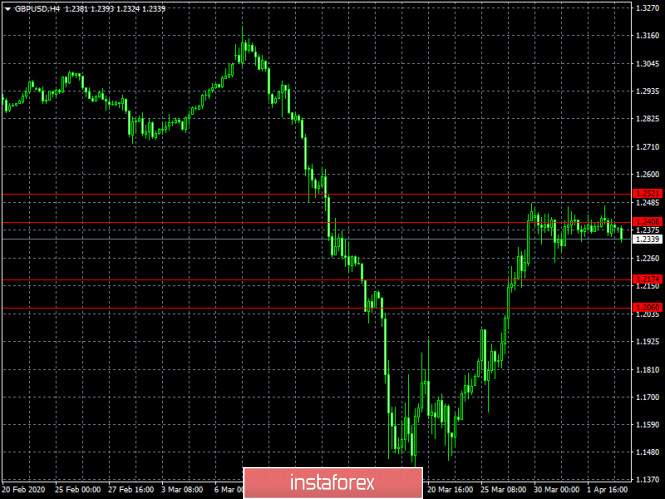
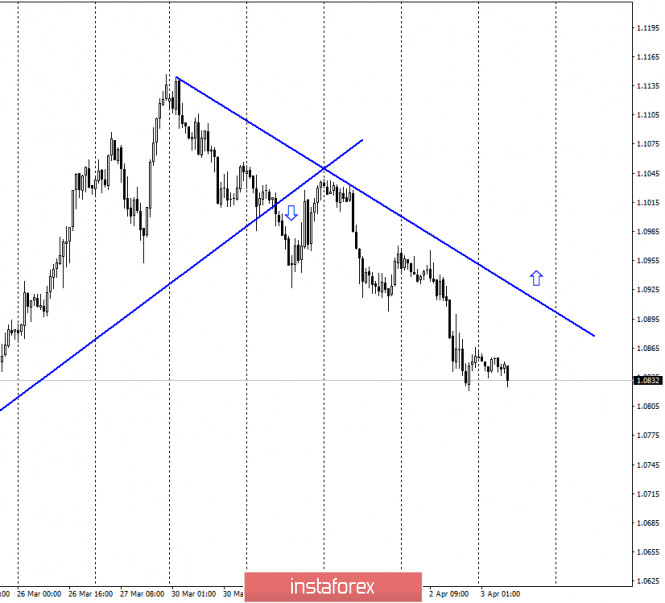
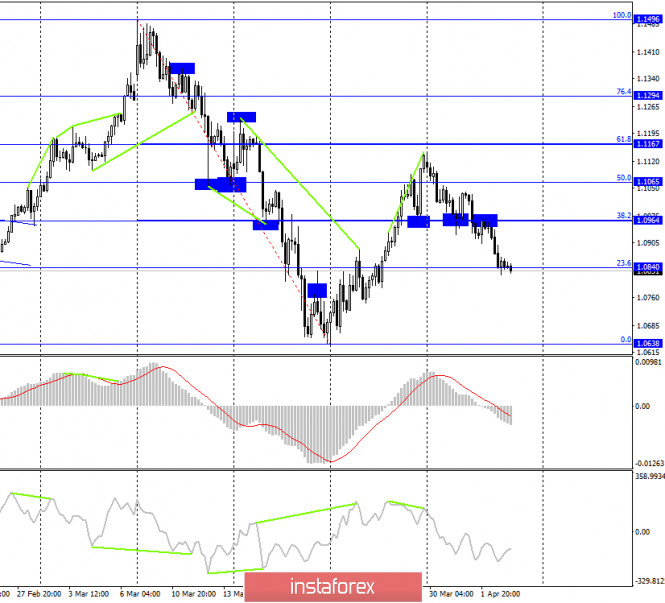
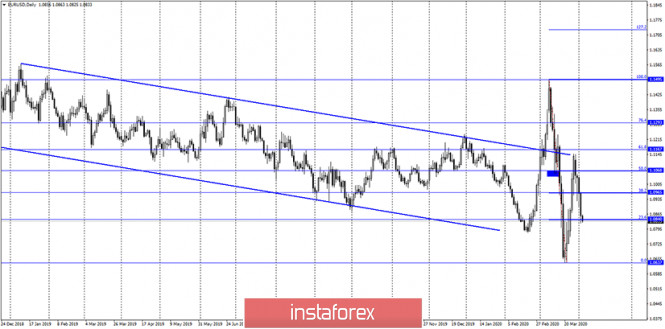
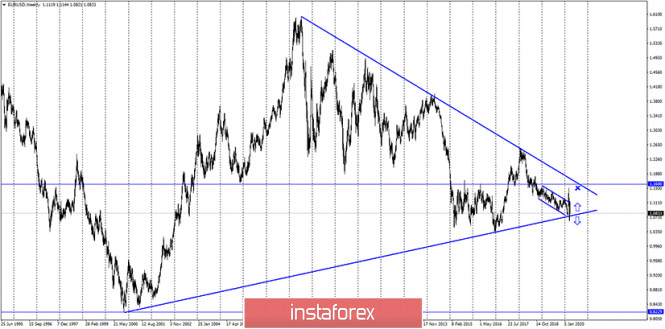
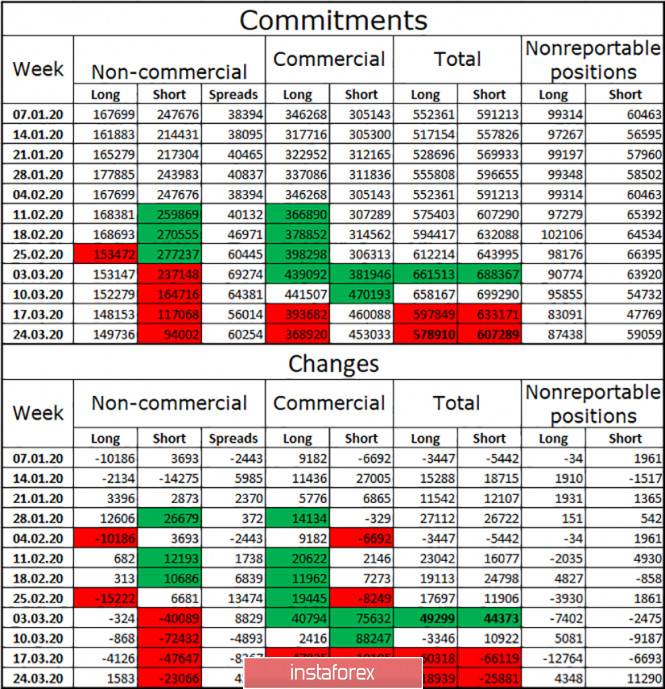
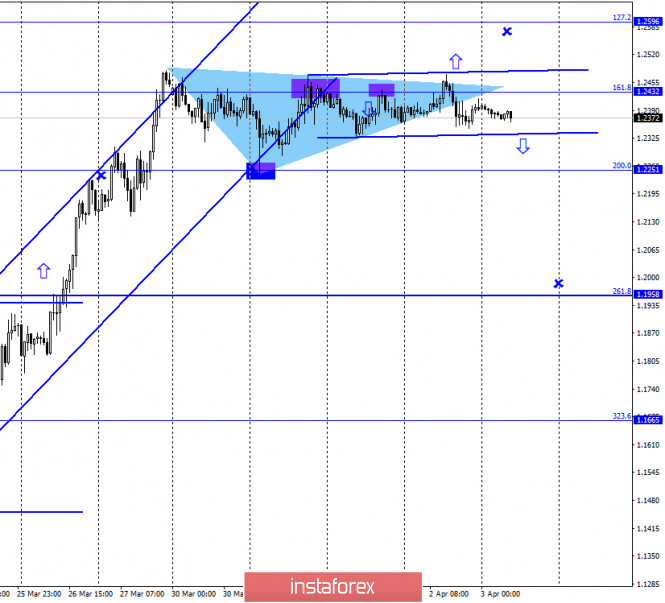
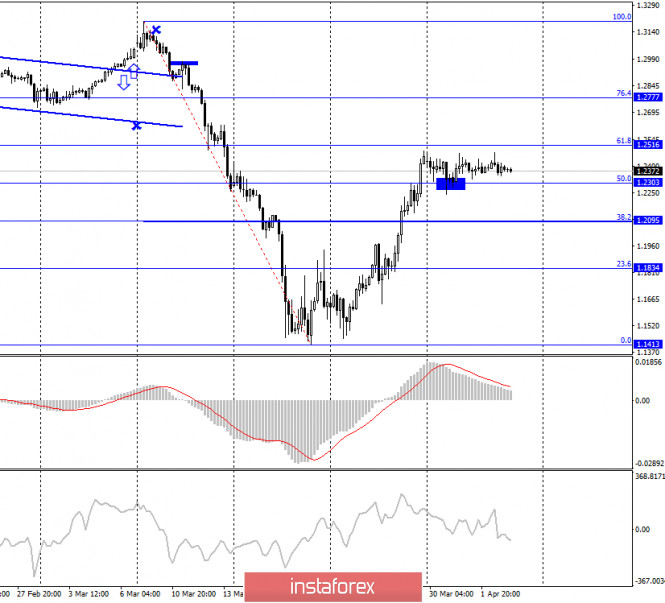
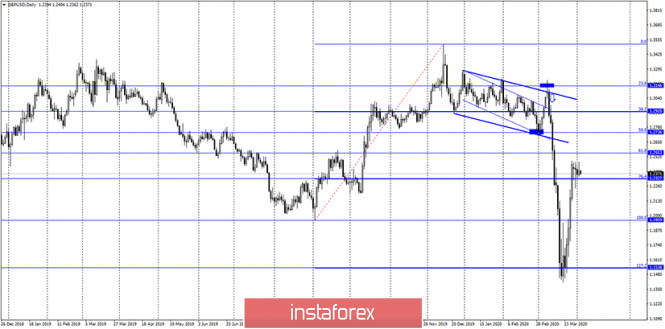
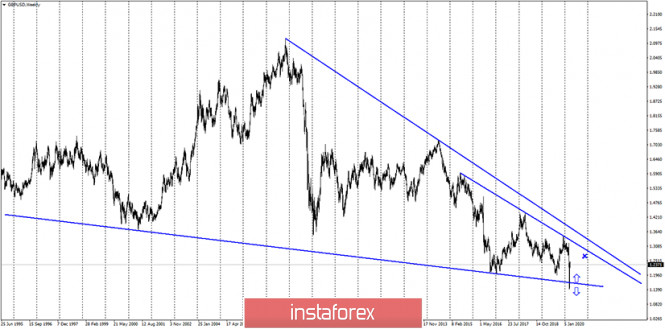
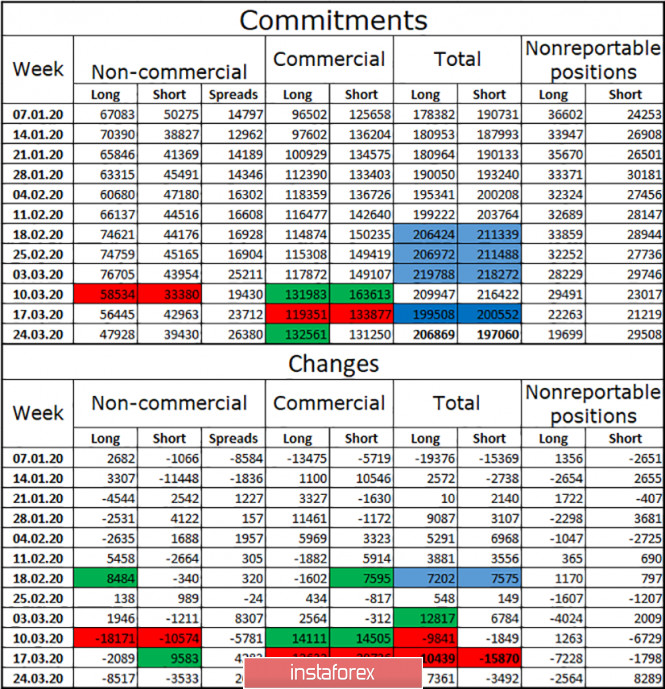

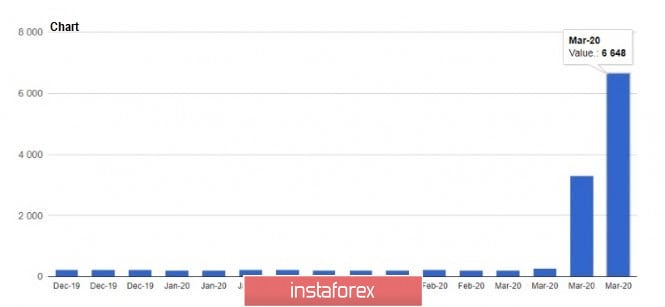

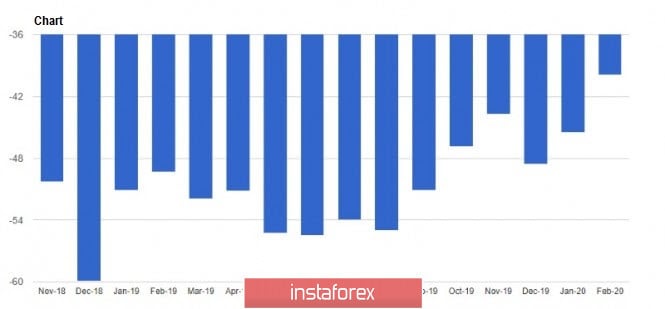
| You are subscribed to email updates from Forex analysis review. To stop receiving these emails, you may unsubscribe now. | Email delivery powered by Google |
| Google, 1600 Amphitheatre Parkway, Mountain View, CA 94043, United States | |
No comments:
Post a Comment